
Abstract
Laboratory-scale research had shown the potential of using cotton burr/stem (CBS) as fiber filler in thermoplastic composites. This study evaluates the potential of using waste materials from cotton harvesting/ginning operations, CBS and cotton module wraps (CMWs), as a filler and substrate in thermoplastic composites at commercial scale. The study also compares the effect of scale-up from laboratory to commercial scale on the properties of the thermoplastic composite materials. Two separate commercial trials were conducted to manufacture thermoplastic composite boards with (a) 0, 12.5, 25 and 37.5% by weight of CBS and (b) up to 30% by weight of CMW. Testing of these samples showed that commercial-scale samples with 12.5% CBS had all properties comparable to those made with wood filler. At higher substitution rates, CBS tended to increase water absorption and coefficient of thermal expansion, and increase nail-holding capacity (NHC) and hardness in commercial-scale samples. This study also showed that CMW can be substituted by up to 30% by weight without deterioration of properties in comparison with a commercially available product. Scaling of the process had significant influence on all properties tested, expect NHC. In general, all commercial-scale samples exhibited physicomechanical properties within the range of properties reported for commercially available wood–plastic composite decking materials.
Introduction
Thermoplastic composites reinforced with natural fibers offer a durable alternative for wood for nonstructural building materials subjected to harsh environments. Wood is the most commonly used fiber filler in commercially available thermoplastic composites. Many studies have explored other natural fibers such as rice straw, cane bagasse, sisal, jute, and so on, for potential application as fiber fillers in polymer composites. 1 –5 With the ongoing focus on biomass energy, slump in the building industry and outsourcing of furniture industry, the United States is facing a growing shortage of wood fibers of acceptable quality. Conversely, the vast agriculture industry in the United States produces large quantities of lignocellulosic waste streams that often burden the environment during storage and disposal. Some of these lignocellulosic fibers can impart desirable properties to composites such as better dimensional stability and low specific gravity (SG). 5,6 Therefore, utilization of the lignocellulosic fibers from agricultural waste streams can benefit the environment because of the recyclability of thermoplastic composites. It will benefit the thermoplastic composite and agricultural industries by: providing inexpensive raw materials, by adding value to waste streams and by offering durable and recyclable products to the building industry. Commercial acceptance of these new raw materials can readily occur if their potential can be validated on a commercial scale.
Cotton is a fiber crop produced primarily in the southern part of the United States called the Cotton Belt. New cotton harvesters bale field harvested cotton (seed cotton) into round modules wrapped in agricultural films called cotton module wrap (CMW) to protect it from the elements. The CMW is a linear low-density polyethylene (LLDPE) film that is removed at the gins where the cotton fiber is separated from the seed cotton. The CMW is discarded at this stage where it could become an environmental burden if not recycled. The seed cotton in the round module is processed in cotton gins to remove the high quality cotton fibers called lint. The ginning process generates a waste stream called cotton gin waste (CGW) that contains cotton burrs or carpels, stems, leaves, motes, small seeds and some dirt. Depending on the method of harvest, approximately 18–65% of the harvested cotton may be removed as CGW during ginning, and this could amount to 2.26 million tons a year. 7 Since the annual seed cotton production varied from 4.15 to 7.35 million tons in the last 5 years, 8 the approximate amount of CGW generated would have been somewhere in the range of 0.73–4.74 million tons. Approximately 40–70% of the CGW is made of cotton burrs/stems (CBSs), with an additional 10–11% of motes or short fibers. 9 During the ginning process, the CBS fraction can be easily separated from the rest of the waste stream if it is collected at the extractor. 10
Past research at the laboratory scale has shown that CBS holds great potential as a fiber filler in thermoplastic composites
5,6
and composition boards.
11
Based on a laboratory study, Bajwa et al.
6
indicated that the wood fiber in thermoplastic composites can be replaced by CBS by up to 50% without significant deterioration in mechanical and physical properties important for outdoor nonstructural building applications. Water absorption (WA) and thickness swelling (TS) were the major problems caused by the addition of CBS in greater percentages. This laboratory study used a laboratory-scale extruder to manufacture sample profiles of approximately 32 × 7.6 mm2. The laboratory-scale manufacturing also suffered from mixing problems when the CBS contained over 2% of motes or short lint fibers. Usually, commercial extruders have longer barrels that ensure better mixing and operate at higher pressures. Also, some commercial manufacturers use a kinetic mixer before extrusion process to ensure better mixing. Therefore, it is natural to see some differences between the commercial- and laboratory-scale samples. From a commercialization perspective, it is important to study the viability of CBS and CMW at commercial scale. Therefore, the objectives of this study are set as follows: Evaluate the potential of CBS as fiber filler in thermoplastic composite through commercial-scale manufacturing and material analysis. Evaluate the potential of CMW for partial substitution as a substrate in thermoplastic composite at commercial scale. Compare the properties of laboratory-scale samples to commercial-scale samples to understand the influence of manufacturing scale up on product property.
Material and methods
Design of experiment and sample testing
Initially, two laboratory experiments (experiments 1 and 3) were conducted at the University of Arkansas to evaluate CBS and CMS at laboratory scale. The laboratory experiments were followed by two commercial-scale experiments (experiments 2 and 4) at the Greenland Composites Inc. (GC) manufacturing facility in Greenland, Arkansas, to evaluate CBS and CMW as raw materials in thermoplastic composites. The results from the laboratory-scale evaluation of CBS were reported by Bajwa et al. 6 In addition to evaluating the two raw materials, the experiments were also used to compare the influence of manufacturing scale on the physical and mechanical properties of composite materials.
Experiments 1 and 2 studied the impact of replacing white oak fiber (WOF) with different levels of CBS on the properties of the composites. Experiments 3 and 4 evaluated the feasibility of using CMW as a plastic substrate at different substitution levels. The experiments 1 and 3 were laboratory-scale experiments designed as completely randomized block designs with three blocks, where replications were used as blocks, with each run randomized within the block. The commercial-scale experiments were replicated in time. The two CBS experiments 1 and 2 (laboratory and commercial scales) used four fiber filler compositions of WOF and CBS as treatments. These four treatments were WOF:CBS ratios of 1:0, 3:1, 1:1 and 1:3 by weight (Table 1). The percentage of CBS in the composite samples corresponding to the above four treatments were 0, 12.5, 25 and 37.5% by weight of the composite sample.
Composition of natural fiber reinforced thermoplastic composites used in the study, expressed as a percentage of the total dry weight.
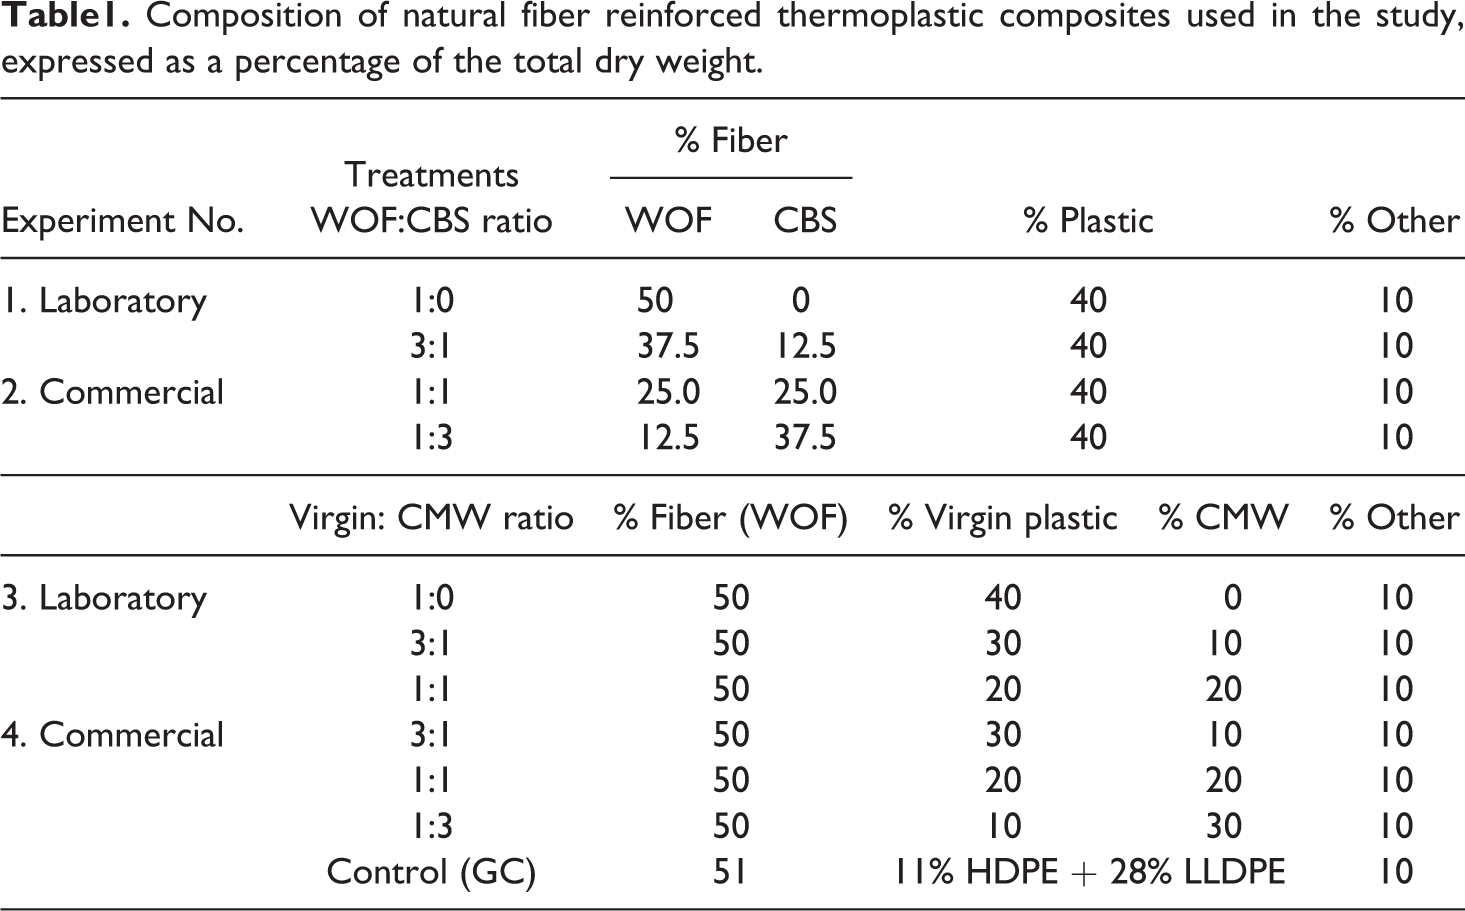
Experiments 3 and 4 (CMW experiments) had 3 and 4 treatments, respectively. The 3 treatments in the laboratory-scale CMW experiment (experiment 3) used 0, 10 and 20% CMW, respectively, resulting virgin HDPE:CMW ratios of 1:0, 3:1, 1:1 and 1:3 by weight. It was harder to run higher percentages of CMW in the laboratory-scale extruder because of feeding problems due to the bulkiness of shredded CMW. The CMW treatments at commercial scale included virgin HDPE:CMW ratios of 3:1, 1:1 and 1:3 by weight, as well as a control that was one of the commercially available composite material formulation from GC. The first three treatments corresponded to using CMW at the rate of 10, 20 and 30% of the total weight of the composite (Table 1). The commercial extruder was not setup to run on all virgin plastic. Both the CMW experiments used WOF fiber filler at 50% with no CBS.
Sample manufacturing
All fiber fillers were initially ground to a size distribution of 60–20 µm size using a hammer mill. The ground fibers were dried to a moisture content of 7–8% and bagged until extrusion. The bagged fiber fillers were again dried in a commercial drier to a moisture content of <1%. The CBS required more drying time than wood as it retained approximately 3.5% moisture under similar drying time compared with <1% moisture content in WOF. The formulations used for all composite samples included 40% polyethylene, 50% fiber filler, 4% mineral filler and 6% lubricant.
Laboratory samples were extruded in a laboratory-scale twin-screw extruder with counter-rotating screws and an L:D ratio of 25. The laboratory extruder used a die profile of 31.7 × 6.3 mm2 size. The ingredients for each sample were weighted in the preset proportion to get a total weight of 800 g, hand mixed in a tub and gravity fed to the extruder. The extruder had four barrel zones with individual temperature controls. The final temperature profile used was 160°C (320°F), 149°C (300°F), 149°C and 135°C (275°F) for barrel zones 1 through 4, respectively. The die temperature was set at 149°C (300°F). The extruded samples were water cooled and cut into 110–125 cm sections.
Commercial samples were manufactured using the extrusion setup available at GC, which involved high-speed kinetic mixer called densifier and a single-screw extruder with an L:D ratio of 24, acting as a mixer and pump. In the commercial experiment, samples were extruded with a die profile of 144 × 25 mm2, which is the standard decking profile. The ingredients for each treatment were initially weighed in the required proportion to create a batch and transferred into the densifier for mixing and compounding. The compounding cycle was set at 300 s. The melt pressure varied from 1.6 to 3 MPa for various treatments, with a corresponding melt temperature range of 159–174°C. The compounded material was transferred to a cooling rotary drum for 180 s to reduce the temperature of compounded material so it can flow freely in the feed hopper. The compounded and cooled product was augured to a feed hopper and directly fed into the feed throat of the single-screw extruder at a constant rate using a metering system. The temperature of compounded material fed into the extruder was maintained between 121 and 126°C (250–260°F).
The commercial single-screw extruder comprised six heating zones maintained at temperatures ranging from 121 to 149°C (250–300°F) and two profile die heating zones maintained at a temperature range of 163–177°C (325–350°F). The head pressure of the extruder ranged between 3.8 and 4.5 MPa (550–650 lbf/in 2 ). The extruded profile was water cooled in the calibrator section as well as in the cooling tanks by spraying chilled water. The samples were extruded into rectangular cross-sectional profiles of approximately 150 × 26 mm2, water cooled and then cut into 102-cm-long pieces by an automatic saw for further testing and evaluation.
Sample testing
The extruded samples from laboratory and commercial trials were conditioned at room temperature for a minimum of 2–3 months before testing. The test sample coupons were cut from the extruded samples and tested as instructed in the specific ASTM standard (Table 2). The samples were tested for physical and mechanical properties that are relevant to nonstructural building applications including SG, WA, TS, coefficient of linear thermal expansion (CLTE), flexural strength and modulus, compressive strength, hardness and nail-holding capacity (NHC).
Testing standards followed to evaluate physical and mechanical properties of wood–plastic composite.
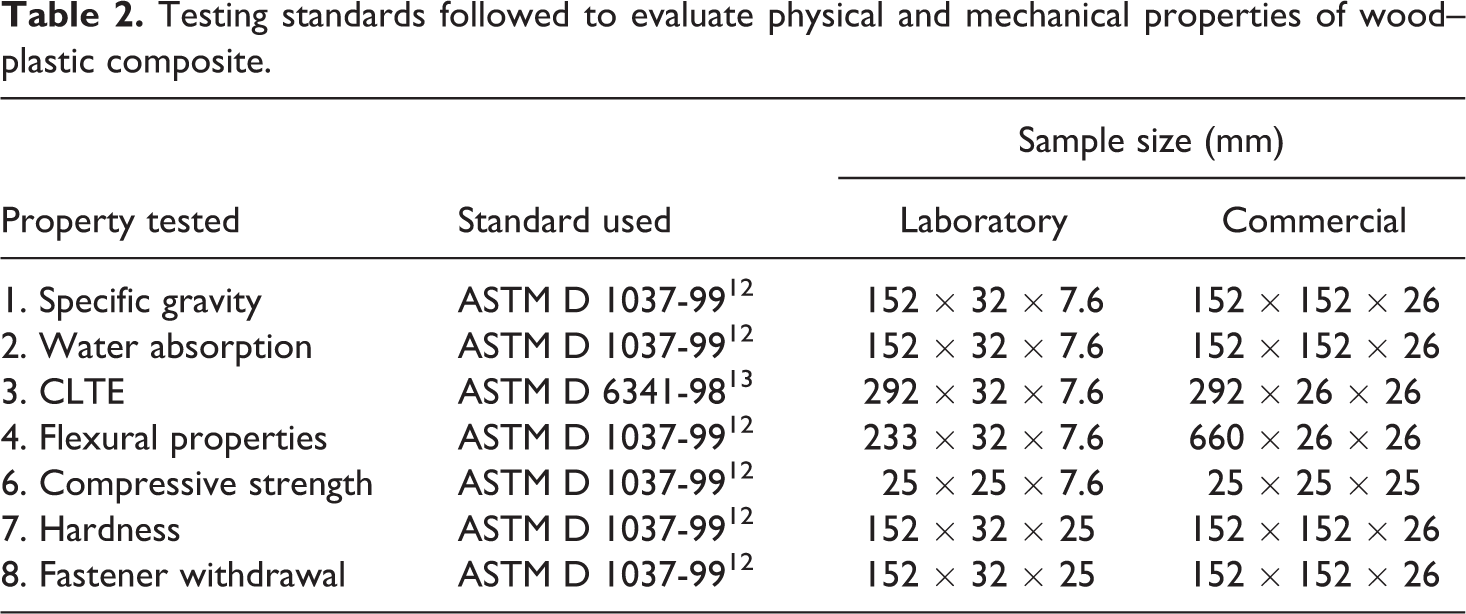
The WA test was continued until the weight of the sample stabilized for at least 24 h. For the four experiments in this study, the WA test lasted for 10–13 days, with the sample weight recorded approximately every 24 h. The standard specifies to report the 24-h WA. However, this study reports the 24-h WA as well as the 10-day WAs at a room temperature of ∼19°C. For CLTE measurement, commercial sample coupons with 25.4 × 25.4 mm2 cross-sectional size and 292 mm length were used. The samples were subjected to a low temperature of −7.8°C for 48 h, followed by 48 h in an oven at 60°C, and the change in the linear dimensions were recorded at predetermined points. Flexural properties of the composite samples were determined using an Instron universal testing machine with a three point bending configuration based on the ASTM standard D1037-9912 test method. For testing, hardness and fastener withdrawal resistance on laboratory-scale samples, 152-mm-long samples were glued together with a polyurethane glue, as specified in ASTM D 1037-99. 12 The mechanical and physical properties of the samples from different treatments under each experiment were compared using Student’s t test to understand the effect of treatment.
Results and discussion
Surface appearance
Once the extruder settings were optimized for the CBS fiber, the commercial- and laboratory-scale composite samples showed good smooth surface appearance free from edge tear, shark skin, blisters and pits (Figure 1). Overall, the surface appearance of the laboratory samples was comparable to the commercial samples, and CBS samples were comparable to the control containing only wood fibers. Both sets of samples appeared light brown in color for WOF to dark brown with increasing amount of CBS. The laboratory-scale samples containing CMW had a cyan hue due to the cyan pigment that was in the module wrap. Otherwise, both commercial- and laboratory-scale CMW samples had smooth surface appearance.
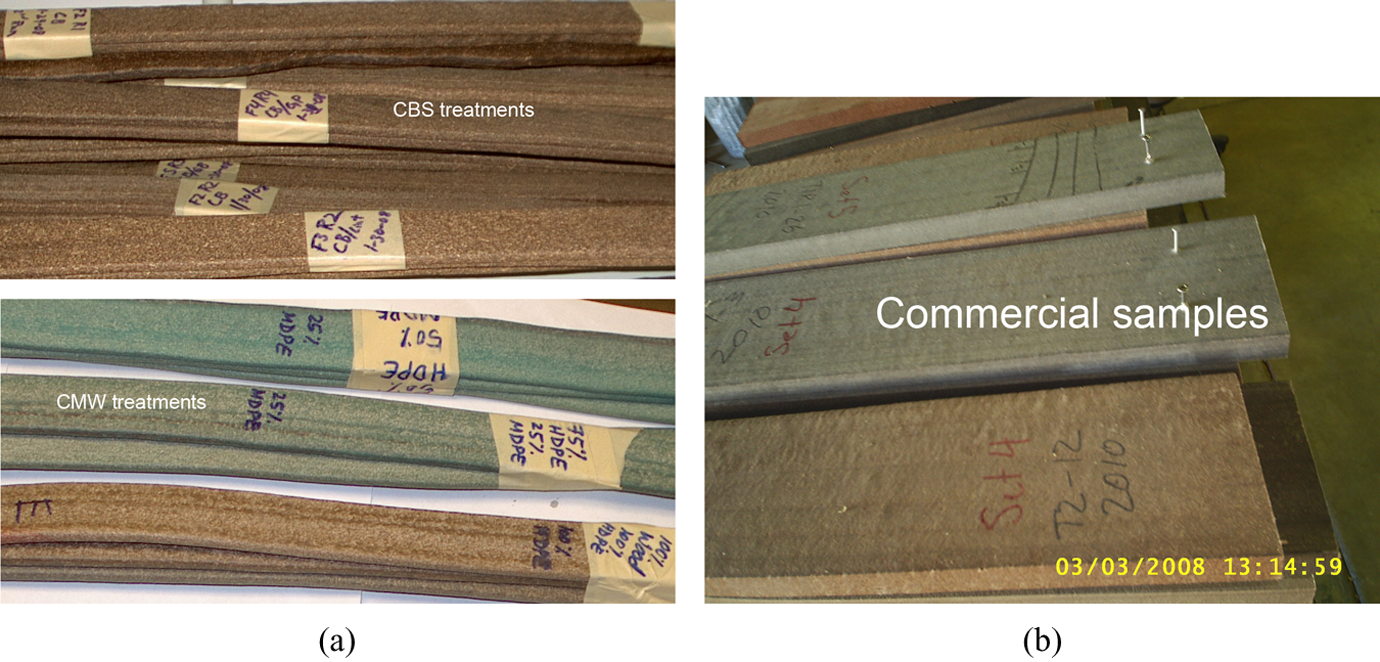
Surface appearance of samples from (a) various laboratory-scale CBS treatments and (b) commercial-scale CBS treatments. CBS: cotton burr/stem.
Properties of laboratory-scale samples with CBS treatments
All the CBS samples manufactured at laboratory scale exhibited SG close to unity, with the treatment means varying from 0.96 to 1.01 (Figure 2). However, the SG of composite samples with 12.5% CBS was significantly lower than that exhibited by all other samples (Table 3). Although CBS fibers have low bulk density, the reason for the lower SG at 12.5% fiber substitution is not quite clear.
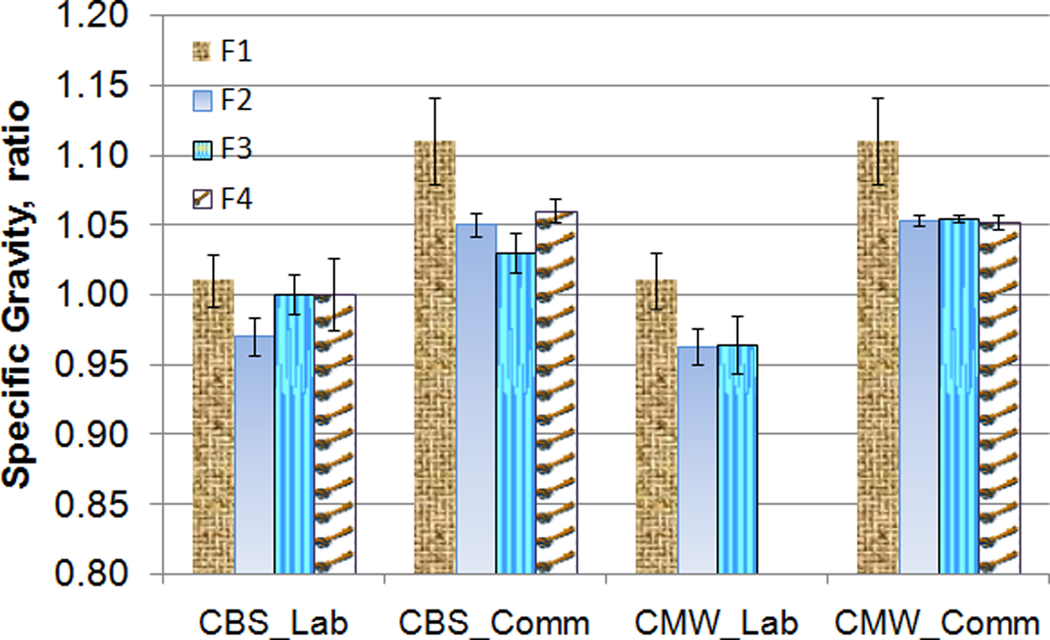
Specific gravity of composites from the four experiments with CBS and CMW at laboratory and commercial scales. The error bars indicate SD. The treatments F1 through F4 represent 0, 12.5, 25 and 37.5% by weight of CBS fiber in CBS_Lab and CBS_Comm experiments as well as 10, 20 and 30% by weight of CMW and GC in CMW laboratory and commercial experiments. CBS: cotton burr/stem; CMW: cotton module wraps; GC: Greenland Composites Inc.
Physical and mechanical properties of thermoplastic composites samples manufactured at laboratory (experiment 1) and commercial (experiment 2) scales with different amount of CBs.a
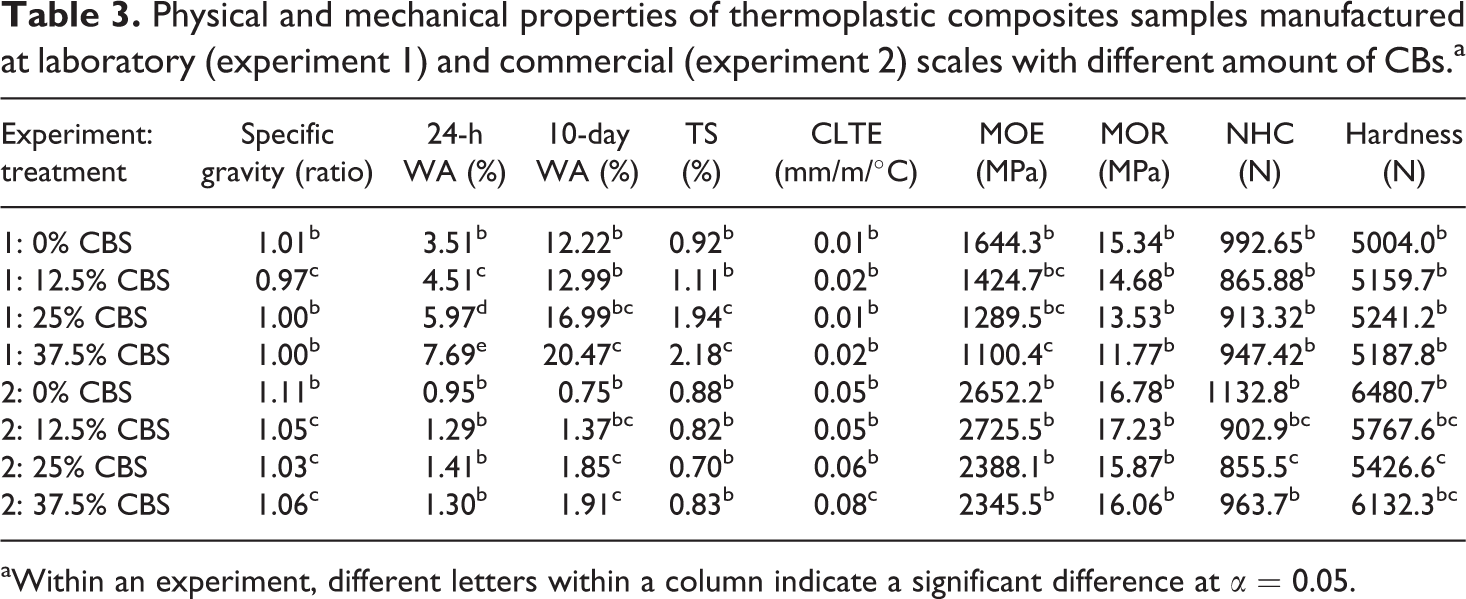
aWithin an experiment, different letters within a column indicate a significant difference at α = 0.05.
Both the 24-h WA of the composite samples at laboratory-scale increased as the amount of CBS in the matrix increased (Table 3). However, the long-term (10-day) WA of the first three treatments containing 0–25% by weight of CBS was similar. Only the 37.5% CBS treatment showed a significantly higher 10-day WA compared with control.
The average long-term WA of laboratory-scale samples for each treatment showed a linear trend with respect to square root of time, which indicate adherence to Fickian diffusion (Figure 3). The slope of the WA curve seems to increase slightly at the beginning of WA, as the amount of CBS in the composite increased, indicating an increased rate of WA. The lower bulk density and higher WA capacity of CBS fibers 5 compared with oak fiber can be attributed to the higher WA characteristics of composite samples containing larger amounts of CBS.

Average long-term (12–13 days) water absorption of composite samples containing various quantities of CBS manufactured at (a) laboratory and (b) commercial scales, plotted against square root of time. CBS: cotton burr/stem.
The TS and CLTE are two measures indicating dimensional stability of composites. TS is caused by the swelling of the lignocellulosic fibers when they absorb water. The wetting and drying process of the composites and the subsequent swelling and shrinking can cause problems in holding fasteners and encourage microbial degradation. The 12.5% CBS samples exhibited very low TS similar to the control when exposed to water (Table 3). However, the TS of samples containing 25 and 37.5% CBS were significantly higher than the other two treatments. Similar to TS, the thermal expansion also caused problems with fastener holding. While TS is caused by fibers, thermal expansion is caused by the plastic substrate. All four treatments showed similar CLTE, in the range of 0.01–0.02 mm/m/°C.
The mechanical properties of the composite treatments, including modulus of rupture (MOR) or flexural strength, flexural modulus of elasticity (MOE), hardness and nail-withdrawal capacity were all very comparable for all four treatments (Table 3). The only exception was that the 37.5% CBS treatment showed a significantly lower MOR, also called flexural strength, compared with the control containing WOF.
Properties of commercial-scale composite samples with CBS treatments
All commercial-scale samples exhibited SGs well over unity (Table 3). The control treatment showed an average SG of 1.11, which was significantly higher than the other treatments with average SGs of 1.06–1.03 as the amount of CBS content increased from 12.5–37.5% by weight. Therefore, it can be stated that the CBS fiber is a desirable partial filler for applications where low SG is important.
The 24-h WA, TS, MOR and flexural modulus of samples containing CBS fibers were similar to that of control (Table 3). This is an interesting result since CBS fibers have low bulk density and high moisture absorption characteristics compared with WOF. However, the kinetic mixing and the high-pressure extrusion may have ensured adequate coating of the lignocellulosic fibers, preventing direct contact with water when the composite is exposed to water. The other interesting result was that the treatment with 37.5% CBS showed higher CLTE, whereas the 25% CBS treatment showed lower NHC and hardness.
Since 24-h WA test does not indicate the extent of WA in wood–polymer composites subjected to outdoor environment and the composite material could be exposed to extended period of moisture under an outdoor application, we continued the WA study until the sample weight has stabilized for 24 h. The average 12-day WA was below 4% for all commercial-scale CBS treatments (data not shown), which was comparable with some of the commercially available wood–plastic composite materials reported by Bourne et al. 1 The average 12-day WA at 19°C varied from 2.54% for the control to 3.84% for the 25% CBS samples.
The results indicate that CBS can be used as a substitute for WOF in composite samples by up to 12.5% without compromising any of the physical or mechanical properties tested in this study. CBS can also be used up to 37.5% by weight with a slight reduction in the hardness, and small increase in the long-term WA and CLTE. CBS is also very effective in reducing the SG of the material.
Effect of manufacturing scale on CBS composite properties
The manufacturing process has a major influence on the physicomechanical properties of the composites tested in this study. The samples manufactured at commercial scale in general had higher SG, lower WA and TS as well as better strength properties (Table 4). The only property tested here that was not influenced by manufacturing scale was NHC. Irrespective of the scale of manufacturing, the addition of CBS influenced SG, long-term WA and TS. However, CBS addition at the rate of 12.5% seems to have no effect on WA, TS, CLTE and mechanical properties when compared with control. Therefore, this would be recommended level, if properties similar to control are desired.
Comparison of composite properties with respect to manufacturing scale.a
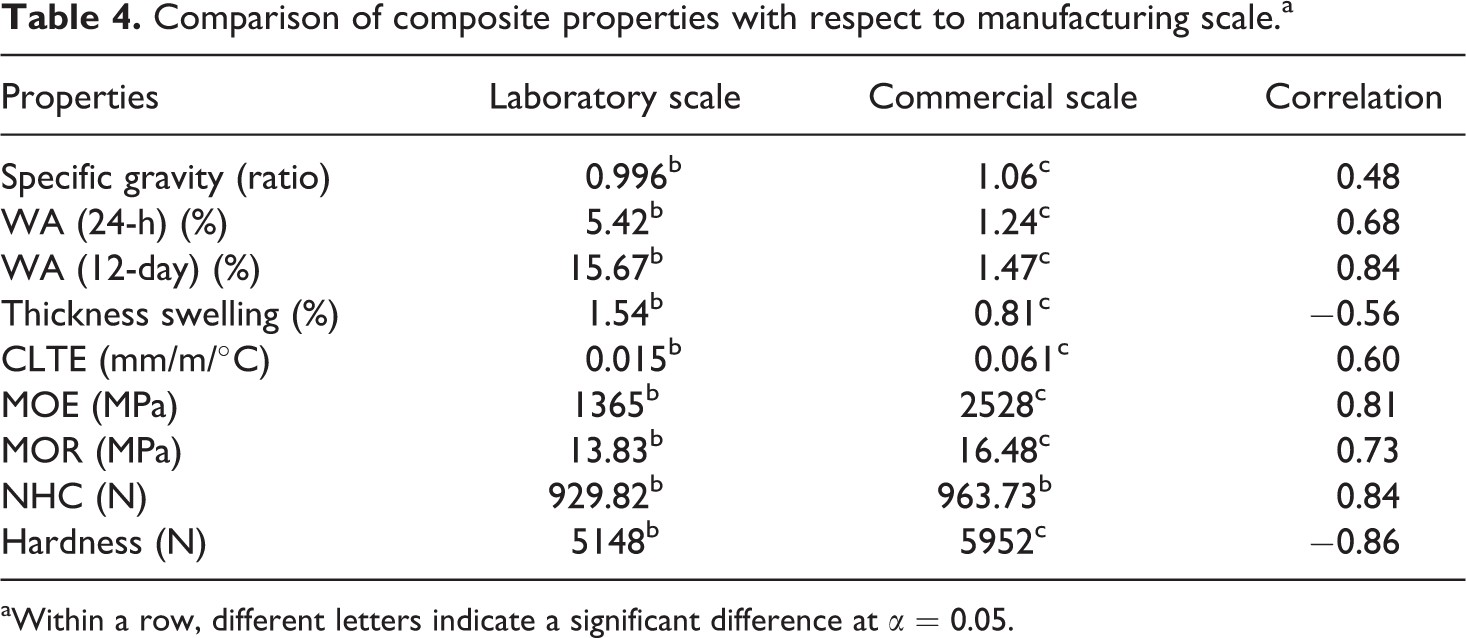
aWithin a row, different letters indicate a significant difference at α = 0.05.
The largest differences between commercial and laboratory-scale samples were observed in WA, CLTE and flexural modulus. The 24-h WA of commercial samples were less than 25% of the laboratory-scale samples, whereas the long-term (12-day) WA of the commercial-scale samples were less than 10% of the laboratory-scale samples (Table 4). Similarly, the TS and MOE of commercial samples were close to half of the laboratory-scale samples, and CLTE was only 25%. Both flexural strength and hardness also significantly increased under commercial production conditions.
The difference in properties at laboratory and commercial scales indicate that the properties of laboratory-scale samples may not be directly compared with the properties of commercial-scale samples without any scaling. A correlation analysis between the treatment means of commercial-scale samples with laboratory samples showed that the properties exhibited by the composite samples at different scales were significantly correlated. Although the data used here has limited number of observations, such significant correlation point to the fact that laboratory-scale sample can provide a good estimate of the properties at commercial scale. Most new composite materials are usually developed and tested at laboratory scale first.
A comparison of the two manufacturing processes indicate that the commercial-scale manufacturing ensured better mixing because of the addition kinetic mixing step in the manufacturing process. Commercial-scale production also incorporated a larger scale extruder with higher extrusion pressure and a longer barrel, ensuring better mixing and dense packing of the material in the extruded sample. The better packing of material at higher pressure would be the reason for the higher SG; whereas the better mixing and the even coating of the fibers resulting from such mixing may have reduced the WA and TS. Also, even coating and uniform mixing of the fibers with the plastic would enhance the bonding between the fibers and the substrate improving the strengths.
Properties of laboratory-scale composite samples under CMW treatments
Testing of samples from experiment 3 (laboratory-scale CMW) containing different levels of CMW indicated that the SG, 24-h WA and CLTE were similar to that of control containing no CMW (Figure 2 and Table 5). The addition of CMW increased TS by 40–51% and CLTE by 100%. The increase in TS while WA stayed constant is an interesting result. Typically, TS follows the same trend as WA since WA is the reason for TS. The increase in CLTE of samples containing CMW is understandable since it is an LLDPE with a melt flow index of 3.9 g/10 min when compared with 0.5 g/10 min of the HDPE used. Also, all the mechanical properties tested in this study deteriorated when CMW was introduced as a partial substitute for virgin HDPE at laboratory scale. The increase in CLTE is understandable since CMW is an LLDPE film that is more stretchable and exhibit higher thermal expansion than HDPE.
Physical and mechanical properties of thermoplastic composite samples manufactured with CMW as a partial substitute at both laboratory scale (experiment. 3) and commercial scale (experiment 4).a
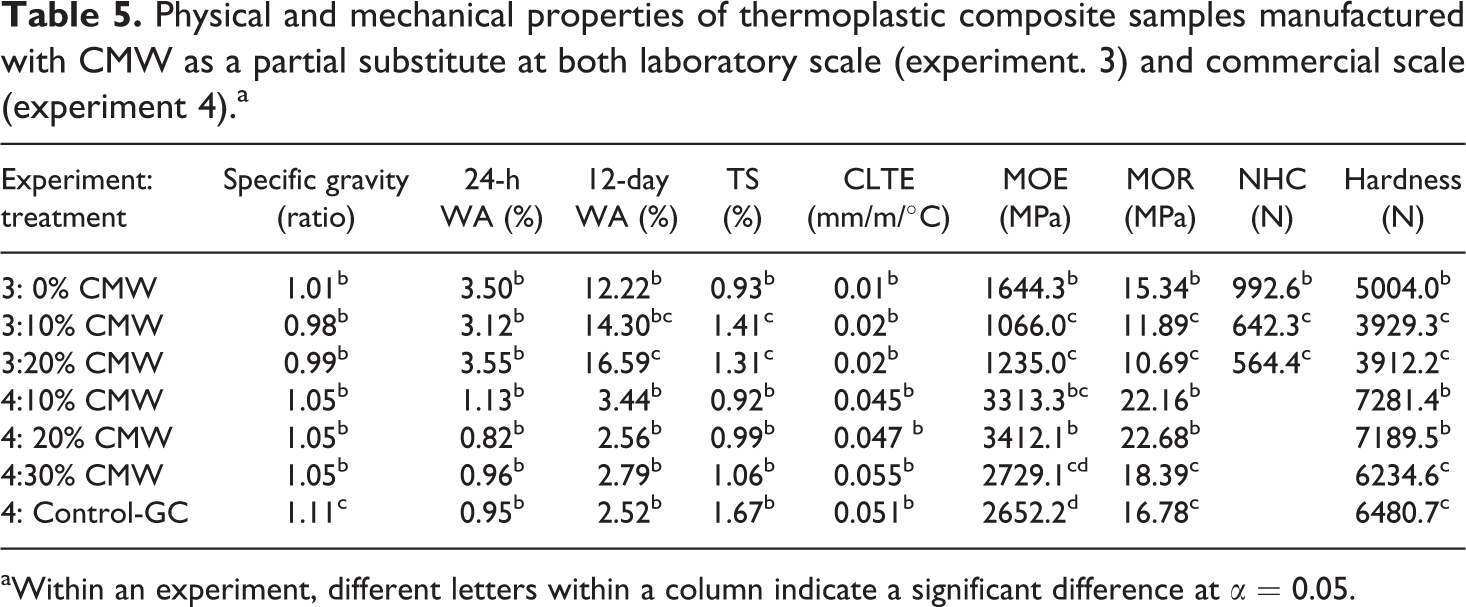
aWithin an experiment, different letters within a column indicate a significant difference at α = 0.05.
The strength properties of the composite samples containing CMW were significantly lower than that of the control at laboratory scale (Table 5). The MOE decreased by 25–35%, MOR by 22–30%, NHC by 35–43% and hardness by 21–22%. These significant reductions in strength properties are understandable as LLDPE is a relatively lower strength plastic compared with virgin HDPE. Additionally, reprocessing of the CMW may have caused breaking down of the longer chain molecular structure into shorter chains, causing further deterioration of the strength.
Although there was no significant difference in the 24-h WA of CMW treatments, the long-term (12 day) WA of the two treatments containing CMW was significantly higher than that of the control (Figure 4). The reprocessing of the CMW may have reduced the polymer chain length causing less intact encapsulation of fiber particles. It is also interesting to note that the WA curves of samples containing CMW were nonlinear compared with the control.
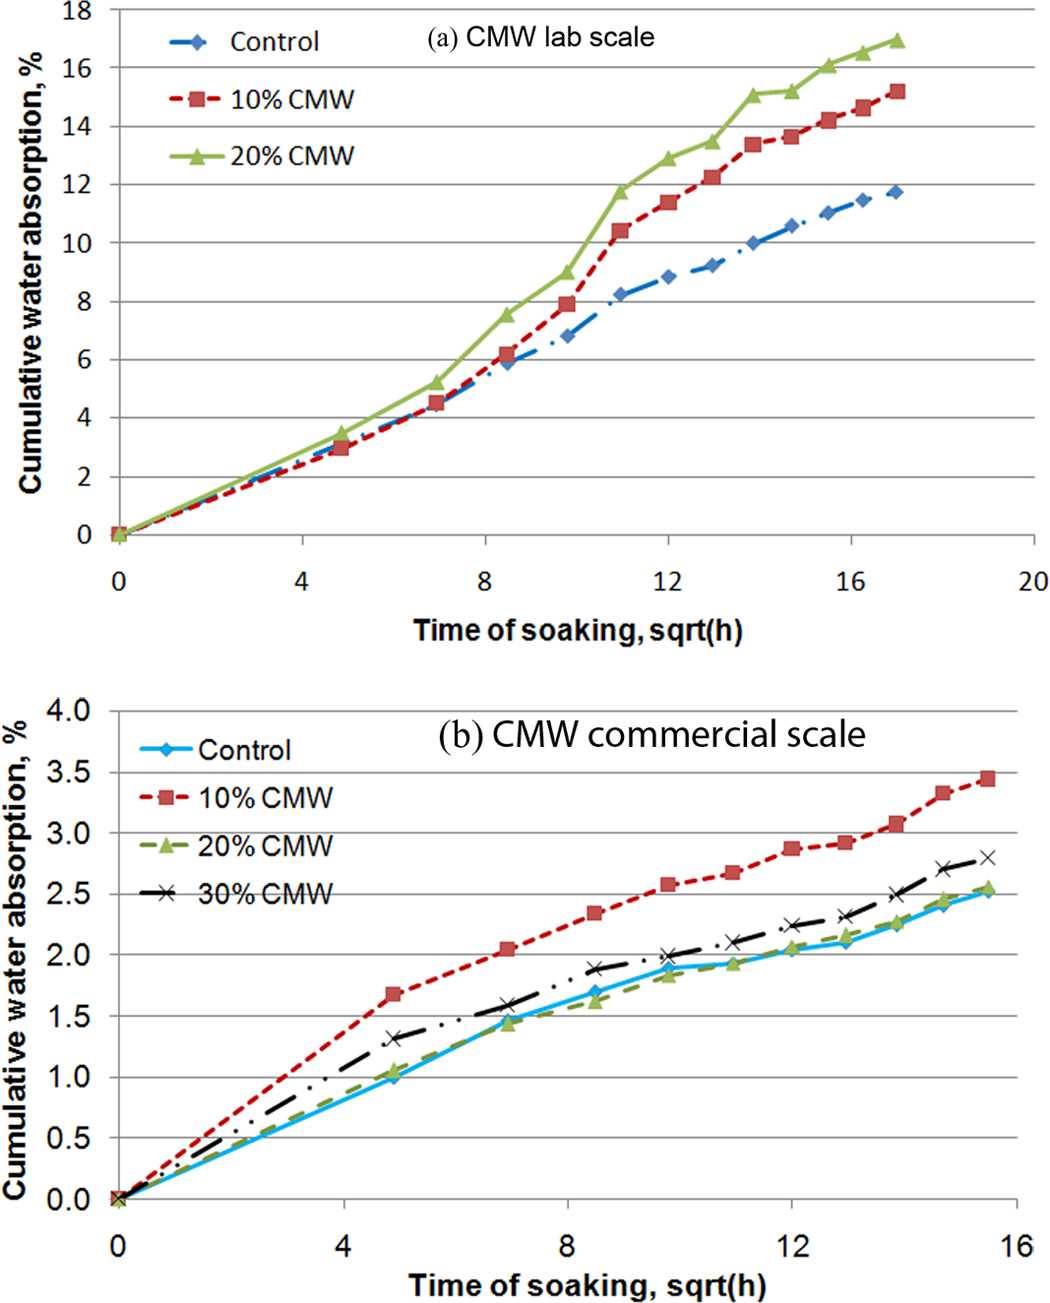
Water absorption of composite samples plotted against square root of time for the four experiments, namely CBS experiment at laboratory scale (a) and commercial scale (b) as well as CMW experiment at laboratory scale (c) and commercial scale (d). Significant differences in water absorption existed between laboratory- and commercial-scale samples. CBS: cotton burr/stem; CMW: cotton module wraps.
Properties of commercial-scale composite samples under CMW treatments
At commercial scale, the samples containing CMW tended to slightly reduce the SG compared with the commercially available GC samples (Table 5 and Figure 2). There was no difference between the SGs of samples as the amount of CMW varied from 10 to 30%. The 24-h WA and TS, long-term WA as well as CLTE were comparable between the control and the various CMW samples (Figure 4 and Table 5). These results are expected since the fiber fillers are responsible for WA and TS, not the polymer matrix holding them. However, if the polymer matrix fails to coat the fibers and establish good linkages with the fibers, it is possible to see differences in WA and TS as the fibers would be more exposed to water.
The 10 and 20% CMW treatments showed improved strength, modulus and hardness compared with the commercially available samples. However, there was no difference between the strength properties of 30% CMW treatment and the commercially available GC sample. Again, this trend is expected as the commercially available GC samples contains 28% recycled LLDPE films. Overall, the 30% CMW treatment exhibited properties very similar to the commercially available GC samples with the additional benefit of slightly lower SG. A lower SG is a desirable property in the majority of outdoor applications where the commercially available GC material is currently used. Therefore, CMW can be used commercially by up to 30% by weight, with 10% by weight of HDPE in primarily decking, window and door components as well as in landscaping products where the GC product is currently used.
Comparison of laboratory- and commercial-scale composite samples with CMW
As in the case of CBS samples, the scaling of manufacturing had significant influence on the properties of the composite samples. Since only two of the treatments, namely 10 and 20% CMW, were common between the laboratory- and commercial-scale experiments with CMW, we only compared the means of these treatments. Because only two treatments could be compared, we also did not perform a correlation analysis. All physical and mechanical properties of the composite samples made at commercial scale were significantly different from those made at laboratory scale (Table 6). While SG, CLTE and strength properties increased under the commercial manufacturing process, WA and TS decreased. The better mixing of fiber and polymer during the commercial manufacturing and the high pressure of extrusion may be the reasons for this trend. It is also notable that the treatment effect noticed at laboratory scale was also observed at commercial scale (Table 5).
Comparison between laboratory- and commercial-scale CMW samples.a
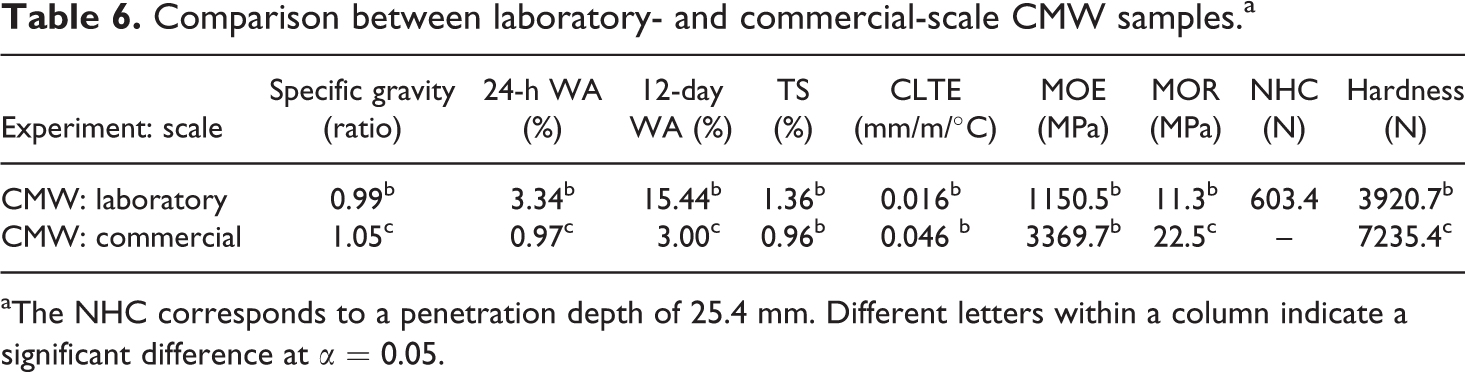
aThe NHC corresponds to a penetration depth of 25.4 mm. Different letters within a column indicate a significant difference at α = 0.05.
Comparison with commercially available wood–plastic composite products
Wood–plastic composite is an example of a natural fiber filled thermoplastic composite that is readily available in the market. The physiomechanical properties of the various composite samples containing CBS were compared with those of commercially available products with published properties (Table 7). Although various commercial products have followed different standards (primarily plastic standards instead of composite standards), a comparison comparable properties indicate that the commercial-scale composites containing CBS fibers or CMW substrate exhibited properties very similar to that of commercially available wood–plastic composite decking boards.
Properties of selected brands of commercially available natural fiber reinforced thermoplastic composites.a
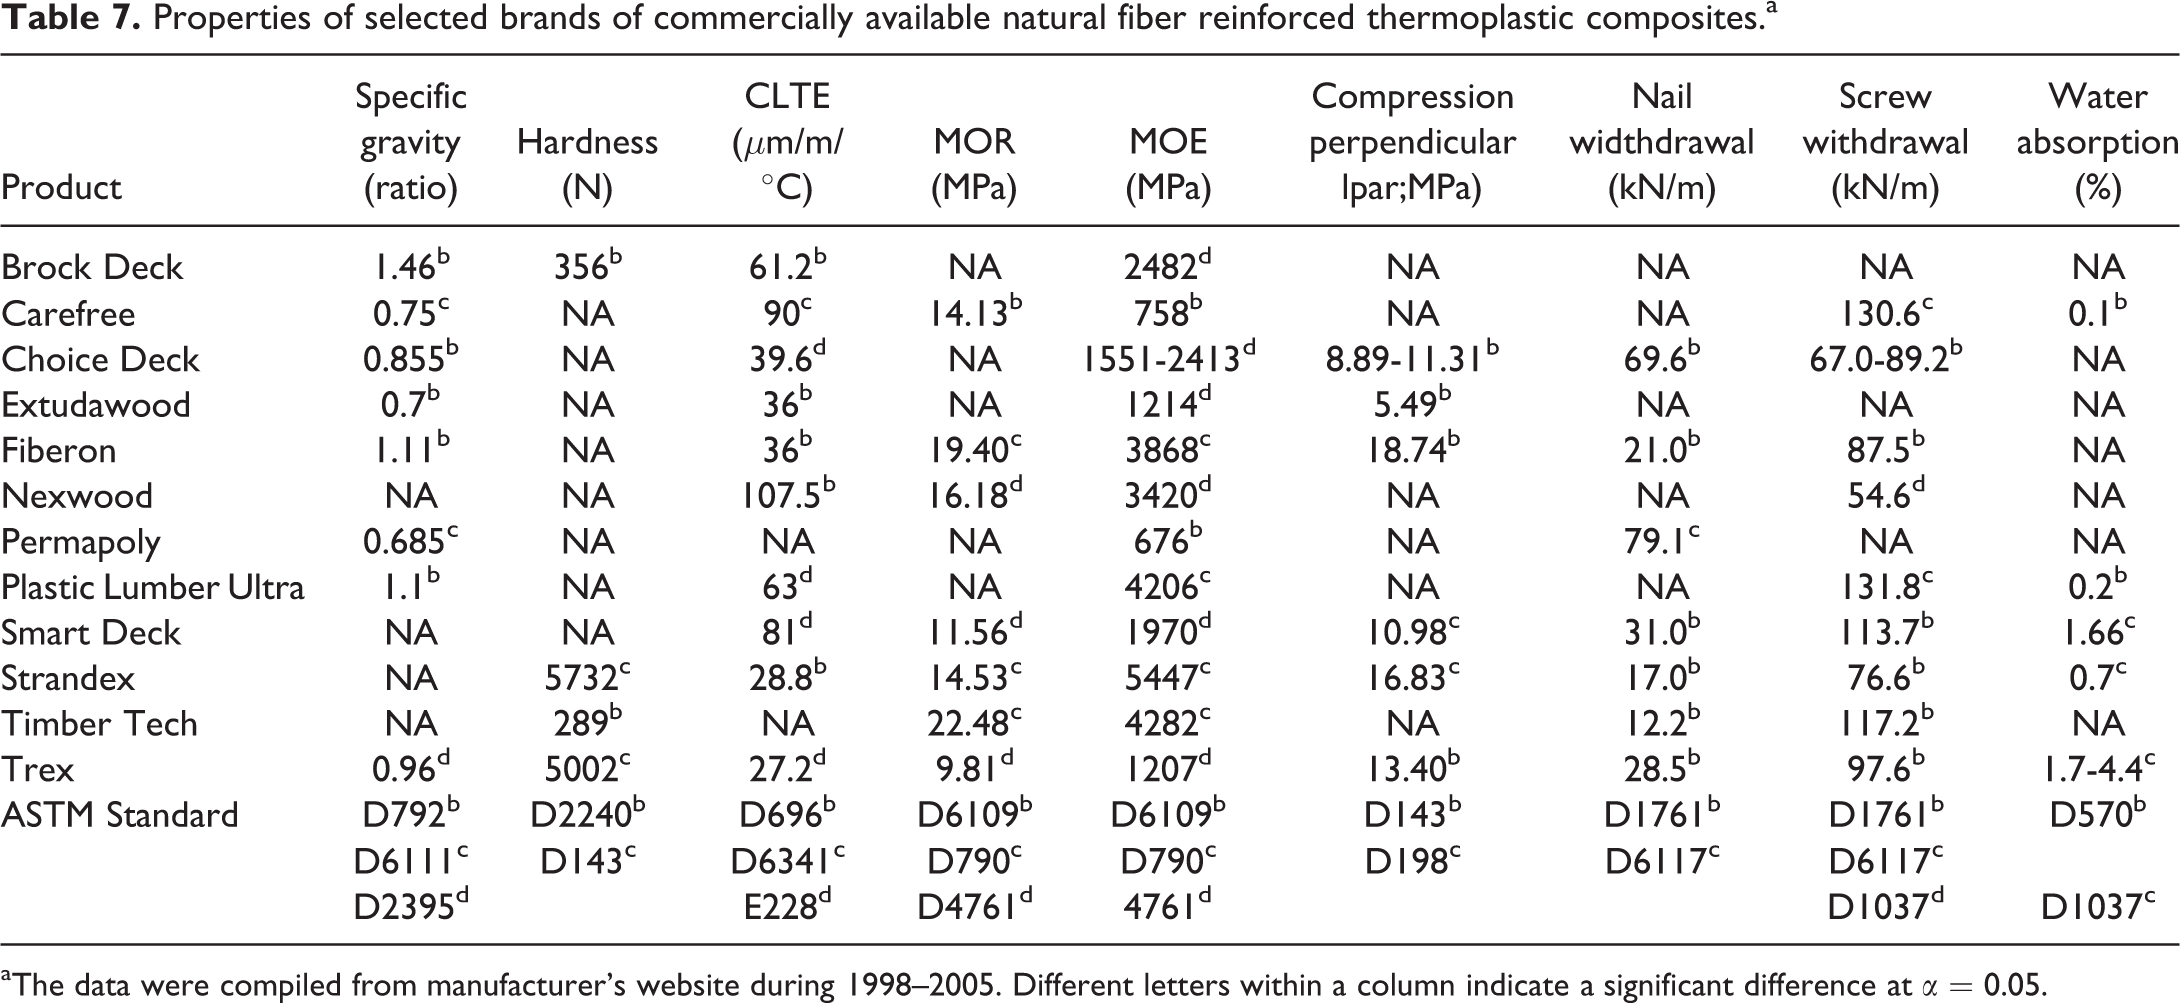
aThe data were compiled from manufacturer’s website during 1998–2005. Different letters within a column indicate a significant difference at α = 0.05.
Conclusions
This study demonstrates the potential of using CBS as a fiber filler, and CMW as a polymer matrix in thermoplastic composites. Overall, 25% of the wood fiber used in commercially available wood–plastic composite can be supplemented by CBS fiber without significant decrease in the physical and mechanical properties of thermoplastic composites. If a slight reduction in hardness and a slight increase in the WA and CLTE were acceptable, CBS can be used to replace up to 75% of the wood fiber filler, which is same as 37.5% of the total composite weight. Similarly, CMW can replace up to 75% of the polymer matrix (same as 30% of total composite weight) used in composite while maintaining physical and mechanical properties comparable with those of a commercially available composite used primarily for decking, window and door components and landscaping products.
A comparison of the laboratory-scale samples to those manufactured at commercial scale indicated that all properties except NHC are influenced by the manufacturing process. Laboratory-scale evaluations are highly indicative of the performance at commercial scale. It should be noted that TS and hardness showed a negative correlation indicating different trends at commercial and laboratory scales as the amount of CBS increased. The properties observed at laboratory scale need scaling before making a direct comparison with commercially available sample.
Footnotes
Acknowledgements
The authors thank Mr Wedegaertner of Cotton Inc. for research support; Mr Burt Hanna and Mr Tim Moore of Greenland Composites Inc. for allowing us to access their facility for manufacturing samples; Mr Bobby Kildow of Greenland Composites Inc. and Mr Joseph Chidiac and Mr George Sakhel of University of Arkansas for their help during the manufacturing and material testing process.
Funding
This project was funded by the research grant no. 07-273 from Cotton Inc.