
Abstract
The ethylene vinyl acetate (EVA), high-density polyethylene (HDPE), compatibilizer (maleic anhydride-grafted polyethylene (MA-g-PE)) and organophilic montmorillonite (OMMT) clays were added in different sequences in a corotating twin screw extruder followed by injection molding. Montmorillonite clay was modified by octadecylamine and aminopropyltriethoxysilane to make it organophilic. The thermal behavior was characterized by thermogravimetric analysis and differential scanning calorimetry (DSC). The influence of blending HDPE with EVA on the thermal properties of EVA/HDPE blends was investigated. The effect of MA-g-PE and nanoclay on the thermal properties of EVA/HDPE blend and modified EVA/HDPE blends, respectively, were also investigated. The blends show two distinct unchanged melting peaks corresponding to the individual components of the blend. The addition of nanoclay improves the thermal properties of nanocomposites. The results of DSC behavior of the nanocomposites indicate that melting temperature (T m) and melting enthalpy (ΔH m) of the HDPE phase of the nanocomposites are lower than those of the neat EVA/HDPE blend. Although crystallization temperature (T c) of the nanocomposites is higher than the neat EVA/HDPE blend, it is observed that the incorporation of 4 phr clay loading into nanocomposites improves the thermal stability.
Keywords
Introduction
Blending of two or more thermoplastics is a faster technique to achieve the required properties, which may generate a new material. In the last few years, many blends of polyolefins have been developed, which are widely used in polymer industry. 1
The use of ethylene vinyl acetate (EVA) copolymer in blends, prepared with high-density polyethylene (HDPE) is useful. EVA and HDPE are a semicrystalline thermoplastic and an elastomeric material, respectively. 2 Based on the vinyl acetate content, EVA copolymers are available as rubbers, thermoplastic elastomers and plastics. It is known that blending EVA with low-density polyethylene (LDPE) can increase the elasticity of material, and optimize its properties in combination with inorganic materials. The crystallizable units in both EVA and LDPE are ethylene chain segments. 3 In EVA, polar vinyl-acetate (VAc) units are randomly added into the backbone of copolymer, acting as the intervals of ethylene chain segments with various lengths. EVA has been used as a compatibilizing agent between nanoclay and polyolefin due to partial polarity of VAc in EVA copolymer that helped in enhancing the polymer–clay interaction. 4 It is found earlier that EVA may be miscible with HDPE molecules when EVA contains less than 18 wt% VAc, even for a high molecular weight of HDPE and EVA. 5
The development of nanoparticle addition of clay in the polymer matrix has unfolded a new chapter in the field of materials science in recent years. 6 Melt mixing is widely used method for the preparation of nanocomposites, as it is a more efficient and cost effective process. Nanocomposites preparation needs delamination of clay and strong polymer–filler interaction. The degree of the dispersion of the clay layers in the polymer matrix depends upon intercalated nanoclay due to regular insertion of the polymer chains in between the clay layers and delaminated nanoclay, where the clay layers are randomly and homogeneously dispersed in the polymer.
Polymer/clay nanocomposites preparation involves high temperatures and also most polymeric materials require prolonged service in air at high temperatures. Thus, determination of the onset temperature of degradation and the stability of the polymer in the presence of layered silicates is necessary. Thus, increasing the thermal stability of organophilic montmorillonite (OMMT) and resultant nanocomposites is one of the key points in the successful industrial application of polymer/clay nanocomposites on the industrial scale. Costache et al. proposed that the differences in the degradation of the nanocomposites and virgin EVA may arise from the secondary reactions which the secondary allylic radicals can undergo. 7 Polyethylene is nonpolar, that is no polar groups in its back bone. Due to this reason, the homogenous dispersion of the hydrophilic silicate layers in its matrix is not possible. In general, layered silicate is modified with alkyl ammonium to facilitate its interaction with a polymer because alkyl ammonium made the hydrophilic silicate surface organophilic. The formulation including 70 wt% PE and 30 wt% EVA with dimethyl ditallow ammonium montmorillonite (Cloisite 15A) is reported by Akhlaghi et al. 8
In this article, the development of high EVA content EVA/HDPE/clay nanocomposites is aimed to determine and analyze the thermal properties.
Experimental
Materials
EVA copolymer (TAISOX 7350 M) of density 0.93 g/cm3, melt flow index (MFI) of 2.5 g/10 min and VAc 18% was supplied from Nippon Unicar. Co. Ltd (Japan). HDPE (HD 50MA 180) of density 0.95 g/cm3 and MFI of 20 g/10 min was supplied from Reliance Industries (Hazira, Gujarat, India). MA-g-PE (E-156) of density 0.92 g/cm3 and MFI of 1.5 g/10 min was commercially procured from Pluss Polymer. OMMT clay grade Nanomer® 1.31 PS, montmorillonite clay surface modified with 15–35 wt% octadecylamine and 0.5–5 wt% aminopropyltriethoxysilane was supplied from Sigma Aldrich (New Delhi, India).
Preparation of EVA/HDPE blends and their nanocomposites
EVA/HDPE blends having higher loading of EVA and their nanocomposites were melt-mixed in a Berstorff corotating twin screw extruder (screw diameter: 25 mm, L/D = 48) at a constant rotating speed of 200 r/min. The temperature of six heating zones was 142, 147, 155, 165, 170 and 180°C. Extrudates were cooled with water and pelletized. Test specimens were prepared by injection moulding (J 180 AD-180H). The barrel temperature was in the range of 140–220°C and injection pressure was 80 MPa. The sequential addition of EVA, HDPE, compatibilizer and nanoclay is shown in Table 1.
Sample compositions.
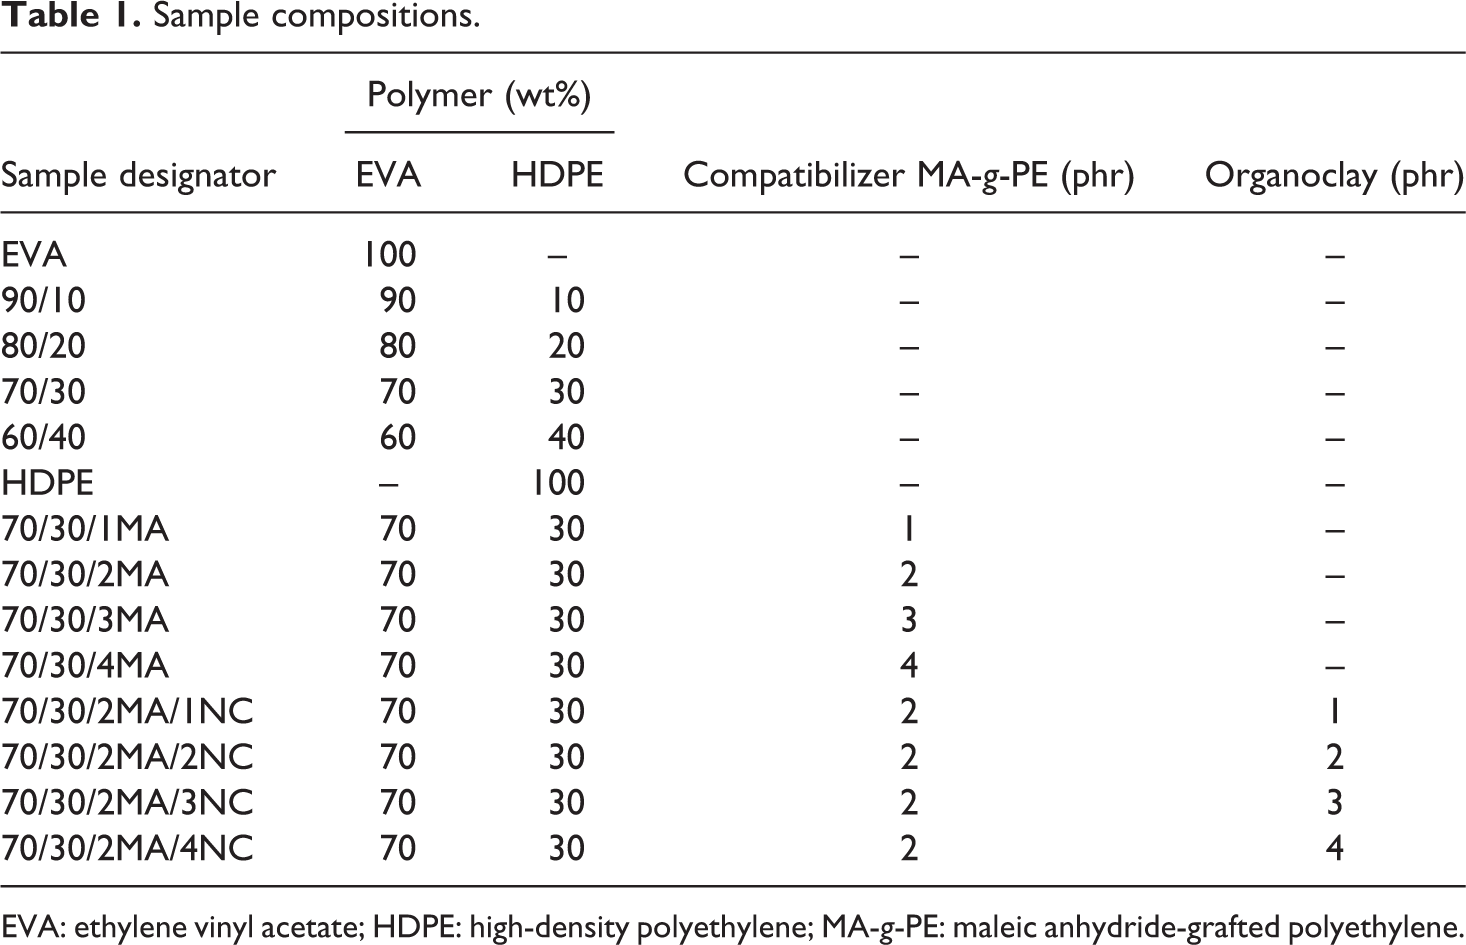
EVA: ethylene vinyl acetate; HDPE: high-density polyethylene; MA-g-PE: maleic anhydride-grafted polyethylene.
Thermal analysis
DSC analysis
Differential scanning calorimetry (DSC) tests were performed on a Perkin Elmer DSC-7 with the samples of 5 mg sealed in aluminum pans under nitrogen atmosphere in a temperature range of room temperature to 160°C at 10°C/min. Indium and tin were used for the calibration of heat of fusion and melting temperature. The melting temperature and the crystallization enthalpy of the samples were determined. The degree of crystallinity was calculated via the total enthalpy method, according to the following equation
where X c is the degree of crystallinity, ΔH m is the specific enthalpy of melting and ΔH +m is the specific enthalpy of melting for 100% crystalline polyethylene. In this case, value of ΔH +m was taken as 288 J/g. 9
Thermal stability characterization
The thermal stability characteristic studies of the samples was carried out using thermogravimetric analysis (TGA; Perkin Elmer Pyris 1 TGA, USA) under N2 gas with flow rate of 10 ml/min. A weight of 4–6 mg is subjected to a heating rate of 10°C/min and scanned from room temperature to 600°C.
Scanning electron microscopy
The morphology of the 70/30, 70/30/2MA and 70/30/2MA/4NC samples were fractured and sputtered with thin gold–palladium layer to avoid electrostatic charging during examination. The coating was done with the help of Polaron Sputter Coater. The fracture surfaces were examined by scanning electron microscopy (LEO 430), using secondary electrons detector. The samples were chosen after the tensile test. The surface of the samples was dried under vacuum and then gold–palladium layer was evaporated before SEM analysis.
Results and discussions
Differential scanning calorimetry
The degree of crystallinity of semicrystalline polymers has a considerable effect on their mechanical and thermal properties. A single endothermic peak for both HDPE and EVA represents the melting temperature of their crystalline phase. The presence of two peaks for EVA/HDPE blends and nanocomposites confirms the immiscibility of the EVA and HDPE crystalline parts. In DSC heating curves, two peaks appeared for HDPE phase due to the two crystal structure forms of HDPE phase. This may be due to the incorporation of PE part of EVA phase with HDPE phase. The two peaks in the melt curve of HDPE are reported by Na et al., 10 and they found that the lower temperature peak is the melting of spherulites, whereas the higher temperature peak is the melting of stretched chain.
Effect of HDPE content
The results obtained corresponding to the melting temperatures, crystallization temperatures and melting enthalpy of high EVA content EVA/HDPE blends are summarized in Table 2. From Figure 1(a) it can be seen that the peak area corresponding to the HDPE component of the blends decreases with increased EVA content. This decrease in the HDPE peak area is due to the decrease in the HDPE ratio in the blend. Similar observation is reported by Khonakdar et al. 11
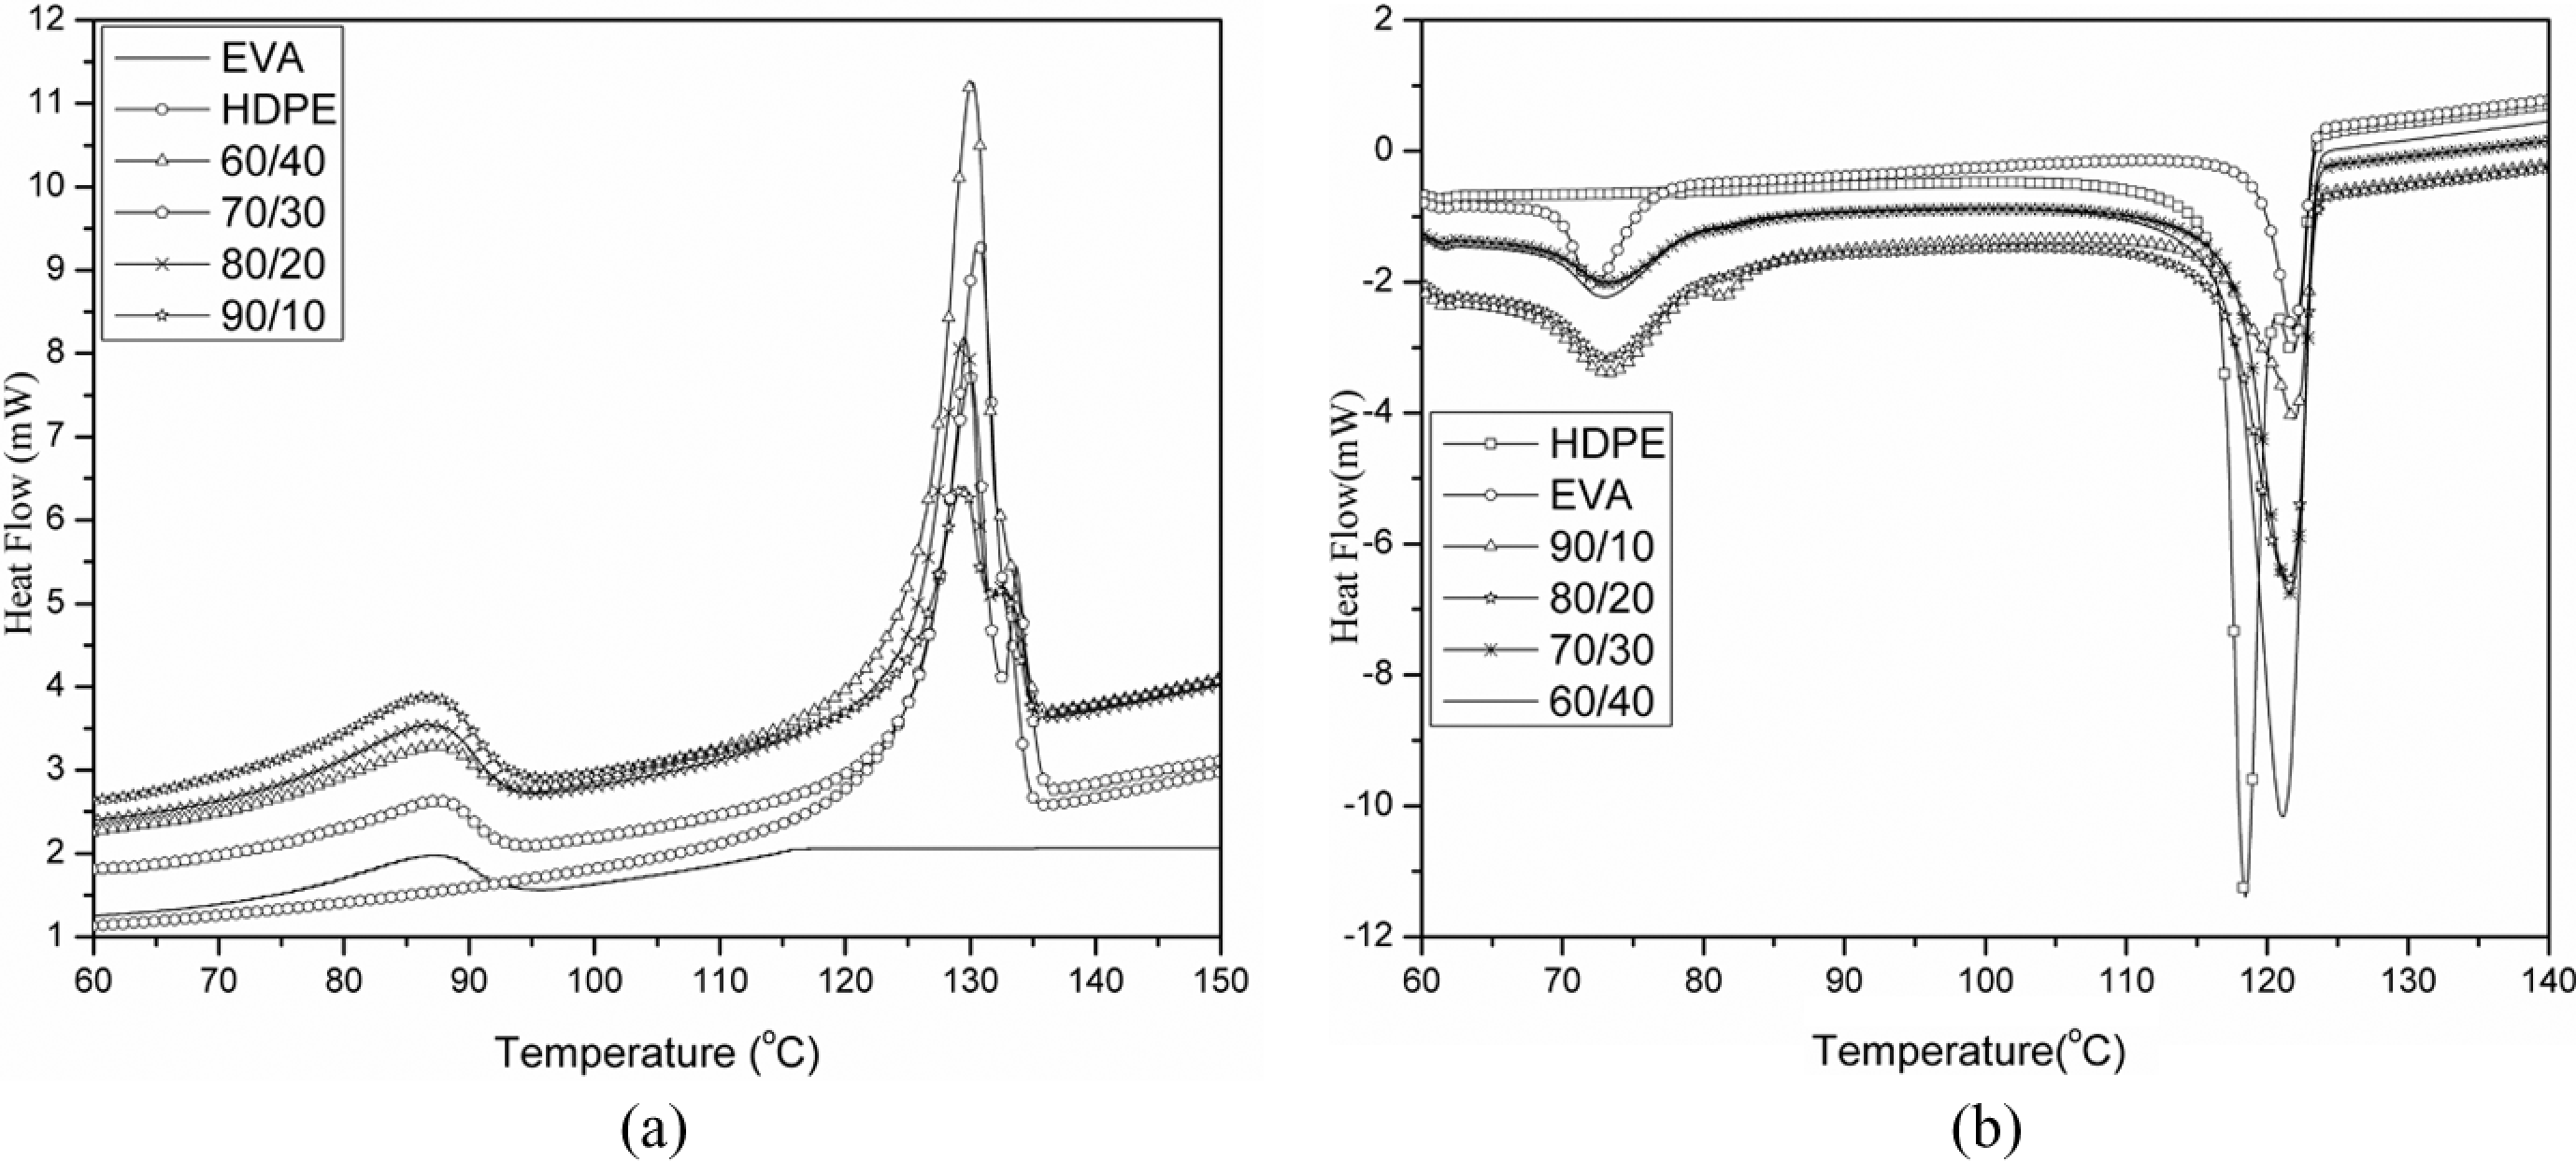
(a) DSC melting curves of pure EVA, pure HDPE and their blends. (b) DSC crystallization curves of pure EVA, pure HDPE and their blends. DSC: differential scanning calorimetry; EVA: ethylene vinyl acetate; HDPE: high-density polyethylene.
The DSC data of EVA, HDPE, EVA/HDPE blends and nanocomposites.
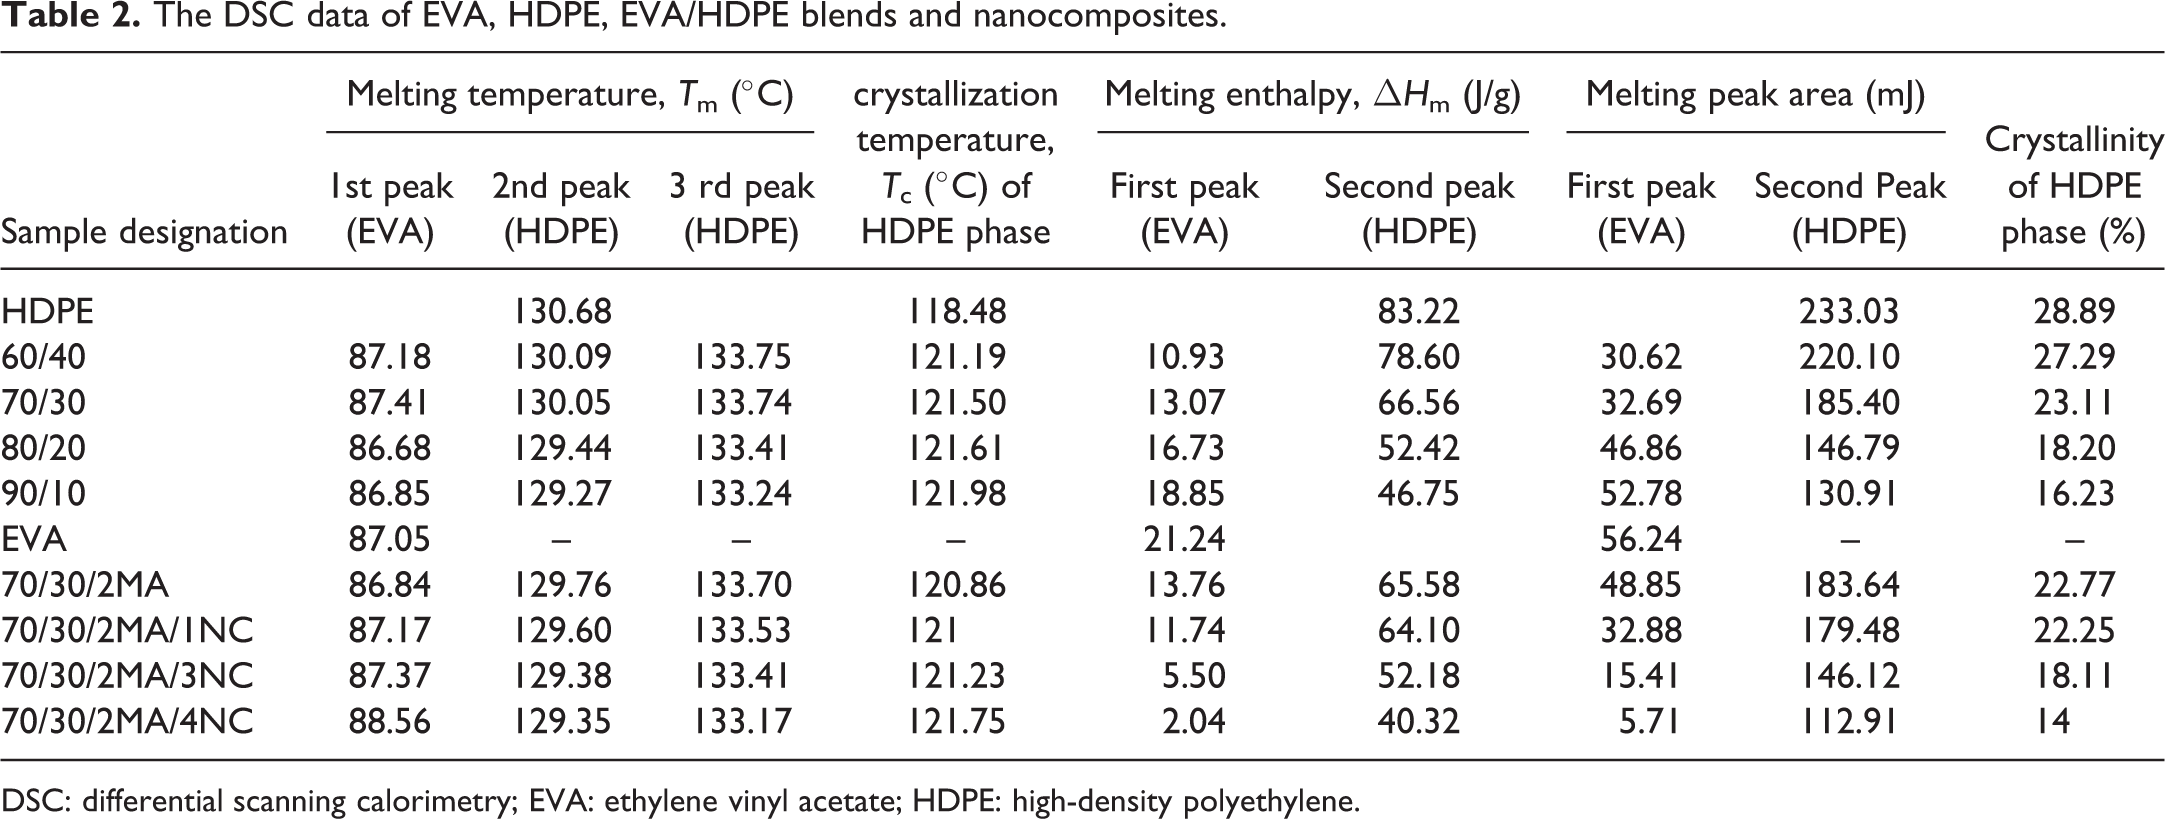
DSC: differential scanning calorimetry; EVA: ethylene vinyl acetate; HDPE: high-density polyethylene.
The melting temperature and melting enthalpy of HDPE phase decreases with EVA content. This depression of melting temperature of HDPE crystalline phase to lower temperature is due to the dilution effect of EVA. On the other hand, nucleation effect of HDPE crystallites and some part of HDPE crystallite in the EVA phase can be responsible for increasing the crystallization temperature of HDPE phase (Figure 1(b)). Similar result was also reported by Faker et al. in their work on LDPE/EVA blends. 12 On the other hand, the crystallization temperature of HDPE phase increases with EVA content. This can be explained in terms of the nucleation effect of HDPE crystallites and some part of HDPE crystallite in the EVA phase. Similar result is also reported by Faker et al. in their work on LDPE/EVA blends. 12
The melting temperature of EVA crystalline phase increases from 60 to 70 wt% EVA. But above 70 wt% EVA, melting temperature decreases. In both 80/20 and 90/10, composition melting temperature of both the phases decreases. For EVA/HDPE blends, it can be explained that the linear part of EVA is incorporated into the crystals of HDPE. As a result cocrystallization occurs in HDPE crystals. This leads to the decrease in the melting temperatures of both EVA and HDPE phases.
Crystallinity of EVA/HDPE blends decreases with EVA content. The reduction in crystallinity is due to the disrupting action of EVA phase with HDPE chain molecules arrangement in a crystal lattice. This effect is also reported by Khonakdar et al. 11 According to them, EVA does not affect the melting temperature of HDPE significantly. But EVA decreases the total crystallinity of the blends.
Effect of compatibilizer
Both melting and crystallization temperatures for HDPE phase of maleic anhydride-grafted polyethylene (MA-g-PE)-modified EVA/HDPE blend is lower than neat EVA/HDPE system as shown in Figure 2(a) and (b), respectively. It can be explained in terms of the interaction of polymer chains with compatibilizer as shown in morphological studies (Figure 5(a) and (b)). Thus, the more defective crystals in the blend result into the lower melting temperature. This increases the viscosity of the blend which in turn negatively affects the crystallization growth stage. The melting enthalpy for HDPE phase of modified EVA/HDPE blend is lower than neat EVA/HDPE system. Due to this reason, 70/30/2 sample has lower crystallinity than 70/30 sample but compatibility of compatibilized blend is higher than uncompatibilized blend as shown in the morphological study (Figure 5(b)). Similar improvement is also reported by khonakdar et al. in their work on crosslinked PE/EVA blends. 11
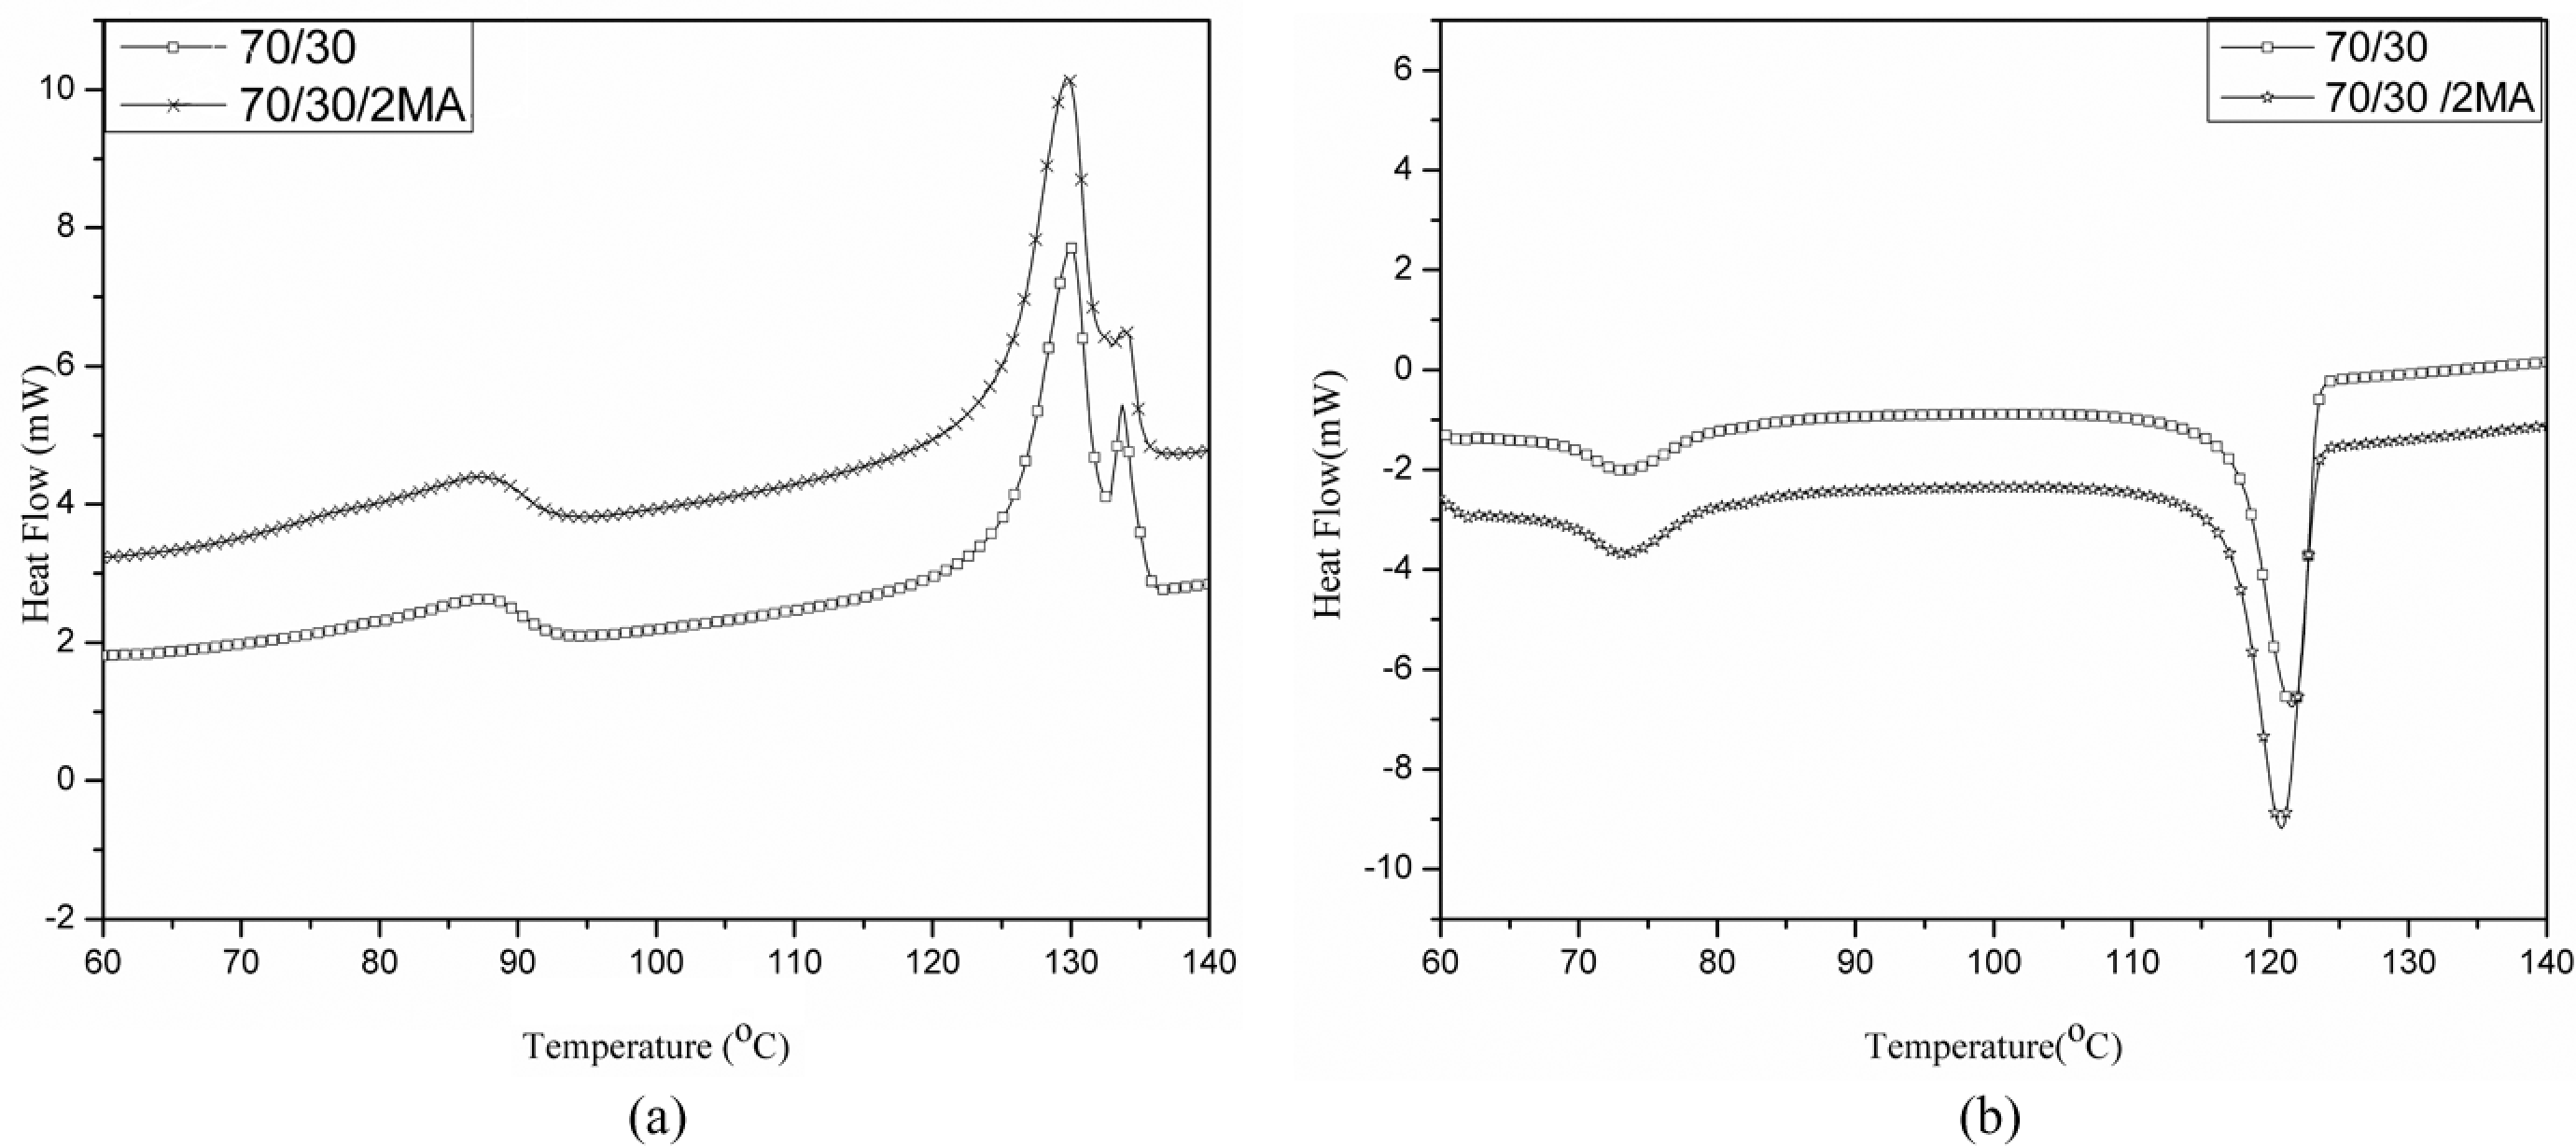
(a) DSC melting curves of pure 70/30 and 70/30/2MA systems. (b) DSC crystallization curves of pure 70/30 and 70/30/2MA systems. DSC: differential scanning calorimetry.
Effect of nanoclay
Melting temperatures for HDPE phase of MA-g-PE-modified EVA/HDPE/OMMT nanocomposites are lower than neat modified EVA/HDPE system as shown in Figure 3(a). The decrease in melting temperature of HDPE crystalline phase to lower temperatures is due to the dilution effect of nanoclay with EVA/HDPE blend in the presence of compatibilizer. On the other hand, crystallization temperatures for HDPE phase of nanocomposites are higher than neat EVA/HDPE system as shown in Figure 3(b). The nucleation mechanism is responsible for the growth of crystals in the nanocomposites. Nanoclay acts as nucleating agent with HDPE crystallites and some PE crystallites in EVA. This can be responsible for increasing the crystallization temperature of HDPE phase.
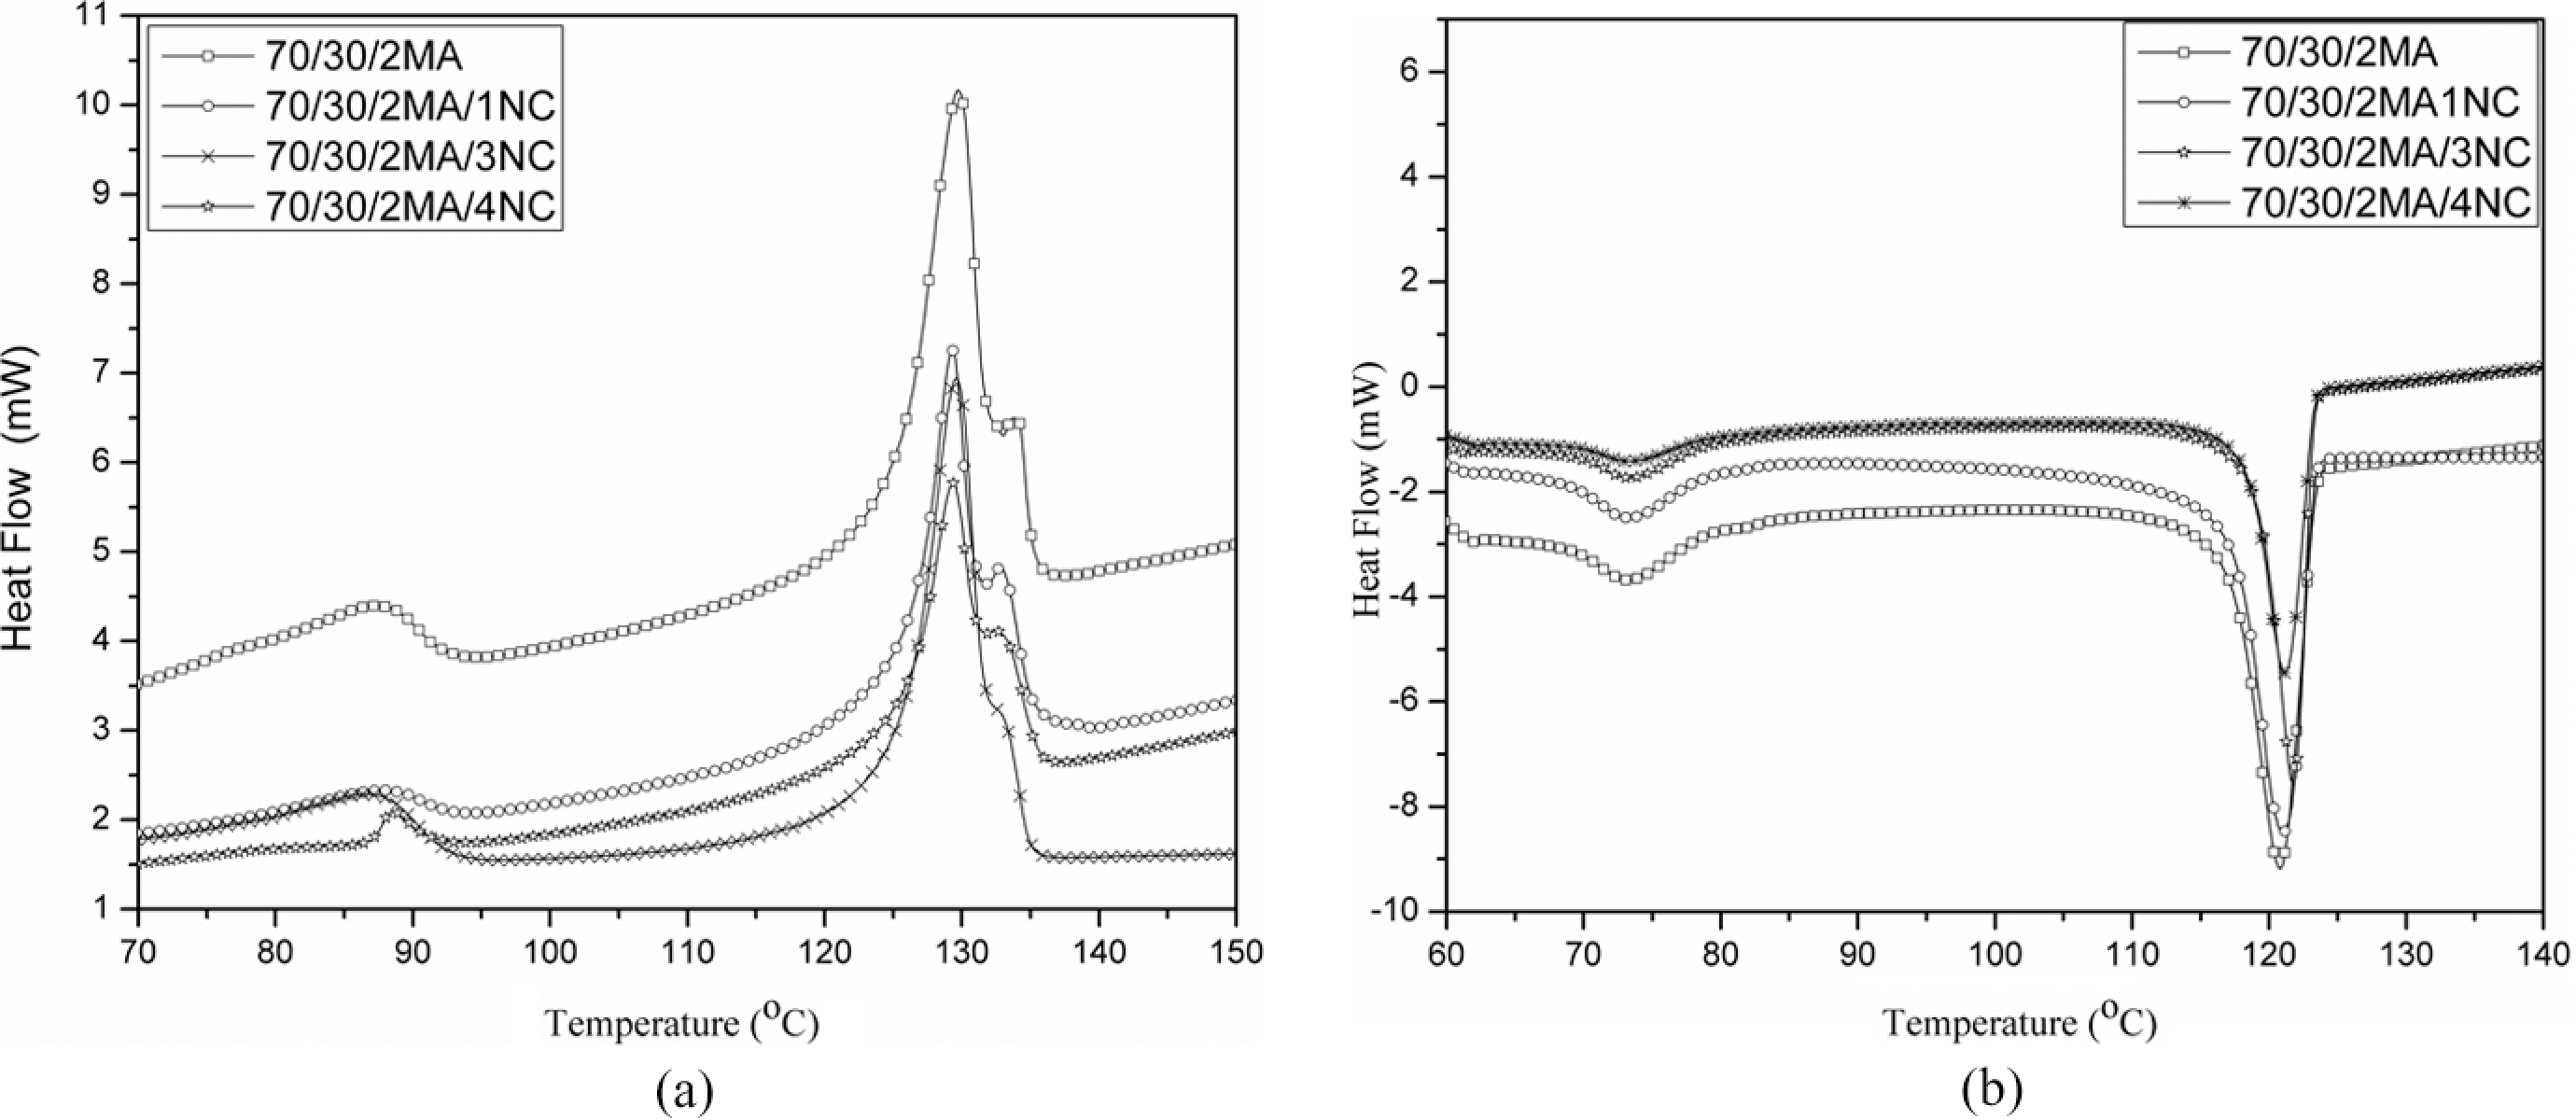
(a) DSC melting curves of pure 70/30/2MA system and its nanocomposite systems. (b) DSC crystallization curves of pure 70/30/2MA system and its nanocomposites systems. DSC: differential scanning calorimetry.
According to Mingliang and Demin, 13 the strong interaction between polymer matrix molecules and the layers of organoclay results in the immobilization of some polymer matrix as organoclay easily absorb the polymer molecules. These freezed molecules of polymers are responsible for the crystallization process of nanocomposite. Therefore, the crystallization of polymer matrix molecules occurs at higher temperature, and the T c values of nanocomposite systems are increased. The melted polymer macromolecule segments easily attach to the surface of the OMMT particle are also studied by Xu et al. 14 This results in the crystallization of polymer molecules at a higher crystallization temperature.
Melting peak area and melting enthalpy for EVA and HDPE phase of modified nanocomposites are lower than neat modified EVA/HDPE system. The decrement of melting enthalpy for HDPE phase leads to the reduction in crystallinity for HDPE phase in nanocomposites. As a result, compatibility of nanocomposites is more as shown in morphological study (Figure 5(c)). Similar improvement is also reported by khonakdar et al. in their work on PE/EVA blends. 11
Thermal stability
Thermostability of blends
The effect of HDPE content on the thermal degradation behavior of the EVA/HDPE blends is presented in Figure 4(a). The TGA data of neat EVA, pure HDPE and their blends are tabulated in Table 3. Less than 1% residue was left at 550°C for all EVA/HDPE blends. The first degradation temperature of the neat HDPE began at 395°C. The maximum decomposition rate for HDPE occurs in the temperature range between 390 and 490°C.
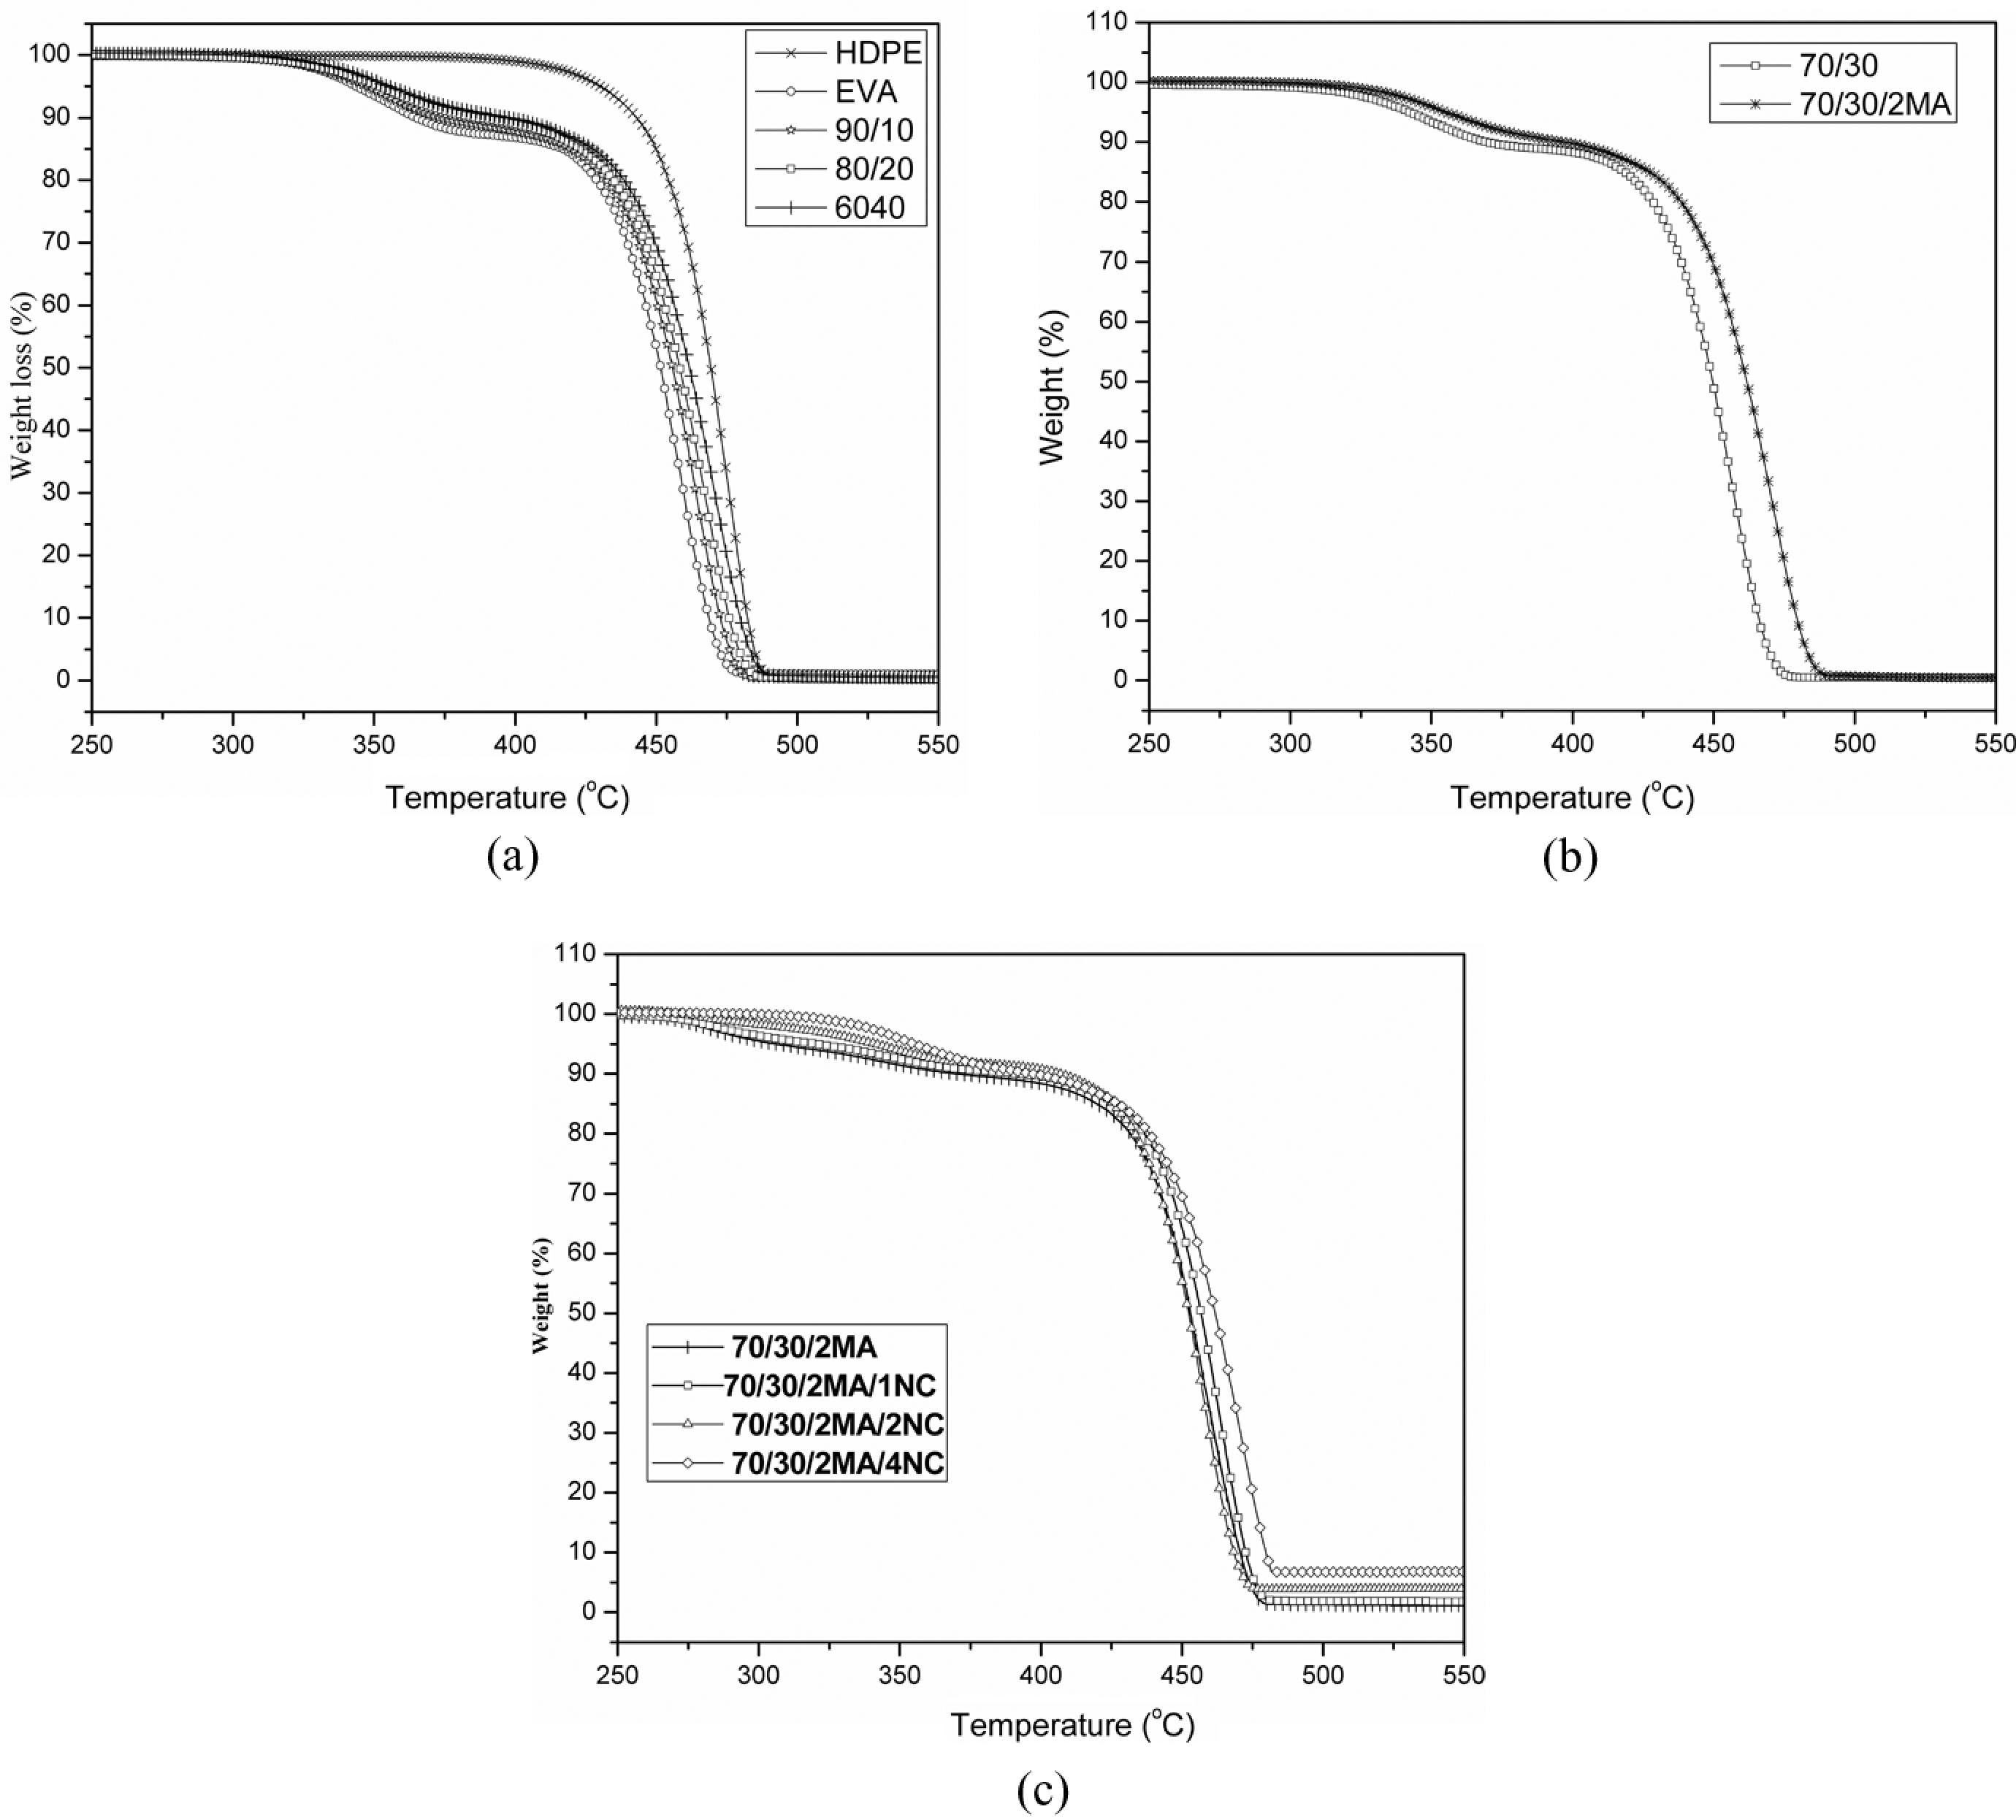
(a) TGA diagrams of EVA, HDPE and their blends. (b) TGA diagrams of the blends of MA-g-PE modified and unmodified EVA/HDPE (70/30). (c) TGA diagrams of EVA/ HDPE blend and its nanocomposites. TGA: thermogravimetric analysis; EVA: ethylene vinyl acetate; HDPE: high-density polyethylene; MA-g-PE: maleic anhydride-grafted polyethylene.
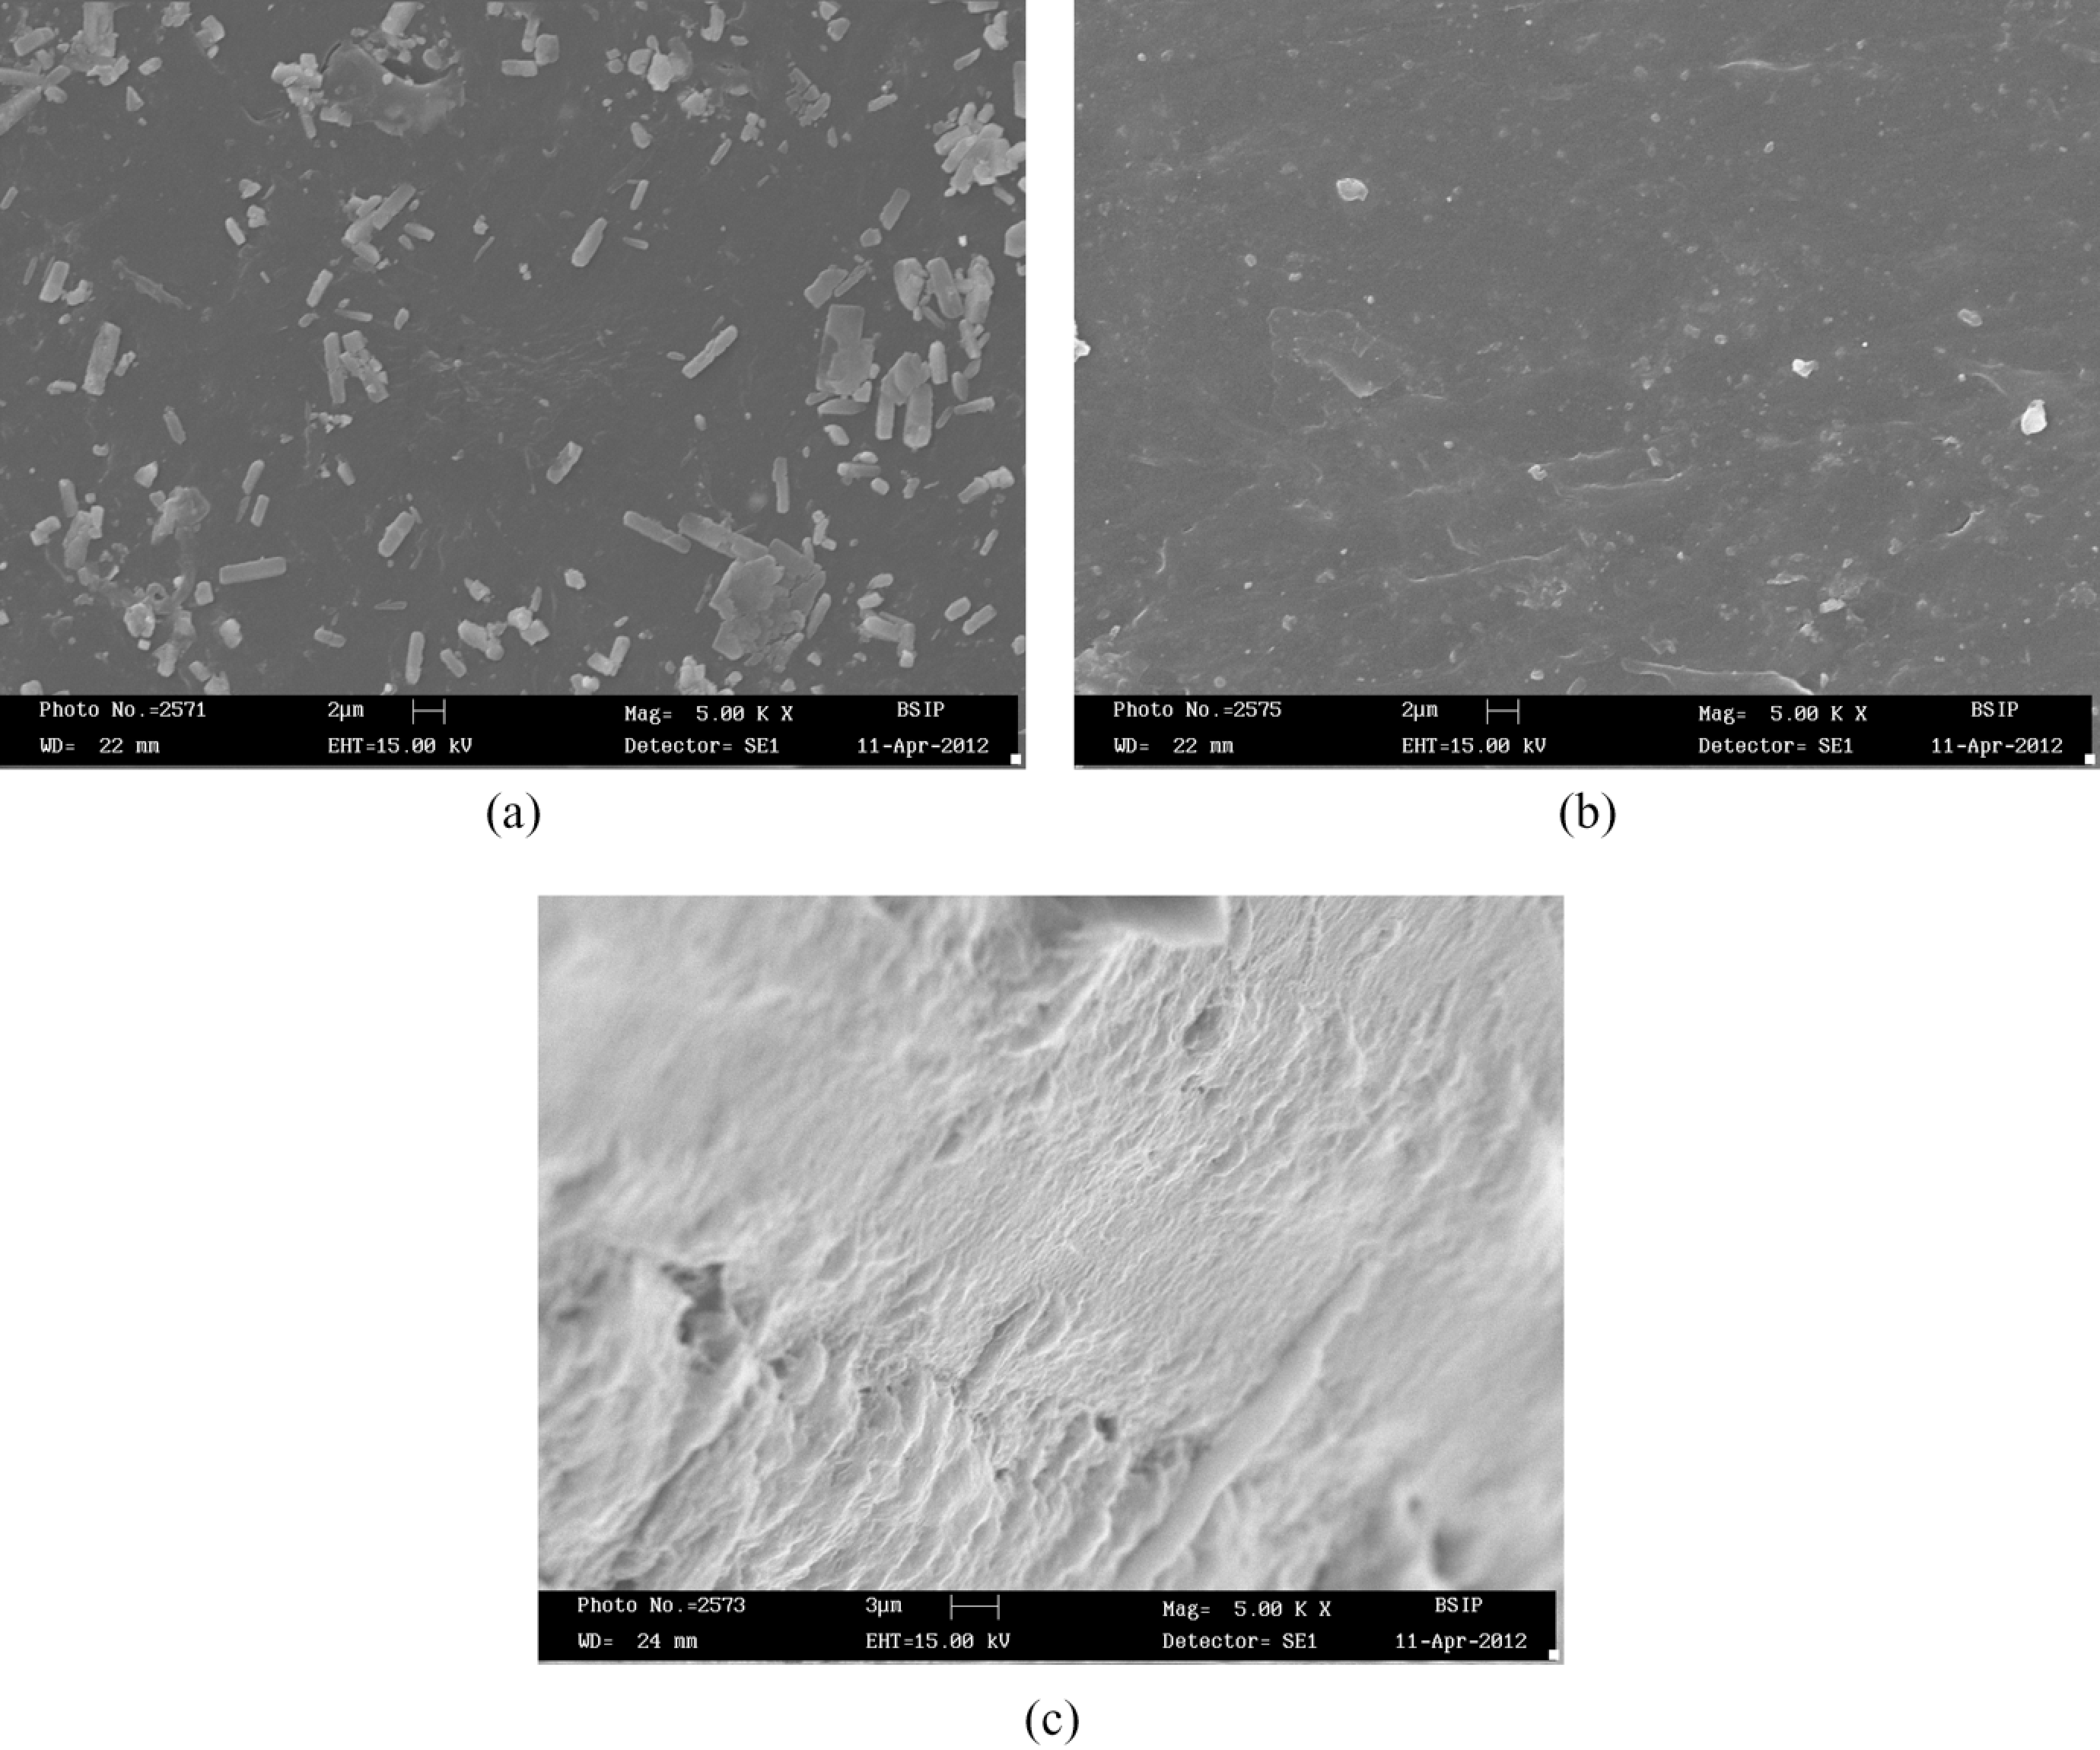
(a) SEM micrograph of EVA/HDPE (70/30) system. (b) SEM micrograph of MA-g-PE modified EVA/HDPE (70/30/2MA) system. (c) SEM micrograph of MA-g-PE-modified EVA/HDPE/OMMT (70/30/2MA/4NC) nanocomposite system. SEM: scanning electron microscope; EVA: ethylene vinyl acetate; HDPE: high-density polyethylene; OMMT: organophilic montmorillonite; MA-g-PE: maleic anhydride-grafted polyethylene.
TGA data of EVA, HDPE and EVA/HDPE blends and nanocomposites.
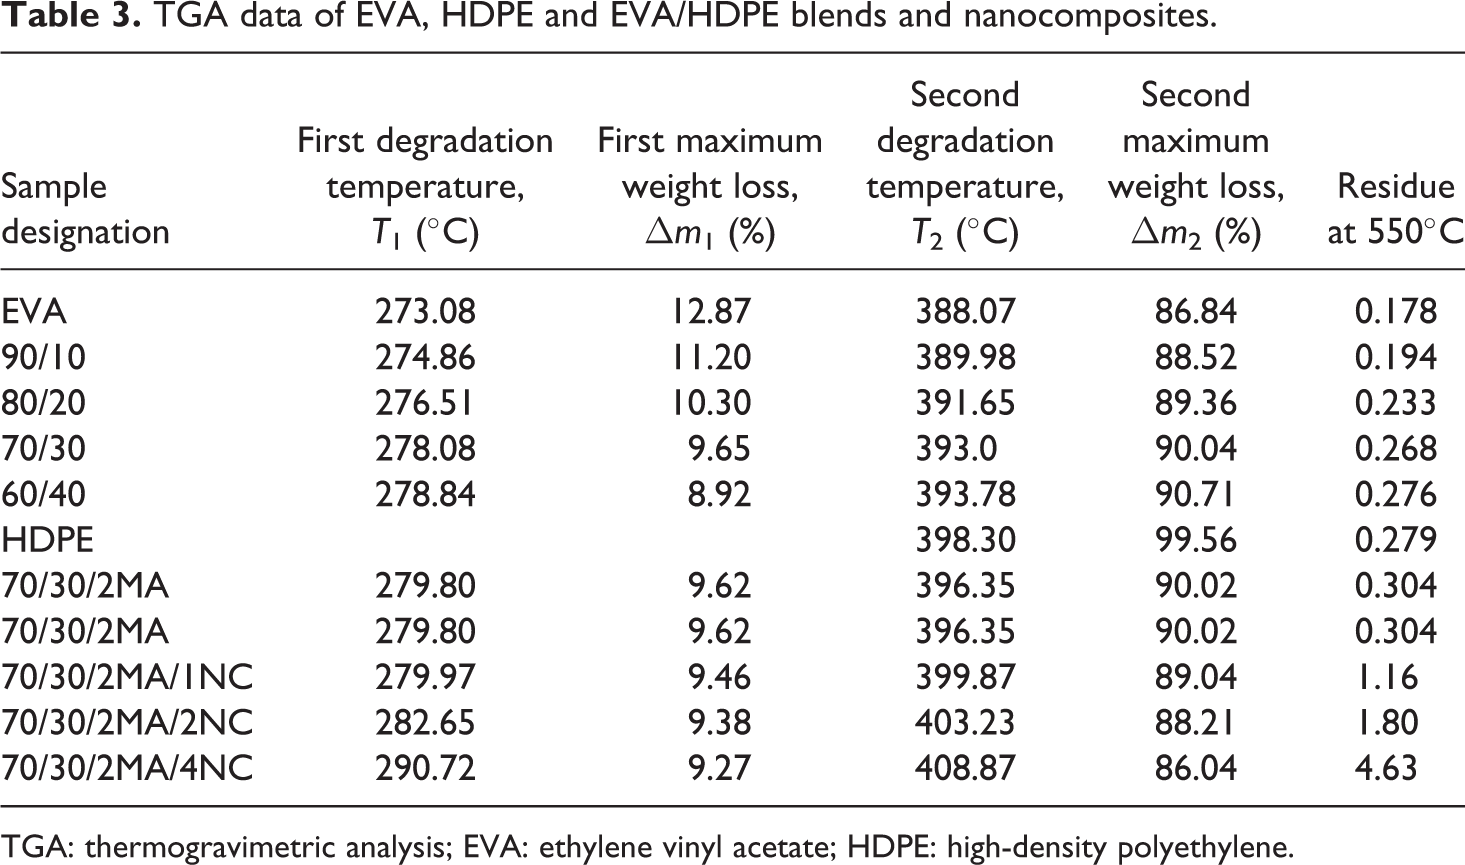
TGA: thermogravimetric analysis; EVA: ethylene vinyl acetate; HDPE: high-density polyethylene.
A two-step weight loss of EVA and EVA/HDPE blends is observed because of two-step decompositions. The EVA/HDPE blends degraded in two stages. The first one around 272–279°C is due to vinyl acetate of EVA decomposition as similarly shown in Figure 4(a) for pure EVA. The second stage of thermal decomposition begins near 388°C. Clearly, both first and second degradation temperature shifts toward high temperature as the amount of HDPE increases. It can be explained in terms of the crystallinity. As HDPE content increases, crystallinity increases (as shown in Figure 1(a) and Table 2). Thermal stability of both 60/40 and 70/30 (as shown in Figure 4(b)) is almost same. Therefore, 70/30 is selected for further study.
Thermostability of modified and unmodified blends
Figure 4(b) presents the TGA diagrams of the blends of unmodified and MA-g-PE-modified EVA/HDPE blends. The slope of the TGA curve of the modified blend (70/30/2MA) is higher than that of the neat blend (70/30). The degradation temperature and percentage of weight loss for both the stages of modified and unmodified blends are summarized in Table 3. Clearly, the first and second degradation temperature shifted toward high temperature as the amount of compatibilizer is incorporated. The thermostability and weight loss of MA-g-PE-modified blend is higher and lower than unmodified blend, respectively.
This can be explained by interfacial adhesion of EVA and HDPE polymers in the presence of MA-g-PE compatibilizer is better than that of the polymer blend of PE/EVA/HDPE as shown in morphological studies (Figure 5(a) and (b)). From the morphology of MA-g-PE-modified blend (70/30/2MA), it is clear that EVA and HDPE polymers are closer than unmodified blend (70/30).
Thermostability of nanocomposites
The thermal stability of EVA/HDPE nanocomposites are tested by TGA curves as shown in Figure 4(c). The degradation temperature and percentage of weight loss for both the stages are performed in Table 3. The TGA data in Table 3 expresses that MA-g-PE compatibilizer enhances thermostability not only for polymer blend of EVA/HDPE but also for the nanocomposites of EVA/HDPE/OMMT. The decomposition temperature and weight loss of the nanocomposites are higher and lower than that of their corresponding neat blend, respectively. The first degradation temperature increases with the organoclay addition. However, this is discordant with other experiment in which the organoclay accelerates the deacylation of EVA copolymer due to the catalytic activity of the acidic sites. 15 This finding can also be regarded as another proof, which justifies that the organoclay particles localize preferentially within the HDPE phase. Modification of clay with octadecylammonium cations improves the attraction with HDPE due to charge interaction (MA-g-PE) also lowers the hydrophobicity of HDPE, imparting polarity, which makes it more compatible with organoclay as shown in the morphological study (Figure 5(c)). As a result thermostability of 70/30/2MA/4NC is highest in comparision with other nanocomposites.
The nanometer level dispersed silicate layers interact strongly with the polymer chains and simultaneously, the barrier effect of silicate layers inhibit the mobility of small molecules produced as a result of thermal degradation. These two effects of silicate layers altogether contribute toward the enhancement of the thermal stability of the nanocomposites. The maximum thermal stability at 4 phr of OMMT in a nanocomposite is also reported by Zhang et al. 16 in their work on polypropylene/organo clay nanocomposites.
Morphology of blend and nanocomposite
The morphology of the 7030, 70/30/2MA and 70/30/2MA/4NC samples are studied using scanning electron microscope (SEM). From Figure 5(a), it is clear that there is an obvious interface between EVA and HDPE. This is an indication of immiscible behavior of both the phases. By adding compatibilizer (MA-g-PE), the dispersion of HDPE in matrix becomes uniform and the size of HDPE phase declines (Figure 5(b)). The domains for 70/30/2MA are smaller and more uniform than that for 70/30 sample. The compatibilization induced by the interaction of grafted maleic anhydride (MAH) and the side functional groups (acetate) of EVA is the main effect influencing the morphology of 70/30/2MA sample, because it reduces the interfacial tension and increases the interfacial adhesion.
From Figure 5(c), it is clear that MA-g-PE compatibilizer also improves the adhesion of the particles of nanoclay and EVA/HDPE blend in 70/30/2MA/4NC sample due to exfoliation of nanoclay. It is well-known that the both the dispersion of filler in the polymer matrix and the interfacial interactions between filler and matrix are key factors for the enhancement of mechanical properties of polymer composites. 17
Conclusion
When EVA/HDPE blend is compatibilized with 2 phr MA-g-PE, crystallinity is reduced but compatibility is enhanced. After the addition of nanoclay, crystallinity is further reduced and compatibility is also enhanced. As OMMT is introduced into the nanocomposites, the value of peak area, melting temperature (T
m), melting enthalpy (ΔH
m) and crystallinity (X
c) of HDPE phase decreases but crystallization temperature (X
c) is increased. Interfacial adhesion of modified EVA/HDPE is better than that of neat EVA/HDPE blend. Interfacial adhesion and dispersion of the particles of nanoclay into modified EVA/HDPE/OMMT nanocomposite is better than that of neat modified EVA/HDPE blend.
Footnotes
Funding
This research received no specific grant from any funding agency in the public, commercial, or not-for-profit sectors.