
Abstract
A method is presented for qualitative assessment of nanoclay dispersion in a polymeric matrix, which is based on the effect of nanoclay dispersion on the thermal stability of polymer/nanoclay (PNC) systems. The method offers a fast, inexpensive macroscopic evaluation of nanoclay dispersion, which can be used for direct comparison of nanoclay dispersion in PNC samples. Using experimental design, it is also possible to discover material or process conditions that lead to desirable nanoclay dispersion. Furthermore, this method can be employed for confirmation purposes in support of other nanoclay dispersion assessment techniques. We proved this finding by means of six different independently obtained pieces of information on the quality of nanoclay dispersion in the samples, which are x-ray diffraction, atomic force microscopy, transmission electron microscopy, gas permeability, as well as mechanical and rheological measurements. We believe this method could be employed to study nanoclay dispersion in thermoset matrices as well, for which utilizing other techniques may be either unfeasible or difficult; therefore, this method could present an alternative for assessing nanoclay dispersion in this class of polymeric materials.
Introduction
Polymer/nanoclay (PNC) nanocomposites have attracted great attention for their academic and industrial significance. There have been unexpected improvements in the mechanical, thermal, and barrier properties of these materials. 1 –3 It is well known that these improvements stem from the extremely small size and high aspect ratio of nanoclay particles, which produce a tremendous amount of matrix/filler interface available for interfacial interactions. These improvements, however, are achievable only after a certain amount of nanoparticles dispersion is attained. Only then, most of polymeric matrix will be located in the vicinity of nanoparticles, forming an interphase with remarkable improved properties. 4 –6
To successfully produce PNC nanocomposites, the development of methods for investigating nanoclay dispersion in polymeric matrix has been proved to be essential. Hence, many attempts have been devoted to the estimation of nanoclay particles dispersion in polymeric matrix. Some well-established morphological studies such as x-ray diffraction (XRD), transmission electron microscopy (TEM), atomic force microscopy (AFM), and scanning electron microscopy have been developed to fulfill this necessity. Furthermore, some other indirect techniques have also been utilized, among which the use of shear thinning exponent from steady-shear rheometry 7 and the extraction of an average particle aspect ratio from gas permeability data 8 or mechanical properties 9 by applying numerical predictions can be mentioned. These methods measure some characteristics or changes in characteristics, which then are related to the state of nanoparticles dispersion inside matrix. Usually, these characteristics are compared with the ones of an unloaded matrix or other PNC systems.
Another characteristic is the thermal stability of PNC systems, which has been proved to be affected by the addition of nanoclay particles. 10 The measurement of this characteristic, by means of thermogravimetric analysis (TGA), is usually carried out in either oxygen or nitrogen atmospheres. The effects of nanoclay addition and also dispersion on the TGA results of PNC systems under oxygen are better studied, mainly because changes in thermal behavior are more evident. On the other hand, under nitrogen, changes in thermal behavior of PNC systems are not very noticeable and seemingly cannot be easily related to the state of nanoclay dispersion inside matrix. 11
In this study, we prove that even these slight changes in thermal stability under nitrogen, if looked at from the right vantage point, follow a trend that can be related to the state of nanoclay dispersion or can be used for comparative study of it. Hence, we used PNC samples from our previous studies on water-assisted melt intercalation which have been prepared under different conditions. 12,13 In our previous studies, we chose material and processing conditions to produce diverse nanoclay dispersion states in the samples. Care was taken, so it can be assumed that the chosen factors do not change the thermal properties of the samples directly but change them through altering nanoclay dispersion; so the changes in the thermal properties of the samples can be solely attributed to the state of nanoparticles dispersion. Considering these, feeding rate and nanoclay modifier type were considered as factors. Feeding rate controls nanoclay dispersion through changing shear stress imposed on and residence time of the materials inside extruder. In the chosen range, feeding rate does not seem to have any perceptible direct effect on matrix thermal behavior. For nanoclay modifiers, we used different types of alkyl ammonium salt (ALAMS) with similar chemical structures to keep the effects of ALAMS types on the thermal properties of the samples minimal. The samples were also prepared at different nanoclay contents to make sure that the trends observed are not dependant on nanoclay content and can be observed over a range of nanoclay loadings.
Another issue to be addressed is that whether the trends acquired from our TGA analysis correlate with other independently obtained information on nanoclay dispersion in the samples. For this reason, we will confirm our TGA observations by means of six different separately obtained data on nanoclay dispersion from our previous studies. 12,13 In the end, we will justify the observed trends and the effects of the factors on nanoclay dispersion in the samples.
In this study, low-density polyethylene (LDPE)/linear LDPE (LLDPE) blend was used as polymeric matrix. This blend has gained remarkable attention in packaging film industries. Although these two polymers and their blends are among the most multipurpose polymers, their lack of strength and stiffness along with poor heat resistance are problematic. 14 Hence, nanoclay particles are added to these polymers to eliminate these drawbacks and to prepare materials with improved properties. In this work, polyethylene maleic anhydride (PEMA) was added to the polymer blend to alter its polarity so as to achieve better nanoclay dispersion.
Samples were prepared using slurry-fed melt intercalation process, which is a relatively new method. Its technical challenges notwithstanding, this method has brought about some advantages vis-à-vis conventional melt intercalation. Extensive information as to different types of water-assisted melt intercalation, advantages of each method, and the differences between these methods and conventional melt intercalation can be found in our previous studies and the works of other researchers as well. 12,13,15 –19
For these reasons, in this study, we used LDPE/LLDPE/nanoclay samples produced in a twin-screw extruder equipped with slurry injection system from LDPE/LLDPE blend, PEMA, three different types of ALAMS, and Na+-Montmorillonite (Na+-MMT) dispersed in water to prove that the thermal behavior of the samples under nitrogen is a function of nanoclay dispersion, so TGA can be used as a tool to compare the degree of nanoclay dispersion in PNC samples. Different feeding rates and ALAMS types were applied to produce samples with different nanoclay dispersion. In order to obtain necessary data from the least number of samples, we used experimental design, among which response surface method was found to be best compatible with this study.
Experimental
Material
LDPE (2101TN47) was kindly provided by Laleh Petrochemical Co. (Mahshahr, Khuzestan, Iran). LLDPE (0209AA) was purchased from Amirkabir Petrochemical Co. (Mahshahr, Khuzestan, Iran). Maleic anhydride modified LLDPE (PEMA, Orevac®18302 N) with a maleic anhydride content of 0.2 wt% was supplied by Arkema Inc. (Paris, France) to be used as compatibilizer. Table 1 summarizes melt flow index (MFI) and density for LDPE, LLDPE, and PEMA. Na+-MMT (Cloisite® Na+) was purchased from Southern Clay Products (Gonzales, Texas, USA). The cation exchange capacity for Na+-MMT was 95 meq/100 g. ALAMSs including octadecyl trimethyl ammonium chloride (OTAC), dodecyl trimethyl ammonium chloride (DTAC), and dodecyl trimethyl ammonium bromide (DTAB) were purchased from Xiamen Pioneer Technology Inc. (Xiamen, Fujian, China). Figure 1 shows the chemical structure of the ALAMSs. All the materials were used as received.
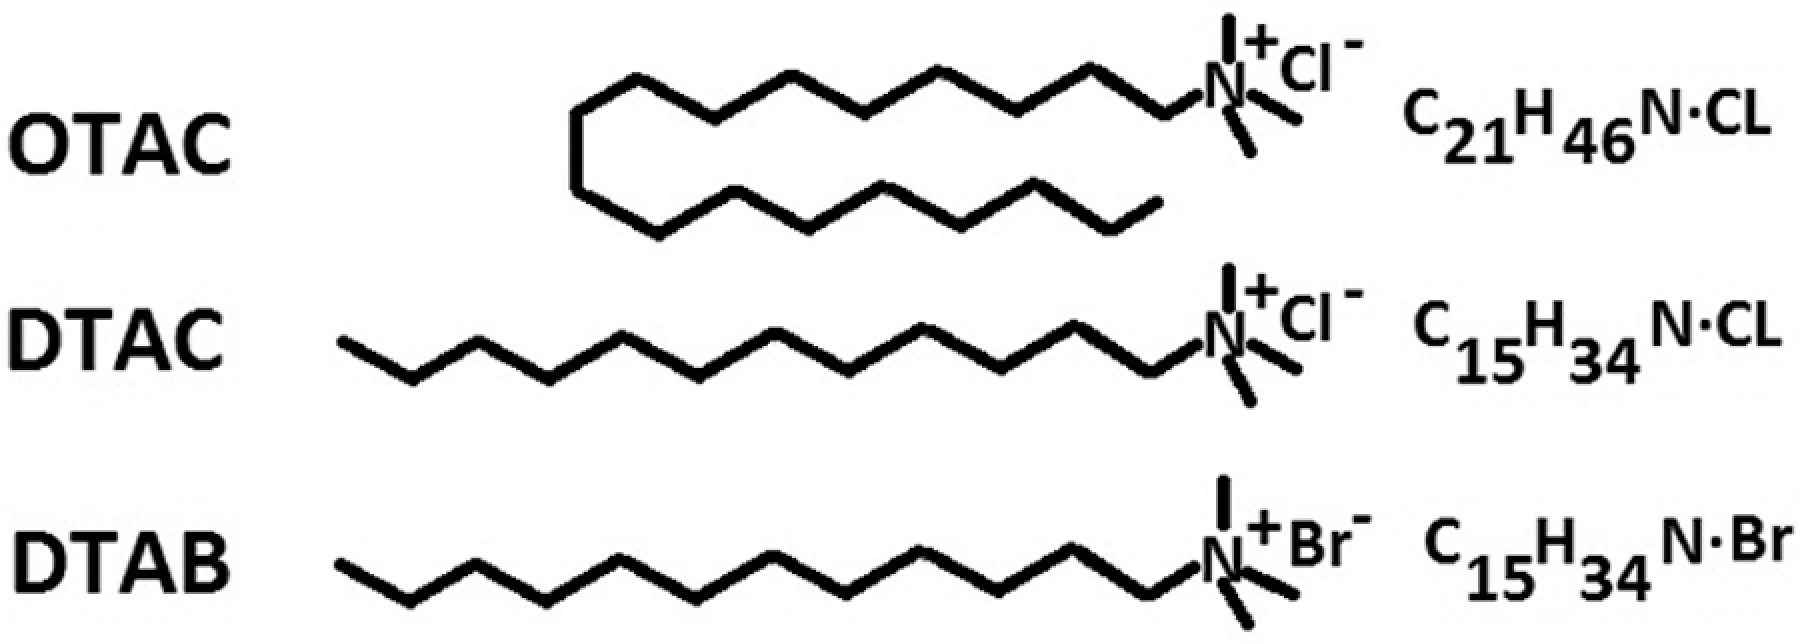
Chemical structure of the alkyl ammonium salt types.
MFI and density for LDPE, LLDPE, and PEMA.
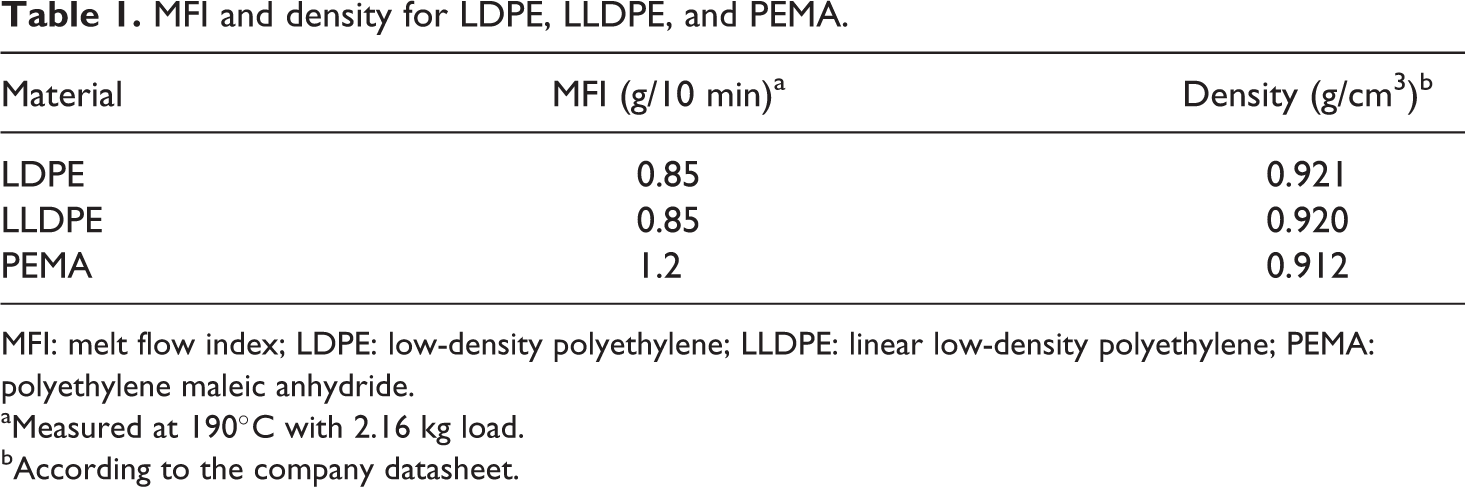
MFI: melt flow index; LDPE: low-density polyethylene; LLDPE: linear low-density polyethylene; PEMA: polyethylene maleic anhydride.
aMeasured at 190°C with 2.16 kg load.
bAccording to the company datasheet.
Design of experiments
Response surface methods are used to examine the relationship between one or more response variables and a set of factors. These methods are often employed after ‘vital few’ controllable factors are identified. In addition to process optimization, which is not discussed in this article, these methods enable us to approximate a continuous surface from discrete results. This will help us to integrate the effects of two factors into a three-dimensional plot, making it easier to observe trends and possible to detect interactions between factors. Among different response surface methods, Box–Behnken method was found to be best compatible with our experimental criteria. 20 –23
The properties used as responses include temperatures at 2%, 10%, 50%, and 90% weight loss. Also, d-spacing of nanoparticles in the samples, reduction in oxygen permeability, tensile modulus increase, and shear-thinning exponent of the samples obtained from our previous studies are considered as responses as well to confirm the TGA data. A quadratic model was used to approximate the responses continuously. Throughout this article, samples will be named the way below: The letters indicate the ALAMS type. OC, DC, and DB will stand for OTAC, DTAC, and DTAB, respectively. The figure on the left-hand side of the forward slash will represent the clay content in wt%. The figure on the right-hand side of the forward slash will represent the feeding rate in kg/h.
Note: Samples No. 7, 9, and 11 have exactly the same design and are for reproducibility analysis. The extra figure that is added to the end of their names is simply for distinction.
Example: DB5/1.5 is the name of the sample that contains 5 wt% nanoclay and has been prepared at 1.5 kg/h feeding rate with DTAB as nanoclay modifier.
The full list of the samples and their compositions is gathered in Table 2.
Samples design.
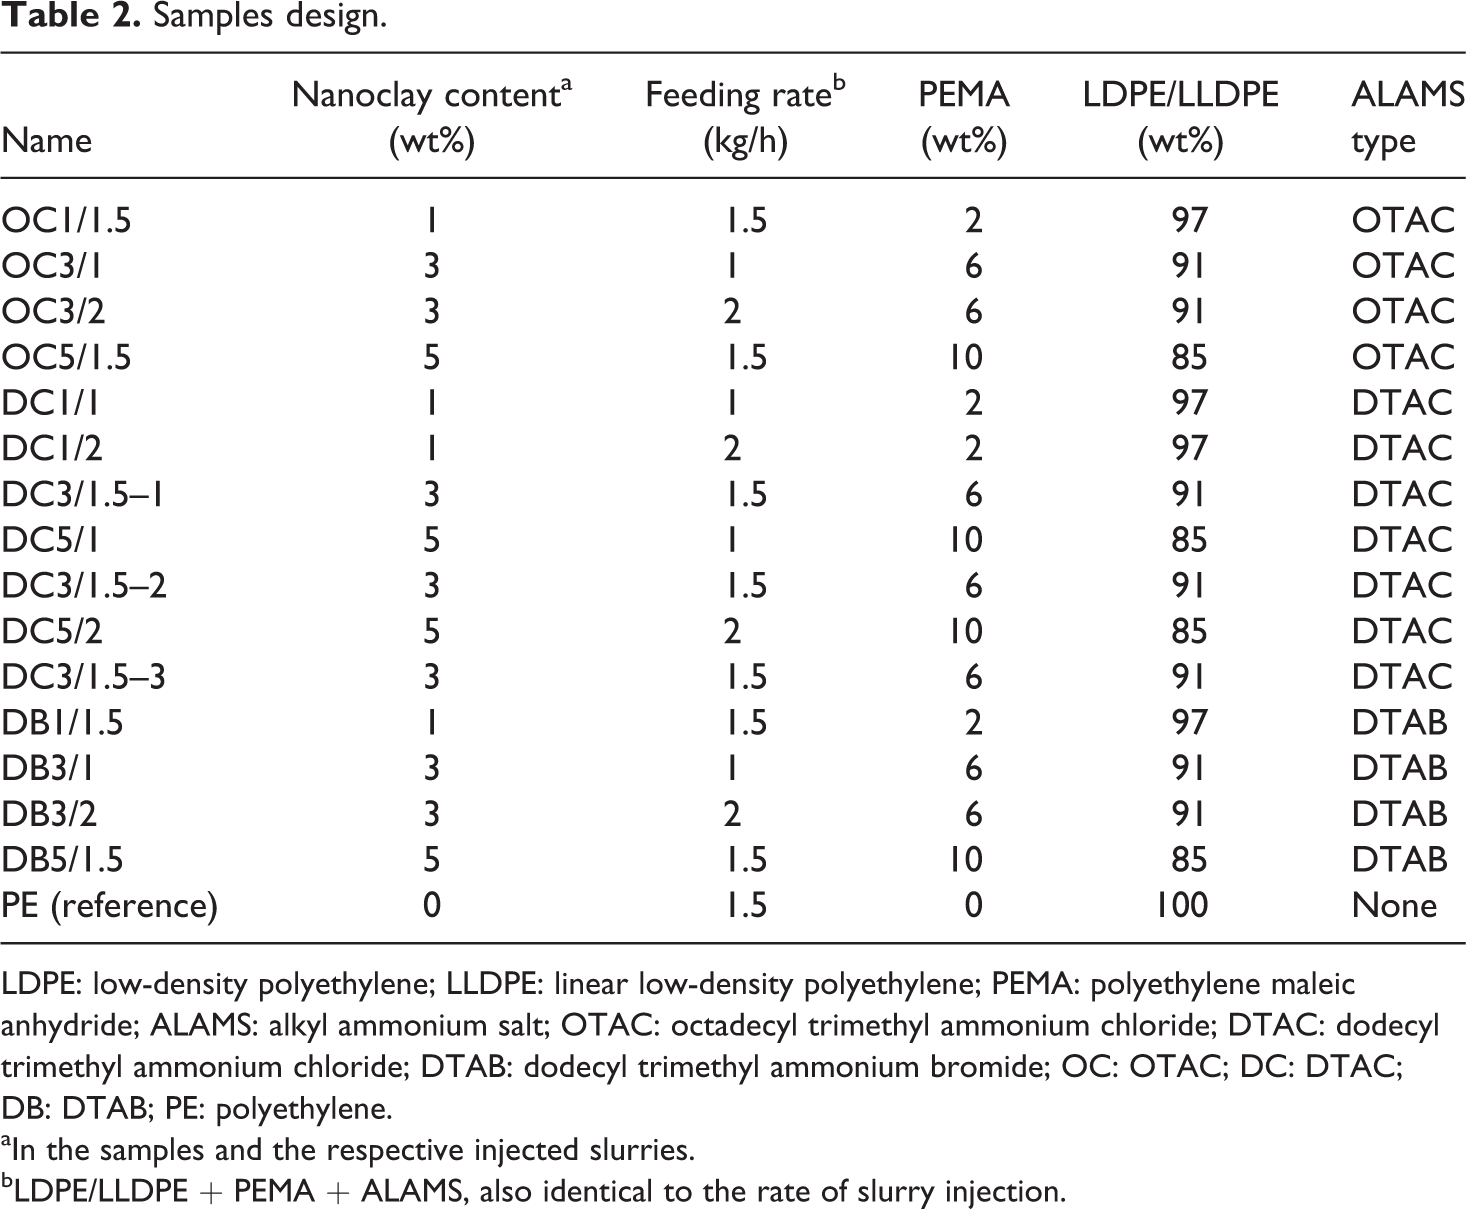
LDPE: low-density polyethylene; LLDPE: linear low-density polyethylene; PEMA: polyethylene maleic anhydride; ALAMS: alkyl ammonium salt; OTAC: octadecyl trimethyl ammonium chloride; DTAC: dodecyl trimethyl ammonium chloride; DTAB: dodecyl trimethyl ammonium bromide; OC: OTAC; DC: DTAC; DB: DTAB; PE: polyethylene.
aIn the samples and the respective injected slurries.
bLDPE/LLDPE + PEMA + ALAMS, also identical to the rate of slurry injection.
Preparation of the samples using nanoclay slurry
Nanoclay slurry was prepared by dispersing Na+-MMT powder into distilled water using an overhead mechanical stirrer for 30, 60, and 90 min for 1, 3, and 5 wt% nanoclay contents, respectively. During the process, a magnetic stirrer was employed to prevent the slurry form from being precipitated.
A lab-scale corotating intermeshing twin-screw extruder from Brabender DSE25 (Duisburg, Germany) was used to prepare samples. The screw diameter was 2.5 cm, its length/diameter was 32, and the distance between the two axes was 20.87 mm. Figure 2 shows the screw configuration and the order of mixing according to which the samples were prepared. LDPE/LLDPE uniform mixture with 60:40 ratio together with PEMA was added to the extruder through hopper using a granule feeder. ALAMS was first homogenously diluted in LDPE/LLDPE (60:40) powder and then added to the extruder through hopper using a powder feeder. The ratio of ALAMS to nanoclay equivalent was kept at 1.5:1. Because nanoclay content in the slurries and their respective samples were equal, the slurry injection rate was set equal to its respective feeding rate. The screw rotation speed was kept at 200 r/min. Temperature profile within the extruder for zones one to six was kept at 160, 170, 180, 185, 185, and 180°C, respectively. The water was removed by vacuum in degassing section. The obtained strands were then pelletized.
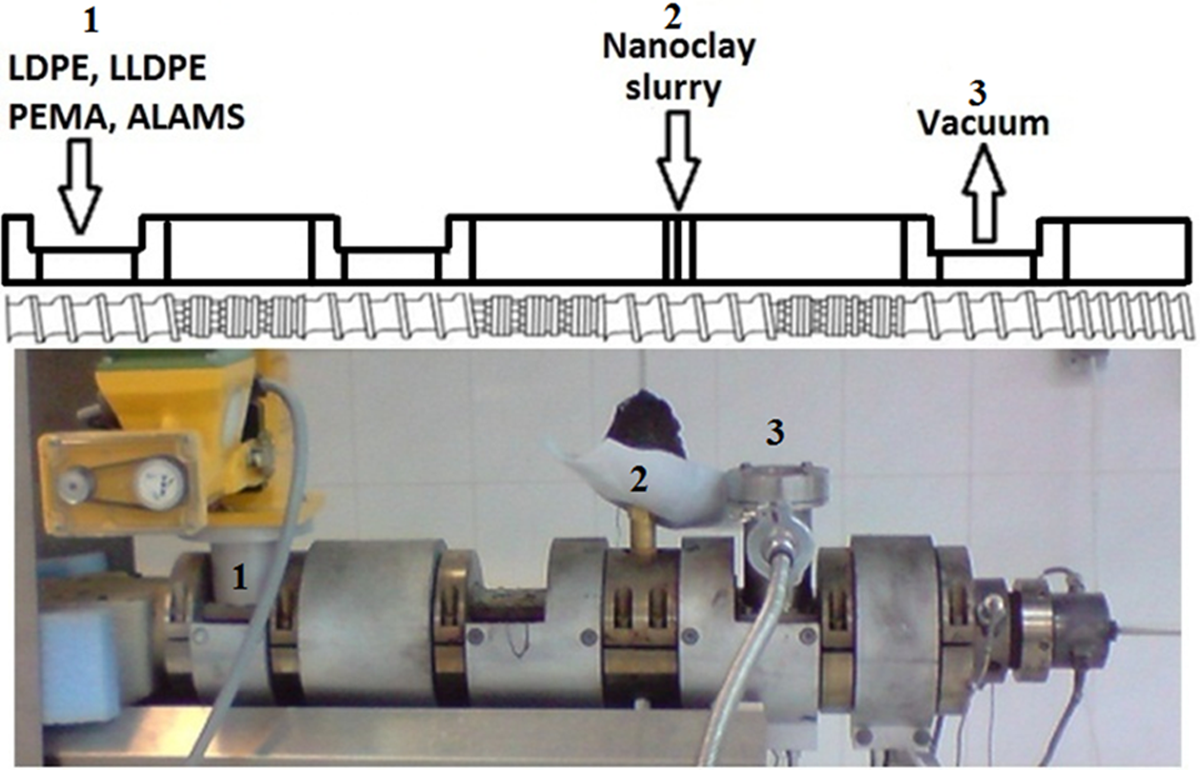
Schematic configuration of the screw and the order of mixing of the materials (top); the actual twin-screw extruder during sample preparation process (bottom). 12
Characterization
TGA was performed on a Perkin Elmer Pyris-1 (USA) instrument under nitrogen atmosphere at a flow rate of 20 mL/s. Samples were heated from 50 to 600°C at a heating rate of 10°C/min.
XRD measurements were carried out using a Holland Philips Xpert x-ray diffractometer with Co Kα radiation (λ = 1.789 Å) generated at 40 kV and 30 mA, scanning from 1° to 12° at a step value of 0.02° per second at room temperature. The compression-molded sheets at 190°C with 2 mm thickness were used for XRD studies.
Oxygen permeability of the samples was measured using an apparatus illustrated in Figure 3. The oxygen pressure was set at 3 bars and the compression-molded films thickness was 350 ± 30 µm. The oxygen purity was 99.99%. The rate of oxygen permeation was recorded during steady-state phase of the permeation process, according to P = d (J/Δp), where J is the gas volumetric flow rate per unit area of the film, d is the thickness of the film, Δp is the pressure difference across the film, and P is permeability. To reduce the error, the permeability of each sample was then normalized by the permeability of the pure blend and then reported as oxygen permeability reduction in percentage.
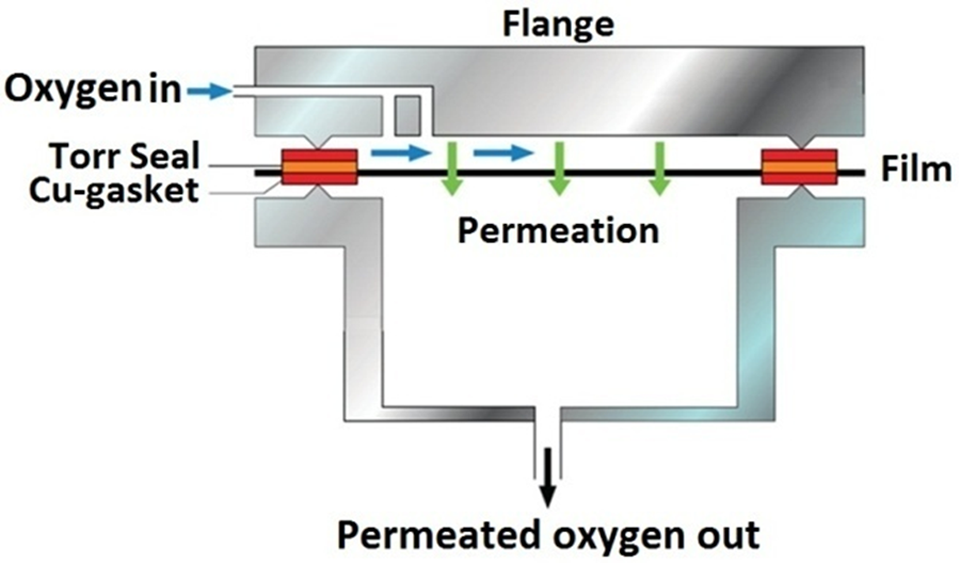
The schematic cross-section view of the apparatus used for oxygen permeability measurements. 12
Tensile test measurements were performed on compression-molded sheets at room temperature using a tensile test machine (Z050, Zwick, Germany), based on ASTM-D638, on dumbbell-shaped tensile bars of type I with a cross-head speed of 50 mm/min. At least three specimens of each sample were tested to establish testing reproducibility. For the sake of better response surface analysis, the average values of the mechanical testing of the samples were normalized by the value of the pure polyethylene (PE) blend, reference, and the values are given as tensile modulus increase in percentage. The tensile modulus of the reference was 207 ± 11.55 N/mm2.
Melt-state viscoelastic measurements of the samples were carried out by small amplitude oscillatory frequency sweep mode, using NCR301 (Anton paar, Germany) rheometer, equipped with a 25-mm diameter parallel plate geometry. To ensure that the samples were investigated within linear viscoelastic region, a fixed strain of 1% was used. Rheological tests were performed under nitrogen atmosphere at 190°C with a gap distance of 1 mm.
In our frequency sweep tests, a small amplitude oscillatory shear, γ = γ
0sin(ωt), was applied to the samples. Resulting shear stress was recorded as
then complex viscosity |η*| was measured as a function of angular frequency, ω in the range of 0.05–628 rad/s. To calculate shear-thinning exponents of the samples, power law model was applied to the complex viscosity curves of the samples between the frequency of 0.05 and 0.229 rad/s.
Tapping mode atomic force micrographs were prepared using a Dualscope, DME atomic force microscope (Denmark) equipped with a DS 95-50-E scanner and an alternative current (AC) probe. One of the developments in tapping mode AFM is the use of the changes in phase angle of the cantilever probe to produce a second image, called a phase image or phase contrast image. This image often provides significantly more contrast than the topographic image and has been proved to be sensitive to material surface properties, such as stiffness, viscoelasticity, and chemical composition. In general, changes in phase angle during scanning are related to energy dissipation during tip-sample interaction and can be due to the changes in topography, tip-sample molecular interactions, and deformation at the tip-sample contact. 24,25 In this study, the phase images of the samples were used to study nanoclay dispersion. In order to obtain the phase and height atomic force micrographs, specimens were prepared as compression-molded films with a thickness of less than 400 µm. Measurements were carried out in air under ambient conditions. The phase and height images were recorded simultaneously.
The transmission electron micrographs were obtained using a JEOL 2010F transmission electron microscope operated at an accelerating voltage of 120 kV. TEM samples for particle characterization were cryogenically cut into ultrathin sections (30–50 nm thick) with a diamond knife at a temperature of −40°C using a Reichert-Jung Ultra cut E microtome.
Result
Thermogravimetric analysis
Figure 4 shows TGA thermographs of PE blend (reference) and samples prepared with OTAC (top), DTAC (middle), and DTAB (bottom) under nitrogen. For better clarity, the graphs are plotted between 300 and 500°C temperatures. The established mechanisms for PE pyrolysis involve steps for the formation of free radicals and abstraction of hydrogen from the polymer chains leading to a molecular weight decrease and finally to the formation of volatile products. 26
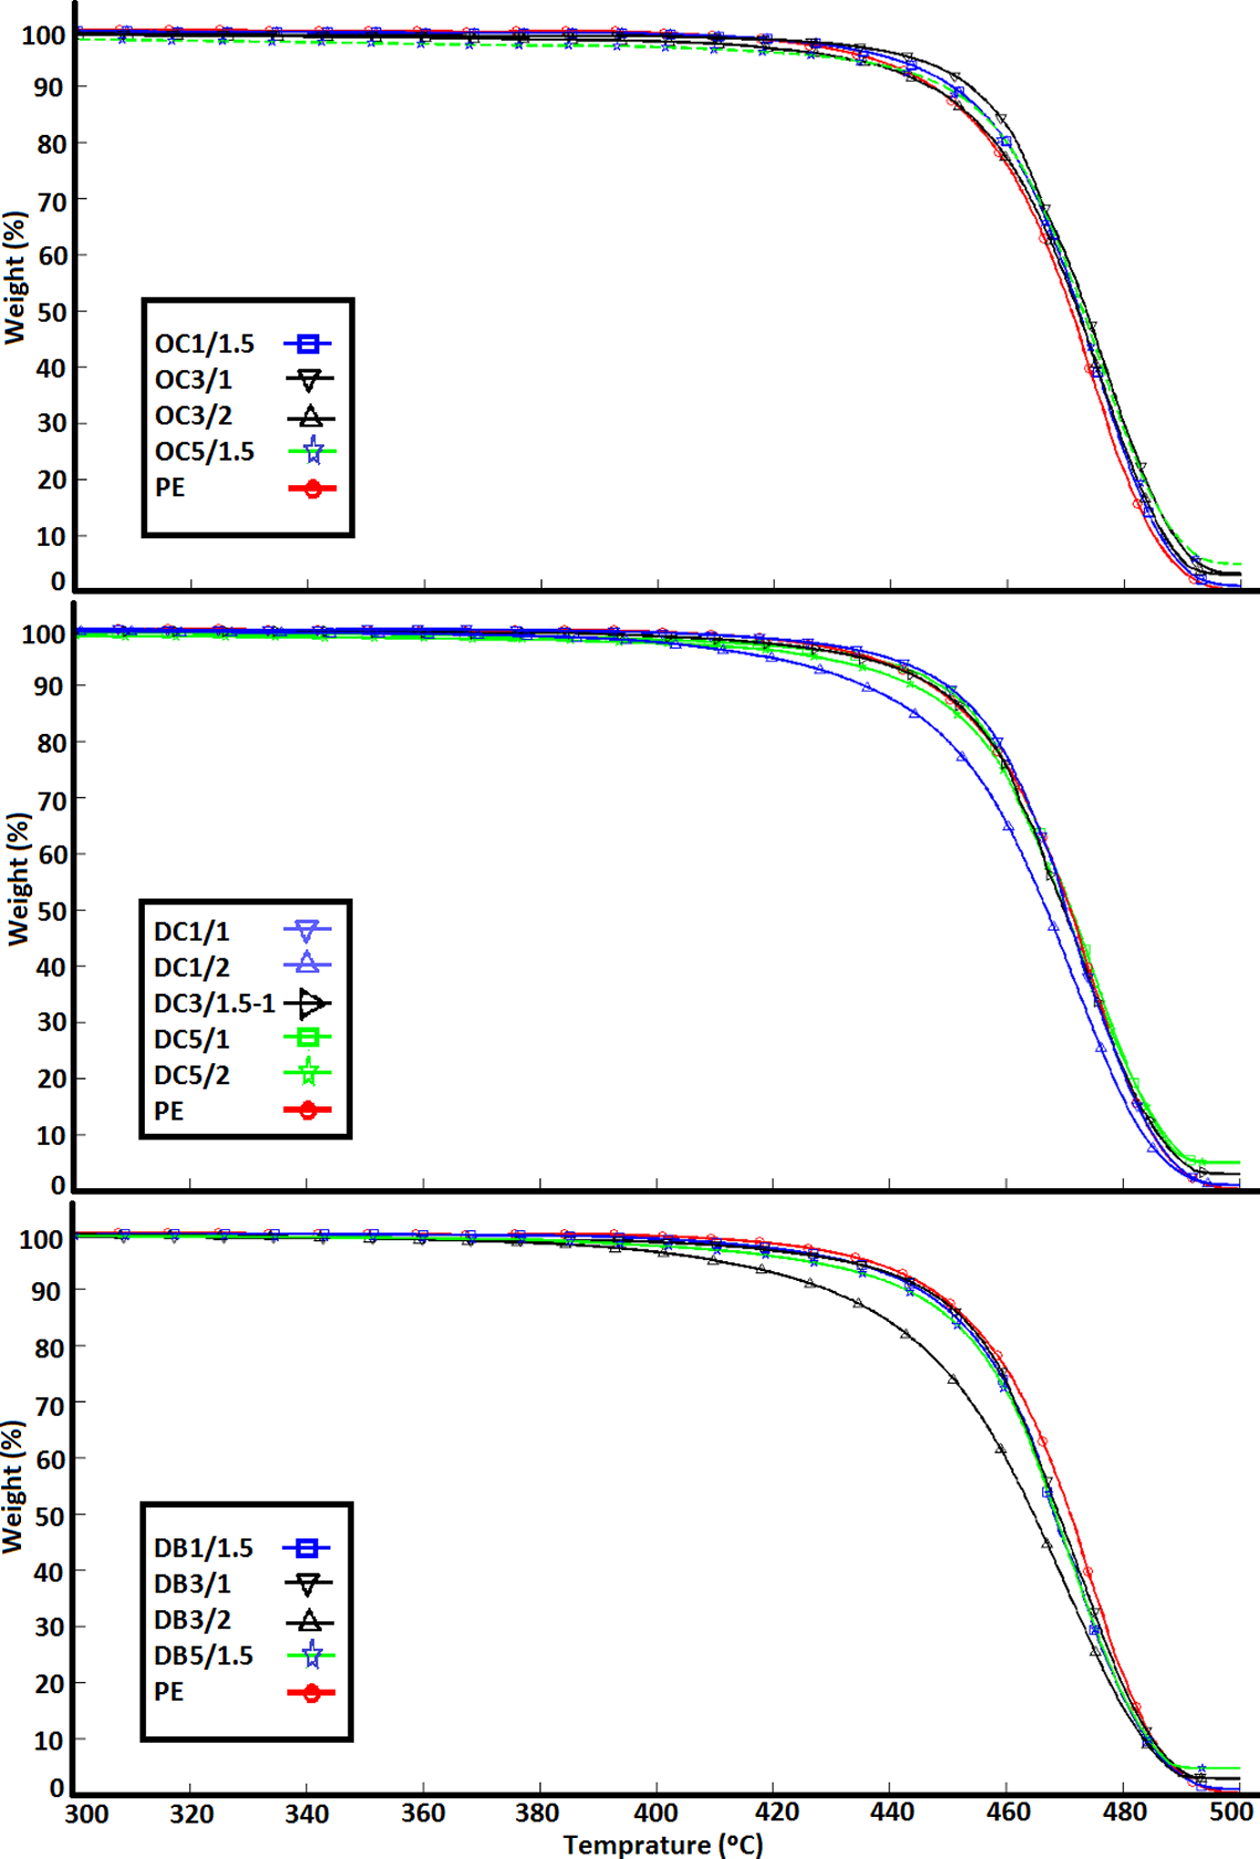
TGA thermographs of composites prepared with OTAC (top), DTAC (middle), and DTAB (bottom). TGA: thermogravimetric analysis; OTAC: octadecyl trimethyl ammonium chloride; DTAC: dodecyl trimethyl ammonium chloride; DTAB: dodecyl trimethyl ammonium bromide.
At the initial stage of degradation (below 400°C), due to Hofmann elimination reaction, 27,28 its products catalytic effect on the degradation of the matrix 29 and finally the clay catalyzed degradation, 30,31 PNC samples degrade faster than unloaded PE. On the other hand, above 450°C, most PNC samples are more stable than unloaded PE. The residues after thermal decomposition at 600°C, corresponding to the inorganic load of the filler, are presented in Table 3. The reason for the inorganic load to be less than the nominal nanoclay content is because nanoclay slurry was sticky, hence, some of it stuck to the hot screw and did not mix with the PE. The data corresponding to T 2% (the temperature at which 2% weight loss occurs), T 10%, T 50%, and T 90% are gathered in Table 3 as well.
TGA weight loss temperatures and residues of the samples.
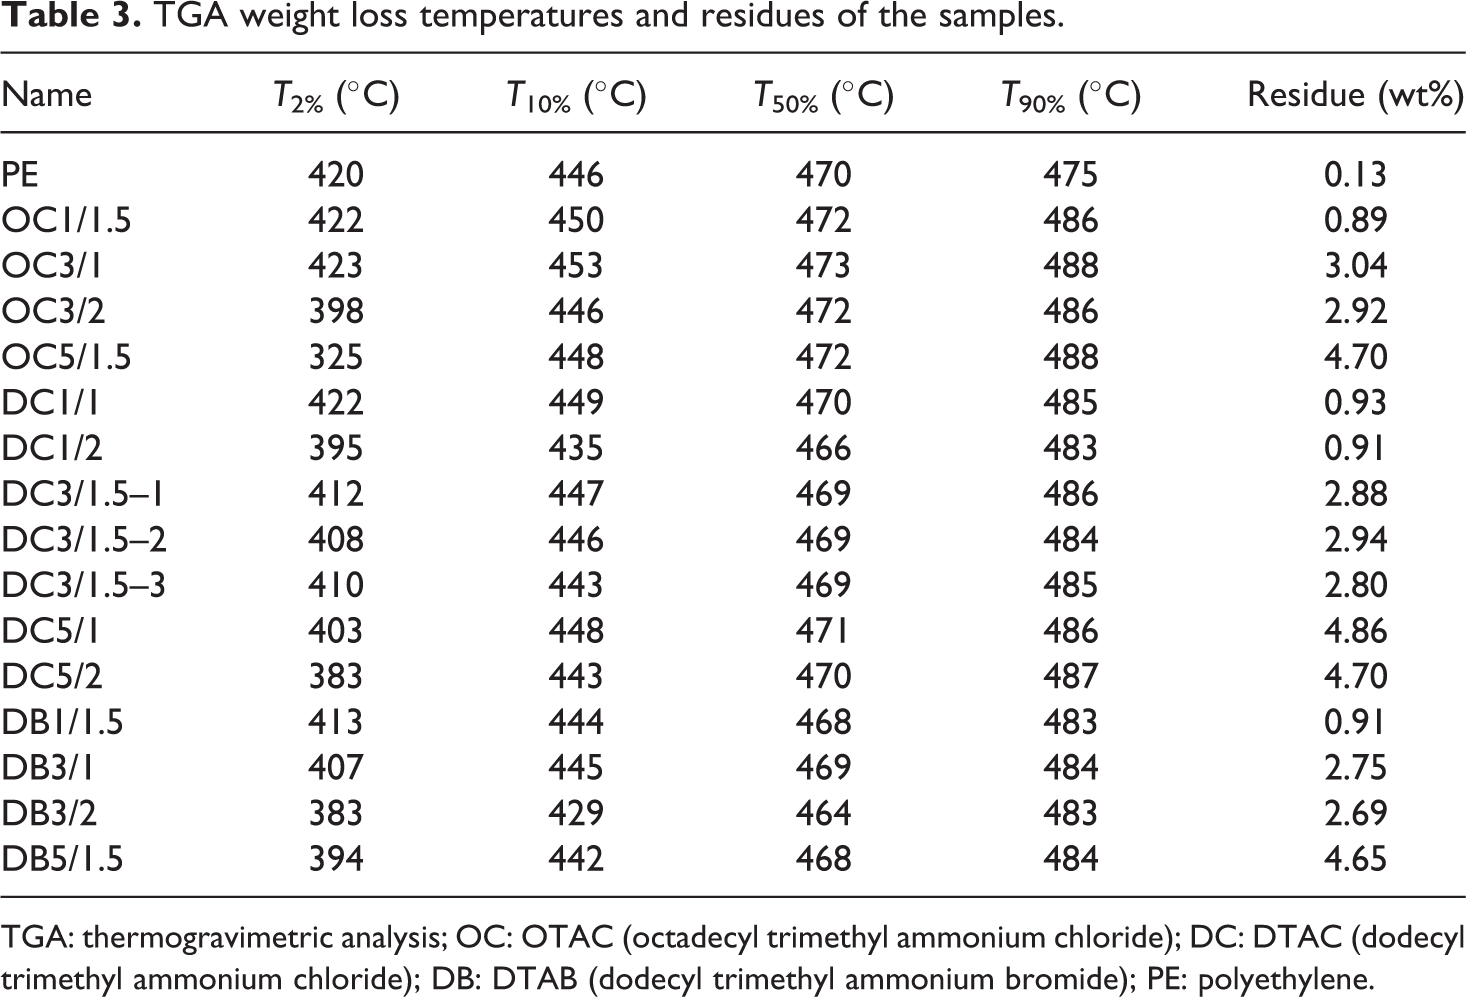
TGA: thermogravimetric analysis; OC: OTAC (octadecyl trimethyl ammonium chloride); DC: DTAC (dodecyl trimethyl ammonium chloride); DB: DTAB (dodecyl trimethyl ammonium bromide); PE: polyethylene.
The addition of nanoclay has a dual effect on the thermal stability of the samples: one is the barrier effect for heat and mass transfer, which should improve the thermal stability; the other is the catalysis effect toward the degradation of the polymer matrix, which would decrease the thermal stability. There are rather contradictory findings, however, as to the way nanoclay dispersion would affect the thermal stability of composites under nitrogen. Marazzatoa et al. 32 have observed that nanocomposites with higher level of dispersion demonstrate lower thermal stability. They concluded that exfoliated nanocomposites have more active catalytic sites than intercalated ones and accordingly they are less thermally stable. On the other hand, Morawiec et al. 33 have pointed out that nanoclay has no effect on the thermal behavior of nanocomposites, notwithstanding its dispersion. Nevertheless, other studies have shown that when nanoclay particles are well dispersed, the barrier effect is predominant, but with the deterioration of the dispersion, the catalyzing effect rapidly rises and becomes dominant, so the thermal stability of nanocomposites decreases 34,35 ; it is likely that the last finding is the rule than the exception.
Still, the improvement of the thermal stability of composites in case of better nanoclay dispersion is not very noticeable under nitrogen. Hence, it is difficult to discern any pattern in the data gathered in Table 3. But, some interesting trends will emerge if we calculate the surfaces of the TGA data and plot them against ALAMS type and feeding rate. Figure 5 shows the surfaces for T 2%, T 10%, T 50%, and T 90% as a function of ALAMS type and feeding rate. These surfaces can be plotted for any nanoclay content; however, the overall trends remain the same. Hence, we just plotted the graphs for 3 wt% nanoclay content. Except for Figure 5(a), which shows T 2% surface, other graphs demonstrate a similar trend, which indicate higher thermal stability at longer ALAMS chain size. We believe that because the chemical composition of the ALAMS types were similar, the difference in the thermal stability of the samples, observed in Figures 5(b) to (d), does not arise from the ALAMS type chemical composition and thermal stability per se, but rather from the effects that the ALAMSs have on the dispersion of nanoparticles. Moreover, it is highly probable that the change in feeding rate has no direct effect on the thermal stability of the samples. Therefore, the thermal stability increase observed with decreasing feeding rate arises from improvement in nanoclay dispersion. Based on the notion that nanoparticles with better dispersion cause more effective mass and heat barriers to form, which leads to higher thermal stability, we concluded that higher thermal stability observed in the samples can be attributed to better nanoclay dispersion. Hence, the samples prepared with OTAC are highly expected to have better nanoclay dispersion; similarly, feeding rate increase has a negative effect on the dispersion of the nanoparticles. In the end, it should be noted that T 2% data did not demonstrate the same trend as other weight loss temperatures and were not considered for nanoclay dispersion assessment. In the next section, we utilize other methods to verify the TGA findings.
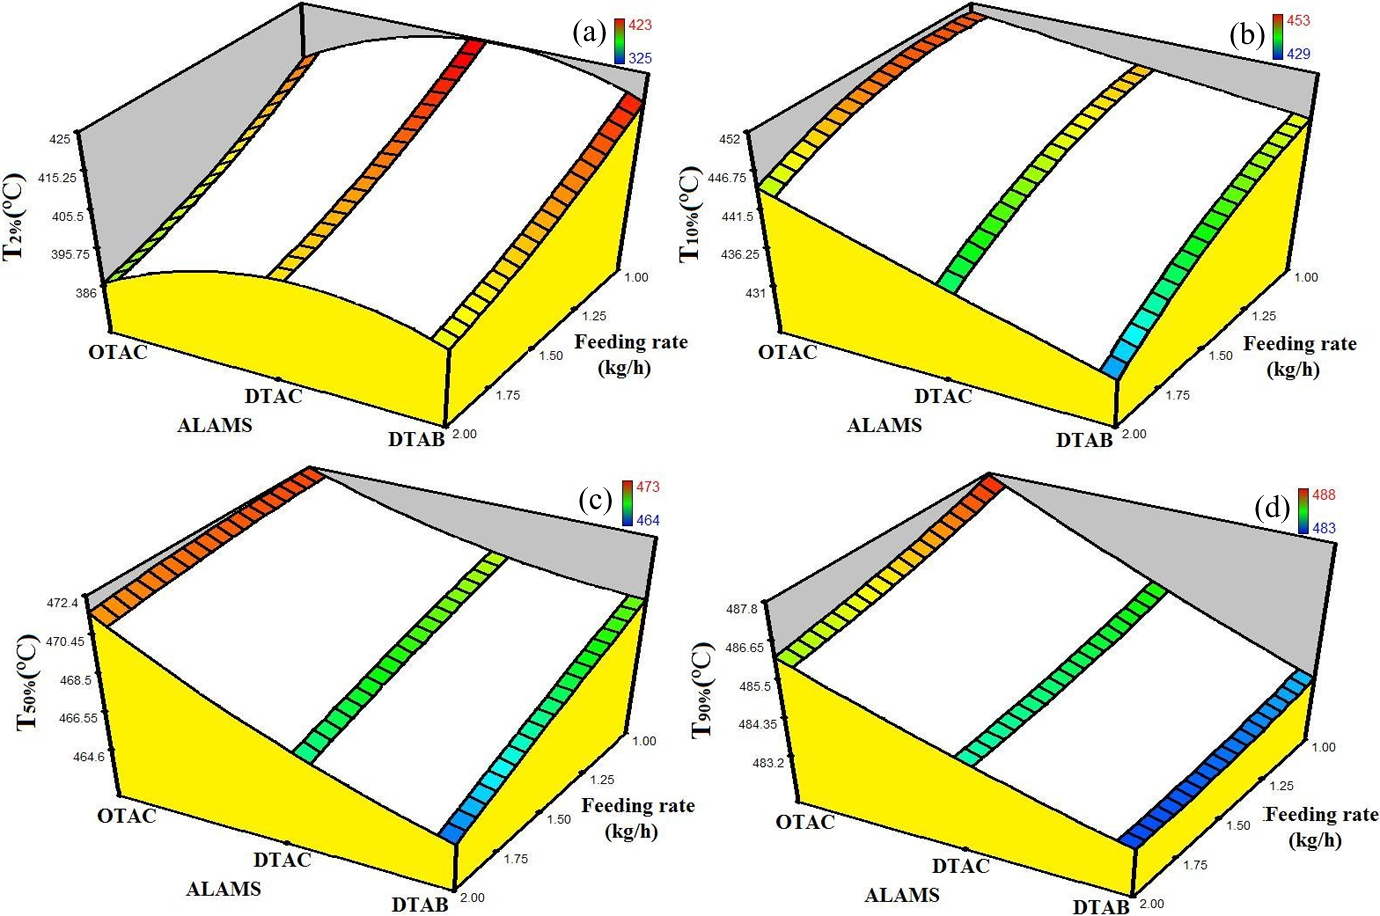
Response surfaces for (a) T2%, (b) T10%, (c) T50%, and (d) T90% for samples prepared with different ALAMS types as a function feeding rate. The graphs are plotted for 3 wt% nanoclay content. For clarification purposes, the graphs underwent a trivial manual alteration. ALAMS: alkyl ammonium salt.
TGA verification
XRD is one of the most popular methods for assessing nanoclay dispersion in polymeric matrix. 36,37 It quantifies gallery heights between adjacent nanoclay platelets and proves the increase in this distance as matrix polymer intercalates between the galleries. Better nanoclay dispersion manifests itself in the shift of XRD peak toward lower angles and ultimately its disappearance. The d-spacing results obtained from XRD test performed in our previous studies are gathered in Table 4; higher d-spacing value is a sign of better nanoclay dispersion. However, XRD does not provide a conclusive proof of nanoparticles dispersion in the matrix because the results could be distorted by other changes of physical state of the nanoclay, which could be responsible for the loss of layer periodicity or XRD signal to noise ratio. Therefore, XRD results should be accompanied by other data.
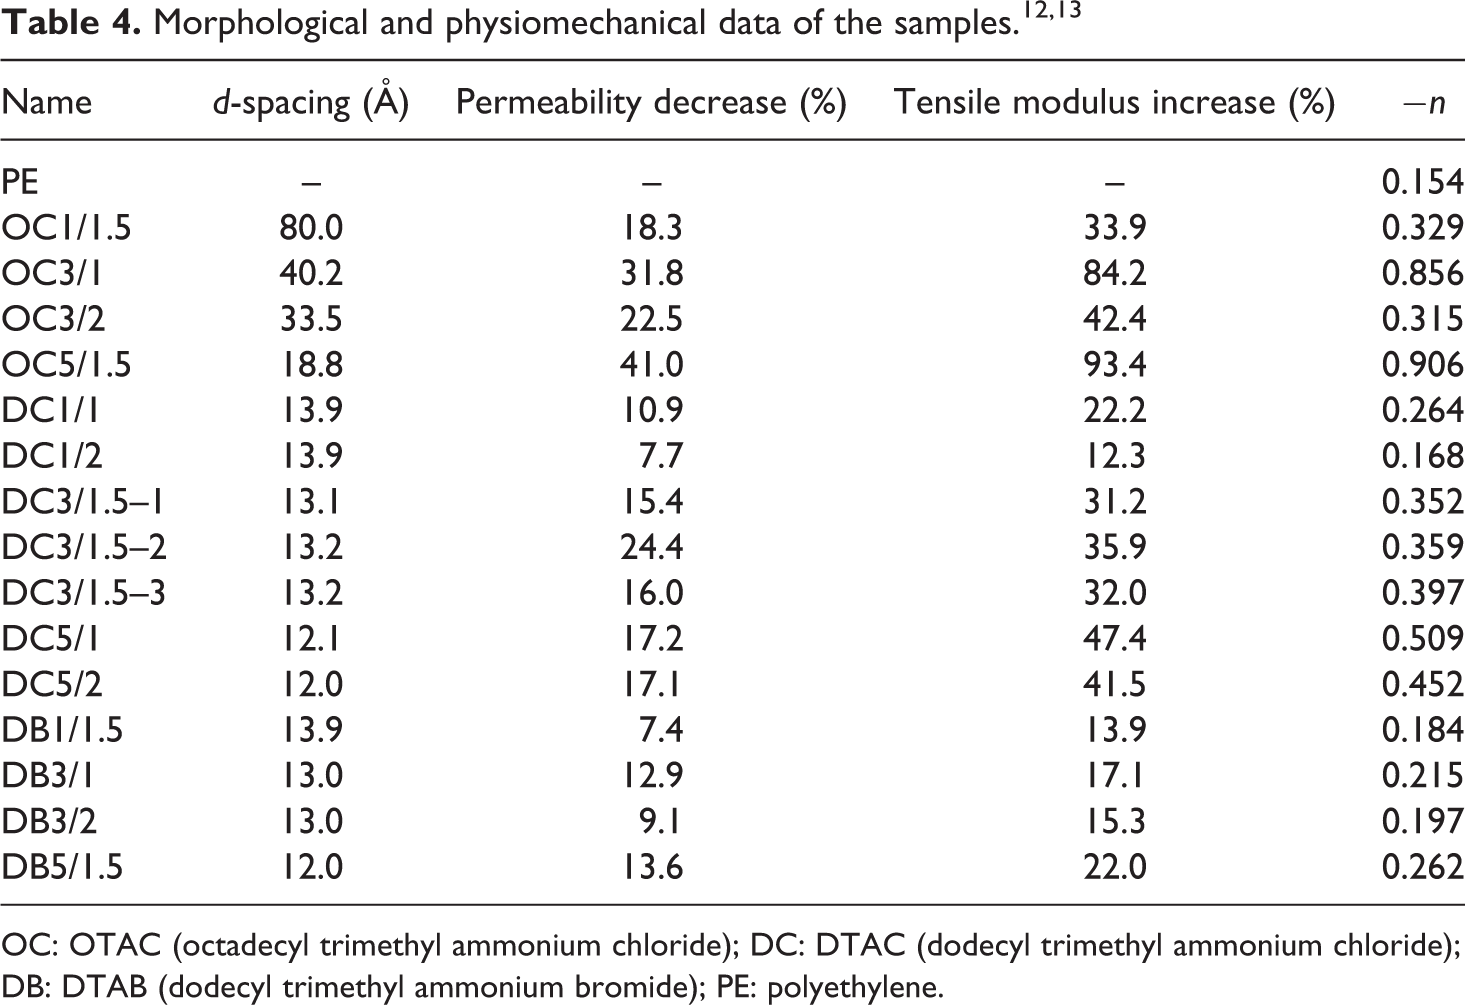
OC: OTAC (octadecyl trimethyl ammonium chloride); DC: DTAC (dodecyl trimethyl ammonium chloride); DB: DTAB (dodecyl trimethyl ammonium bromide); PE: polyethylene.
Another effect of nanoclay particles on polymeric matrix is reduction in gas permeability. The reason for this reduction is the decrease in the solubility in PNC systems due to the reduced polymer matrix volume, as well as a forced tortuous pathway for permeant transversing the sample due to the existence of impermeable nanoclay layers. However, the reduction in diffusion coefficient is higher than that of the solubility coefficient. Because, the volume fraction of nanoplatelets is low and, thus, the reduction in the matrix volume is small. The major factor, then, is the tortuosity, which is governed by three main factors: the volume fraction of the nanoplatelets, their orientation relative to the diffusion direction, and their aspect ratio. 38 Therefore, at a given nanoclay content and for films prepared by the same process, that is, compression molding, gas permeability can be directly connected to the aspect ratio which is a function of nanoparticles degree of dispersion. 39 Therefore, at higher degrees of nanoclay dispersion, gas permeability decreases. Table 4 contains reduction in oxygen permeability values of the samples obtained from our previous studies in percentage.
Mechanical properties of PNC systems are highly related to the microstructure of nanoparticles within the matrix, which in turn is related to the amount of nanoclay dispersion. As a result, mechanical properties, especially tensile modulus, have been employed for indirect assessment of nanoclay dispersion in the matrix. In general, the introduction of nanoclay particles increases the tensile modulus. At a given nanoclay content, this increase becomes more evident as nanoclay dispersion improves. 40 –42 Table 4 summarizes data of the tensile modulus increase of the samples obtained from our previous studies in percentage.
Moreover, it has been observed that the complex viscosity of PNC systems exhibit an increase, which is a characteristic of shear-thinning behavior. 43 It has been suggested that this behavior is the result of the alignment of silicate layers toward the direction of flow at higher shear rates. Such observations support the percolation argument used in the case of nanocomposite rheological behavior under low shear. Shear-thinning behavior is not exhibited by macrocomposites and unloaded polymers, and these materials demonstrate Newtonian Plateau in viscosity curves, at low frequencies. Therefore, for a given weight fraction of nanoclay, better nanoclay dispersion manifests itself in an increase in the shear-thinning exponent at low frequencies. For semiquantitative investigation of nanoparticles dispersion, shear-thinning exponent values in the low-frequency region from our previous studies are calculated and listed in Table 4. Several authors have used this parameter to explain the rheological behavior of PNC composites in the low-frequency region and probe the degree of nanoclay dispersion. 44 –48
Figure 6 shows surfaces of d-spacing, reduction in oxygen permeability, tensile modulus increase, and shear-tinning exponent for the samples prepared with different ALAMS types, as a function of feeding rate. The general trend observed in these graphs is not a function of nanoclay loading; so we just plotted the graphs for 3 wt% nanoclay content. It can be seen that OTAC-modified samples show higher d-spacing, reduction in oxygen permeability, tensile modulus, and shear-thinning exponent, all of which suggesting that OTAC-modified samples possess better nanoclay dispersion than other samples. Also, feeding rate increase has a damaging effect on nanoclay dispersion inside the polymeric matrix. These findings are remarkably consistent with the TGA findings, T 2% excluded.
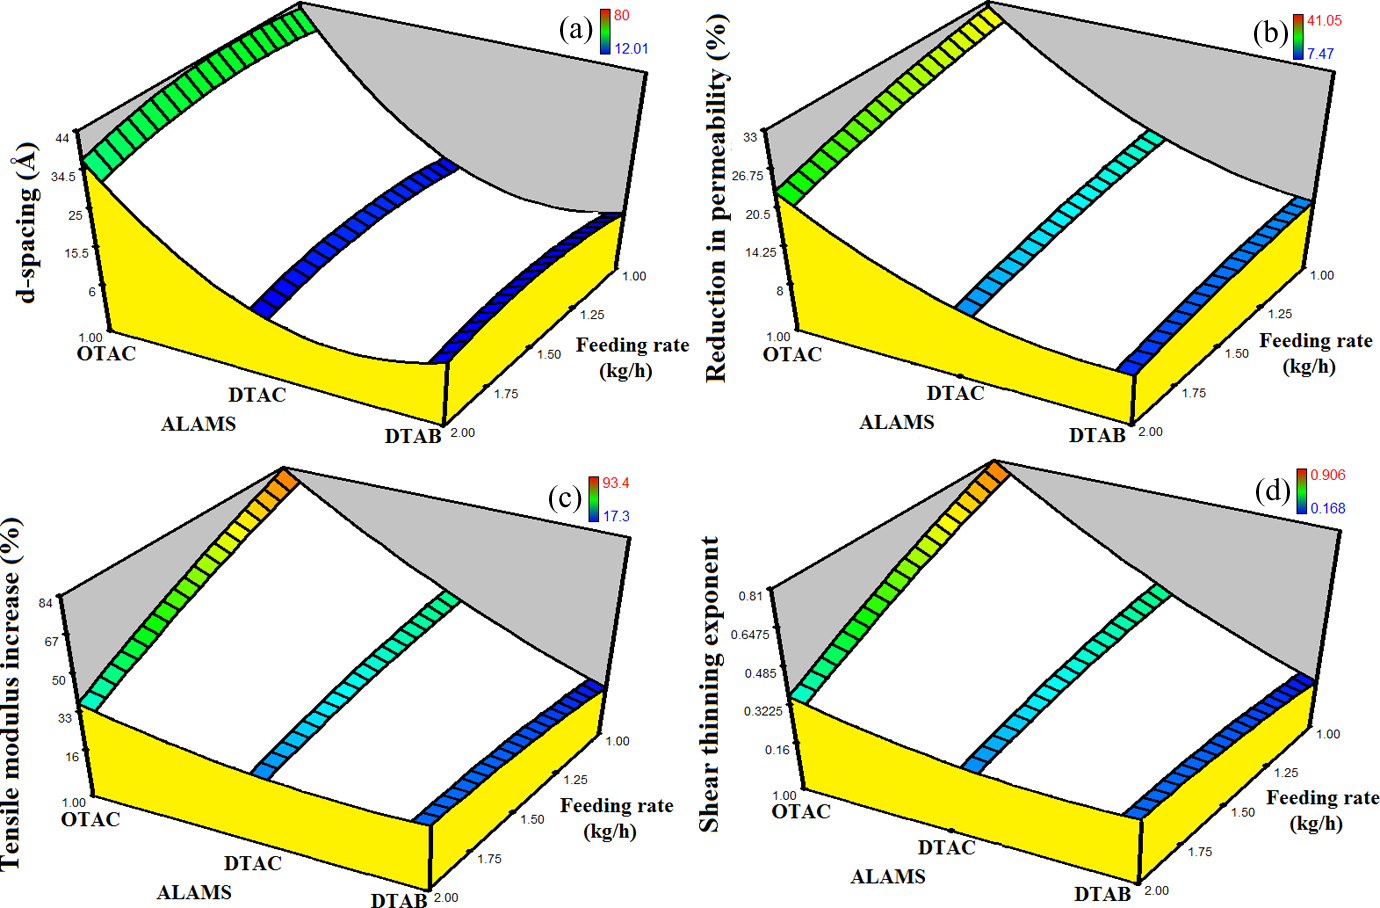
Response surfaces for (a) d-spacing, (b) reduction in permeability, (c) tensile modulus increase, and (d) shear-thinning exponent for samples prepared with different ALAMS types as a function of feeding rate. The graphs are plotted for 3 wt% clay content. For clarification purposes, the graphs underwent a trivial manual alteration. ALAMS: alkyl ammonium salt.
AFM imaging allows a direct visual observation of the silicate dispersion within a polymeric matrix. To further corroborate our TGA findings as to the effect of ALAMS type on the dispersion of nanoparticles, AFM micrographs of OC1/1.5 and DB1/1.5 are presented in Figure 7. In these micrographs, nanoclays can be seen as yellowish white regions. As it can be seen in case of OC1/1.5, nanoclay particles are gathered in smaller aggregates, while these aggregates are quite larger for DB1/1.5. It is also possible to measure specific nanoclay stacks sizes. Figure 7 also shows the size of two arbitrarily selected nanoclay stacks for each sample, which are obtained from the voltage spectra of the respective selections. Because the surface of the samples could distort the information obtained from the phase mode micrograph, we did not choose the stacks from the areas inside the ovals to eliminate this possibility, see the height images. For comparison purposes, the width at the voltage of −3 is considered as a measure of stacks size. In this figure, it can be observed that the sizes of the selected stacks in DB1/1.5 are 4–13 times bigger than the sizes of the selected stacks in OC1/1.5.
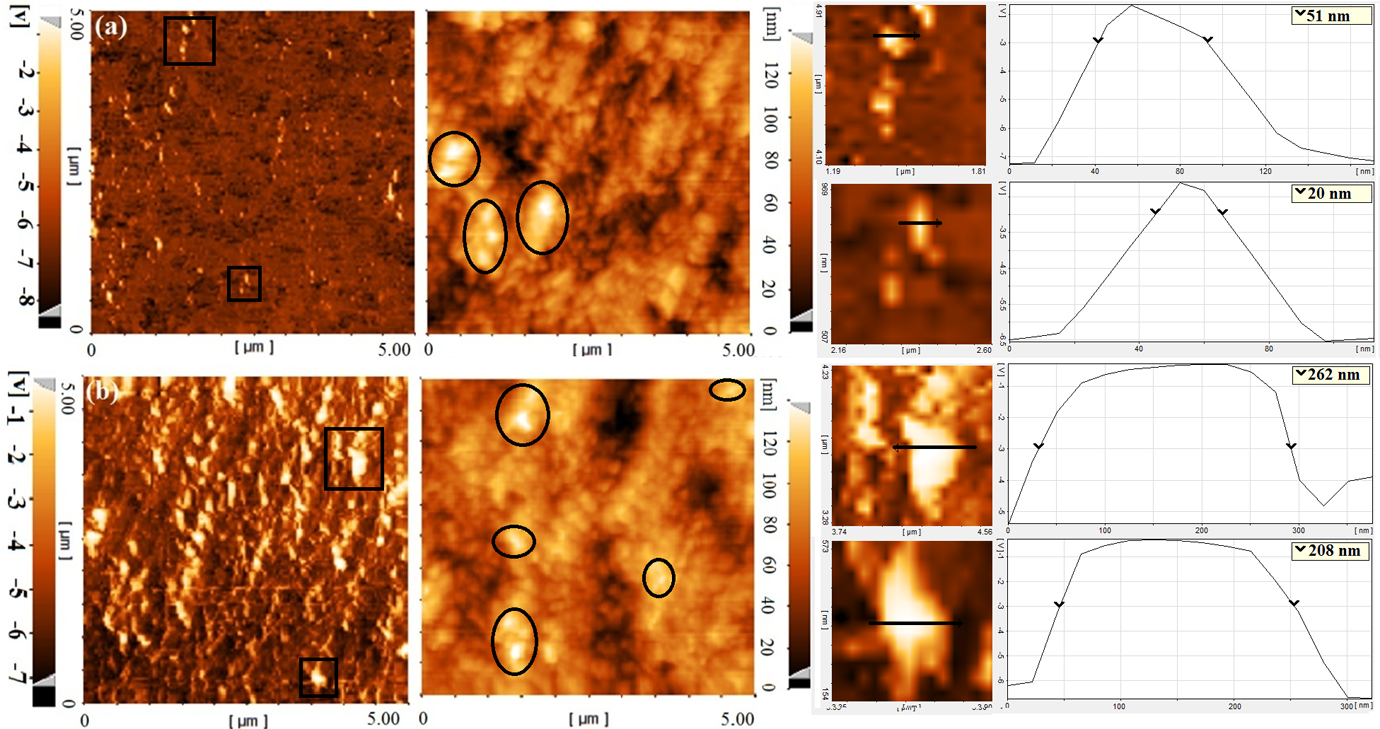
AFM micrographs of OC1/1.5 (a series) and DB1/1.5 (b series). (1) phase images, (2) height images, (3, 5) zoomed-in phase images, and (4, 6) respective voltage spectra over the drawn lines. 13 AFM: atomic force microscopy; OC: OTAC (octadecyl trimethyl ammonium chloride); DB: DTAB (dodecyl trimethyl ammonium bromide).
Finally, to additionally substantiate our TGA findings as to the effect of feeding rate on the dispersion of nanoparticles, transmission electron micrographs of OC3/1 and OC3/2 are presented in Figure 8. The dark lines in Figure 8 are the cross-sections of silicate layers. It can be clearly seen that an increase in feeding rate has a negative effect on nanoclay dispersion in the polymeric matrix.
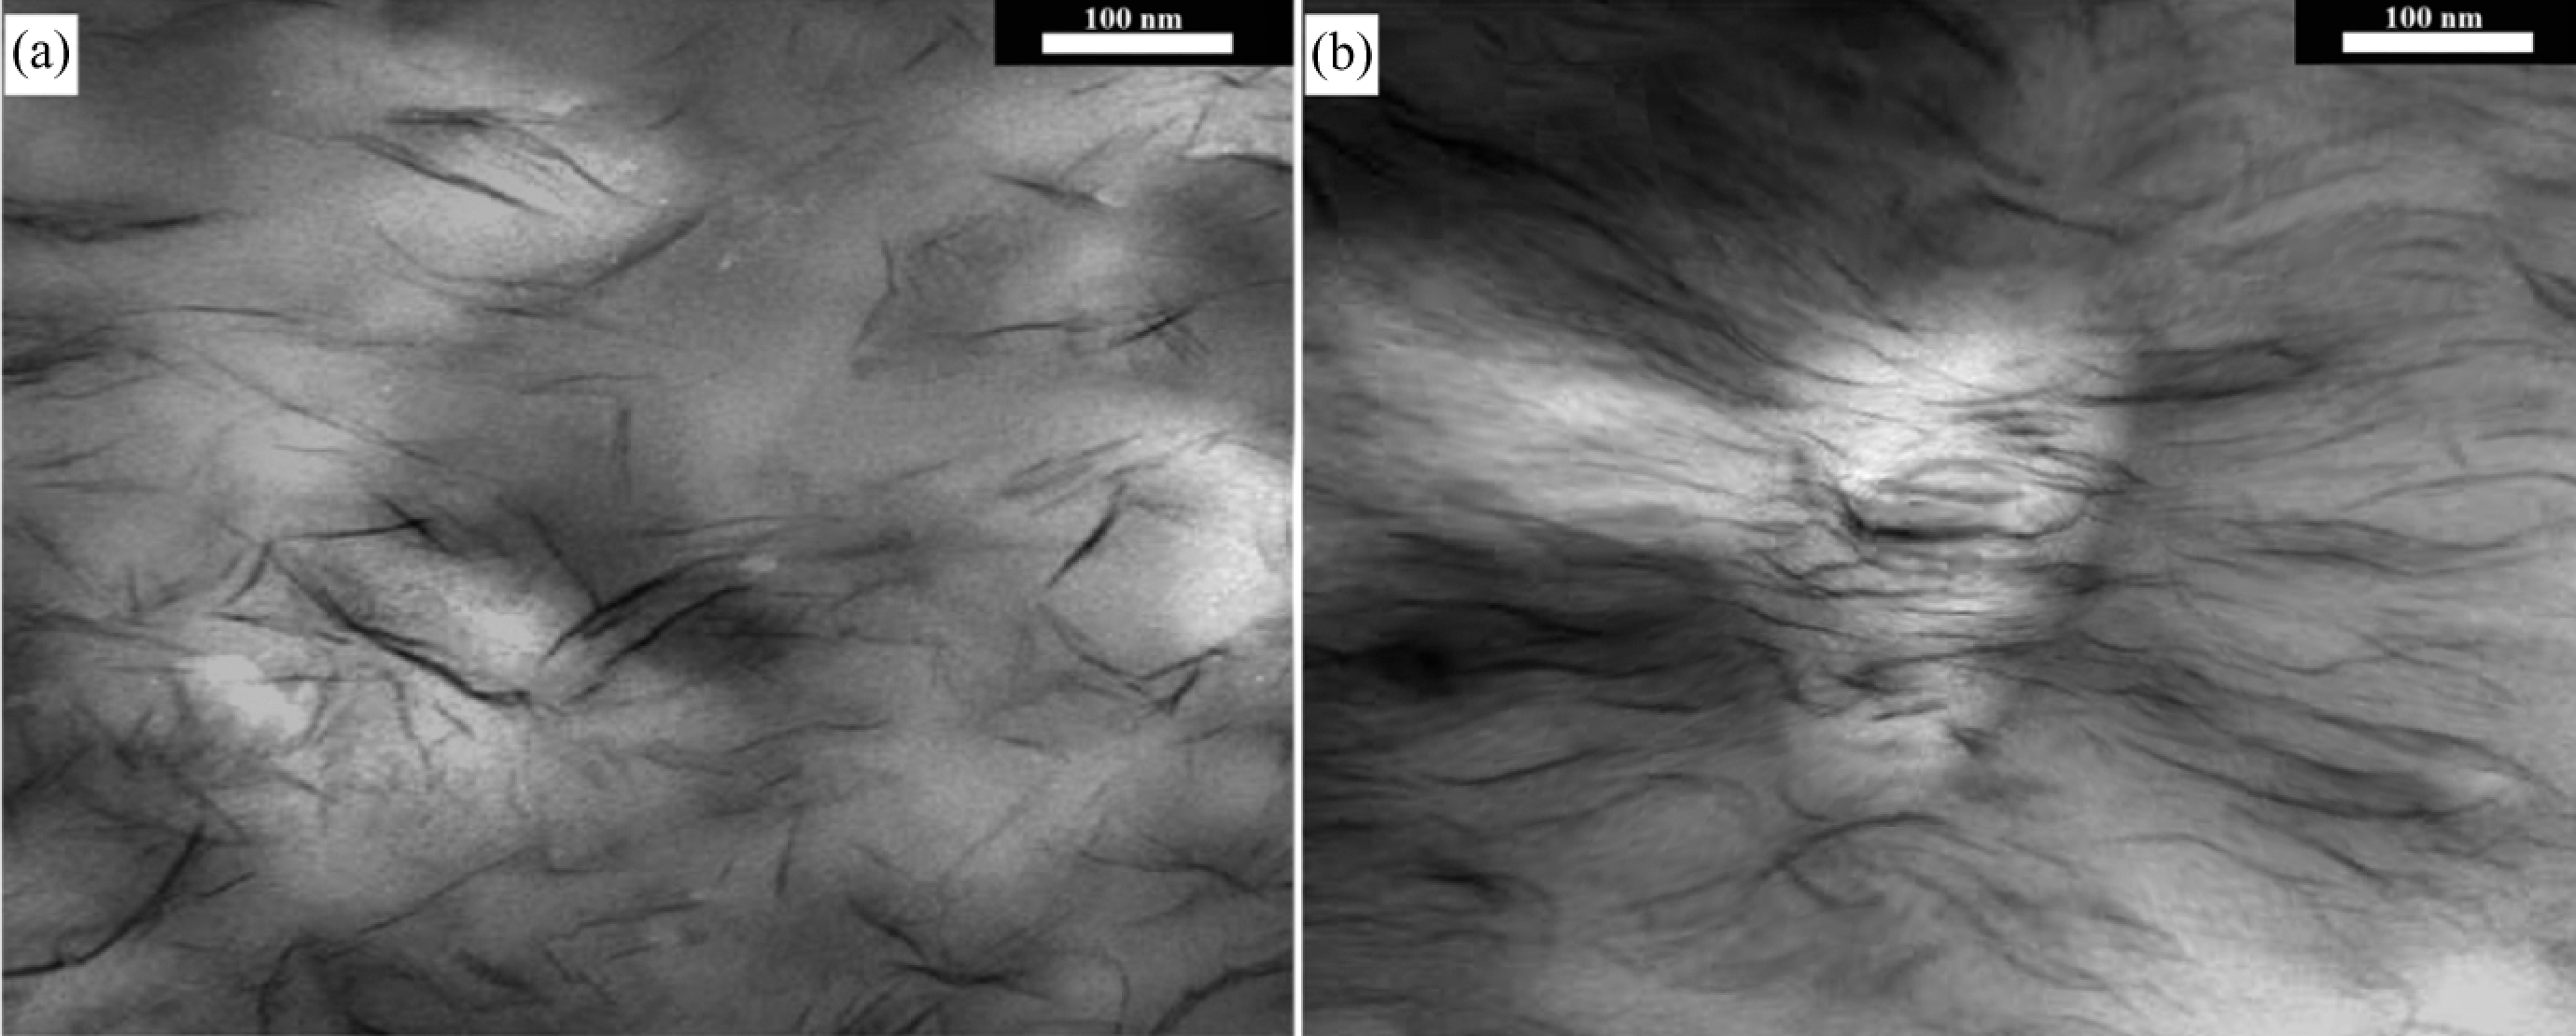
Transmission electron micrographs of (a) OC3/1 (b) OC3/2. 12 OC: OTAC (octadecyl trimethyl ammonium chloride).
Discussion
The results proved that weight loss temperatures obtained from TGA can be employed for qualitative assessment of nanoclay dispersion; temperatures at very low weight losses, however, should be excluded. It seems that ALAMS type affects weight loss temperatures indirectly, that is by influencing nanoclay dispersion. But, in case of T 2%, it is probable that ALAMS type has a direct effect on this parameter. This is why T 2% and, generally speaking, weight loss temperatures at low weight losses do not show the same trend as other weight loss temperatures and, hence, could not be used for nanoclay dispersion assessment.
Our observations suggested that OTAC brings forth much better nanoclay dispersion. This is due to its longer chain size, which has a significant effect on the space between the silicate layers and consequently nanoclay dispersion. Similar conclusion has been drawn by Fornes et al. 49 and Osman et al. 50 as to the effect of ALAMS chain size on the interlayer spacing of nanoparticles.
The results also attest that increasing feeding rate deteriorates nanoclay dispersion. The reason is that unlike conventional melt intercalation process, slurry-fed melt intercalation process has been considered largely diffusion-controlled rather than shear-controlled and governed by different mechanisms 51 –53 from conventional method. 54 The proposed mechanisms suggest that to achieve better nanoclay dispersion, higher residence time is more vital than higher shear stress. By providing more time for the ALAMS to diffuse into water and react with nanoclay surface, ALAMS packing density increases; also, polymer chains have a better chance to diffuse between nanoclay platelets. Therefore, successful modification and subsequently better stabilization of nanoclay platelets inside the matrix are ensured, which lead to better nanoclay dispersion. More information on the effect of ALAMS chain size and packing density on nanoclay dispersion can be found in the literature. 55 –59
Conclusions
In this article, it was demonstrated that weigh loss temperatures, temperatures at low weight loss excluded, obtained from TGA can be used for qualitative estimation of nanoclay dispersion. Although there is no clear-cut relationship between TGA data and the degree of dispersion, this method still can be used for the direct comparison of nanoclay dispersion between samples, with the same nanoclay content, prepared under varied conditions. This finding holds true only if these conditions do not have a direct effect on the thermal stability of the samples and only influence it through nanoclay dispersion. Despite these limitations, this method offers a macroscopic estimation of the nanoclay dispersion, which is both inexpensive and fast. Using response surface method, it is possible to discover and also optimize conditions that lead to better nanoclay dispersion as well. Furthermore, this method can be employed for the confirmation purposes in support of other nanoclay dispersion assessment techniques.
We supported this argument by morphological evaluation of nanoclay dispersion using XRD, AFM, and TEM and also by conducting gas permeability, mechanical, and rheological measurements and relating these data to nanoclay dispersion.
It is our contention that this method can be implemented for studying nanoclay dispersion in thermoset matrices, where rheology, mechanical properties, or gas permeability measurements are either impossible or difficult to conduct; therefore, this method could present an alternative for assessing nanoclay dispersion in this class of polymeric materials.
Footnotes
Acknowledgements
The authors would like to thank Dr M. Ahmadi for his help on the transmission electron microscopy; Ms F. Hemati for her help on the atomic force microscopic analysis; and Mr Y. Kheyrkhah, Mr M. Fayyazi, Mr M. Javid Mehr, and Mr O. Shojaee for their invaluable technical assistance during sample production.
Funding
This work was partially supported by Iranian Nanotechnology Initiative.