
Abstract
Five different maleic anhydride grafted polypropylene (PP) coupling agents (CAs) have been tested in wood polymer composites with wood contents of 40% and 60%. The tested CAs cover a wide range of backbone molecular weight (M w 55–181 kDa) and also vary in MA graft level (0.5–1.5%). Furthermore, one PP copolymer-based product is among them. Mechanical properties (flexural strength, impact strength and heat deflection temperature) and water absorption (WA) have been evaluated as responses. Finally, dynamic rheological measurements on several compounds have been performed. The results show that the backbone polymer structure of the CA is the most important factor for its efficiency. Molecular weight seems to have an influence on WA properties. As regards to rheological measurements, a lubricant-like effect of a CA indicates a reduced capability for compatibilization at the interface.
Introduction
In numerous publications, maleic anhydride (MA) grafted polyolefins (PO; MA-POs) have been reported as effective compatibilizers in polyethylene (PE)- and polypropylene (PP)-based natural fiber composites (NFCs) and wood polymer composites (WPCs). Most of those works have been cited in reviews already. 1 –8 However, there are uncertainties in (1) the actual mechanism of interaction of the coupling agent (CA) with the fiber/filler, (2) the amount of CA (expressed as the percentage of natural fiber or wood fraction) needed for achieving optimal properties and (3) the optimal properties of the CA itself in terms of backbone polymer structure and chain length as well as graft level.
The actual mechanism of interaction of the CA with the fiber/filler is generally assumed that MA-POs interact with the natural fiber/filler via ester bonds and/or hydrogen bridges. Much scientific effort has been aimed at elucidating the chemical structures at the interface, mostly by employing Fourier transformation infrared spectroscopy. This aspect has been discussed in detail in several reviews 1 –8 already.
Many articles exist in which the effects of varying amounts of CA needed for achieving optimal properties on certain composite systems are investigated. Knowing exactly how much CA is required to achieve optimal or sufficient material properties becomes crucial when cost pressure in industrial production comes into play. Taking into account that commercial MA grafted PPs (MA-PPs) are about two to three times as expensive as conventional PP grades, it becomes clear that small differences in required CA amounts actually take an effect on raw material price. MA-PP content values are always given in mass percentage relating to the filler content in this work, if not stated otherwise.
As for the optimal properties of the CA itself in terms of backbone polymer structure and chain length as well as graft level, MA-PO CAs are usually produced by radical grafting, with the exception of one MA-PE type by Dupont. 9 Radical grafting is associated with side reactions involving the PO backbone molecules. In the case of PE, this is predominantly crosslinking, resulting in insoluble gels. In case of PP, the most prominent side reaction of the grafting is chain scission. 10 –13 Thus, increasing the MA graft level in such CAs usually goes along with unwanted changes to the polymer backbone. A higher MA graft level is supposed to improve interaction with the fiber/filler, while a higher backbone molecular weight is supposed to improve interaction with the matrix by entanglements and possibly cocrystallization, 14 and the right balance between those two parameters is crucial for the efficiency of MA-POs. 11,15,16
Lai et al. worked with high-density PE (HDPE) composites with 30% wood filler. They compared three different MA-POs, based on linear low-density PE (LLDPE), HDPE and PP, respectively, covering a CA content range of 0–33.3%. For the PE-based composite types, the effect on tensile strength leveled off at 13%, while the PP-based one had a relatively small effect on tensile properties. According to impact strength (IS) test, again higher amounts of the CAs, namely around 26%, were required for reaching optimal properties. 17
Lu et al. have investigated HDPE-50% wood composites and tested various PE- and PP-based compatibilizers. All seven types had a positive effect on tensile strength, which leveled off between the contents of 1.0 and 3.0%. The MA-LLDPE CA with the highest molecular weight showed the best performance. As regards to flexural modulus, only the three types with high molecular weight and intermediate acid number had a positive effect (based on low-density PE (LDPE), LLDPE and HDPE, respectively). 18
Lei et al. investigated composites based on recycled HDPE reinforced with 30% bagasse fiber. One MA-PE CA was tested at contents from 0.0 to 15.0%. The positive effects of the CA on both the tensile strength and notched Izod IS leveled off at a content of 5.0%. 19
Rana et al. investigated PP composites with 30–60% jute fibers. The influence of one MA-PP type on material properties was tested with CA contents from 0.0 to 13.3%. For both tensile and flexural strengths, the positive effect of addition of CA leveled off at a content of 1.7–3.3%. The effect on Izod noched impact strength (NIS) was relatively small, with an optimum at 3.3–6.7% MA-PP content. 20
Snijder et al. have investigated PP-30% flax composites. Nine different MA-PPs were tested as CAs, among them are homopolymers as well as random- and block-copolymers with different molecular weights and graft levels. All these CAs have a positive influence on flexural strength, but the optimum contents are very different. However, if total MA content instead of MA-PO content is taken as the measure for CA addition, the picture gets clearer. Six of the nine CAs need to be added to a total MA content of 0.01% for an optimum or plateau in their effect on flexural strength. This is more or less independent of the backbone polymer structure. According to Charpy IS test, the situation is even more complex, but generally, higher total MA contents (around 0.02%) are required here. The two MA-grafted block-copolymers give the best impact properties. 15
Keener et al. investigated PP composites reinforced with 30% flax and jute, respectively. They tested four different MA-PP CAs with different melt flow rates (MFRs) and graft levels, applying 0, 3.3, 10.0 and 16.7% of CA, respectively. For three of the compatibilizers tested, the effect on tensile strength leveled off at a content of 10.0%. For the type with the highest MA level and lowest M w, however, this effect leveled off at a content of 3.3%, already. As regards to Charpy IS test, generally higher amounts of CA are required for reaching optimal properties. 11
Sombatsompop et al. tested impact modifiers and three different MA-PP types in a PP-30% wood system. They found a positive effect on tensile modulus, which leveled off at 2% CA content. As regards to tensile strength, only one of the types used (based on an impact copolymer) showed a plateau starting at a content of 2%. Izod NIS was reduced upon addition of the CAs. 21
Arbelaiz et al. worked with PP-30% flax fiber composites. The effects of two MA-PP CAs (E43 and G3003), incorporated at contents from 0.0 to 20.0%, on the mechanical properties of the composites were evaluated. Both the MA-PP types had positive effects on tensile and flexural strengths, respectively. The low molecular weight, high acid number E43 had lower effects on both the properties, leveling off at contents around 2.5%. The high molecular weight, low acid number G3003, on the other hand, brought about higher increases in both the properties, with effects leveling off at contents around 5.0%. As regards to falling weight IS, the G3003 CA performed better, but only at very high contents (10.0–20.0%). 22
Junkasem et al. investigated PP-roselle fiber composites. For a system with 40% fiber content, the content of an MA-PP CA was varied between 0.0 and 25.0%, and the effects on mechanical properties were evaluated. The CA showed a positive effect on tensile strength, which leveled off at 12.5%. While the effect on Young’s modulus was not significant, the effects on flexural modulus and IS were negative. For flexural strength, a positive effect was found only with CA contents of 17.5% and higher. 23
Nachtigall et al. investigated the effect of two different grafted PP CAs, namely a MA-PP and a vinyltriethoxy-silane (VTES)-PP, on PP-wood composites. At 30% filler content, the VTES type brought about higher improvements in tensile strength. The MA-PP type showed optimal performance at a content of 25.0%. 24
Zhang Y et al. investigated PP-wood composites. For composites containing 60% wood particles, the effect of a MA-PP CA was tested at contents from 0.0 to 8.3%. For both flexural strength and modulus, no plateau was reached within this range. 25
In the light of all those earlier works, we aimed at setting up an experiment that should answer the most important questions related to MA-PP coupling in a PP-wood system with 40–60 wt% filler level, which are: (1) Which commercial MA-PP type (from a range of five that is known to work well in WPCs) delivers the best material properties as a function of its molecular weight and graft level? and (2) How much CA is needed to achieve optimum properties (covering a range of 0.0–10.0%)?
Materials and methods
Materials
As a base resin for the experiments conducted, the isotactic homopolymer PP grade HD120MO by Borealis was used. This type has an MFR230°C/2, 16 kg of 8.0 g/10 min, corresponding to a M w of 370 kDa and a polydispersity M w/M n of 4.93. Five different MA-PP CAs were used. Their properties as given by the producers are summarized in Table 1, while properties measured independently for this study are given in Table 2.
Properties of the coupling agents used in this study.a
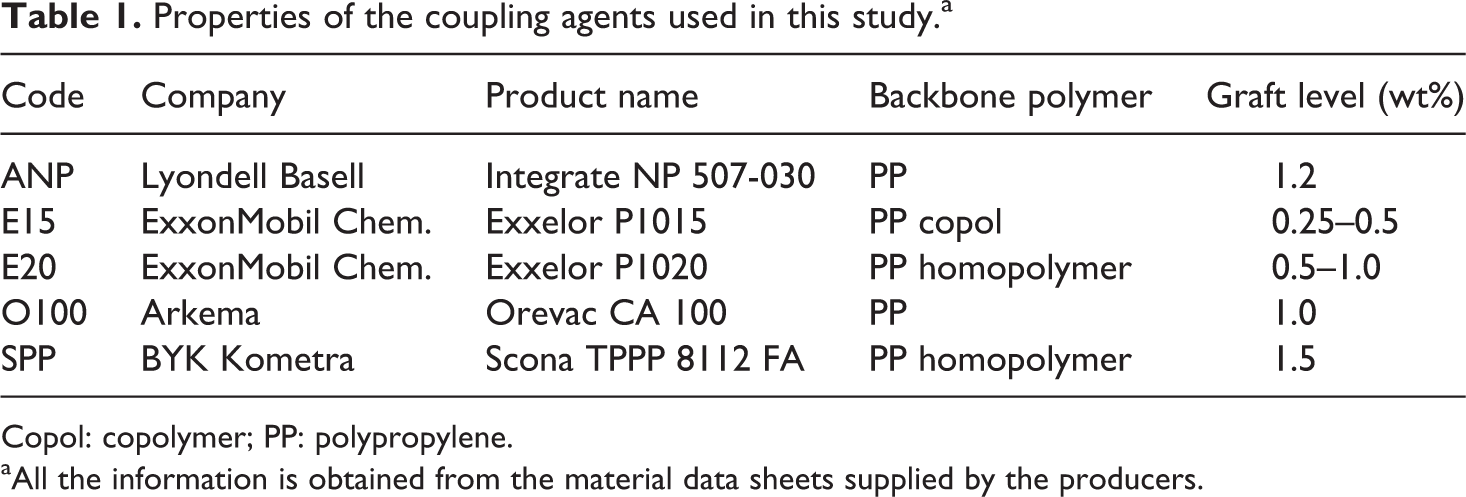
Copol: copolymer; PP: polypropylene.
aAll the information is obtained from the material data sheets supplied by the producers.
Properties of the coupling agents used in this study.a
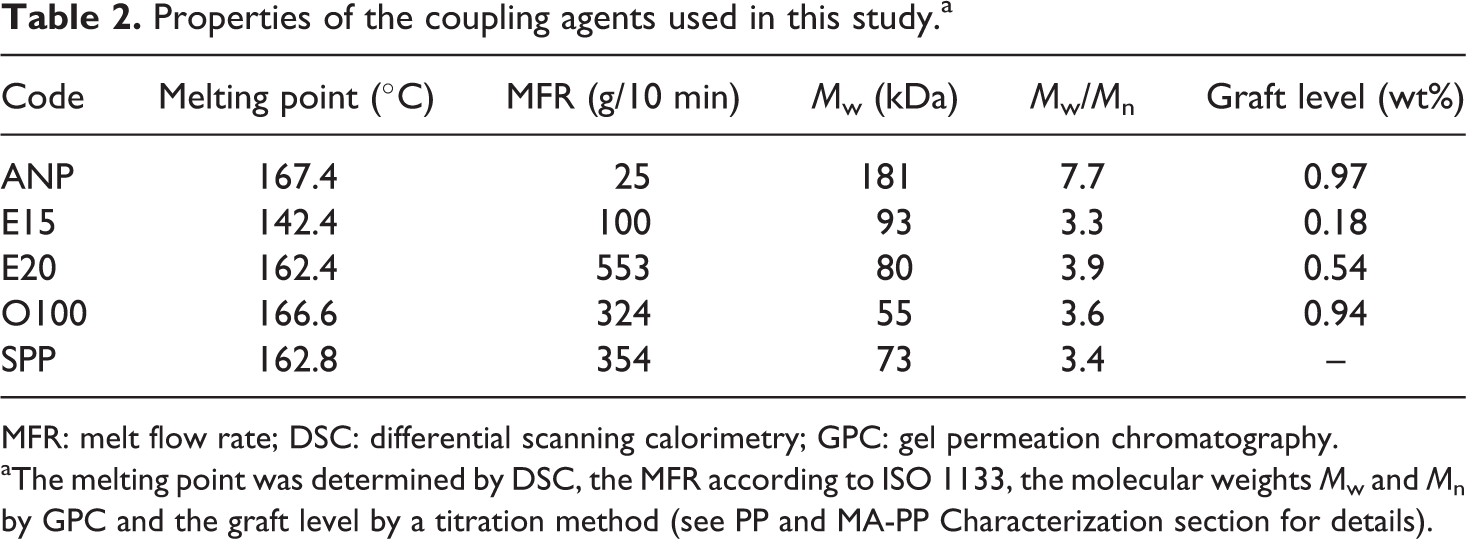
MFR: melt flow rate; DSC: differential scanning calorimetry; GPC: gel permeation chromatography.
aThe melting point was determined by DSC, the MFR according to ISO 1133, the molecular weights M w and M n by GPC and the graft level by a titration method (see PP and MA-PP Characterization section for details).
Looking at Table 2, it becomes obvious that there is no clear correlation between MFR and M w for the CAs, especially among those with high flowability (O100, SPP and E20). Basically, there are two potential explanations for this: First, residual peroxides from the grafting process might cause chain scission, but also crosslinking during MFR measurements, affecting the results. Second, grafted MA groups might interact with the silica gel matrix of GPC-columns, altering the size-based separation mechanism. However, interpretation of the results presented herein is based on MA-PP M w rather than MFR.
As wood filler, Lignocel® S 150 TR obtained from J. Rettenmaier and Söhne was used. This type is made from softwood, of which approximately 90% is spruce. The main particle size is 70–150 µm, and the average aspect ratio is 2–3 (information from producer).
Figure 1 shows a sieve analysis of this wood type. The filler was used for compounding only at moisture contents below 2%. If necessary, it was dried at 80°C until this threshold was reached.
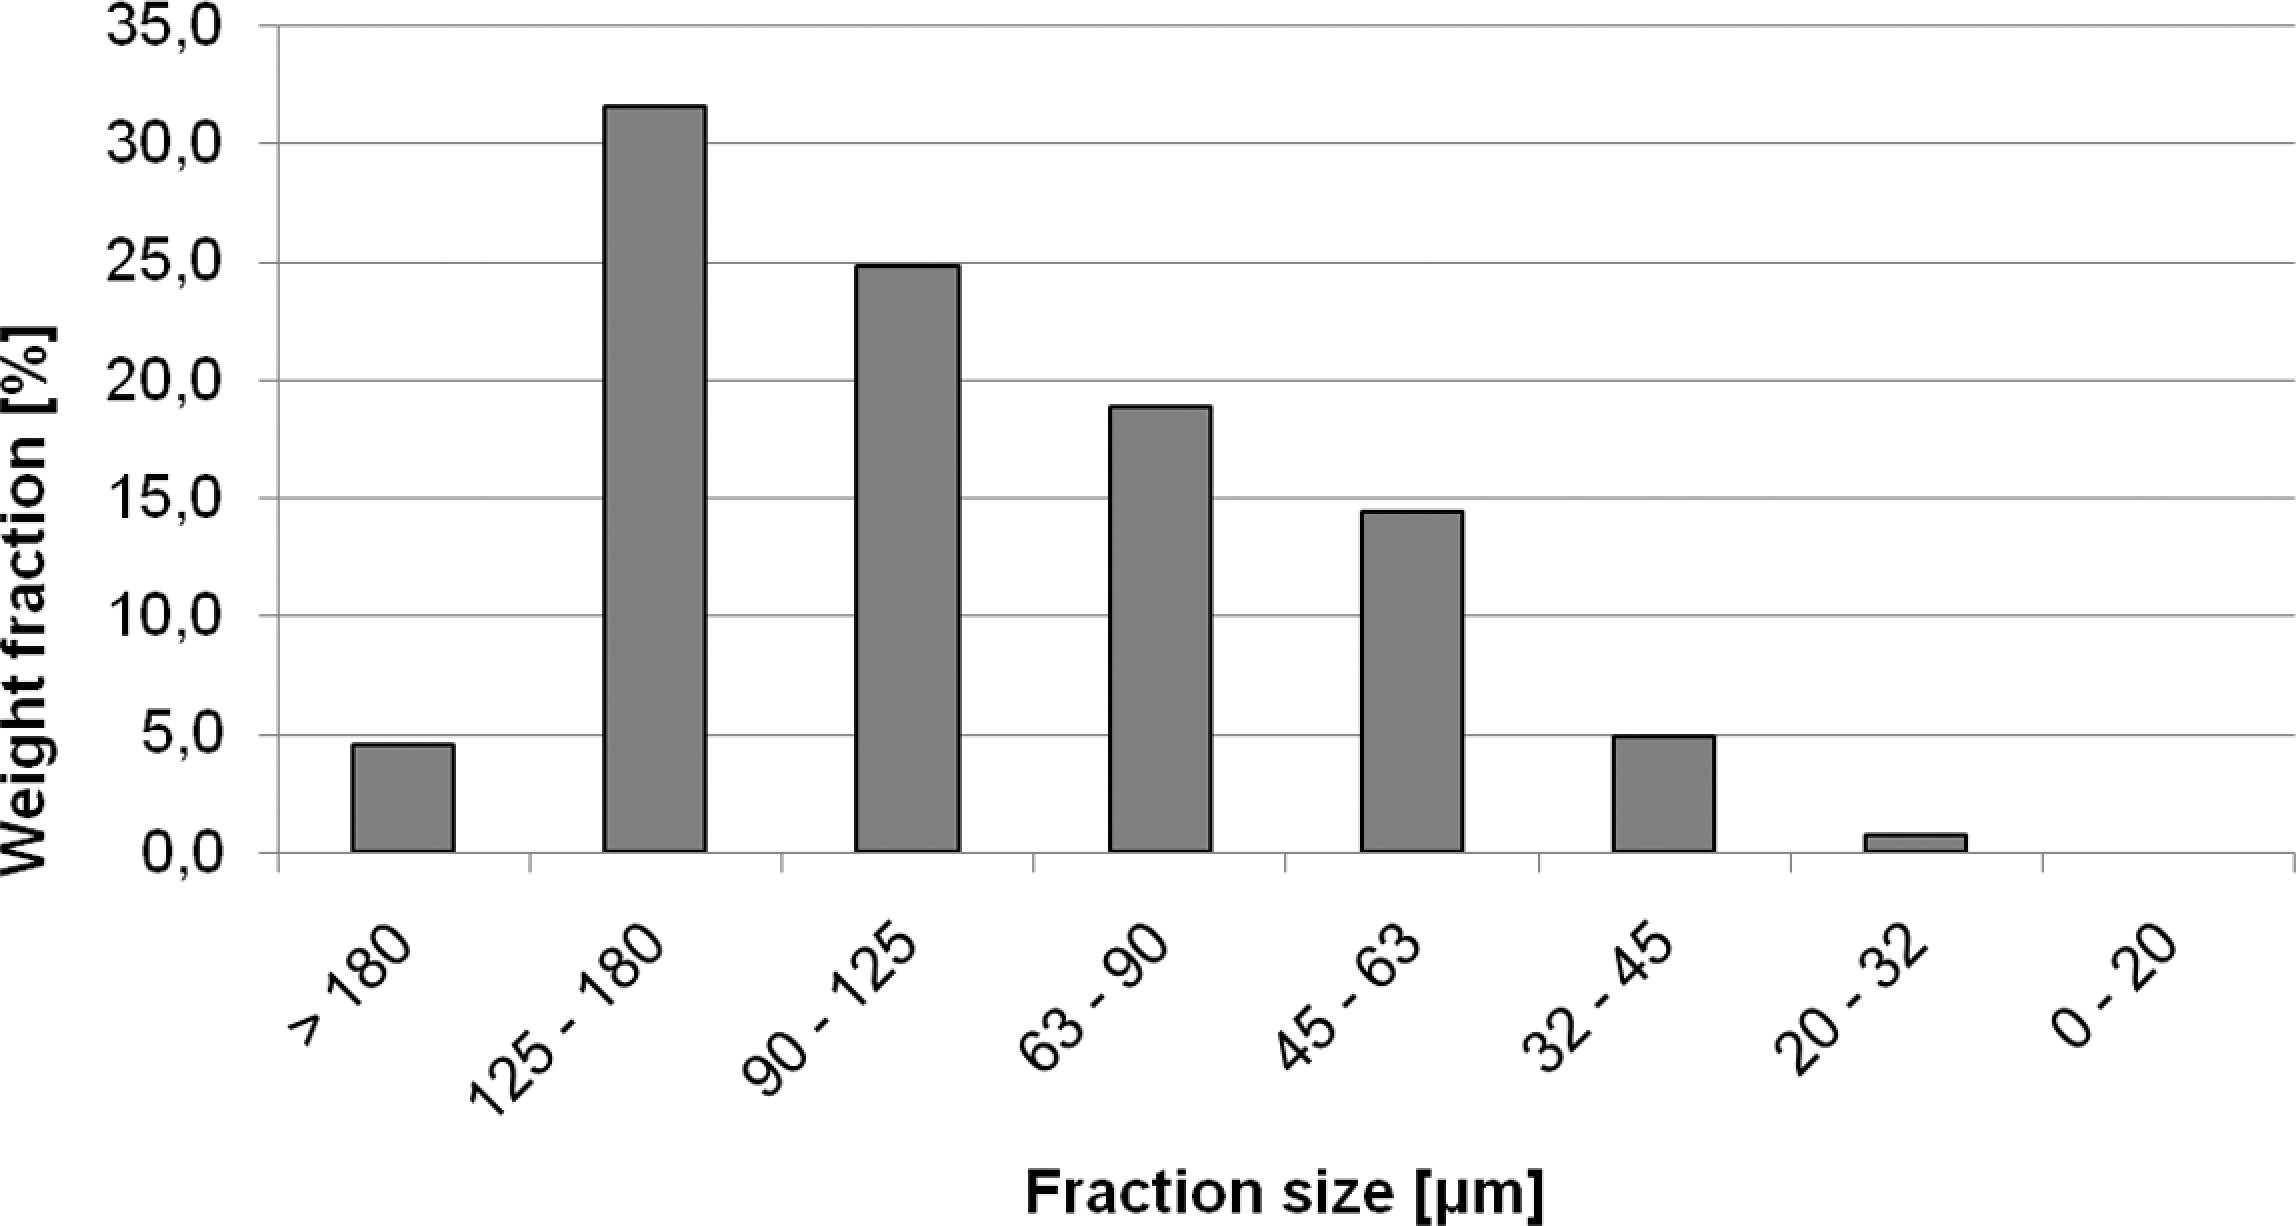
Sieve analysis result for the S 150 TR wood type.
For high temperature GPC analysis, 1,2,4-trichlorobenzene, with a purity of >99%, supplied by Sigma-Aldrich, was used without further purification. The solvent was stabilized by adding 250 mg/mL 2,6-di-tert-butyl-4-methylphenol (Sigma-Aldrich).
Methods
PP and MA-PP characterization
The MA-PP CAs employed were characterized in several ways to complement and verify the information given by the producers. The melting points were determined by DSC measurements on TA Instruments Q2000 equipment. The temperatures given represent the melting peak maxima of second heating runs, performed at a rate of 10 K/min, under a N2 stream of 50 mL/min.
The MFR values were determined according to ISO 1133, at a temperature of 230°C and a load of 2.16 kg, employing a Zwick 4105 equipment with a 2-mm die. Samples of 5g were used and results were calculated as the arithmetic average of five extruded strands each.
GPC analysis was performed on a Viscotek triple detection system (350 series; RI-, RALS/LALS- and visco-detector) equipped with two GMHXL-HT mixed bed columns plus an upstream guard column (Tosoh Bioscience) at a temperature of 140°C. A flow rate of 1 mL/min was maintained for all runs. Samples of PP and MA-PPs were prepared with a concentration of 2 mg/mL, and a dissolution time of 1 h was met. Detector-offsets were determined by running a polystyrene of 99 kDa standard provided by Viscotek. Afterwards, the dn/dc value was set to the literature value for PP in trichlorobenzene (TCB) (0.094). 26
The MA-PP graft level was determined by a titration method published by Sclavons et al. 27 Each sample of 3.0 g was dissolved in boiling toluene with bromothymol blue as indicator. The acidic MA groups were then titrated with 0.1 M tetrabutylammonium hydroxide, until a color change was indicated. A 500-mL bulb with heating mantle and magnetic stirrer combined with a reflux condenser and a 10-mL microburette were employed. The results obtained by this method (Table 2) do largely confirm the information given by the MA-PP producers (Table 1). However, for E15, a value slightly lower than that given in the respective datasheet was found. Surprisingly, the SPP type did not dissolve completely in boiling toluene, although it should be based on a PP homopolymer, which is also indicated by the melting point.
Compounding and specimen preparation
WPCs with wood contents of 40 and 60%, respectively, were prepared. At the lower wood content, 0.0, 5.0 and 10.0% MA-PP were employed. At the higher wood content, two more levels, namely 2.5 and 7.5%, were included. All five MA-PP types were tested according to this scheme. While wood or other filler contents are always given relative to total composite weight, CA contents are always given relative to the filler content (e.g. 5.0% CA in PP-40% wood means 2.0% CA per total). The remainder to 100% was HD120MO (Table 3).
Experimental design.a
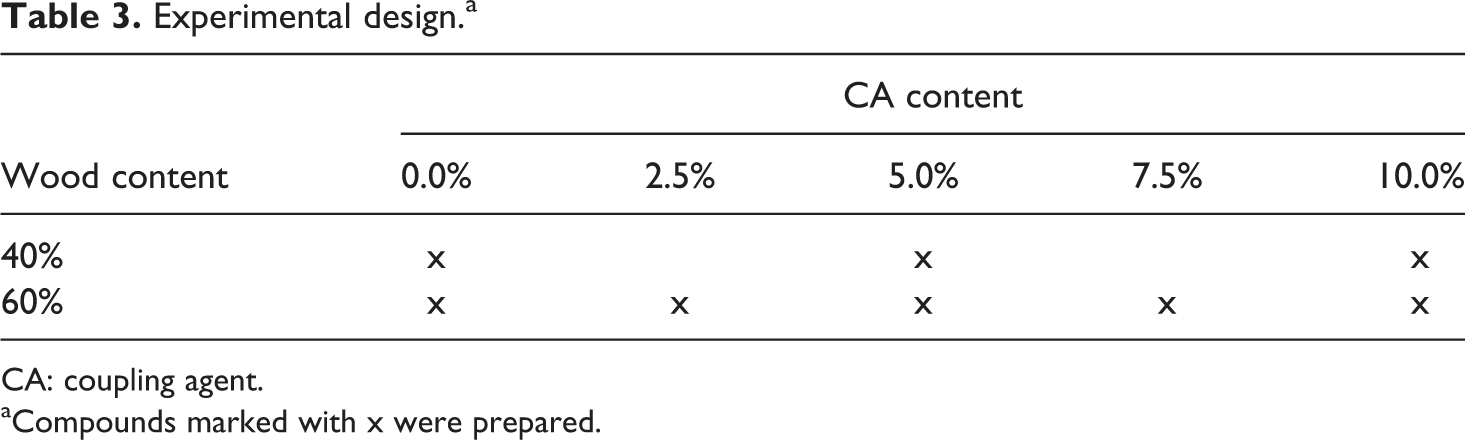
CA: coupling agent.
aCompounds marked with x were prepared.
Compounding was performed on a Thermo Haake Rheomix system, equipped with a 3000p kneader. The chamber temperature was set to 180°C, and the mixing time was 10 min at a rotor speed of 75 r/min. The compound was removed from the kneader as a hot melt, and after cooling down to room temperature, it was milled to 4 mm on a cutting mill (Fritsch pulverisette 19). The ground material was then processed to specimens on a Thermo Haake Minijet system (lab size injection molding machine). The cylinder temperature was set at 195°C, while the tool was kept at 60°C. Bar-like specimens of 2 × 10 × 80 mm were prepared, and mechanical properties were determined after 1 week of storage in closed LDPE bags at room temperature.
Mechanical properties
Flexural properties were determined on a Messphysik Beta 20-10 universal testing machine equipped with a 1-kN load cell, according to ISO 178, at a loading rate of 3 mm/min. Charpy IS was determined according to ISO 179 using unnotched specimens (1 fU) and employing a Zwick 5113 equipment. Heat deflection temperature was determined according to ISO 75, in mode A (HDT-A), on a CEAST system.
Water absorption
Water absorption and swelling of various formulations was measured upon immersion of Minijet specimens in distilled water at room temperature (23°C). Weight gain was determined using a Sartorius analytical scale. Measurements were carried out after 7 and 28 days, respectively.
Morphology
In order to characterize specimen morphology and ease interpretation of the results obtained by mechanical testing, scanning electron microscopic (SEM) images of fracture surfaces (Charpy IS/NIS) were prepared for several compounds. A Hitachi S-4000 SEM run at an acceleration voltage of 30 kV was employed.
Rheological characterization of compounds
Dynamic rheological measurements were performed on a Thermo Haake Rheostress 600 rheometer, using 35 mm plate–plate geometry with a gap width of 1 mm. All measurements were performed at 190°C. Strain sweeps at 1, 10 and 100 Hz were run to determine the range of linear viscoelasticity. Finally, frequency sweeps from 10−2 to 102 Hz (equals to an angular frequency range of 10−1.2 to 102.8 rad/s) were run in controlled stress mode at an amplitude of 50 Pa. Preliminary tests had shown that the compounds with a wood content of up to 40% (of relatively fine grained wood fillers) can reproducibly be measured with dynamic rheology. Milled compounds from the kneader were taken as samples.
Rheological data was plotted in double-logarithmic diagrams, as complex viscosity |η*| (Pas) or storage modulis/loss modulus (G′/G″; Pa) versus angular frequency ω (rad/s). From these diagrams, the crossover points of G′ and G″ as well as the slopes of G′ and G″ were determined in order to obtain measures to compare various compounds. In the high shear region, the complex viscosity curves can be described by the power law model
Here, K is the consistency index, and n is the flow behavior index. K and n as given in equation (1) were fitted for the high-frequency range. The viscosity of polymer melts approaches a constant zero shear viscosity at very low shear rates. Flow curves showing a low shear plateau and a high shear power law region can be fitted with the Carreau model.
Here, |η 0| is the zero shear viscosity, and ω b is the angular frequency, which marks the transition between low shear plateau and power law region. The flow behavior index n can be taken from power law fits of the high shear region. For those compounds where constant viscosity was reached within the frequency range covered, flow curves were fitted with the Carreau model.
Material and equipment suppliers
The detailed material and equipment suppliers are listed in Table 4.
Material and equipment suppliers.
DSC: differential scanning calorimetry; MFR: melt flow rate; PP: polypropylene; MA-PP: maleic anhydride grafted PP; GPC: gel permeation chromatography; HDT: heat deflection temperature; SEM: scanning electron microscopy.
Results and discussion
Flexural properties
Figure 2 shows the effects of various CA types and contents on the flexural stiffness of WPCs with 40 and 60% wood content, respectively. At the lower filler content, all the effects observed are in the range of the standard deviation (SD) of the uncompatibilized compound. At the higher filler content (Figure 2, right), CA contents between 2.5 and 7.5% are preferable. As to the differences between the five CA types, none of them stands out significantly.
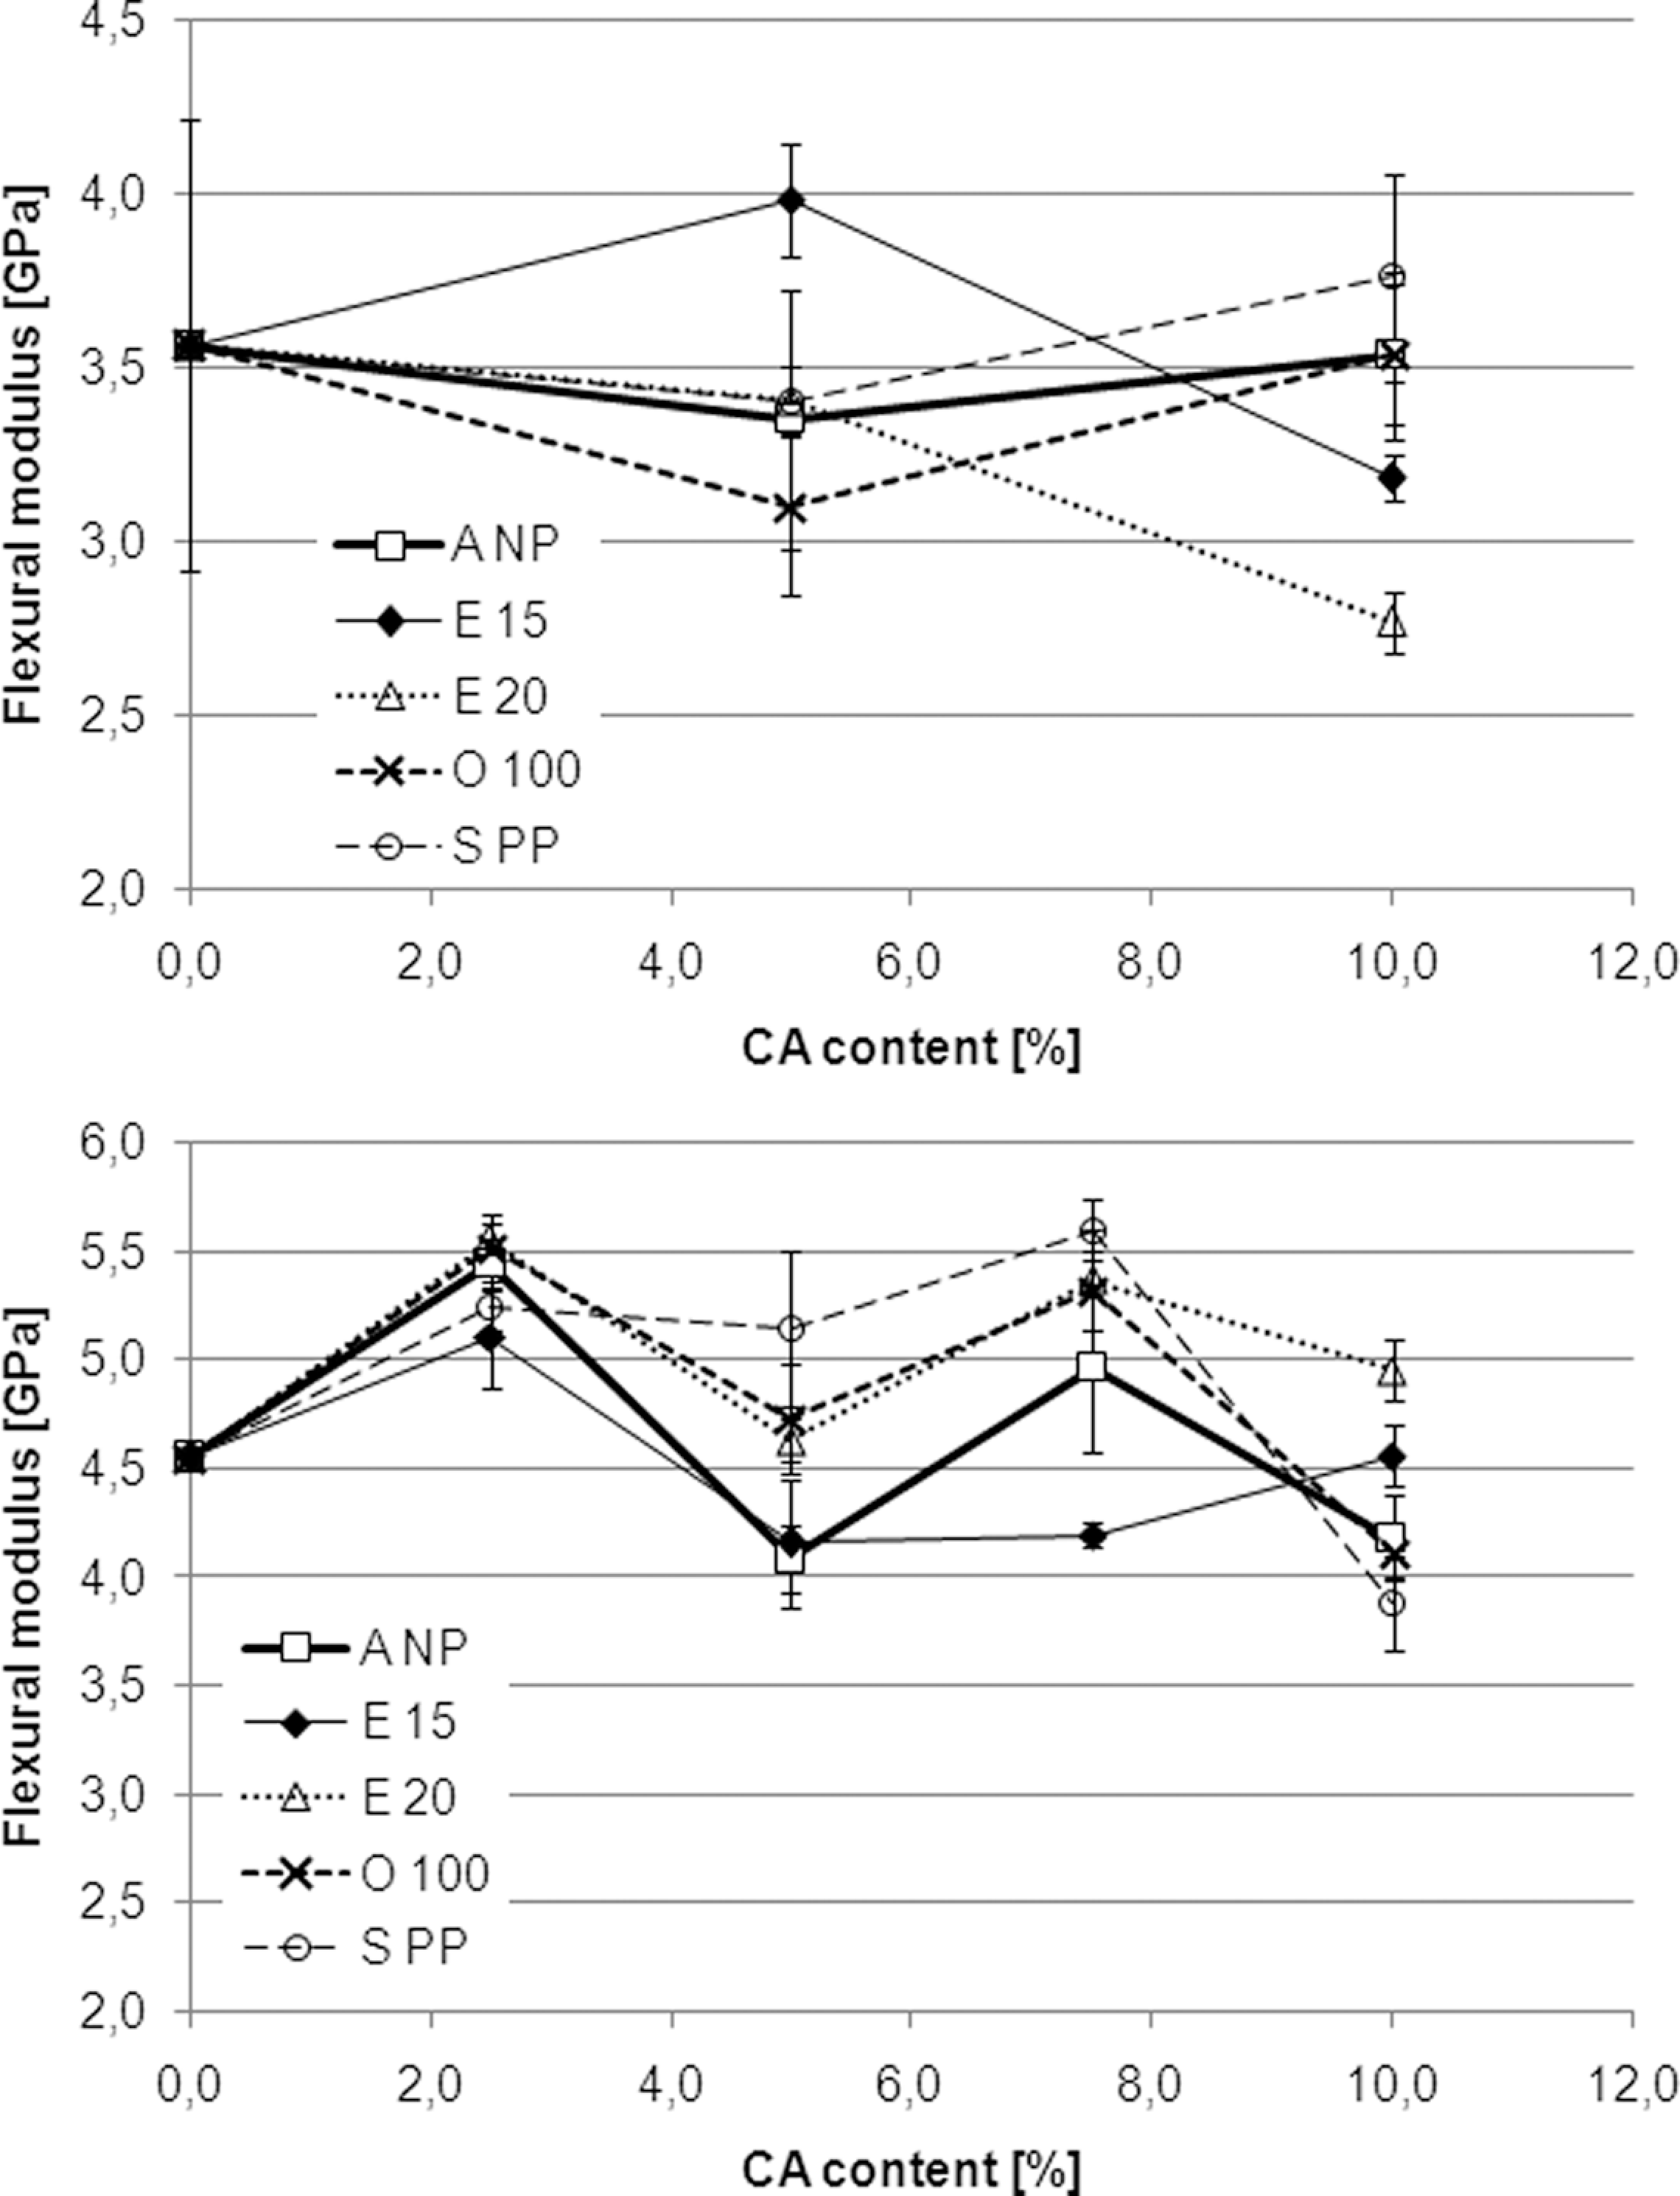
Flexural modulus as a function of CA type and content of WPCs with 40% (top) and 60% (bottom) wood content, respectively. CA: coupling agent; WPC: wood polymer composite.
Investigating PP-30–60% wood composite systems, other researchers 28,29 have reported increases in the flexural modulus reaching from 0 to 40%, upon addition of MA-PP CAs to the compound. 6 Sombatsompop et al. have tried to improve the mechanical properties of PP-30% wood compounds with the impact modifiers and three different MA-PP copolymers. After compounding on a twin screw extruder, specimens were prepared by injection molding. With one MA-PP type, flexural modulus could be enhanced by 30%. The optimum content of this CA for this material property was 2.0%. 21 Employing compounding on a laboratory kneader and specimen preparation from compression molded sheets, Zhang C et al. have tested various CAs (N-vinylformamide-grafted PP, polymeric methylene diphenyl diisocyanate and MA-PP) in a PP-40% wood system. At the optimum MA-PP content of 5.0%, flexural modulus was improved by 40%. 6 Zhang Y et al. compared compatibilization by wood particle surface modifications with the addition of MA-PP for a PP-60% wood system. Compounding was performed on a single screw extruder, and specimens were prepared from compression molded sheets. The highest increase in flexural modulus, namely 15%, was achieved with the highest MA-PP content employed (8.3%).25
As regards to the effects of MA-PP CAs on flexural stiffness, lots of data are available, but a conclusive interpretation is still complicated. What can be deduced from our results and from those published earlier is that MA-PPs will normally not decrease flexural stiffness. Theoretically, interfacial adhesion should play a minor role at the low strains at which moduli are measured. Thus, when relatively high improvements in stiffness are reported, it might be questioned if those are mainly a result of improved adhesion, or if other factors might play a role as well. For example, MA-PP has been shown to affect crystallization PP, which would in turn influence stiffness and might explain some of the increases in flexural moduli that have been reported. 30,31
Figure 3 shows the effects of various CA types and contents on the flexural strength of WPCs with 40 and 60% wood content, respectively. Unlike stiffness, the CAs have quite significant effects here. Obviously, adding small amounts of CAs lead to significant increases in strength. When MA-PP contents are increased further, this usually results in further gradual improvements of this material property up to a CA content of 10%. For none of the five types investigated, an obvious optimum content can be observed. However, above 5.0–7.5% CA content, the further achievable improvements in flexural strength are more or less insignificant. While four of the MA-PPs show a quite similar performance, the copolymer-based E15 falls behind significantly, probably because of its deviant backbone structure.
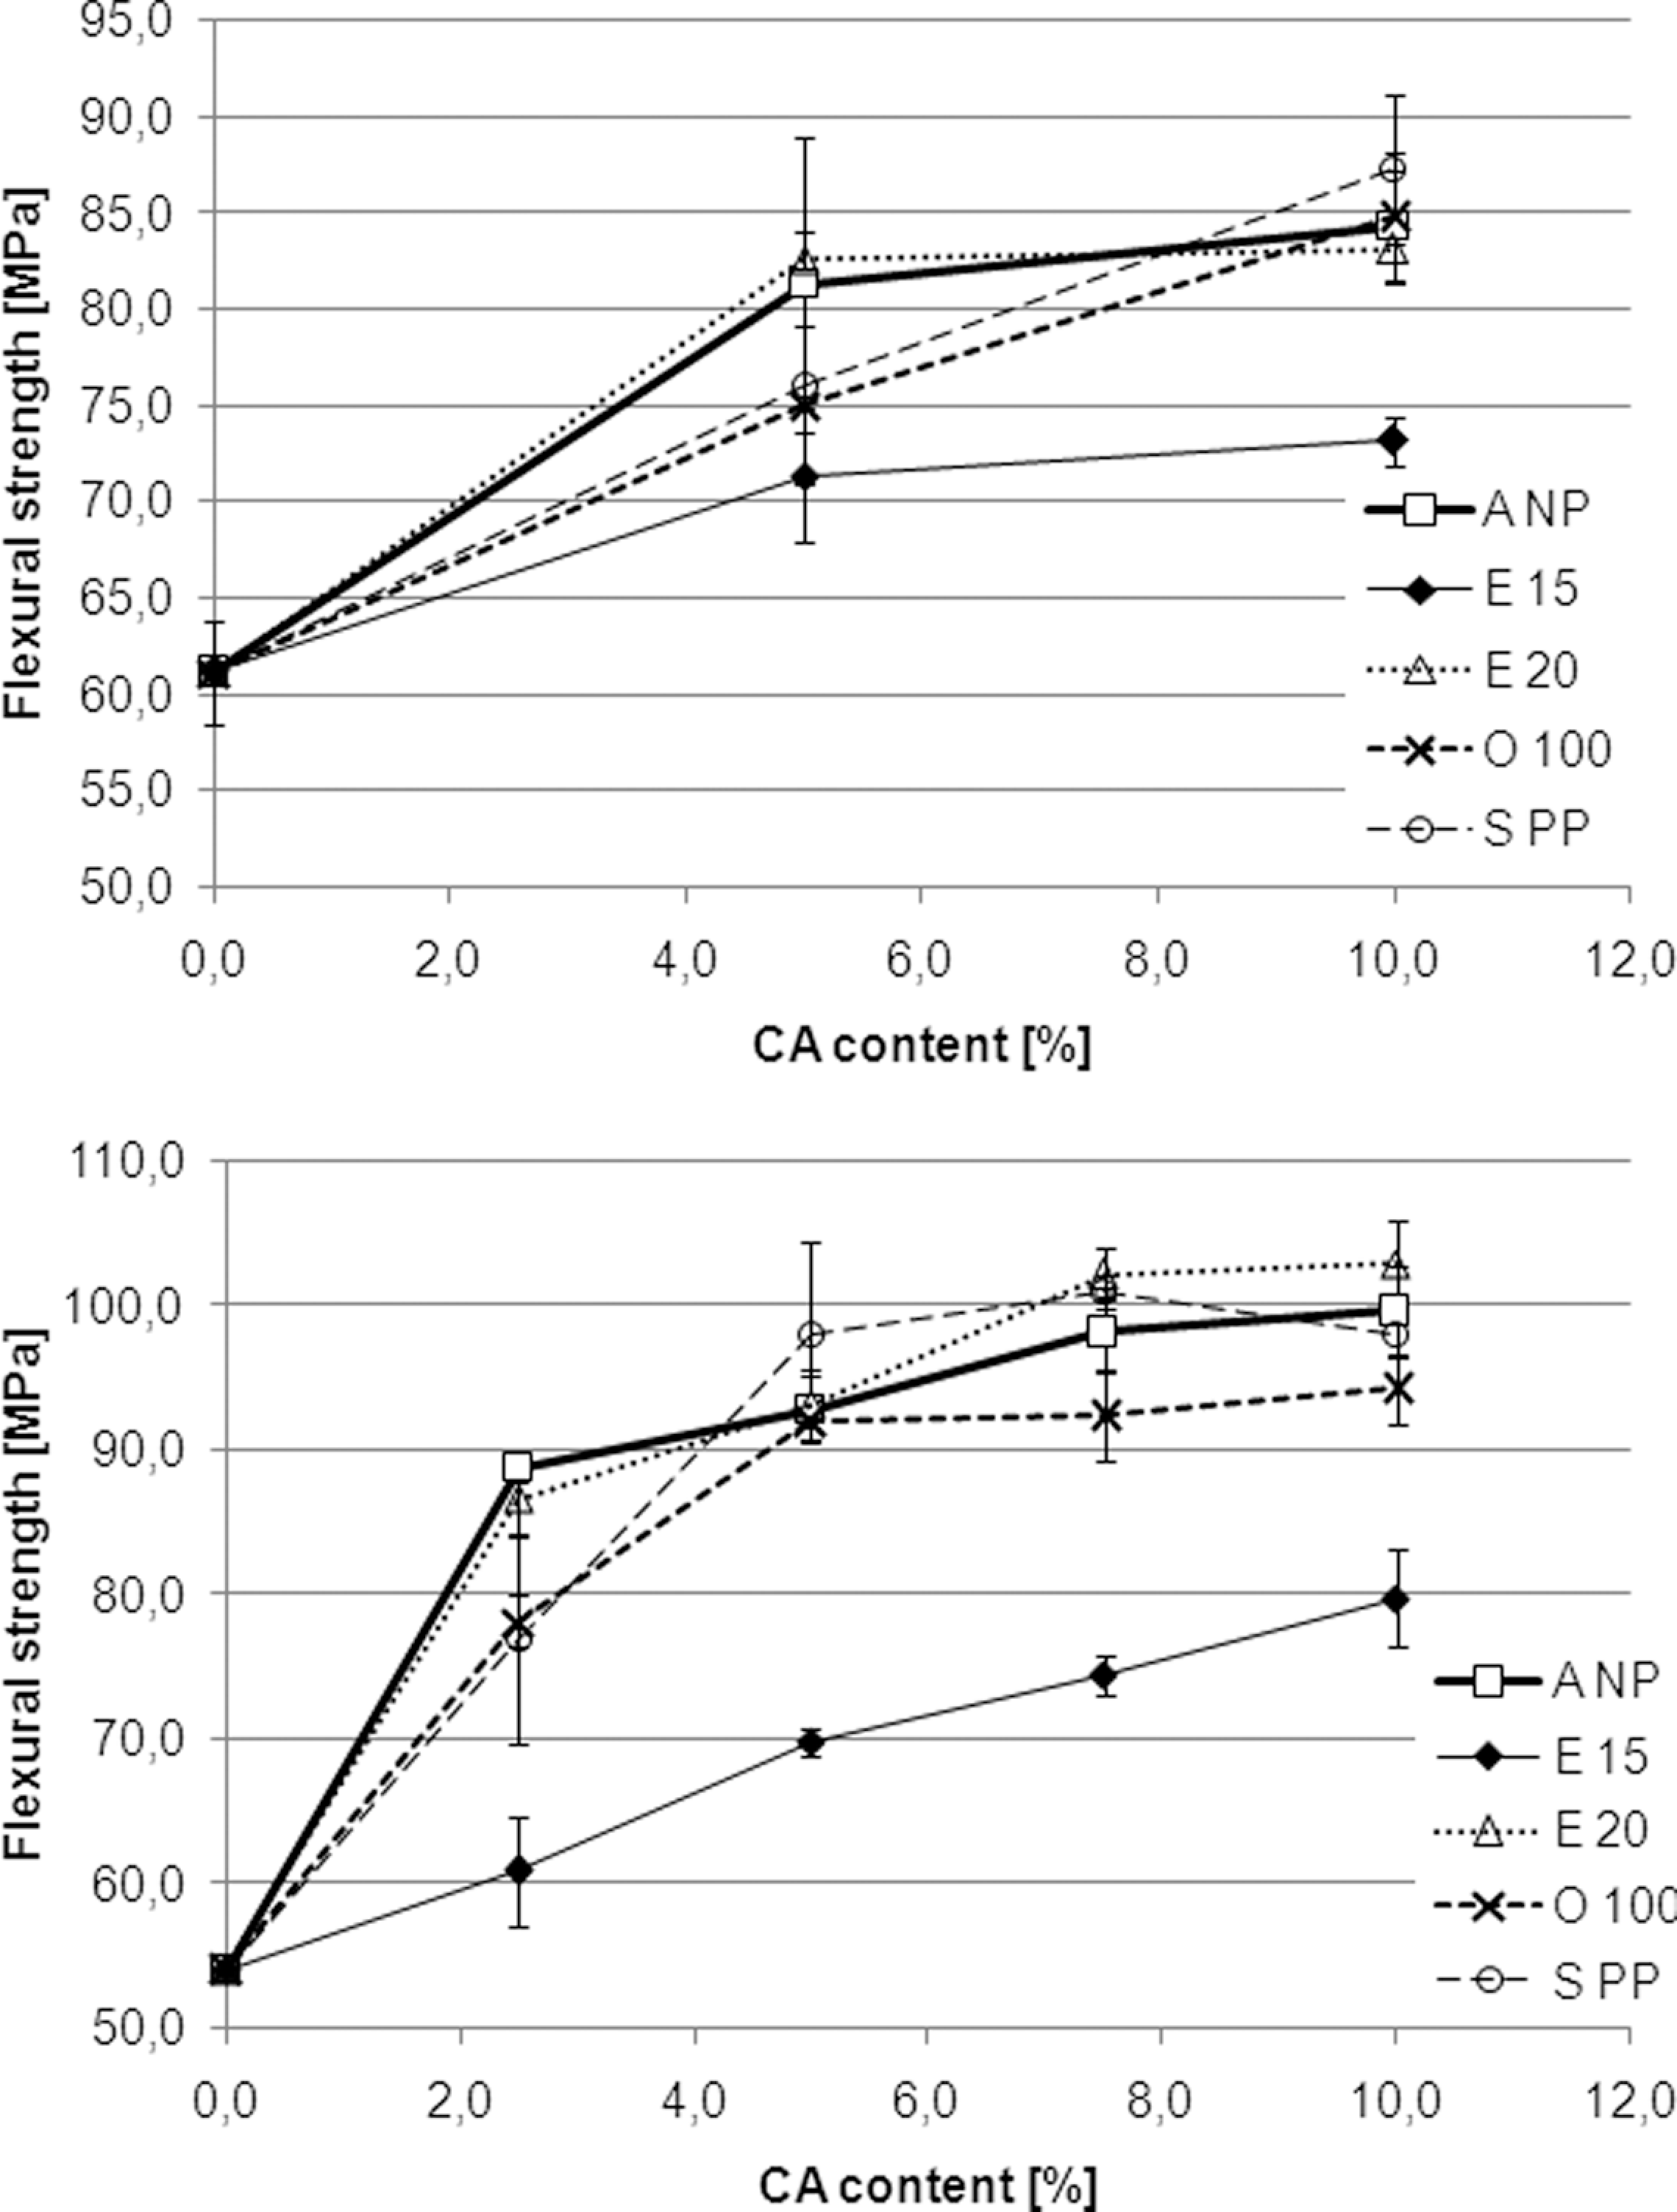
Flexural strength as a function of CA type and content of WPCs with 40% (top) and 60% (bottom) wood content, respectively. CA: coupling agent; WPC: wood polymer composite.
Usually, significant increases in flexural strength of PP-30–60% wood composites are reported upon addition of MA-PP CAs, ranging from 20 to 70%. 25,29 Nunez et al., however, reported a small decrease in this property in PP-40–50% wood compounds when employing a MA-PP CA with a low graft level (0.3%). 32 As for flexural modulus, Sombatsompop et al., Zhang C et al. and Zhang Y et al. have investigated the influence of MA-PP contents on flexural strength. The first group has tested three different PP copolymer-based CAs. For the best performing, low MFR type, the effect on flexural strength ( + 25%) leveled off at a content of 2.0%. However, further increasing the MA-PP content led to further gradual improvements. 21 Zhang C et al. found 5.0% to be the optimum MA-PP content, which led to an increase in flexural strength of 45%. 6 Zhang Y et al. report the highest improvements of this material property ( +70%) upon employing the maximum MA-PP content of 8.3%. 25
The question as to which MA-PP properties, regarding structure, molecular weight and graft level, are preferable for optimal performance in a PP-wood composite system, is as yet unanswered. From our own results, it can be deducted that backbone polymer similarity with the matrix might be an important factor. The only MA-PP type tested that is based on a copolymer (M p 142.4°C) rather than a homopolymer PP, namely E15, shows the least performance. However, Sombatsompop et al. found an MA-PP copolymer with a melting point as low as 136°C delivering the best properties among the three MA-PP groups tested. 21 As regards to the factors molecular weight and graft level, the similar performances of the other four MA-PPs tested in this study do not give a hint toward optimal CA design. Finding the optimal amount of CA for PP-wood composites is complicated as well. Our results, as well as those of Sombatsompop et al. and Zhang Y et al, indicate that increasing MA-PP contents will usually not lead to decreases in strength, if not even further gradual improvements can be achieved. 21,25 Thus, the recommendation for commercial formulations would be: use as much MA-PP as you can afford. However, results have been published that indicate a CA threshold content above which further increases can lead to decreases in strength. 6
Impact strength
Figure 4 shows the effects of various CA types and contents on the IS of WPCs with 40 and 60% wood content. Interpretation of the data is complicated by high SDs. However, the results for the 60% wood-filled composites show two trends: First, 7.5% seems to be the optimum content for four of the CAs tested. Second, as noticed already for flexural strength, the copolymer-based type E15 in most cases delivers the least performance. Among the other four types, differences are insignificant or masked by the SDs.
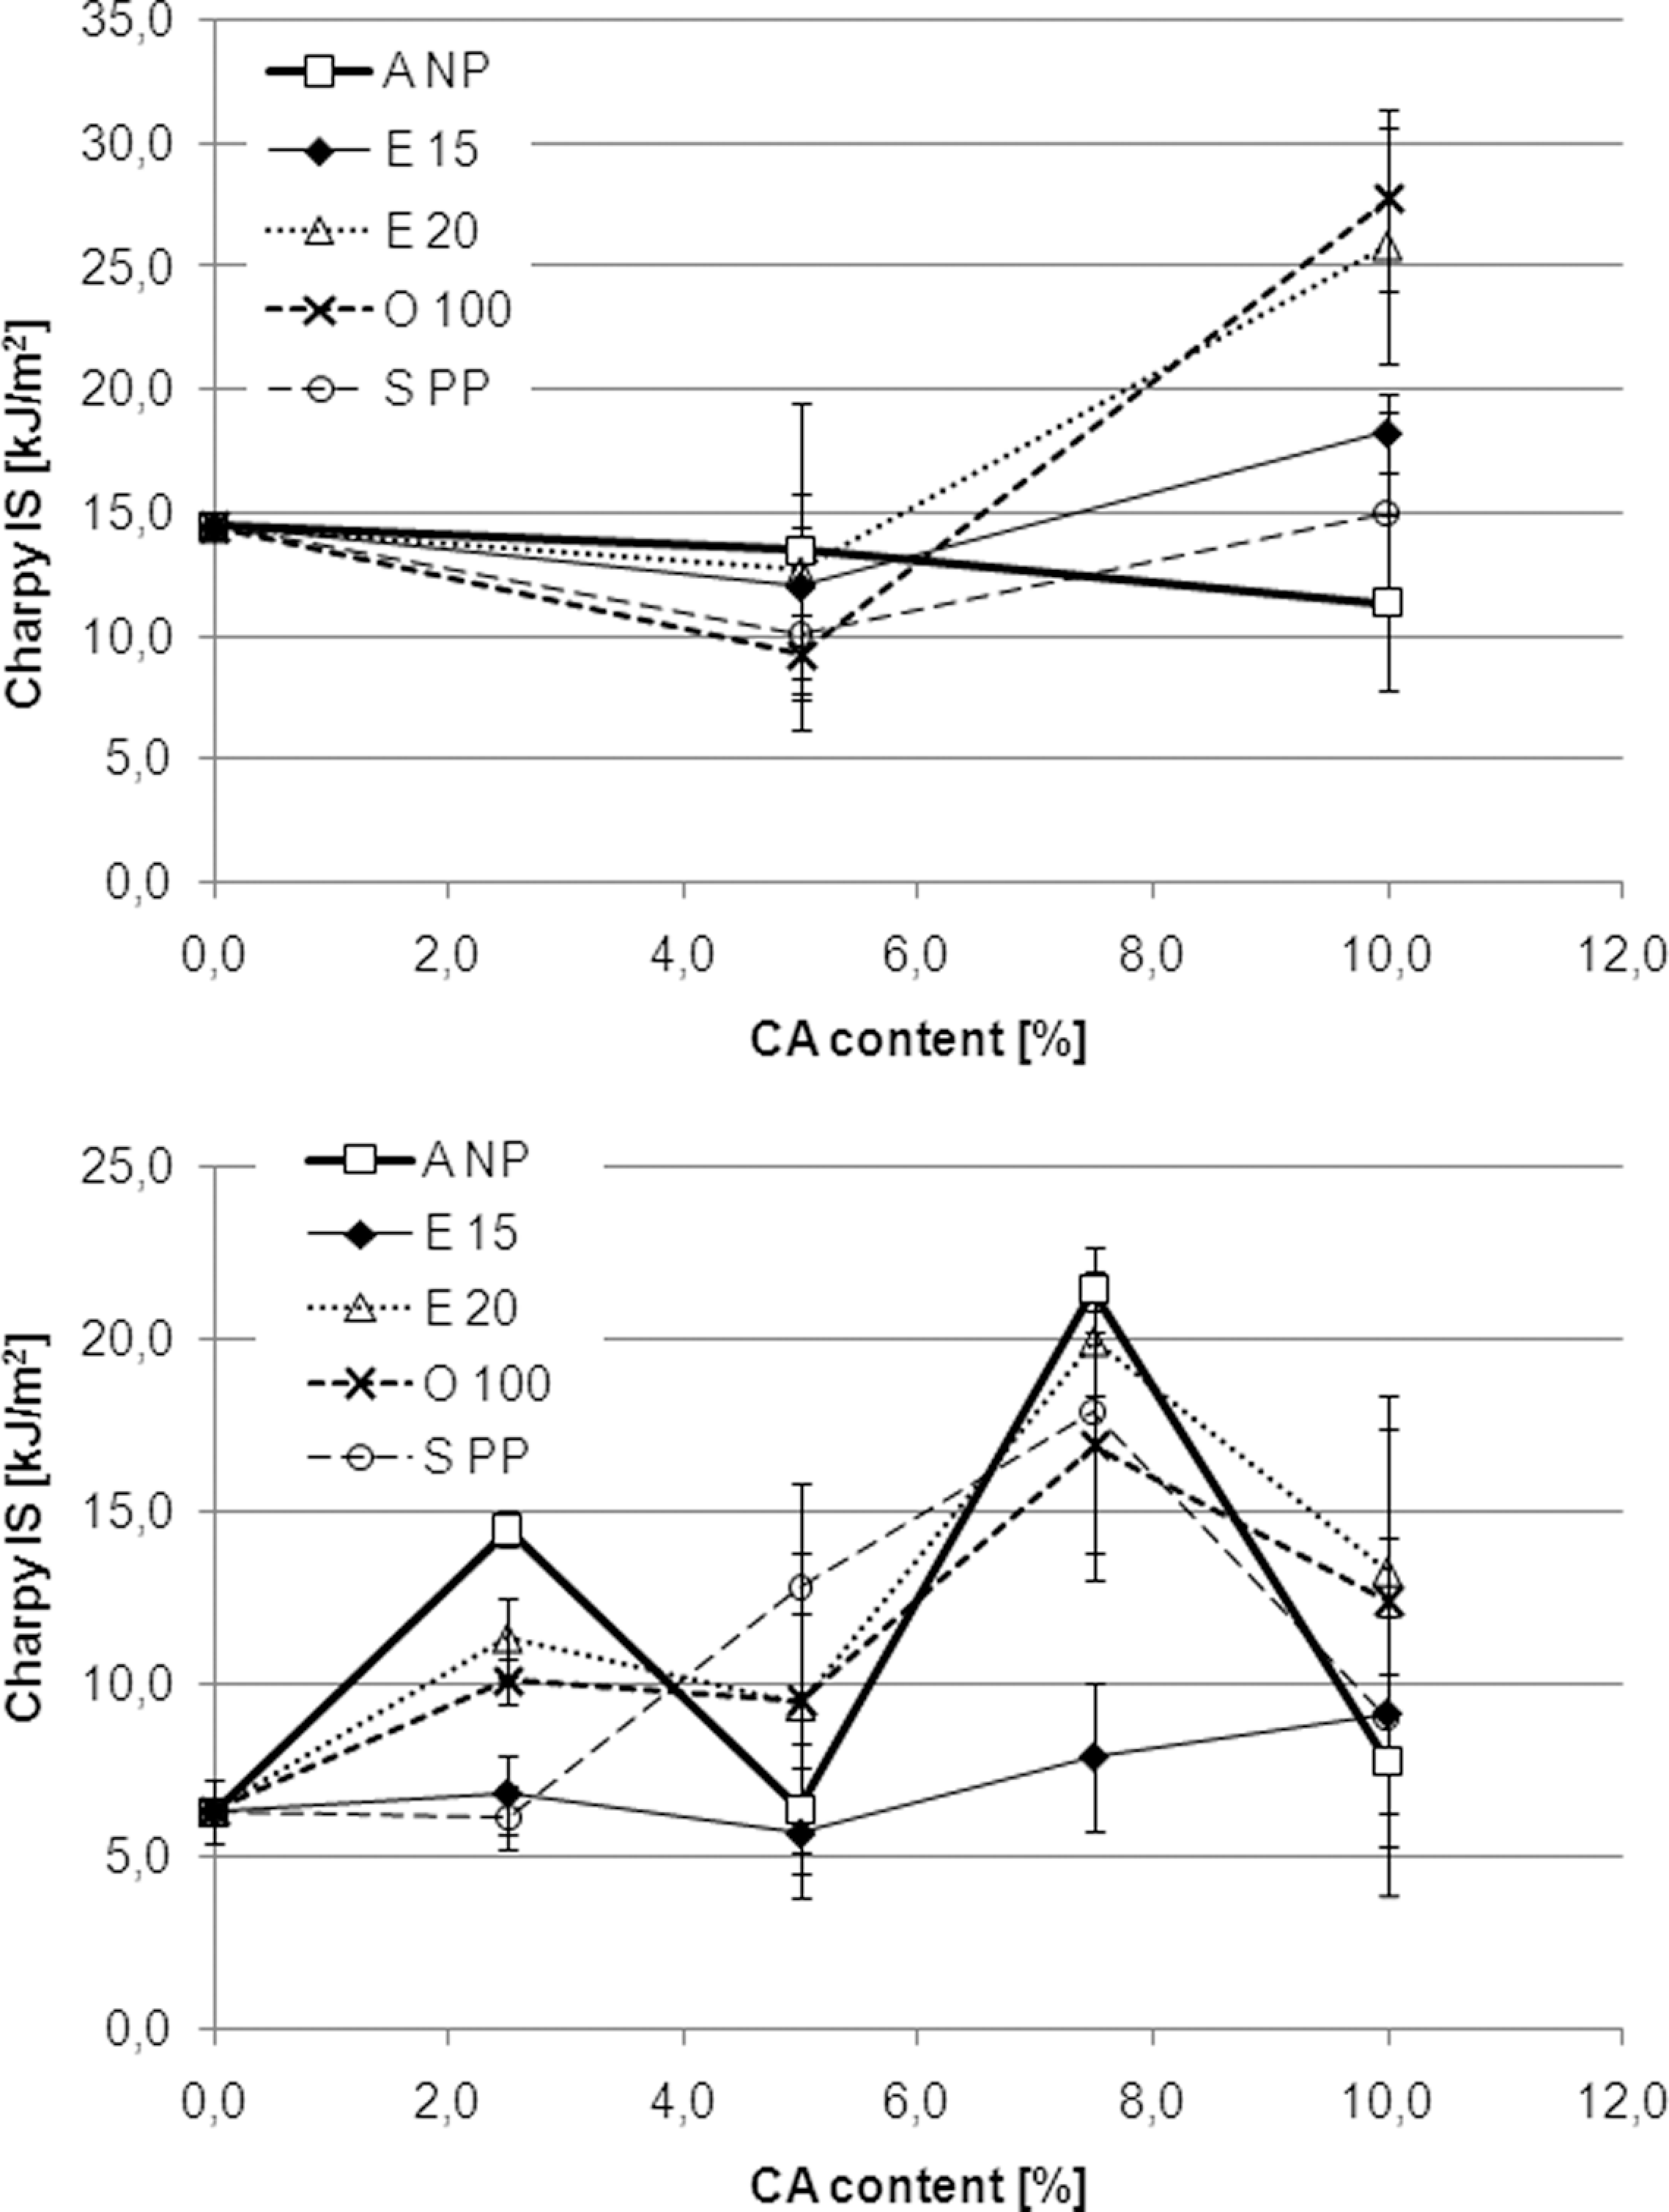
Charpy IS measured on unnotched specimens as a function of CA type and content of WPCs with 40% (top) and 60% (bottom) wood content, respectively. CA: coupling agent; WPC: wood polymer composite; IS: impact strength.
Both increases and decreases in IS resulting from the addition of MA-PP to PP-wood composite systems are found in the literature. With unnotched specimens in a Charpy test setup, effects ranging from + 4% (PP-35% wood) 33 to + 50% (PP-50% wood) 28 are reported. With the (especially, in the US more popular) Izod setup, effects of addition of MA-PP is reported 34 to range from 0 (PP-30% wood) to + 67% (PP-40% wood). 35 Interestingly, when notched specimens are used, reduction in both Charpy and Izod IS upon addition of MA-PP is often reported. 21,32,36,37
The more complex dependence of impact behavior on interfacial adhesion can be explained by two mechanisms: crack initiation and plastic deformation of the matrix. The first mechanism is dependent on the size of the defects introduced by the fillers. By improving interfacial adhesion, the likelihood of a wood particle to act as a crack initiation site is reduced. Thus, IS, which is dominated by this mechanism, can almost always be increased by improved coupling. For NIS, however, crack propagation is crucial. In this case, energy is most effectively dissipated by plastic deformation of the matrix. This in turn is assisted by debonding of the filler particles under load. Increased fiber/matrix interaction can prevent debonding, and thus inhibits plastic deformation as an energy dissipation mechanism. The interplay of those two factors is probably the reasons for the ambiguous effects of MA-PP coupling on NIS. 38
Heat deflection temperature
Figure 5 shows the effects of various CA types and contents on the HDT-A of WPCs with 40 and 60% wood content, respectively. Obviously, the improved interfacial interaction does not significantly influence this material property at the lower filler level. Interestingly, at the higher filler level, 5.0% of the lower M w CAs do allow a significant increase in HDT-A compared with the uncoupled compound. Besides that no significant differences in performance between the five MA-PP types investigated can be observed
We have not found any published data on the influence of MA-PP CAs on HDT properties of NFCs and WPCs. With the specimens of 2 mm thickness that were used for mechanical characterization, an outer fiber strain of approximately 0.18% is achieved in the HDT-A test. This is within the standardized strain region for modulus determination. Thus, it is not surprising that the effects of MA-PPs on stiffness and on HDT as observed in this study are of similar magnitude. The positive effect of 5.0% of the lower M w MA-PPs observed at the higher filler level is thus surprising. Because of the considerations given above, it seems unlikely that the improved interfacial adhesion is responsible for this. However, it is possible that the CAs influence crystallization and that this in turn takes effect on the heat deflection temperature.
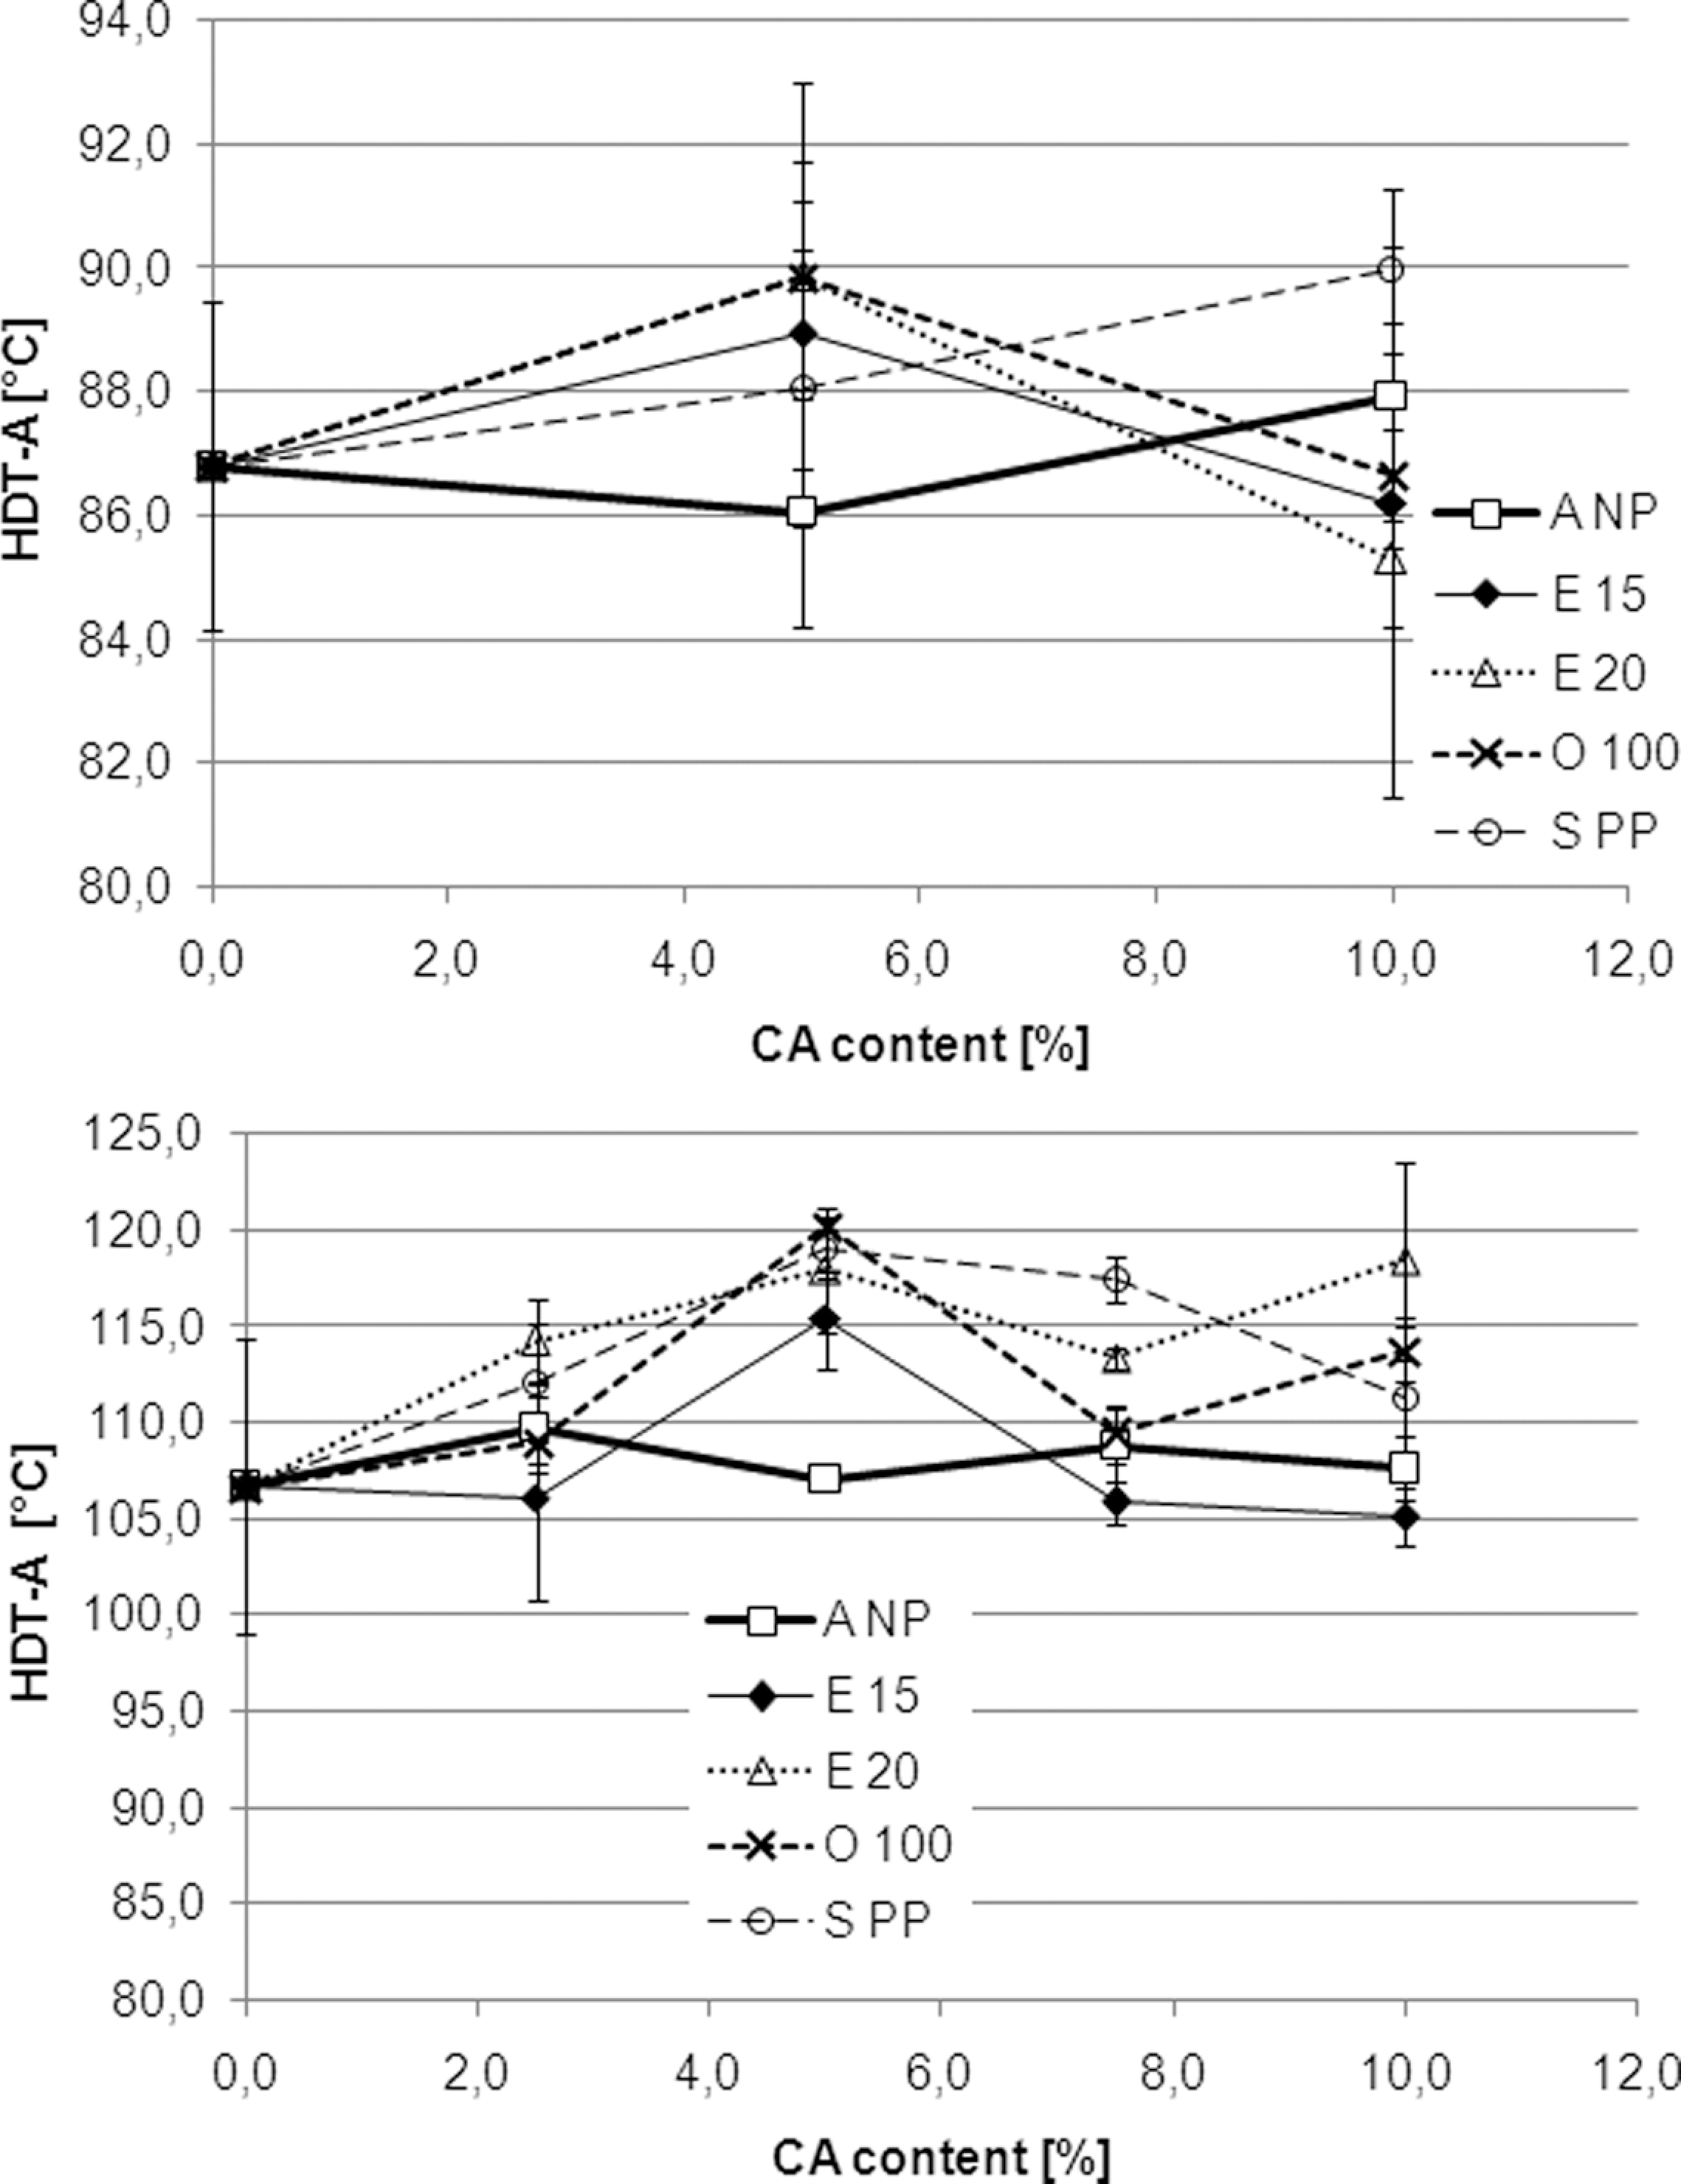
HDT mode A as a function of CA type and content of WPCs with 40% (top) and 60% (bottom) wood content, respectively. CA: coupling agent; WPC: wood polymer composite; HDT: heat deflection temperature.
Water absorption
Figure 6 shows the effects of various CA types and contents on the water absorption (WA) of WPCs with 40 and 60% wood content, respectively. What can be observed at the first glance is that the addition of MA-PP generally leads to significant reductions of this material property. At the lower wood content, increasing the CA content from 5.0 to 10.0% does not lead to further reductions in WA (with the exception of the E15 type). At the higher wood content, the picture is somewhat different. Here, increasing the CA-content from 0.0 to 10.0% leads to a gradual decrease in WA, at least for ANP, E20 and SPP. An optimum, or the onset of a plateau, is found for E15 and SPP at a content of 5.0%. With the ANP type, the lowest WA values can be achieved. As for most of the other material properties, the copolymer-based E15 type delivers the least performance.
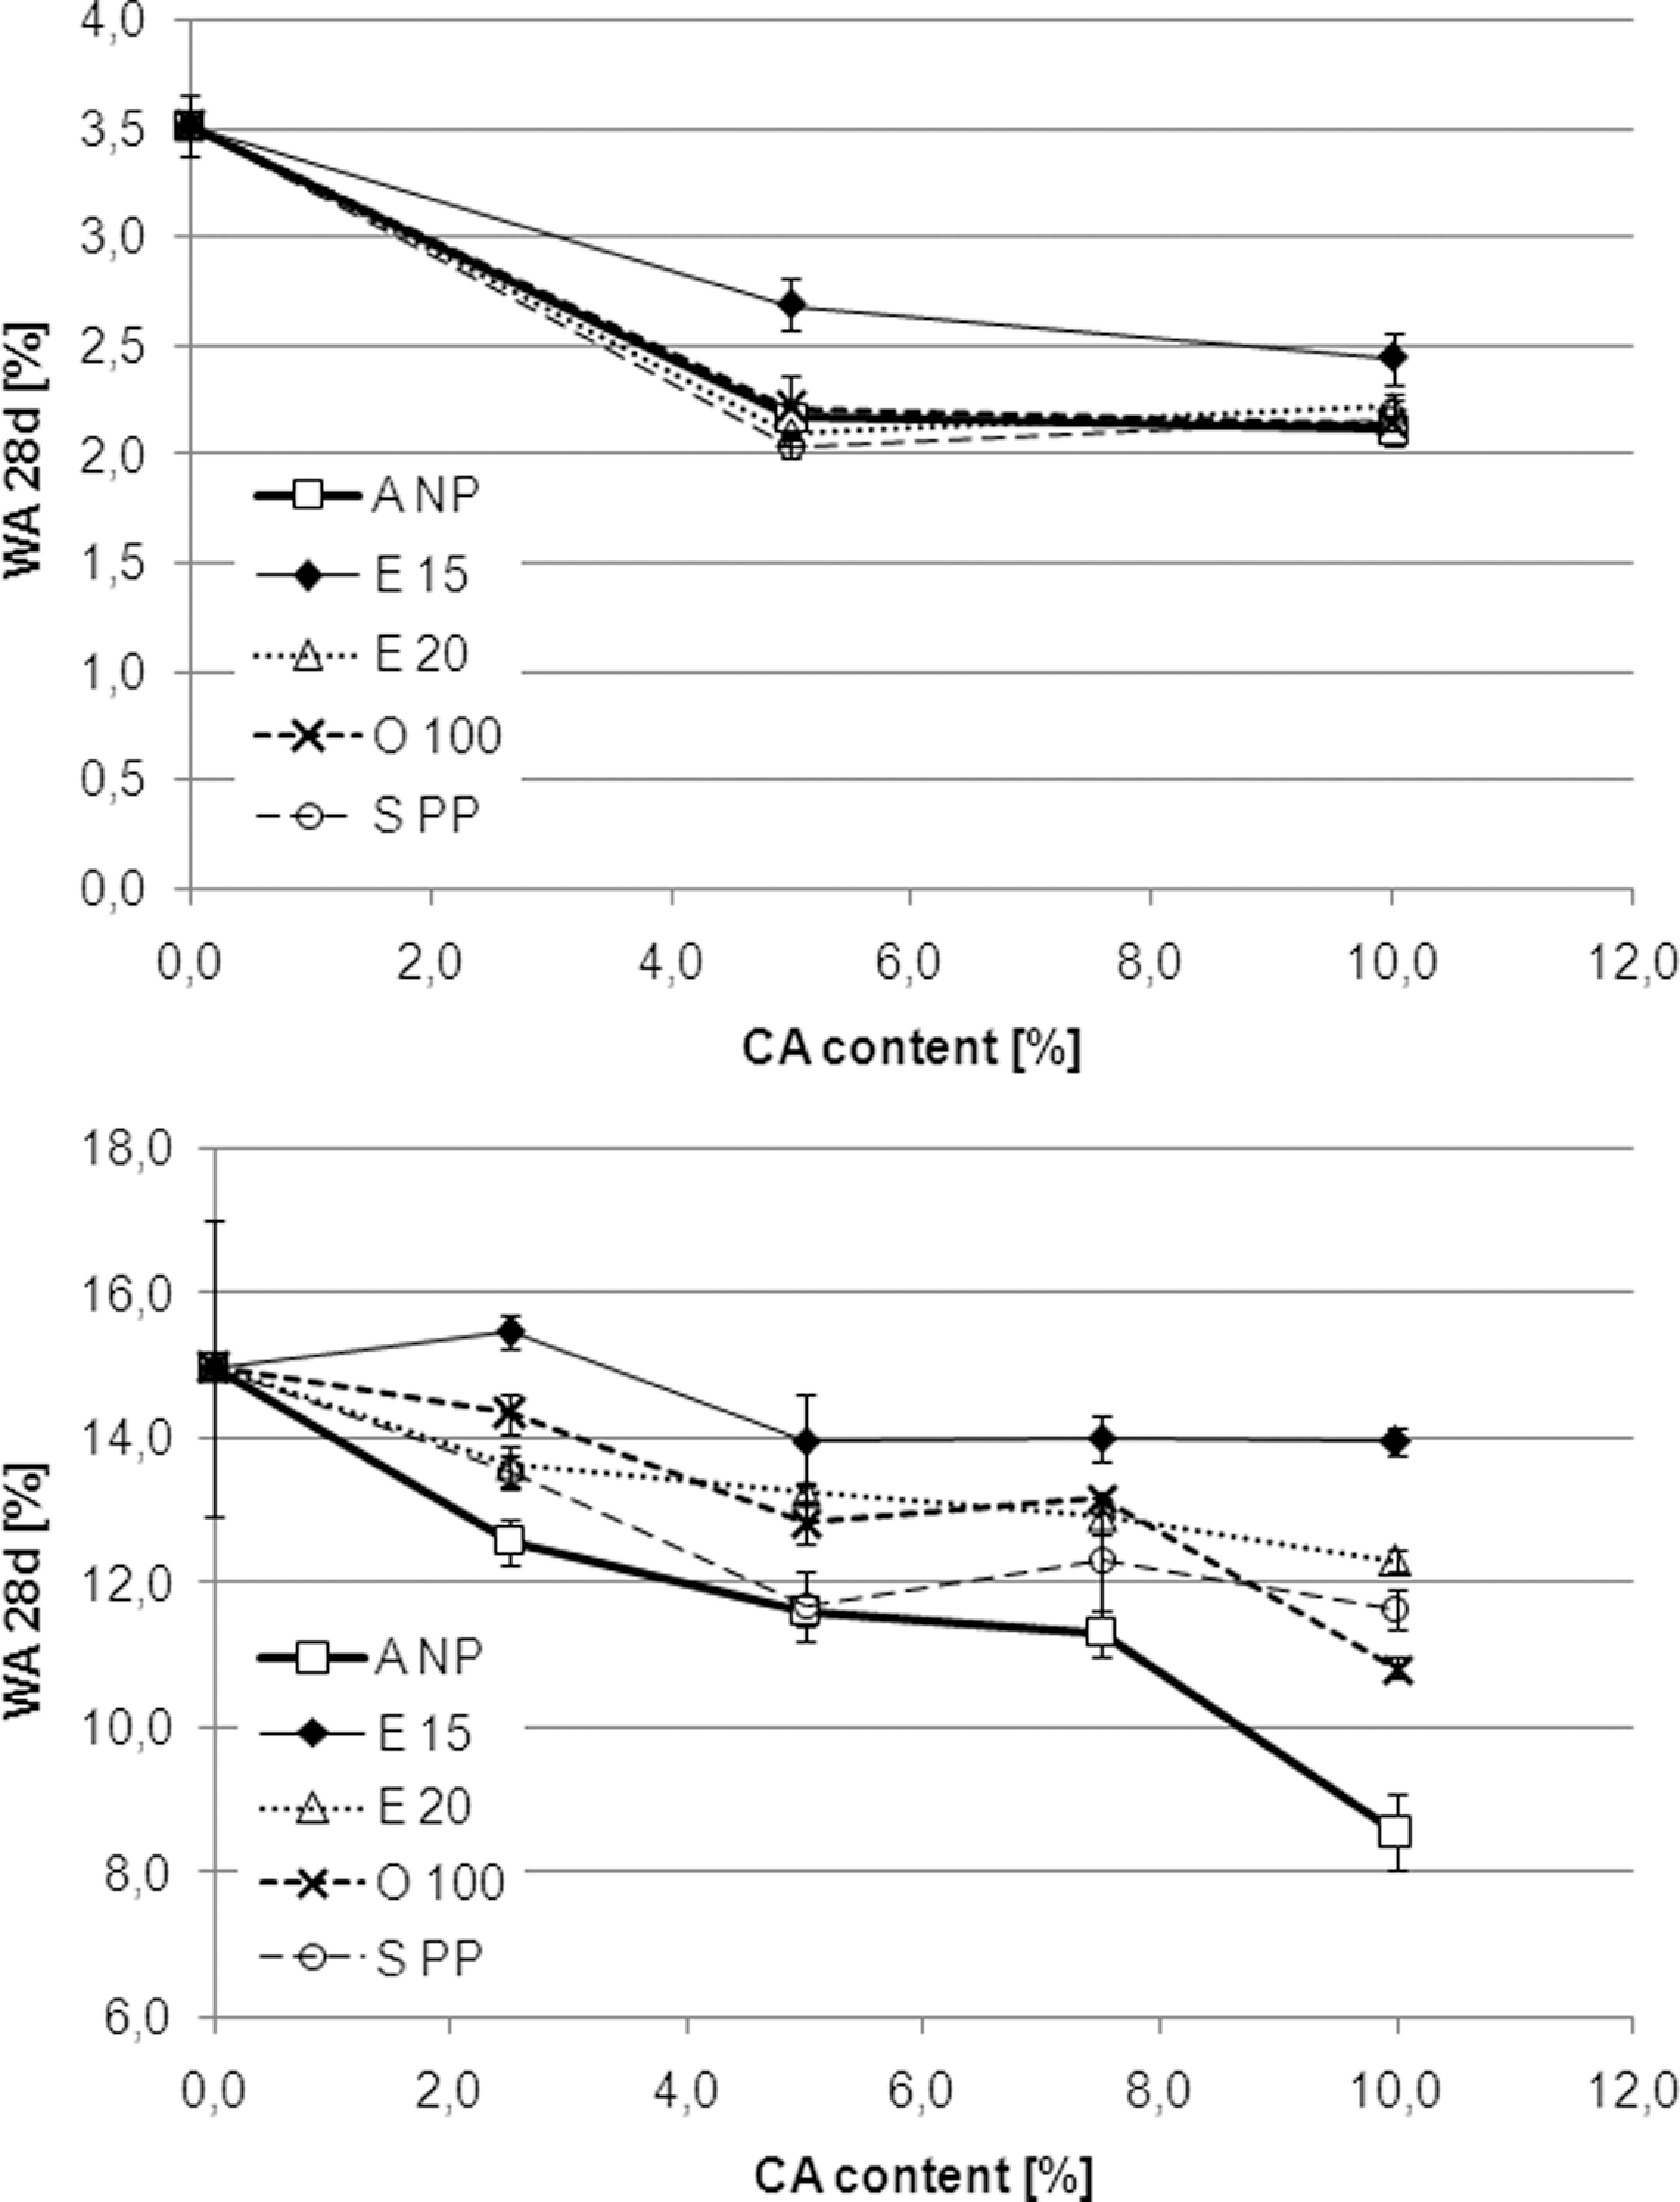
Water absorption measured as weight gain after 28 days of immersion as a function of CA type and content of WPCs with 40% (top) and 60% (bottom) wood content, respectively. CA: coupling agent; WPC: wood polymer composite.
Water absorption of PP-wood composites as influenced by MA-PP type and content in the formulation has been investigated by relatively few researchers. Nachtigall et al. worked with PP-30% wood composites compounded on a kneader and specimens prepared from injection molded sheets. With 16.7% MA-PP, the group reports WA upon 24 h of immersion reduced by 15%. When the CA content is increased further, WA increases again. 24 Zhang C et al. found that the WA upon 20 days of immersion reduced by 30% in PP-40% wood composites with 5.0% MA-PP. 6 Zhang Y et al. found that the WA upon 24 h of immersion reduced by 55%, employing 8.3% MA-PP, the upper limit of the CA content range investigated. 25
Our own results indicate that at 40% wood content, no more than 5.0% MA-PP need to be added for achieving optimum properties. At the higher wood content, however, increasing the content from 5.0 to 10.0% for most of the MA-PPs used also leads to further reductions in WA. Furthermore, it becomes obvious that the ANP type, which has the lowest MFR value and the highest molecular weight, delivers the best WA properties, that is, the lowest weight gains upon specimen immersion. If this is the result of a higher entanglement density of MA-PP backbone chains with the matrix polymer chains, it is surprising that corresponding effects cannot be observed for the mechanical properties measured. Interestingly, a study performed by our group investigating the effects of matrix PP M w on WPC performance comes to a similar finding (paper in preparation). The copolymer-based E15 type again shows the least performance, while there are no significant differences among the other three types.
Fracture surface SEM
Figures 7 to 9 show SEM micrographs of fracture surfaces generated in Charpy IS testing. All composites shown have a wood content of 60%. While Figure 7 shows an uncoupled WPC; Figures 8 and 9 show compounds coupled with 7.5% of the MA-PPs E15 and E20, respectively. As to the first compound, in the left picture, a wood particle protruding from the fracture surface indicates pull-out. At the wood-PP interface, a gap can be spotted. On the right micrograph, the holes in the surface result from pull-out, as well. For the E15-coupled composite, the overall impression is similar. The left picture clearly shows a gap between the particle in the middle and the surrounding matrix. In the right micrograph, a pulled out particle is visible in the middle.
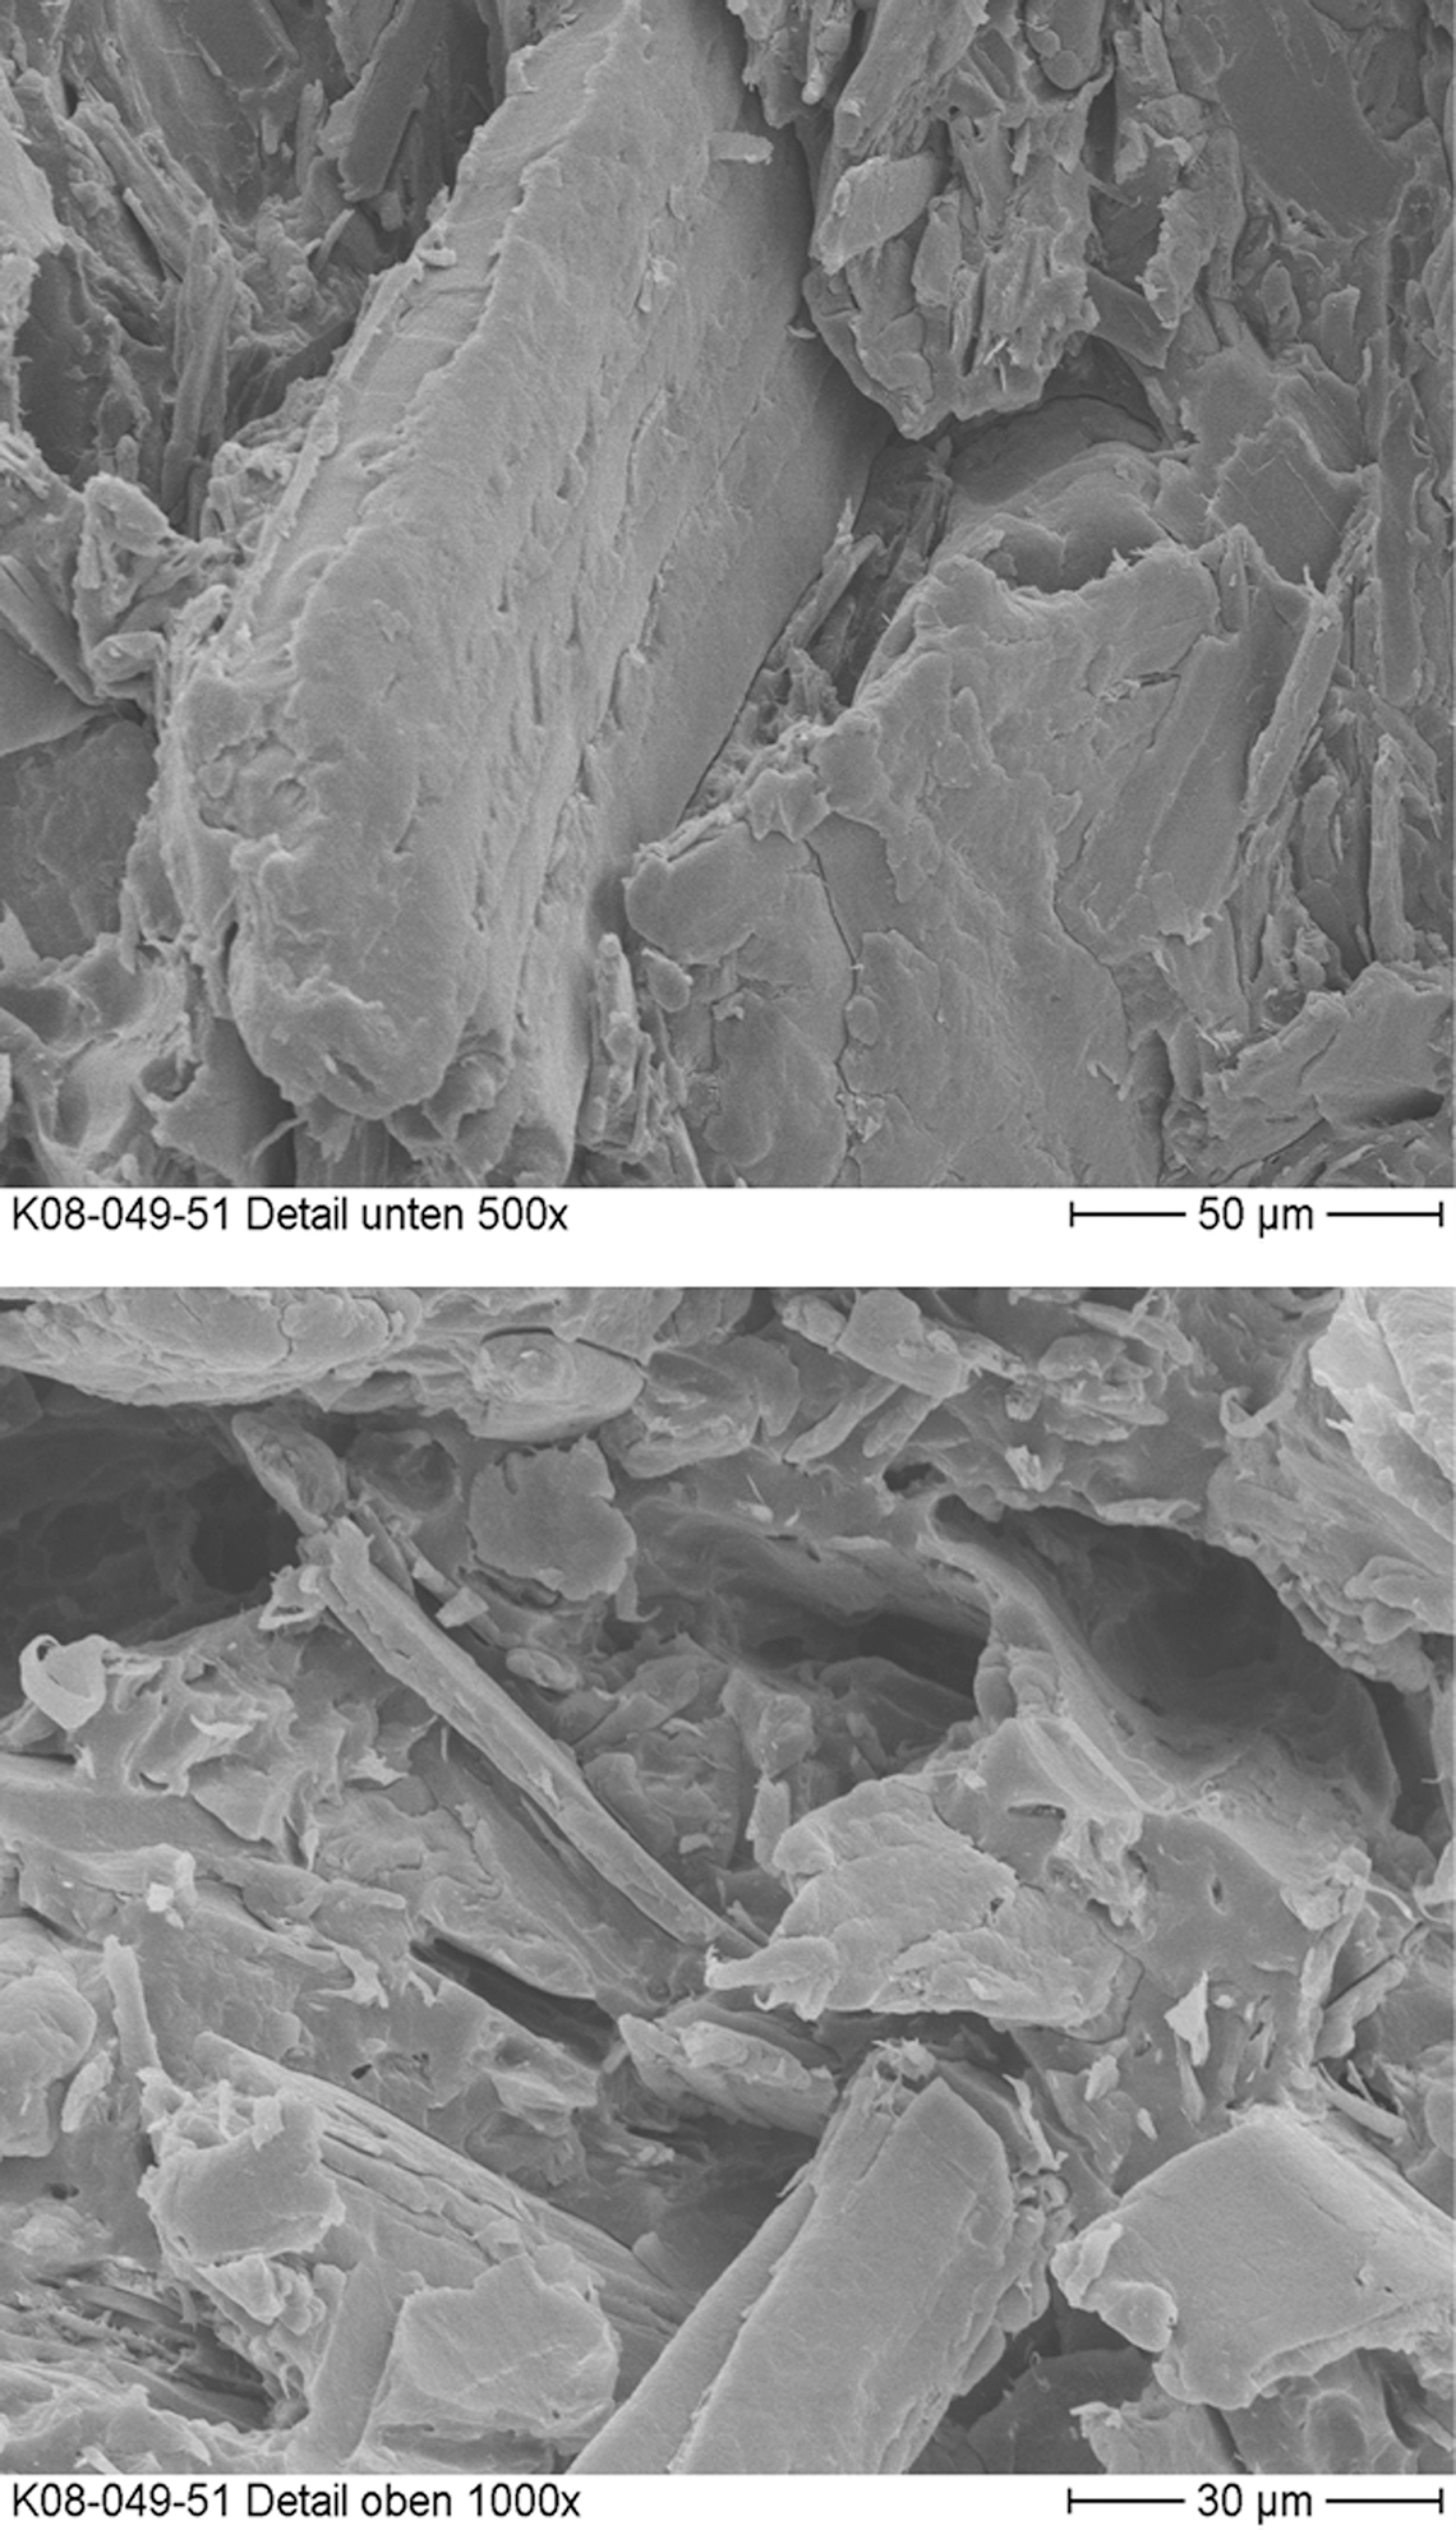
Scanning electron micrographs of fracture surfaces from Charpy IS testing. Compound: 60% wood, no CA; top: magnification ×500; bottom: magnification ×1000. CA: coupling agent; IS: impact strength.
Scanning electron micrographs of fracture surfaces from Charpy impact strength testing. Compound: 60% wood, 7.5% E15; top: magnification ×250; bottom: magnification ×500.
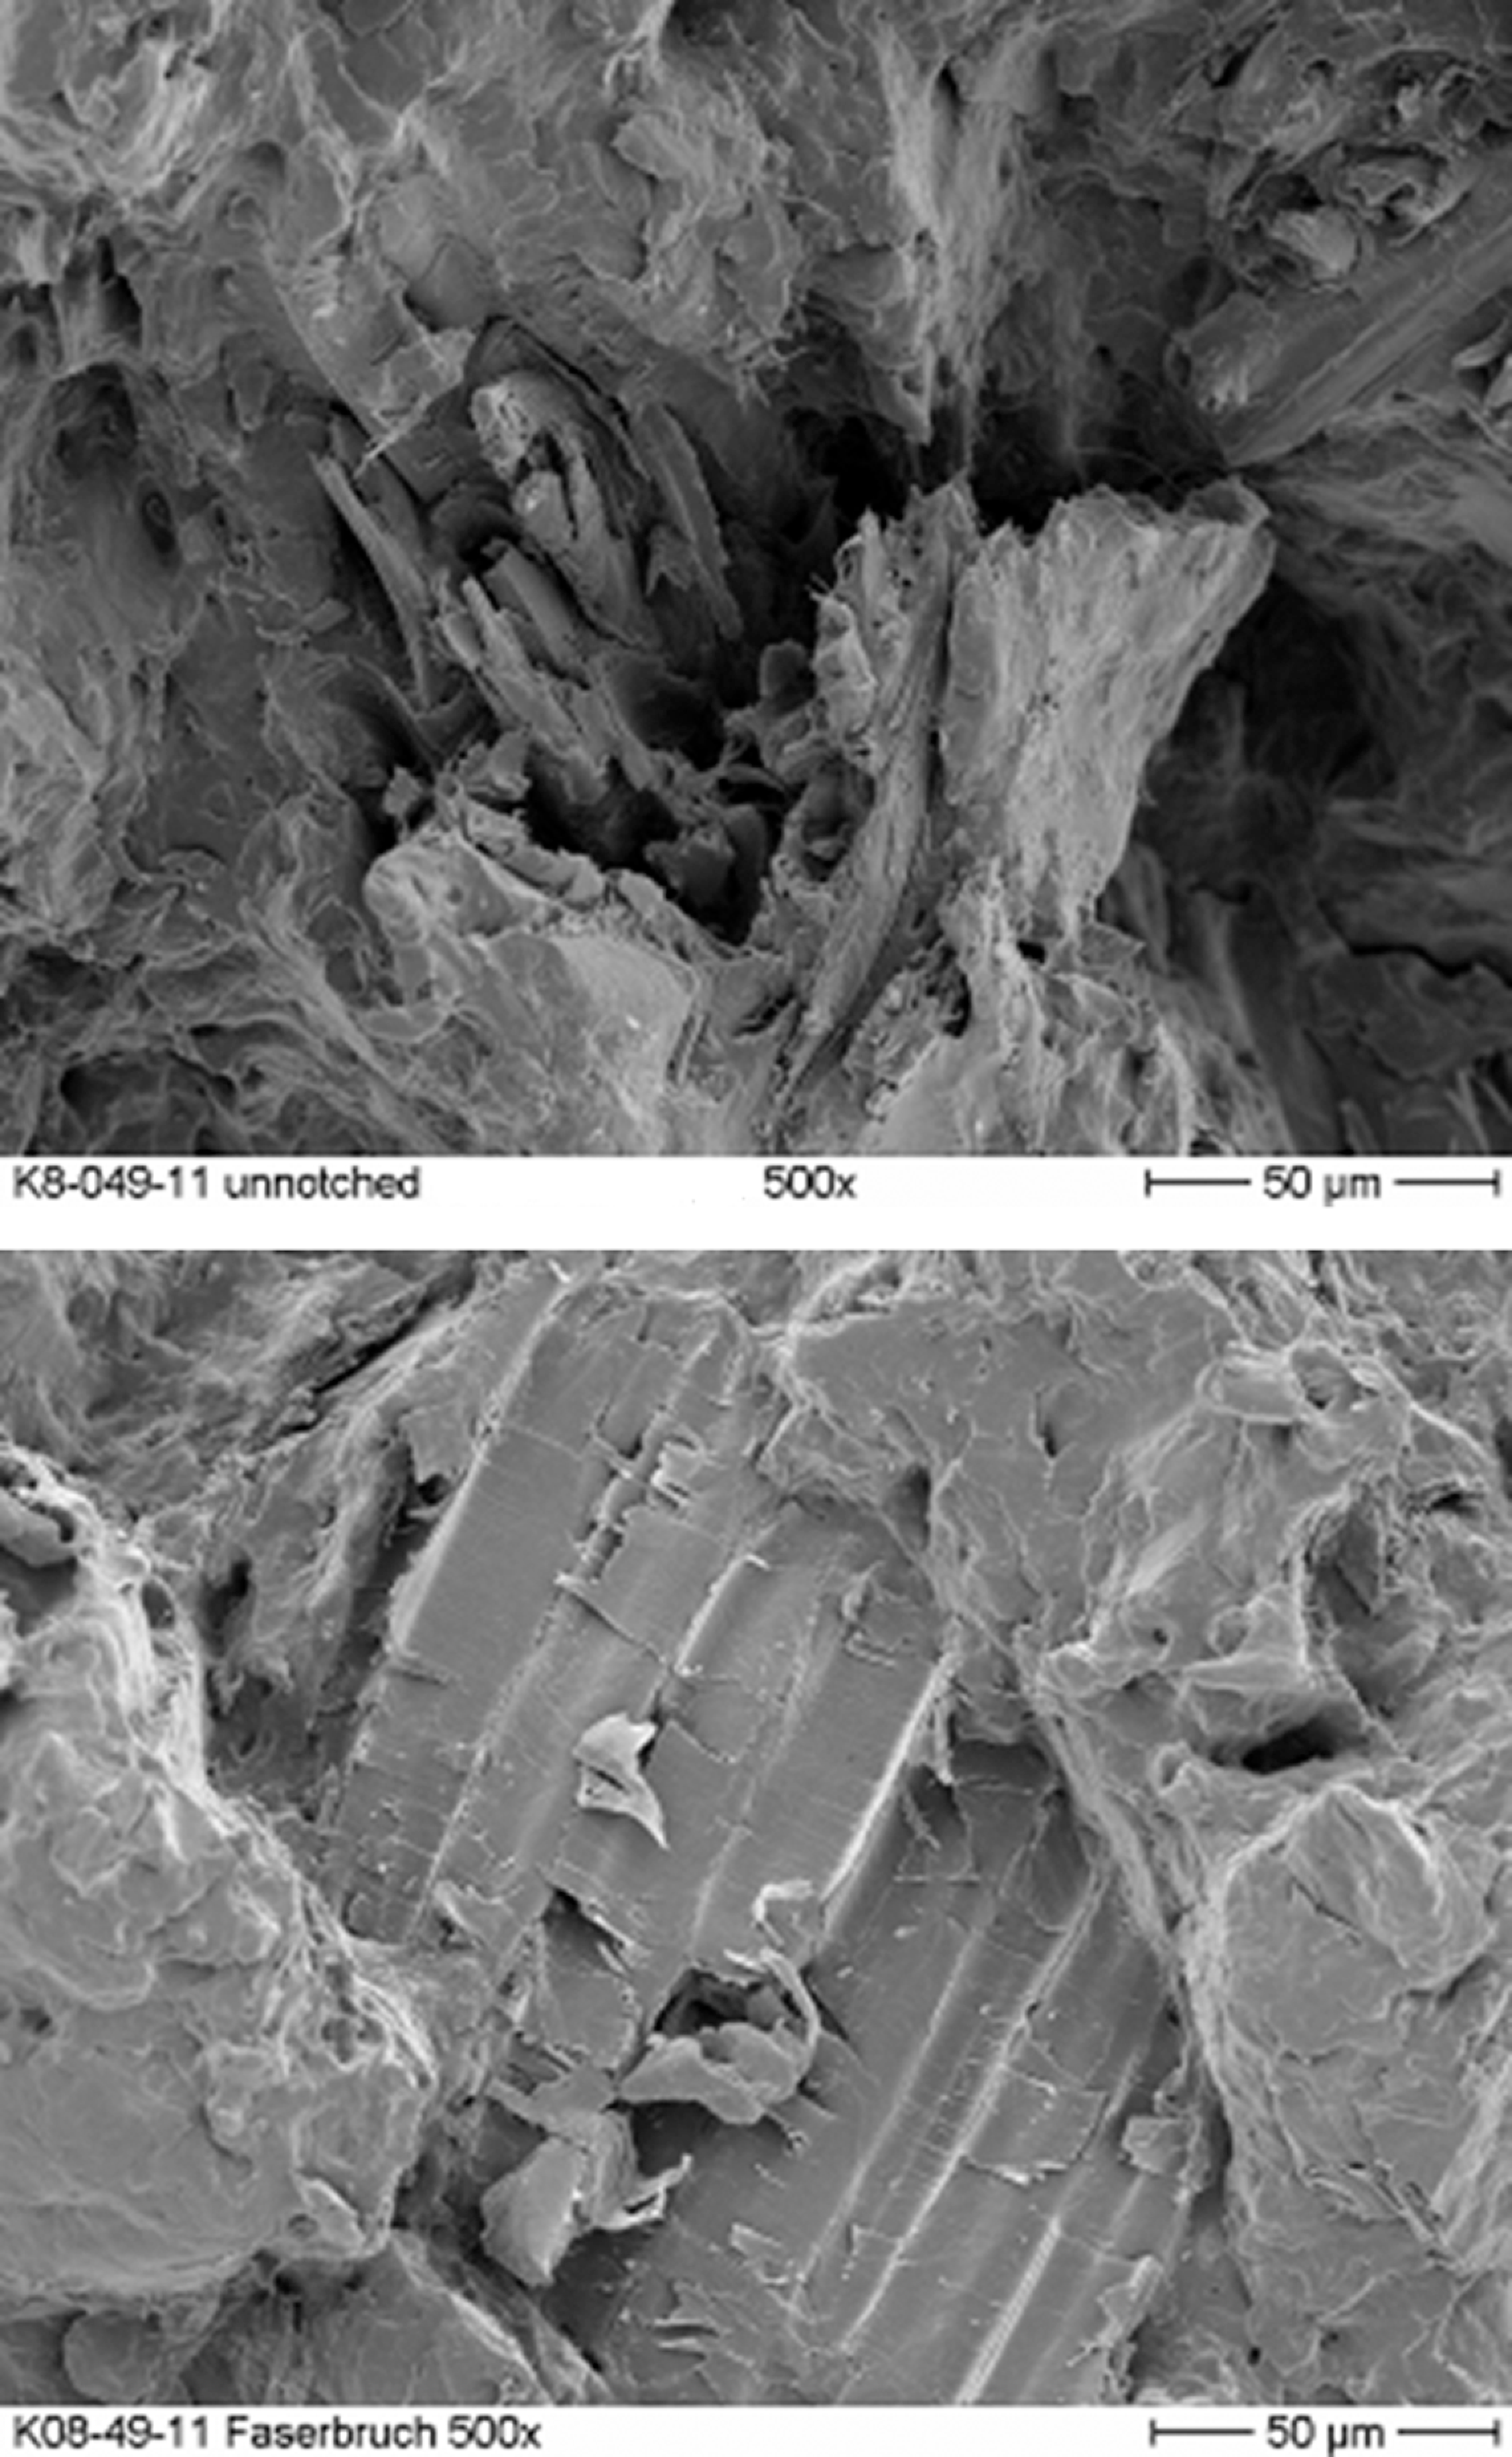
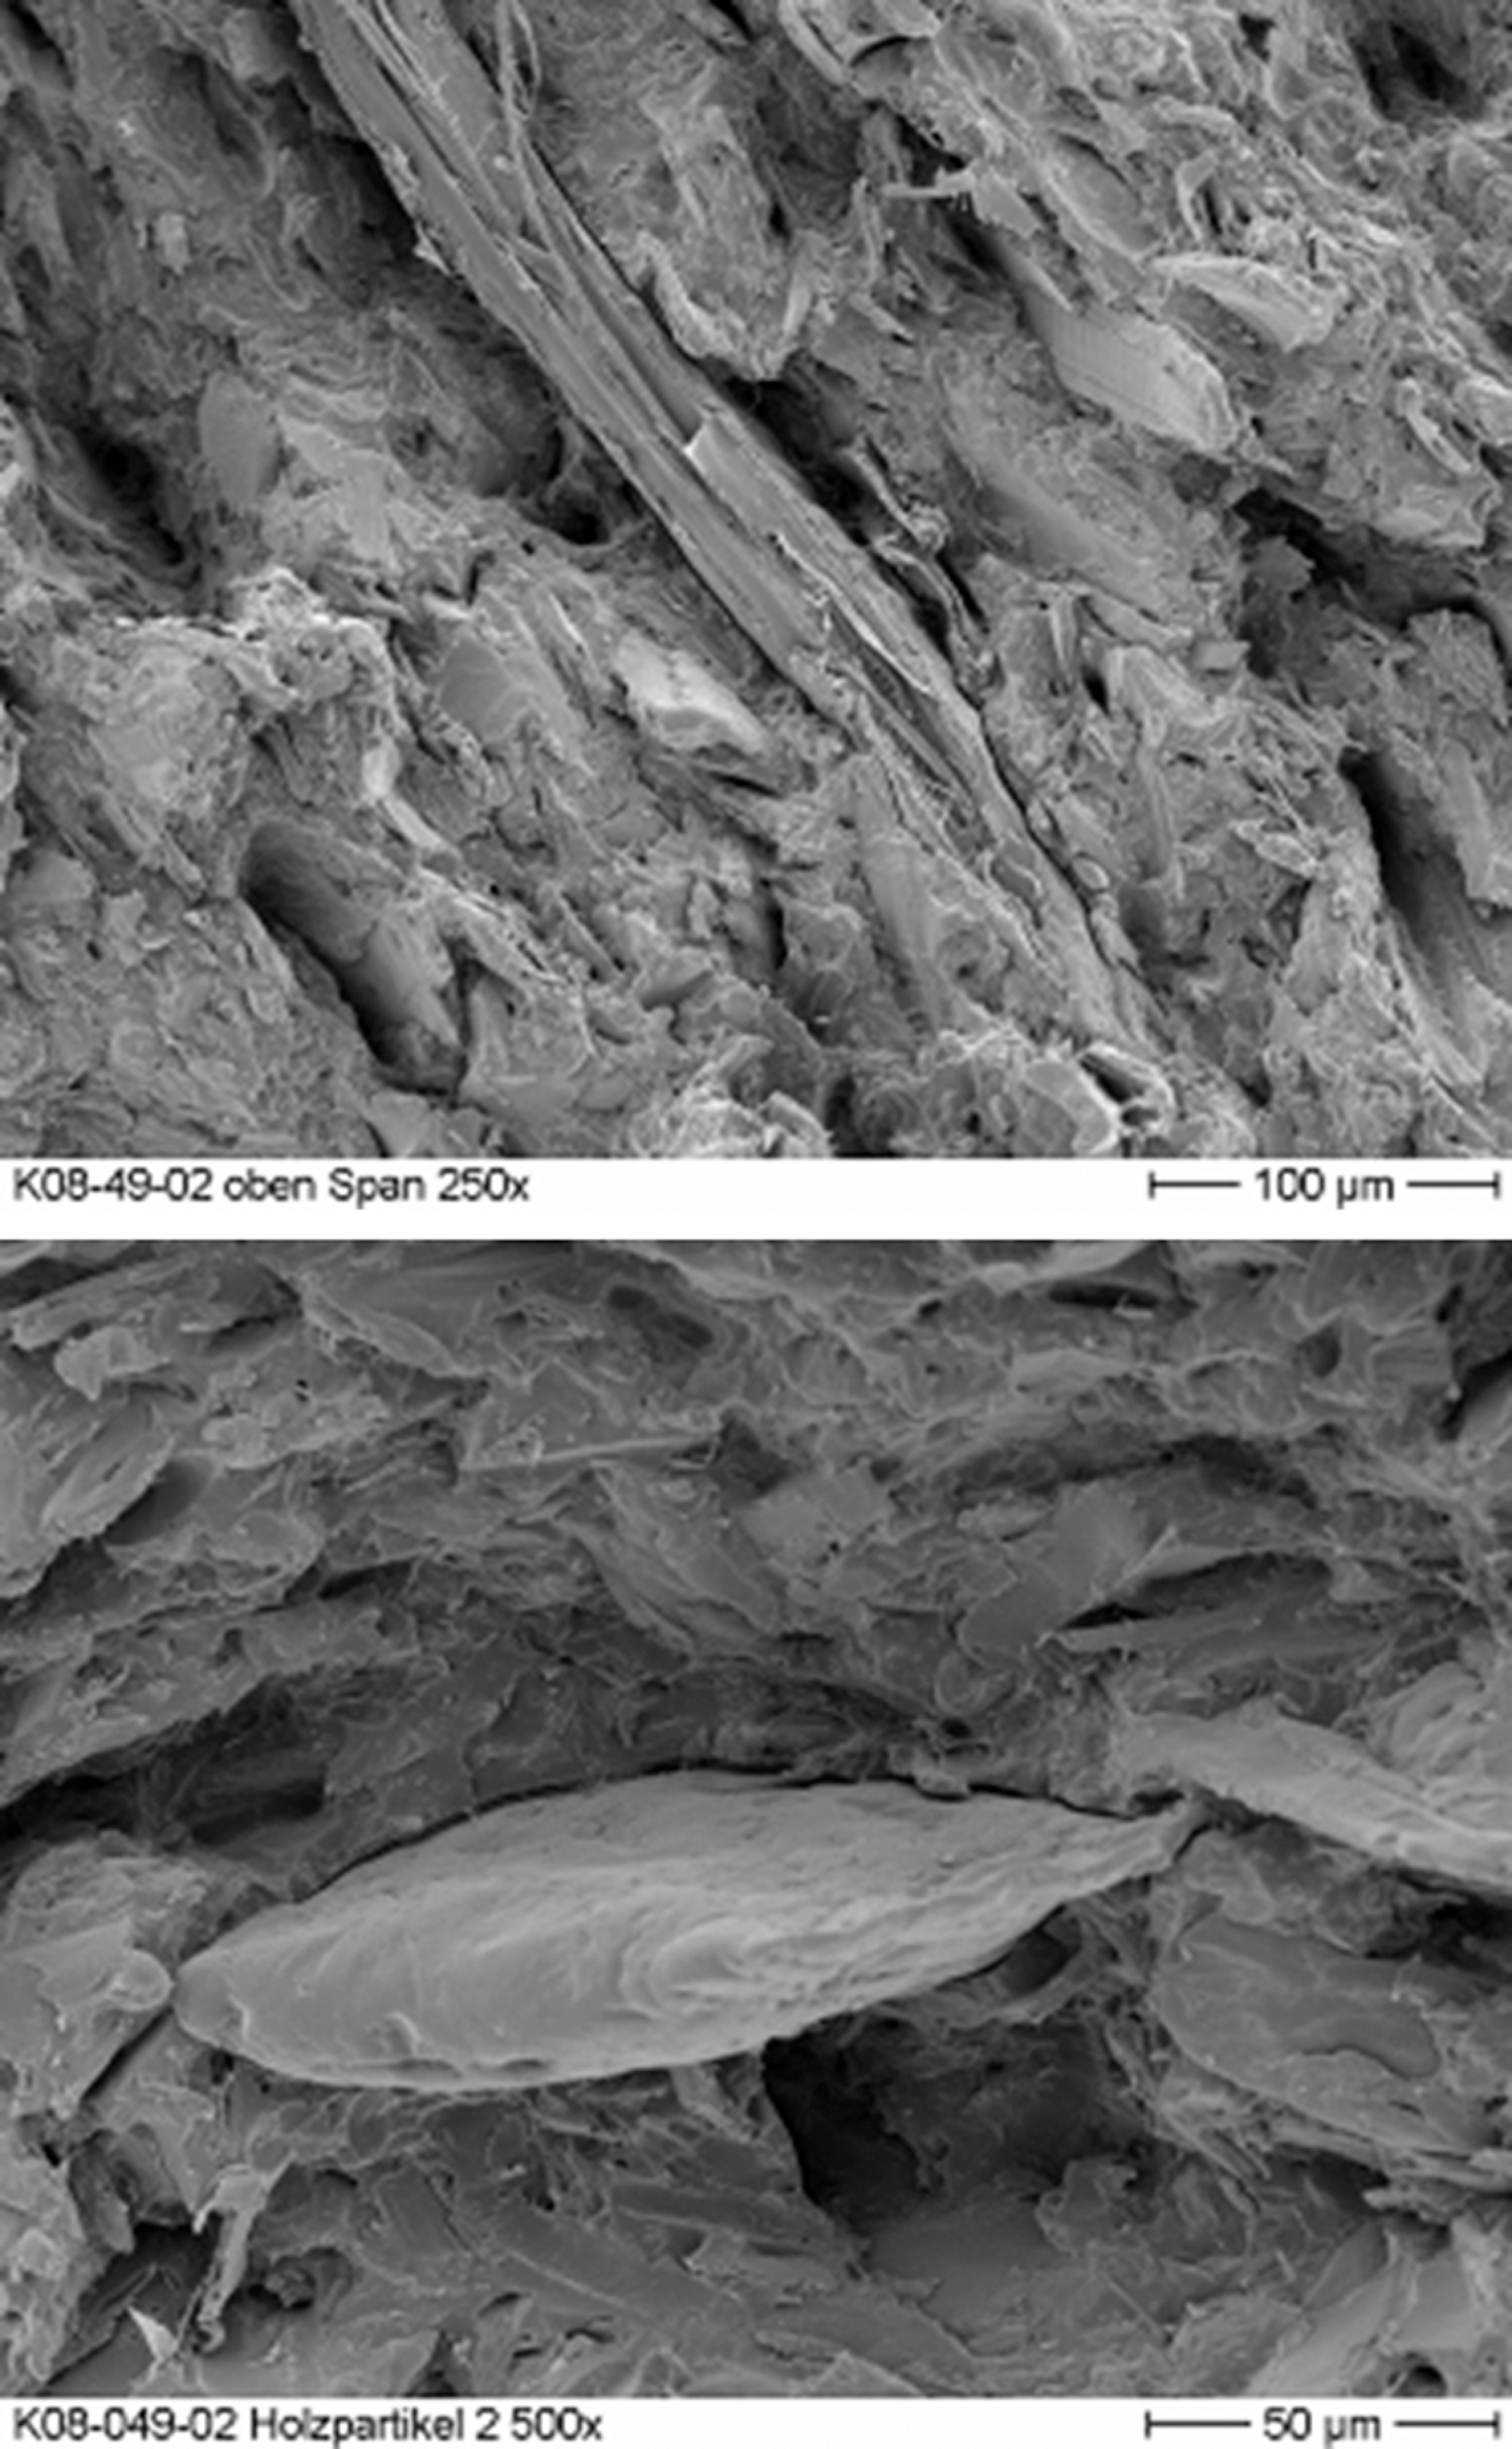
Scanning electron micrographs of fracture surfaces from Charpy impact strength testing. Compound: 60% wood, 7.5% E20; top: magnification ×500; bottom: magnification ×500.
Figure 9 representing the E20-coupled composite, shows quite different features. In the left picture, a wood particle fractured perpendicular to the fiber orientation can be seen, indicating better stress transfer via the particle/matrix interface. The right micrograph shows a particle fractured parallel to the fiber orientation. Along the contour marking the interface, hardly any gaps can be detected. The general fracture surface impression is similar for composites coupled with ANP, O100 and SPP. Thus, uncoupled and E15-coupled composites both show features that indicate suboptimal particle/matrix interaction (pull-out and gaps at the interface). For the four MA-PP types that are superior to E15 regarding achievable mechanical properties, the fracture surfaces obtained show less pull-out, and fiber fracture is observed more often.
Rheological characterization
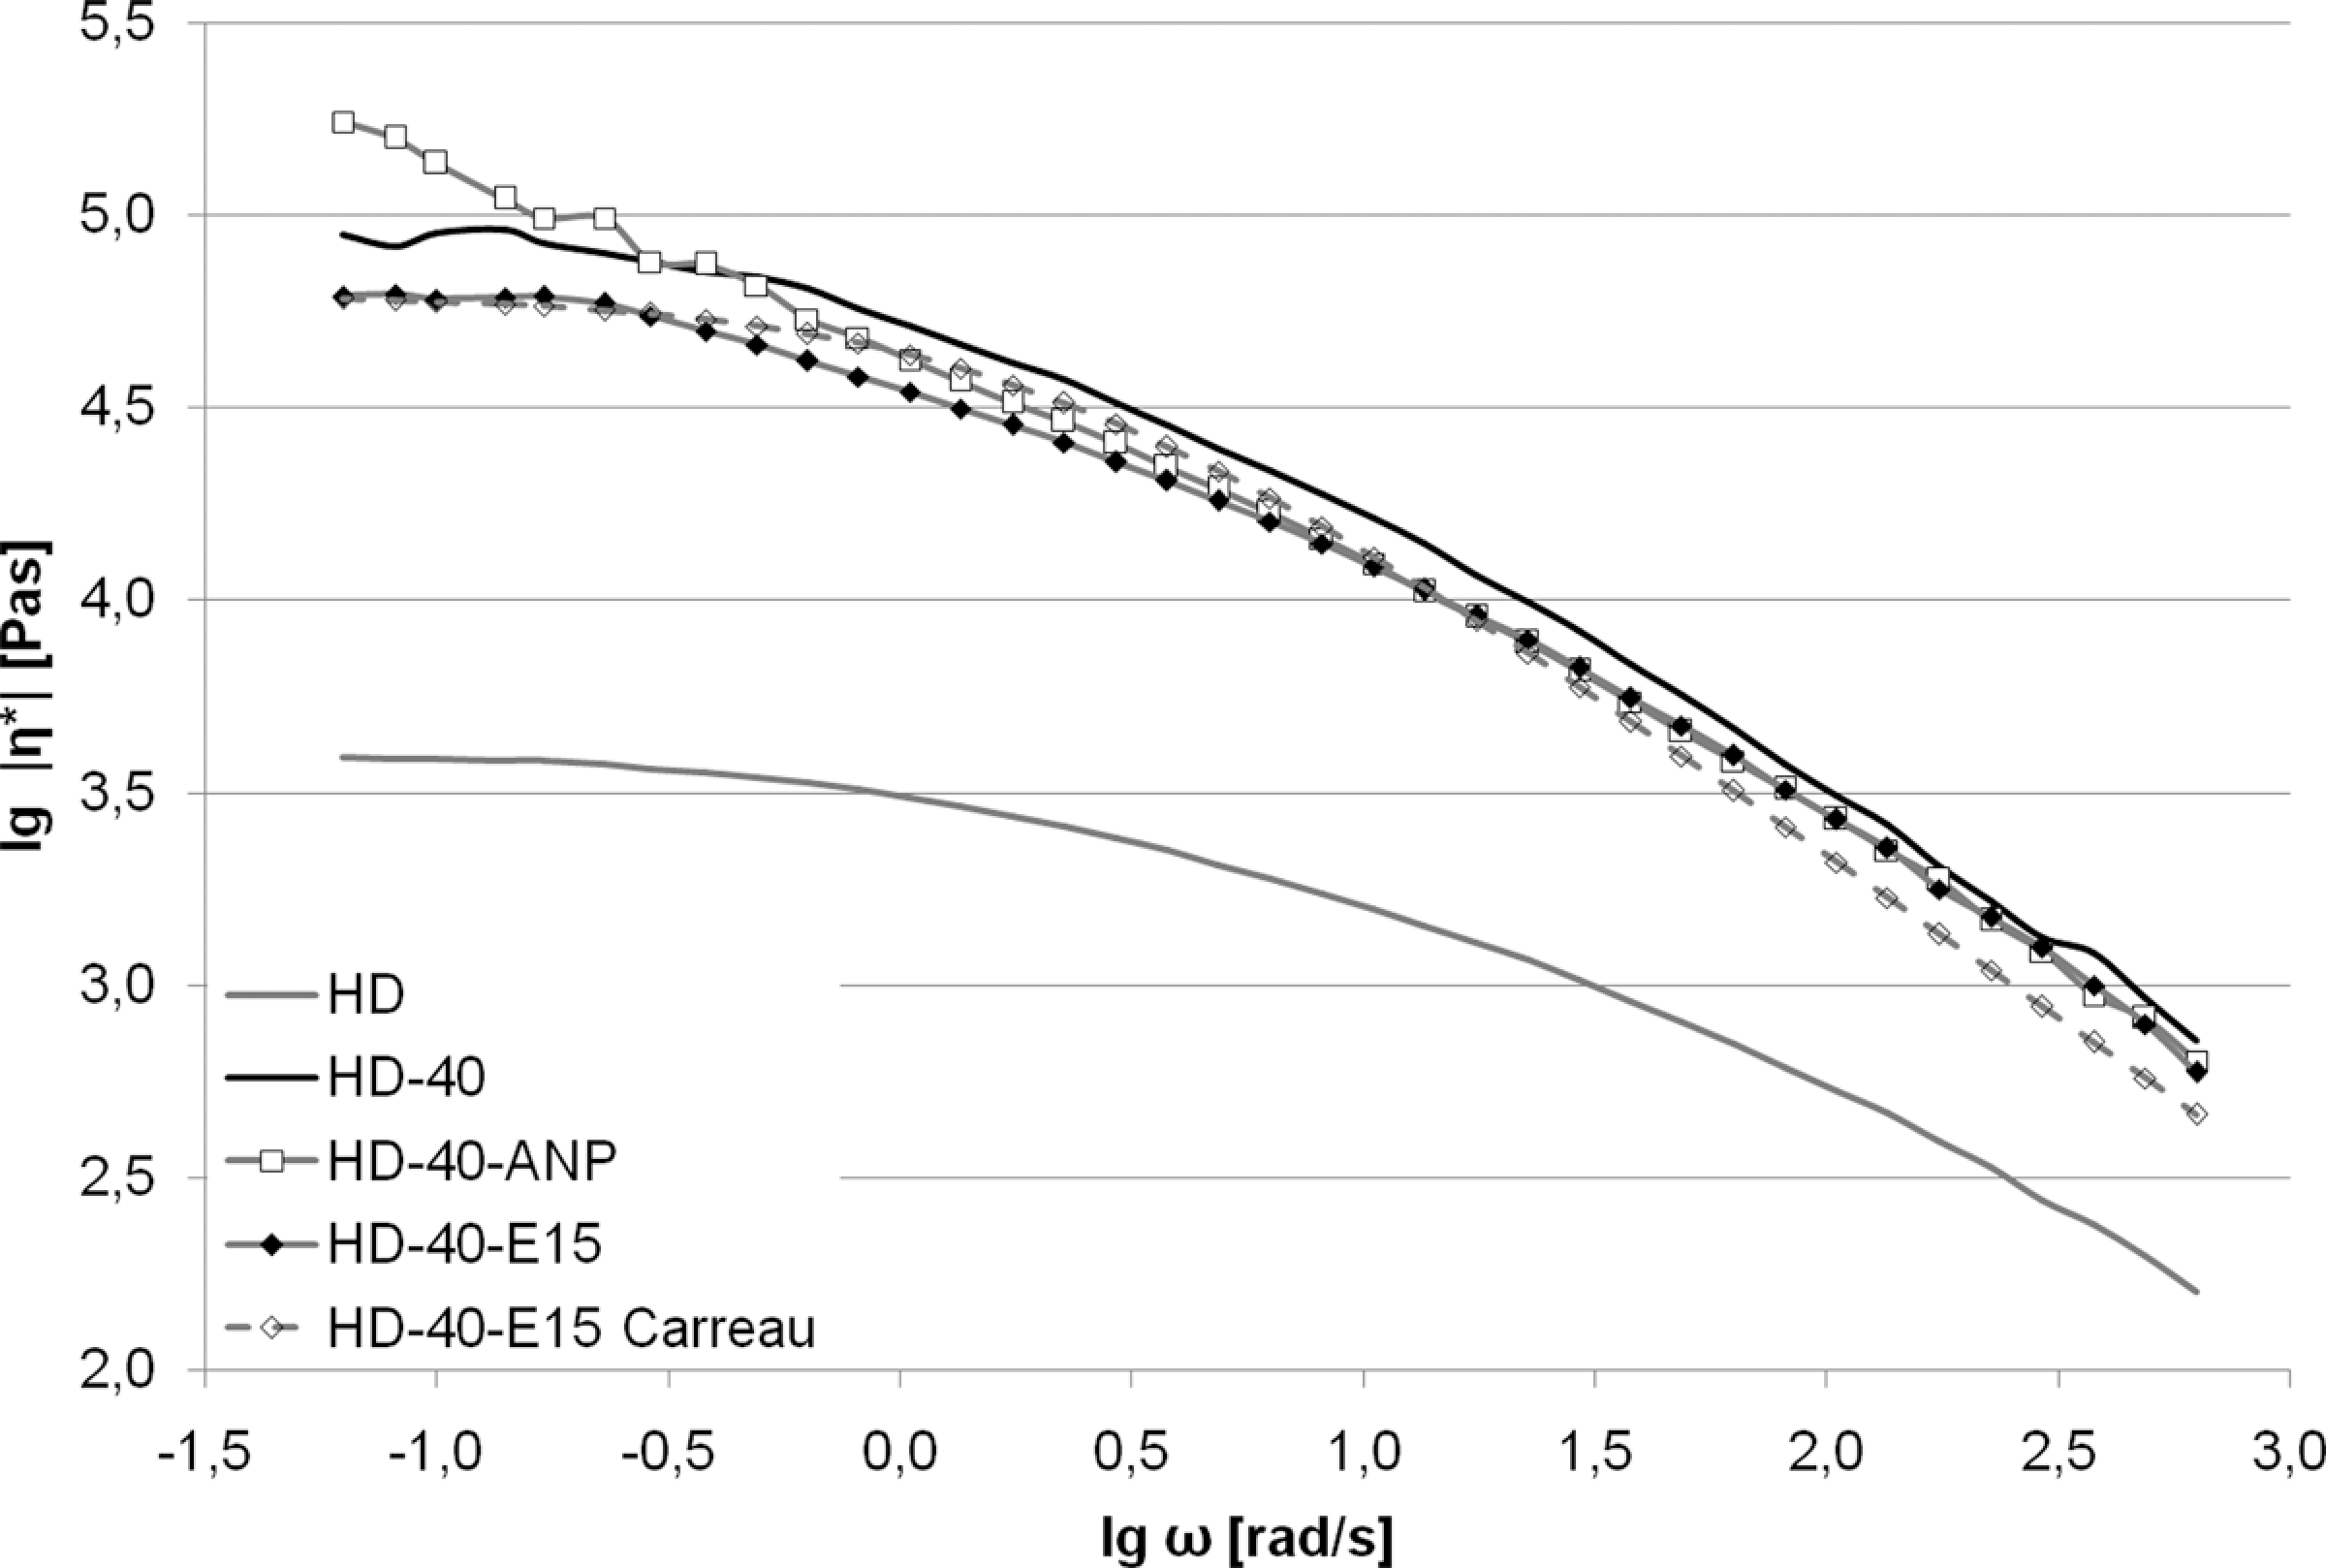
Characterization by dynamic rheometry was applied to the neat matrix polymer as well as to the uncoupled compound with 40% wood content and compounds coupled with 5.0% of the various CAs. For the sake of clarity, data are presented for only four of those materials in Figures 10 and 11. The three coupled compounds not shown here give flow curves somewhere in the area confined by those of HD-40-E15 and HD-40-ANP. Obviously, incorporation of 40% wood particles increases the complex viscosity of HD120MO by more than one decade (for low frequencies; Figure 10). Addition of a CA can have various results: While in the case of ANP type, the shape of the HD-40 flow curve is, especially for the low-frequency range, altered significantly, and it seems to be just shifted to lower values by the addition of 5.0% of the E15 type. The HD-40-E15 Carreau model coincides quite well with the respective original flow curve. Thus, fitting with this model seems justified.
Complex viscosity versus oscillation frequency as double-logarithmic diagram. HD is neat HD120MO, HD-40 the respective uncoupled compound with 40% wood content and HD-40-ANP/E15 are compounds coupled with 5.0% of the respective coupling agents. HD-40-E15 Carreau represents the Carreau model fit of the respective flow curve. CA: coupling agent.
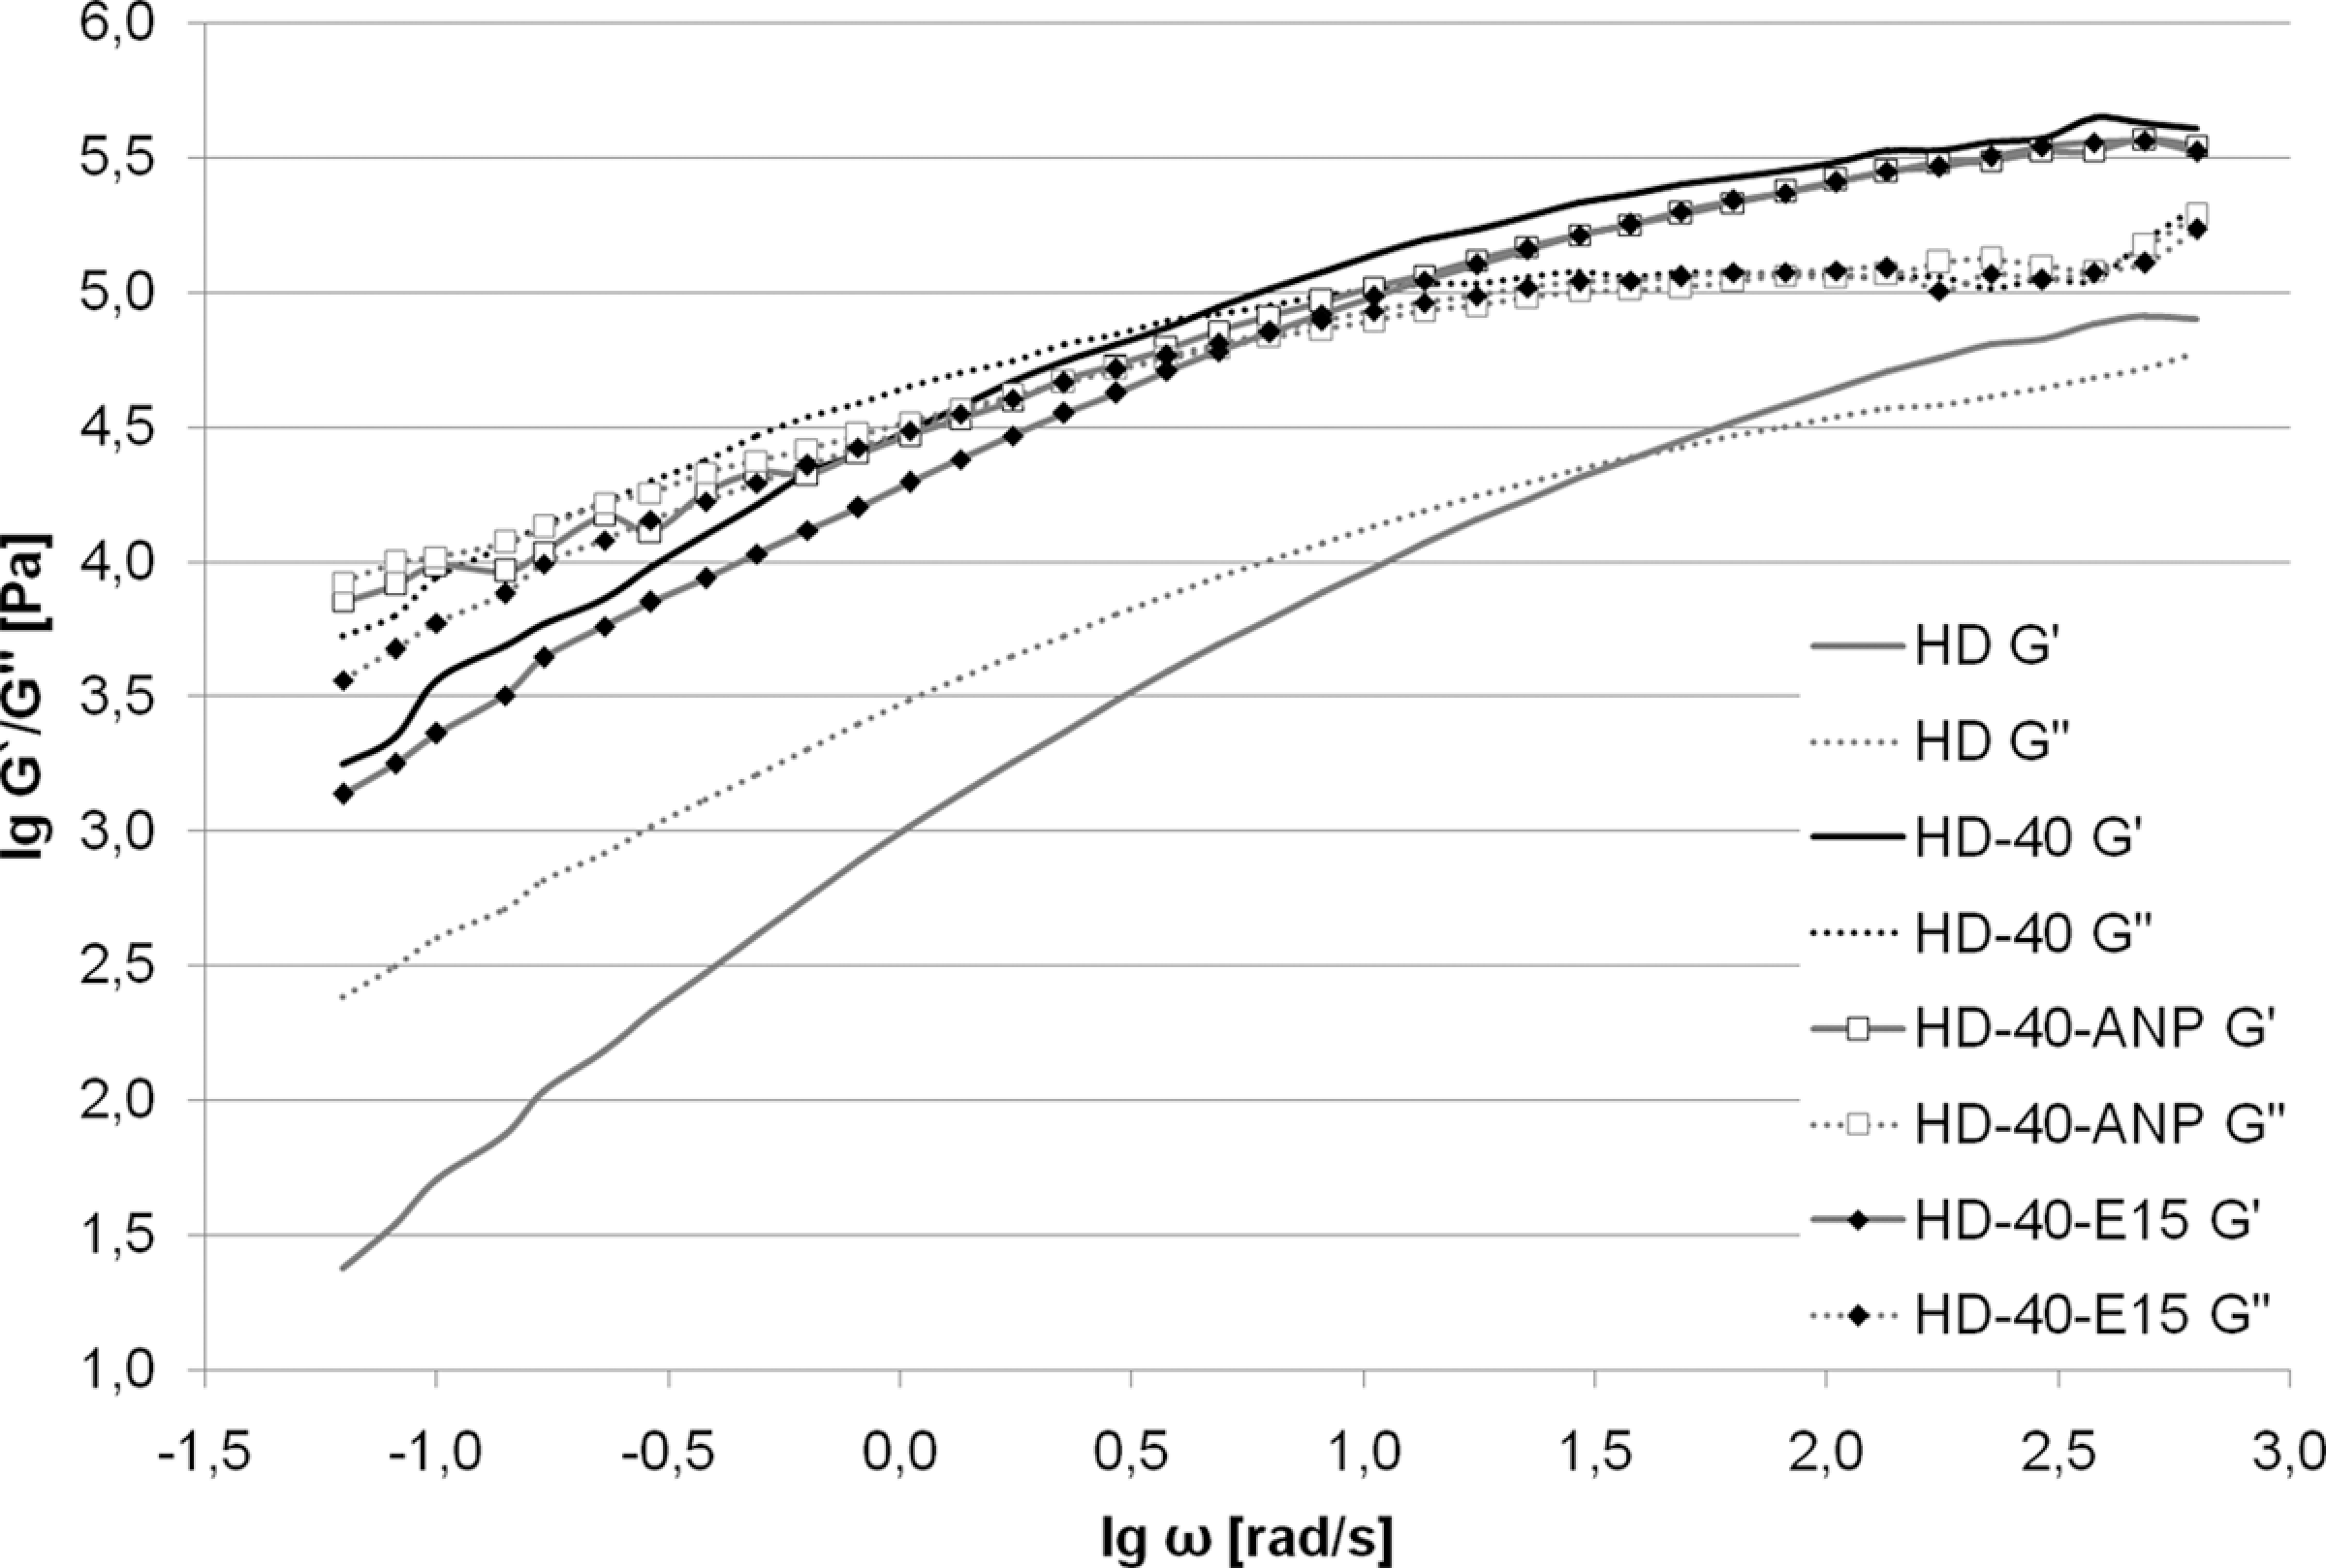
Storage (G′) and loss moduli (G″) versus oscillation frequency as double-logarithmic diagram. Materials are the same as in Figure 10. G′ are represented by continuous and G″ by dotted lines.
Looking at Table 5, it becomes obvious that the materials measured show great variation in flow properties. First of all, the crossover point, marking a threshold above which the materials response to shear is dominated by elastic rather than viscous behavior, is shifted to far lower values by incorporation of wood into the compound. This is easy to explain since more or less rigid fillers like the wood particles should contribute to solid-like behavior of the compound melt. It is interesting to note that the E15-coupled compound, as the one delivering the lowest mechanical performance, shows the highest crossover point among the WPC compounds. For the ones coupled with the other four CA types, the crossover frequency increases with the MFR value (Table 2).
Data from the flow curves of the various materials.a
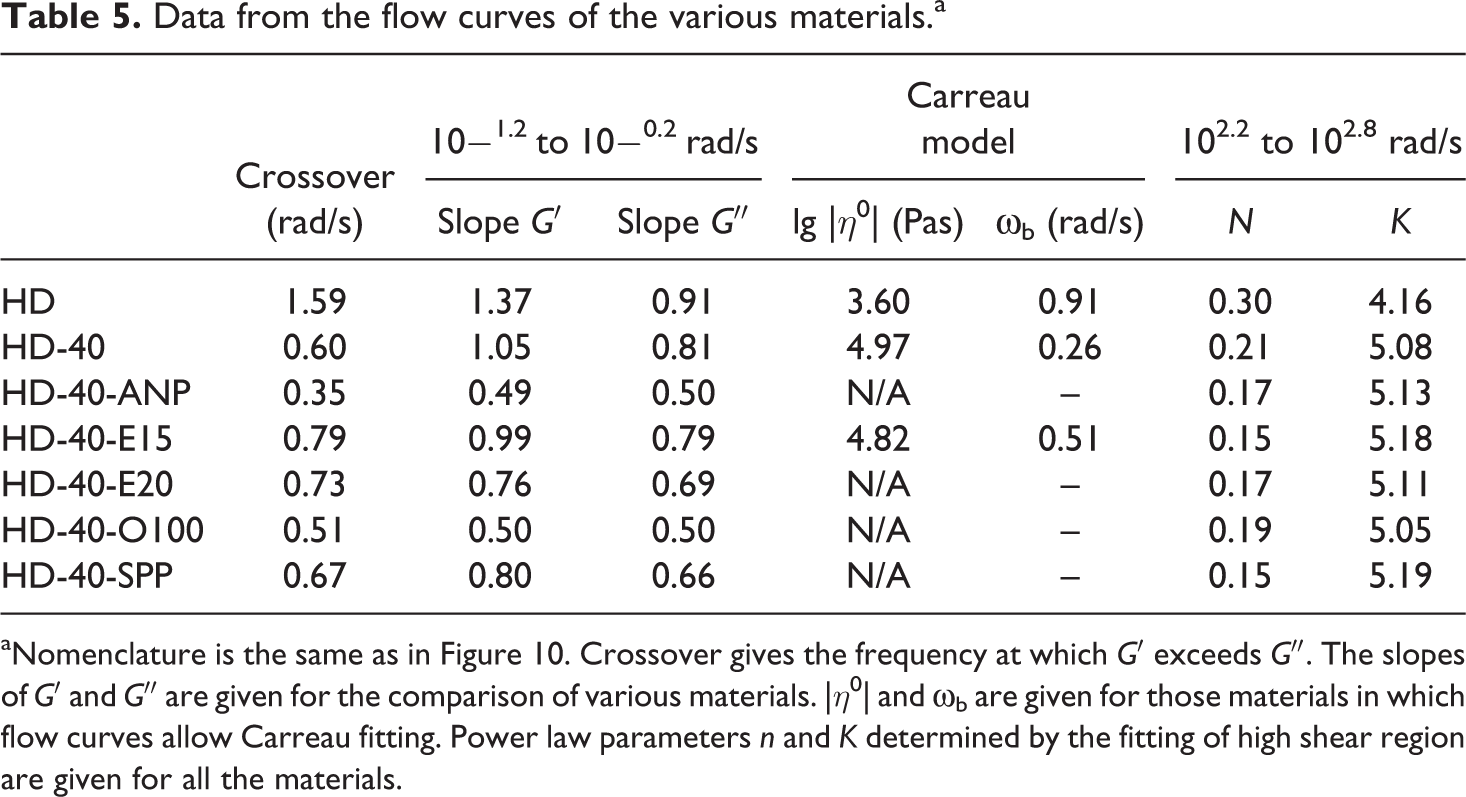
aNomenclature is the same as in Figure 10. Crossover gives the frequency at which G′ exceeds G″. The slopes of G′ and G″ are given for the comparison of various materials. |η 0| and ω b are given for those materials in which flow curves allow Carreau fitting. Power law parameters n and K determined by the fitting of high shear region are given for all the materials.
Concerning the ANP, E20, O100 and SPP types, the differences in their impacts on flow properties as represented by the values in Table 5 are difficult to interpret. Generally, lower slopes of G′ and G″, resulting from long relaxation times, might be interpreted as increased interaction between polymer melt and filler in the compound. However, judged by their effects on mechanical properties, the level of interfacial adhesion promoted (in solid state) is similar for those four CA types. Thus, it can be assumed that small variations in flow properties detected do not allow a prediction of actual CA performance. As regards to the power law parameters n and K, those are similar for all the WPC compounds measured.
Only the flow curves of the neat PP, the uncoupled compound and the E15-coupled compound show a low shear complex viscosity plateau and allow Carreau fitting. Furthermore, the slopes of G′ and G″ are quite similar for HD-40 and HD-40-E15. This means that while the other four CA types change the flow behavior compared with the uncoupled compound, the E15-type merely shifts its flow curve to lower viscosities. Thus, it can be concluded that while the CA types that give better mechanical performance also promote some interaction of the matrix polymer with the wood filler in the melt, this is not the case for the E15 type, which shows more of a lubricant-like effect.
Conclusions
MA-PP CAs allow the improvement of flexural properties, IS and WA in PP-based WPCs. As to the optimum properties of a CA regarding backbone polymer structure, M w, and MA graft level, this study does not yield conclusive evidence for optimal CA design. What can be said, however, is that PP homopolymer-based MA-PPs with graft levels reaching from 0.5 to 1.5% and M ws reaching from 55 to 181 kDa work comparably well when it comes to the mechanical properties of PP-based WPCs. Besides that, there are two further remarkable results. First, the copolymer-based type E15 brings about the lowest values for most of the properties measured, indicating that similarity of the backbone polymer with the matrix polymer is favorable. Second, the MA-PP type with the highest backbone M w, namely ANP, yields the most significant reductions in WPC WA.
As concerns optimum MA-PP contents, it can be said that for a well-performing CA, adding more than the required amount will normally not have negative consequences. However, other researchers did report distinct CA content optima beyond which a decrease in material properties was observed. Our own results indicate that for flexural strength, the effect of CA addition levels off between 5.0% (40% wood) and 7.5% (60% wood). For IS, there is probably an optimum MA-PP content between 5.0 and 10.0%. For reduced WA, 5.0% MA-PP seem to be enough at 40% wood content, while at 60%, most types show the best performance at the highest content. Taking these results together, an MA-PP content of 5.0–10.0%, based on wood content, can be recommended for PP-based WPCs (for MA-PPs similar in structure to those used in the current study).
Dynamic rheometry measurements indicate that CAs that deliver good interfacial adhesion in the solid state also promote interaction between filler and polymer in the melt, thus altering the shape of the flow curves measured when compared with an uncoupled compound, particularly in the low shear range.
Footnotes
Acknowledgement
The authors thank their project partner Borealis for supplying the polypropylene matrix polymer.
Funding
This work was funded by the COMET program of the Austrian Federal Ministry for Transport, Innovation and Technology.