
Abstract
The electrical properties of cement–polyvinyl alcohol were studied using the impedance measuring technique. The study has been carried out under different temperatures and frequencies. Some electrical quantities such as AC conductivity, dielectric constant, activation energy, and relaxation time of the conduction process were determined from collected impedance data, at a frequency range from 20 kHz to 1 MHz and temperatures of 30–105°C. It was found that the measured electrical quantities have frequency and temperature dependence. The dielectric constant and dielectric loss increase with increasing temperature and decrease with the applied frequency. The AC conductivity increases with increasing temperature and frequency. The calculated values of the activation energy and relaxation time vary with temperature and frequency. The observed enhancement in the electrical conductivity with increasing temperature may be due to electron hopping between the intrinsic localized states in composite composition. The increase in the dielectric constant with temperature is attributed to space charge, ions, and metallic inclusions existing in the cement structure.
Introduction
Polymer composites are the advanced materials that appeared extensively in the last 30 years and have numerous important technological applications. The polymer composite consists of filler as a reinforcement component and a surrounding polymeric matrix fabricated into a useful product. The need to develop new polymer composites is based on the modification of their properties using successful filler to produce new materials with tailored properties. 1
The particulate polymer composites are the important category of advanced reinforced materials used in many structural and electrical applications, which require incorporating natural fillers in a suitable polymer matrix. Examples of these fillers are natural minerals and deposits such as clay, zeolite, mica, talc, and rock shale combined with efficient coupling agent to obtain tailored reinforcement and optimize the cost to property balance. However, there are some physical and chemical factors that affect the mechanical and electrical performance of the manufactured composites such as processing conditions, type and nature of both the filler and polymeric matrix, and their interfacial adhesion capability. Consequently, the natural filled polymer composite has become widely accepted in many construction applications. 2,3
The polymer composite used in the present study is cement/polyvinyl alcohol (PVA) material in the form of plates of 4 mm thickness. The estimated portion of cement in the composite is about 20–25% by weight. The chemical analysis of cement Portland reveals its composition of calcium oxide, silica, alumina, iron oxides, magnesium oxide, and sulfur trioxide. Microscopic investigations have shown that these oxide constituents exist mainly as calcium silicates and aluminates in addition to calcium alumina, ferrite, and small quantities of free magnesium and sodium oxides. 4,5 Cement is a universal substance used very largely in various constructions as bonding materials. Extensive researches and industrial operations are devoted nowadays by famous research and development laboratories to improve the cement quality and performance.
The PVA is an amorphous polymer with cream color and have a specific gravity of 1.25, thermal conductivity of 0.2 W/m K, electrical resistivity of 3.5 × 10⁷ ohm cm, and melting temperature of 200°C. The PVA polymer has glass transition temperature (T g = 85°C) and excellent stability to sunlight and is soluble in water. It combines high tensile strength with ease in film formation, its resins show excellent adhesive and bonding characteristic, and it is generally unaffected by grease or oils and have good resistance to organic solvents. 3
In the literature, there are plenty of research reports concerning the mechanical reinforcement of engineered cementitious composites (ECC) of polymeric matrices. 6,7 But as far as we know, there are few studies 8 –10 on the electrical conductivity and dielectric behavior of these ECC composite. This encouraged us to follow the characterization property of the ECC from the point of physical performance.
The main objective of the present study is to investigate the AC electrical behavior of cement/PVA composite using impedance spectroscopy. The dielectric constant and AC conductivity of the prepared polymer/cement composites were measured at different temperatures and applied field frequencies.
Experimental
Composite preparation
The solid composite used in the present study is made of PVA polymer as a matrix and cement substance as a filler. Fine silica were added to cement having a fineness of 4590 cm2/g and mixed in water binder solution to form a paste with about 35% cement by weight. The cement pastes prepared using Hobart planetary mixer vibrated at a frequency of 200 Hz. The pastes were left for 24 h in the mold. The test specimens were cured for few days and were in the form of rectangular plates of thickness 3 mm. The plates have very smooth surface finishing with greenish cream appearance. It is important to mention that the cement plates were prepared in Laboratorio Materiali of the CTG/Cement Trancasts Company (Bergamo town near Melano, Italy) and were granted by Dr G.L. Guerrini during a scientific visit to this company (Guerrini GL and Rosati G, 1996, personal communication).
Impedance measurement
The AC electrical measurements for composites with different cement content were done in frequency range from 100 kHz to 1.5 MHz at different temperatures. Impedance measurements were performed using LF Impedance Analyzer (HP model 4192) connected to a two-electrode shielded cell containing ring-disc specimens as shown in Figure 1 described by Crossman. 11 The electrodes were made of copper, and the test composite sample was inserted between the top and bottom electrodes. The surfaces of the specimens were gently rubbed to remove the resin-rich top insulating layer to display the filler area beneath. The impedance analyzer reads impedance and phase angle values of the specimen by varying the applied field frequency; temperatures were read in a steady state through thermocouple connected upon the test specimen surface. 12 –14
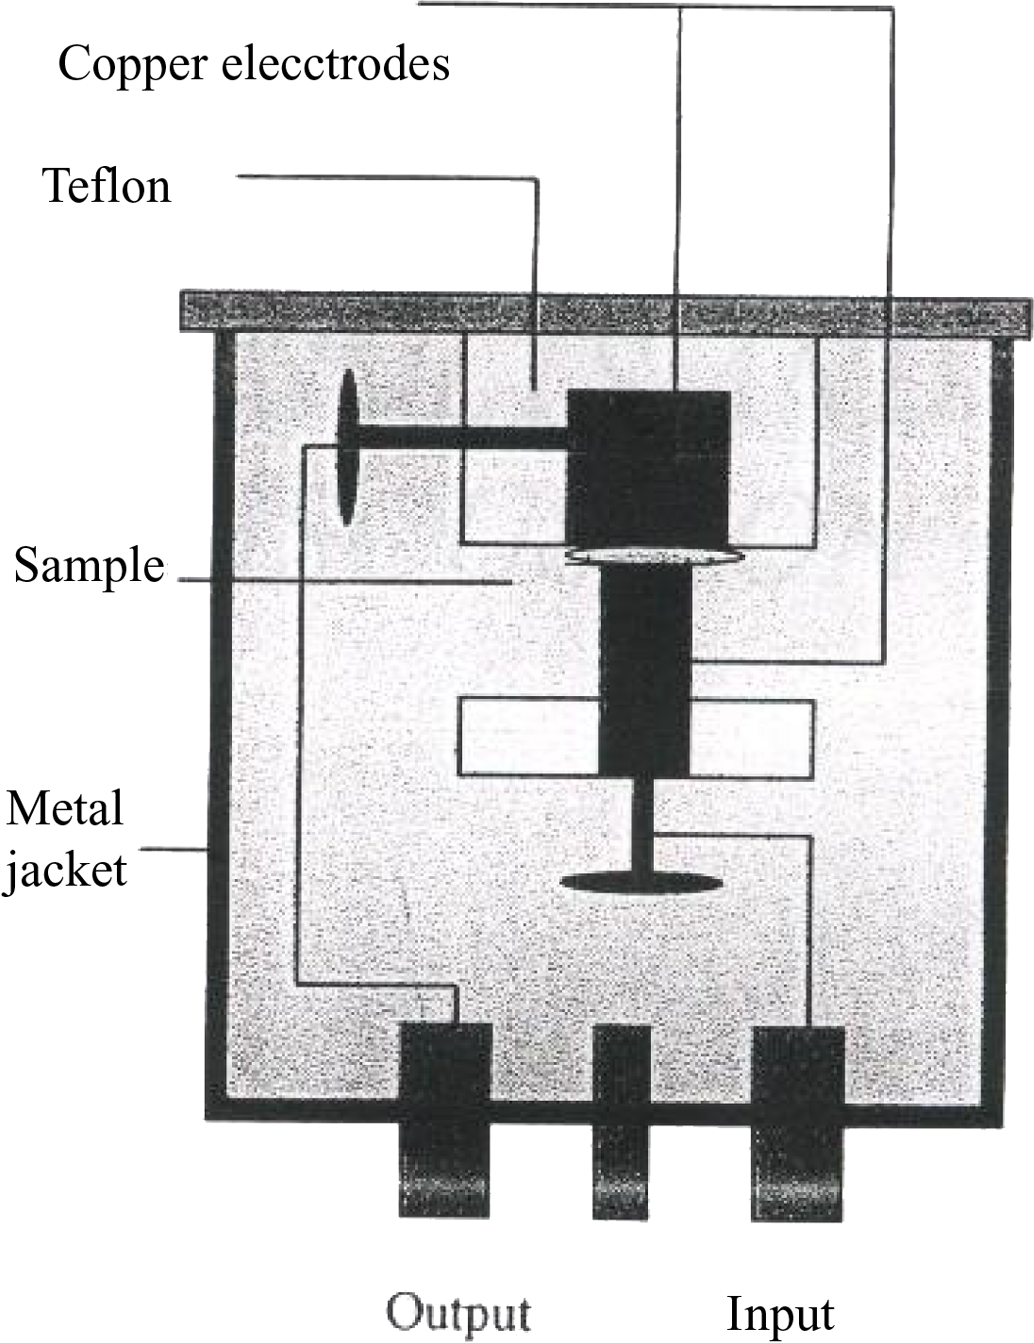
The sample holder used in the AC electrical measurements.
Scanning electron microscopy
To examine the distribution of cement particles and surface morphology of the given composites, Leitz scanning electron microscope (SEM; AMR model 1000 A) was used. Fractured surfaces from the composite were coated with gold for SEM observations.
Result and discussion
The PVA polymer combines good strength and adhesion property. This is clear from the SEM micrographs taken at two different fractured surfaces of the cement composite shown in Figure 2.The SEM micrographs exhibit good particle distribution in the PVA matrix with high degree of interfacial adhesion between the polymer (white color) and the cement particles. This is a good characteristic that PVA polymer was used as a matrix. The cement fine grains (greenish color) are in good contact and planted firmly in the PVA matrix producing strong reinforcement and improvement in the mechanical properties of the cement/PVA composites. The small black regions are some holes generated during the fracture process. Characterization of the electrical and dielectric properties of the polymer cement composites is very important for tailoring some advanced technological applications. The AC impedance method is a powerful technique to characterize the composite electrical properties. The complex impedance of the sample with the real and imaginary components can be calculated by Scanning electron micrographs of fractured surfaces of polymer/cement composite (two fractured surfaces of composite).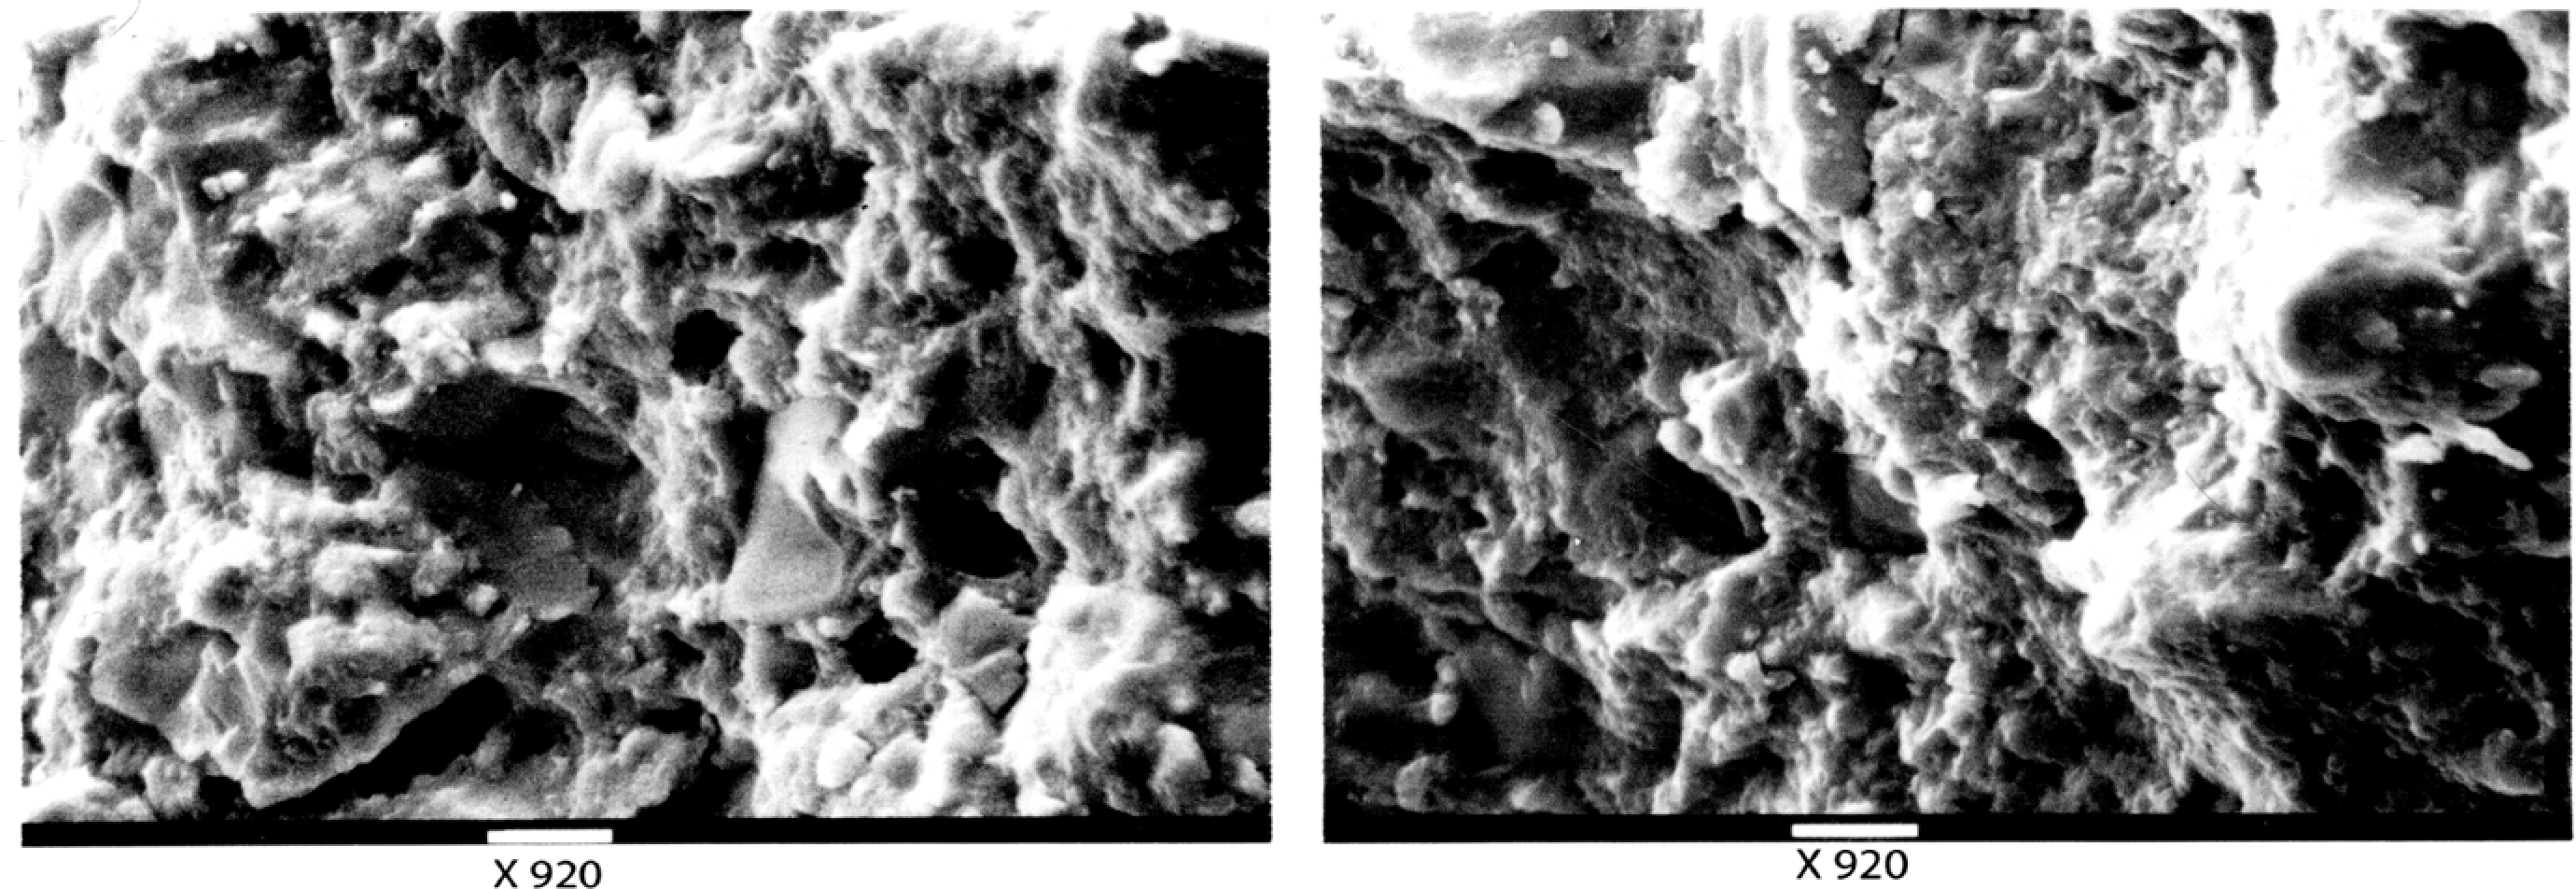


The dielectric constant ∊′ and the dielectric loss ∊′′ of the sample are calculated from the following equations


where f is the frequency of the AC-electric field and C
o is the capacitance of two plates of the cell without the sample and is given by the following equation

where A is the disk area and d is sample thickness. The AC conductivity of the sample is given as

where f is the applied frequency measured in Hertz. 15 –17
Figure 3 represents the variation in phase angle Φ with a frequency at different temperatures; it increases rapidly toward negative values at a low frequency of less than 100 kHz. The temperature has an influence on Φ especially at higher temperatures and low frequency. The phase angle takes negative values, which indicate that the composite is still capacitive and can be represented with a series of RC networks.
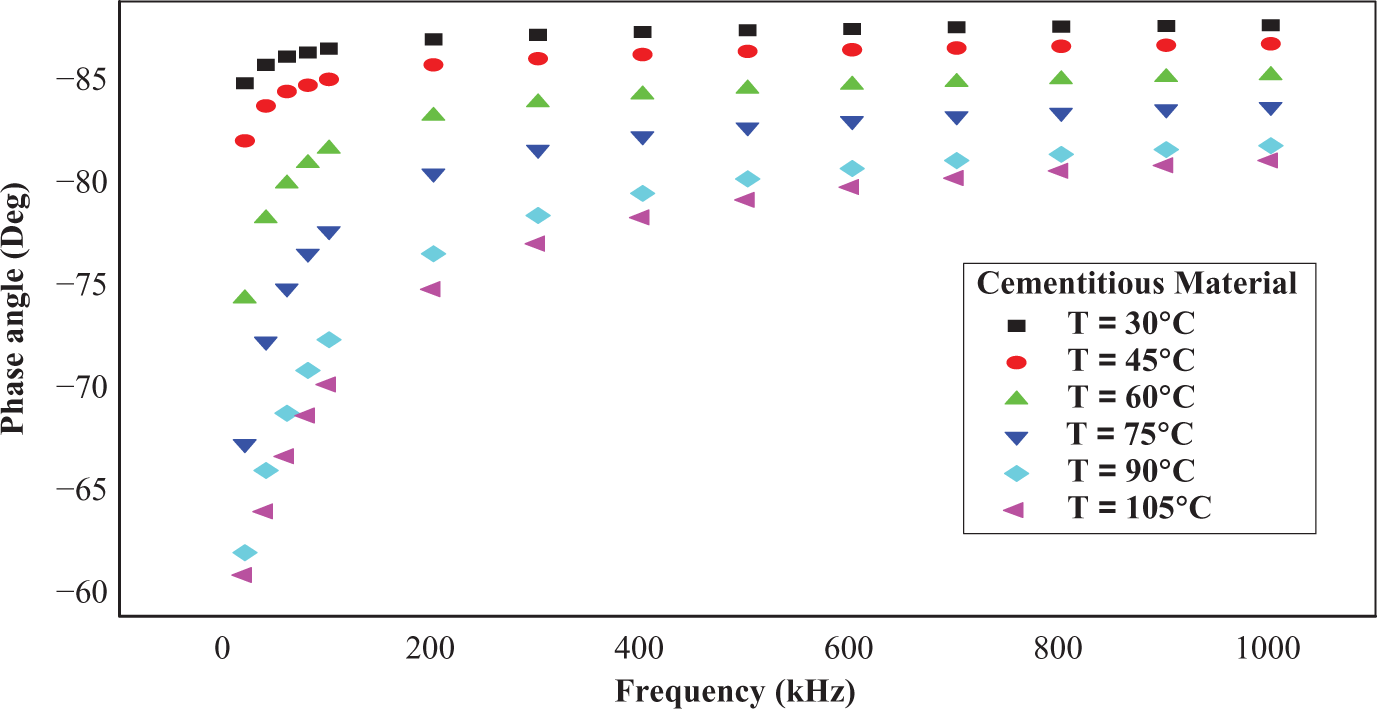
Phase angle versus frequency.
Figures 4 and 5 show the impedance versus applied field frequency in a temperature range from 30 to 105°C, it drops rapidly with increasing frequency and temperature. The decrease in impedance indicates that the material becomes more conductive. The curve shows a sharp drop in the impedance with increasing frequency. High impedance values at low frequencies result from interfacial polarization in the matrix. 15
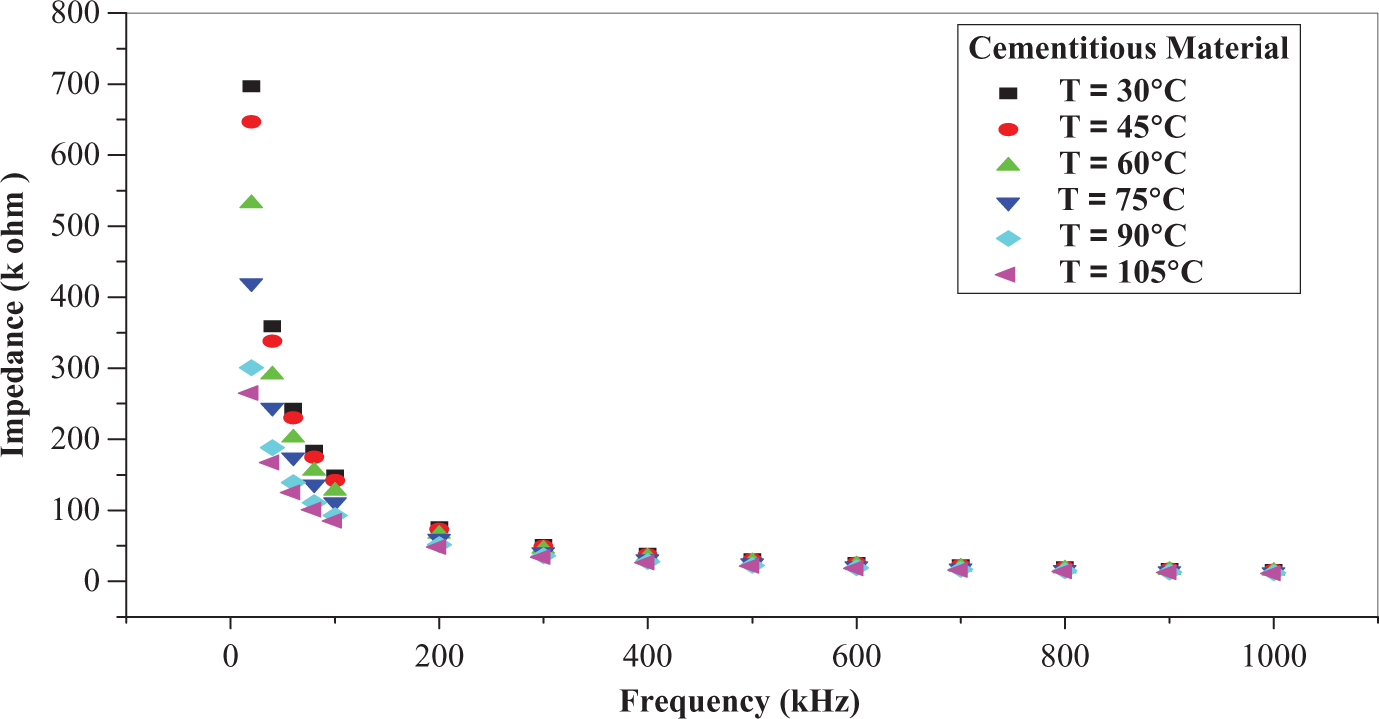
Variation in the impedance with frequency.
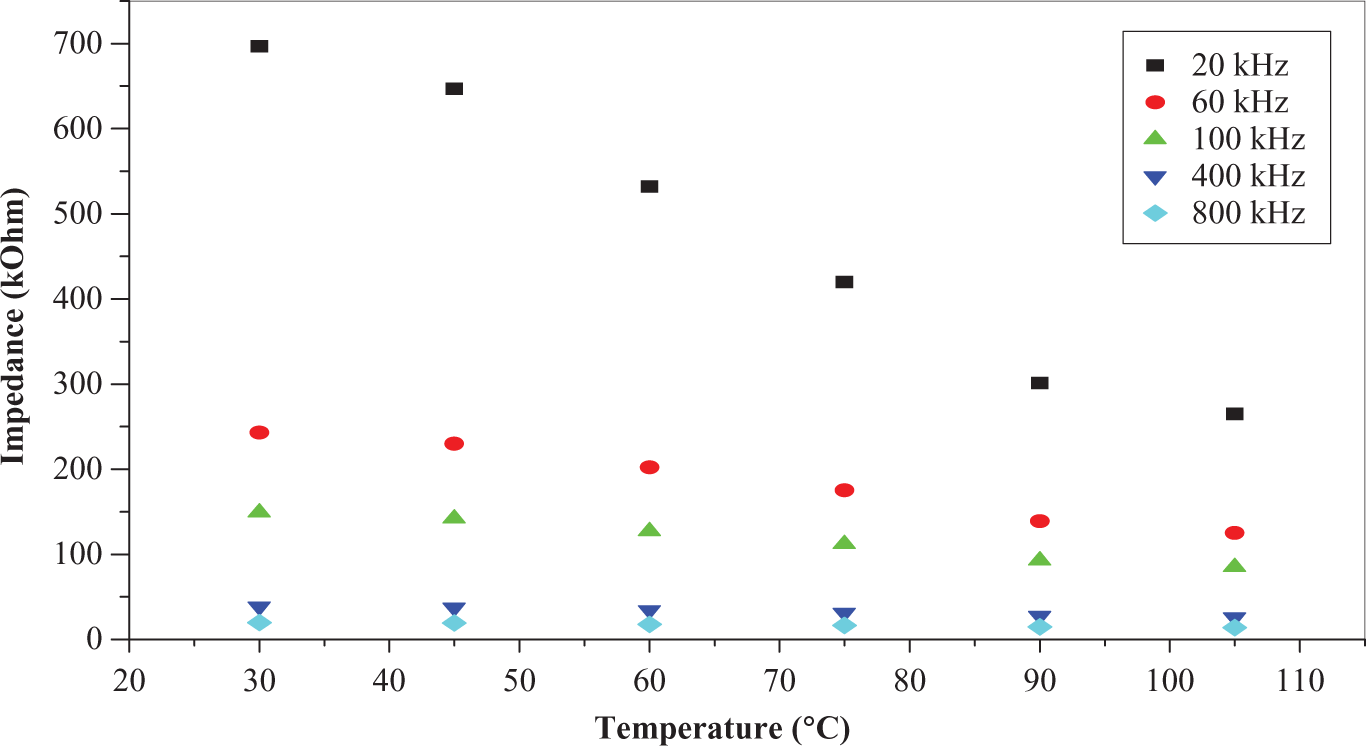
Dependence of impedance on temperature.
Figure 6 shows the Cole–Cole impedance constructions at a temperature of 30°C. The Cole–Cole constructions yield slightly inclined and distorted semicircles. The geometrical shapes of the complex impedance plane plots indicate that the composite material is electrically equivalent to RC networks that reduce to a pure resistance. 18
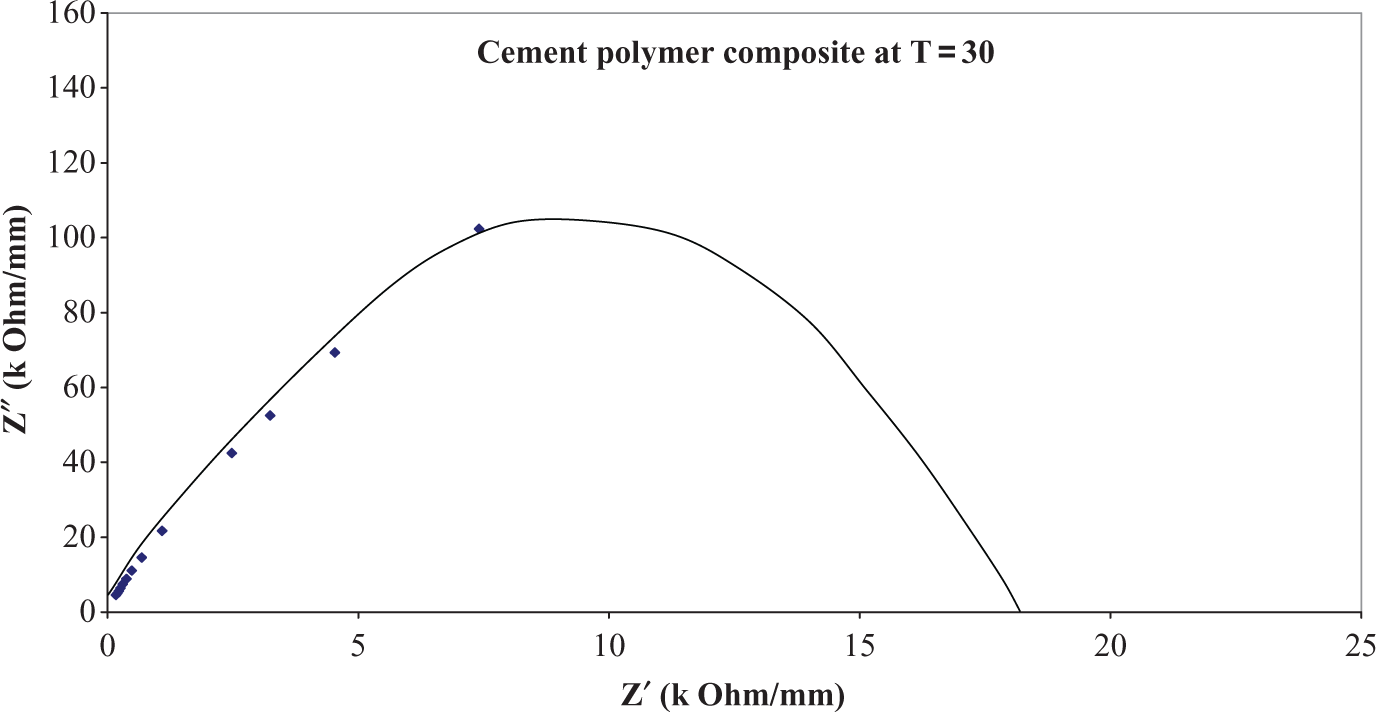
The Cole–Cole impedance constructions at temperature 30°C.
Figure 7 shows the variation in the dielectric constant with frequency and temperature. It can be seen that the dielectric constant increases with temperature, especially at a temperature above the T g = 85°C of the PVA. Heating the composite facilitates the dipole orientation, increases the segmental mobility of the polymer, and activates the electrical charges and impurities existing in the cement oxides. 3,15 Also, Figure 7 shows the value of the dielectric constant increases from 7 to 11, and it decreases with increasing the frequency due to the hindrance of dipole rotation, and this may be associated with Maxwell–Wagner mechanism (interfacial space charge) and the electrode polarization effect. 19
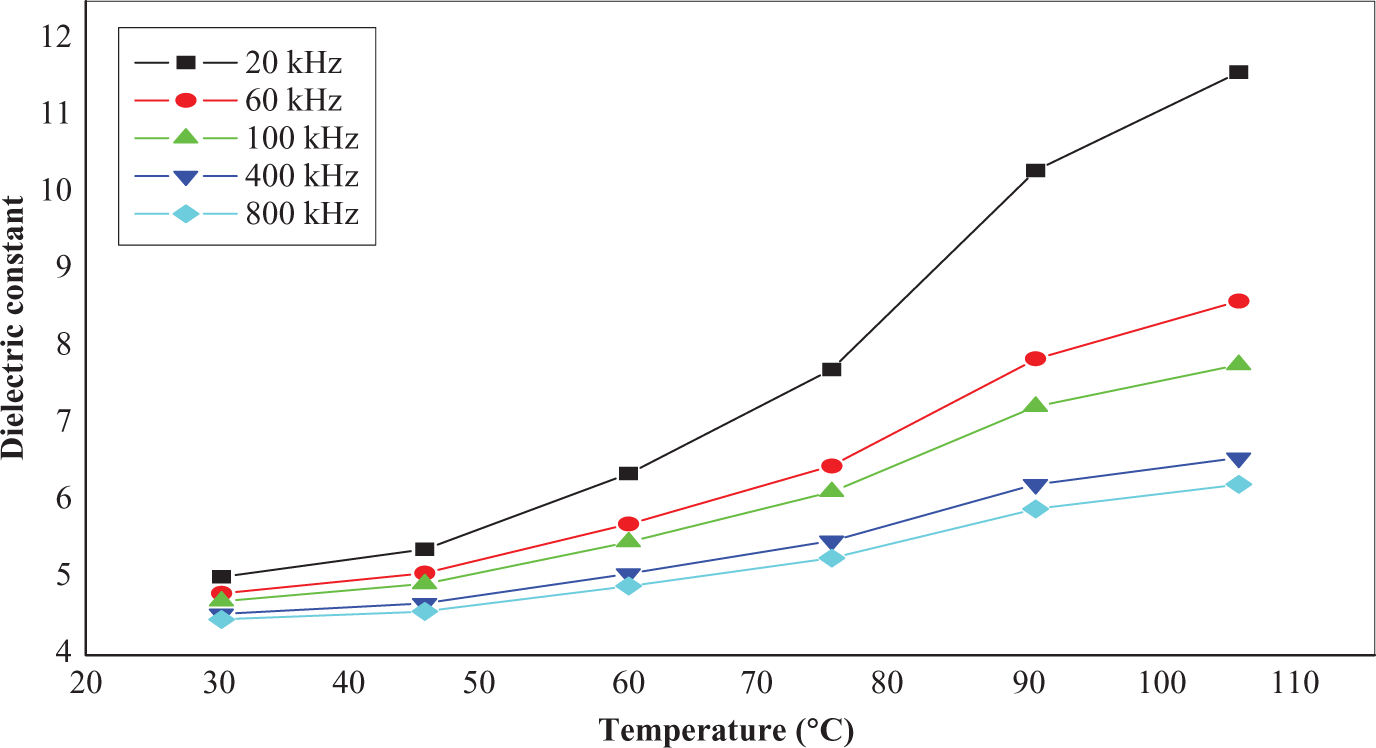
The dielectric constant as a function of temperature.
Figure 8 shows the dielectric loss increases with temperature and decreases with increasing frequency. The pronounced increase in the dielectric loss value above T g is due to some electronic and ionic contributions that arise from the cement oxides. The decrease in the dielectric loss with frequency may be attributed to higher induced conductive behavior. 20 –23
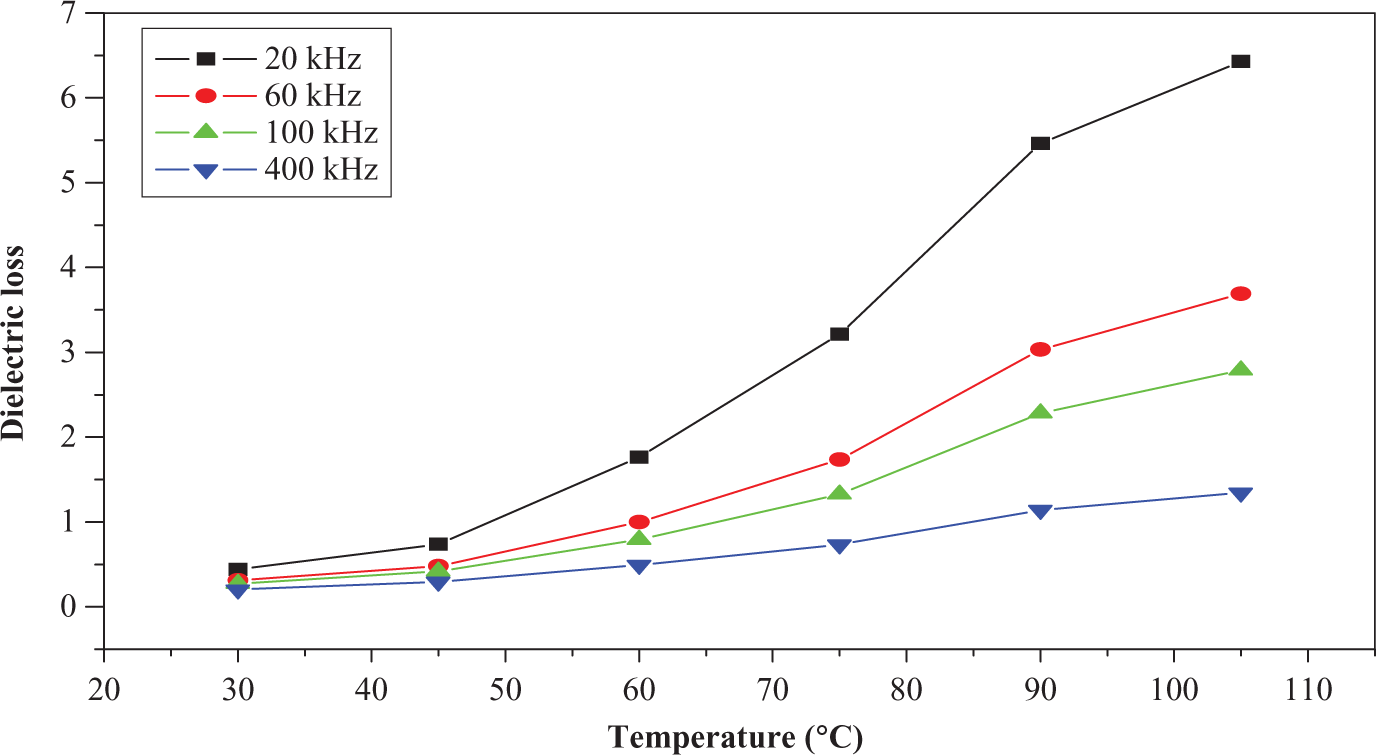
The dielectric loss as a function of temperature.
Jonscher universal power law
15,16,24
based on the aspect of conduction paths accessible for electric charge flow in polymer networks takes the form

where A and n are coefficients, σ
0 is usually identified as the DC conductivity of the material, and σ
AC is the frequency-dependent conductivity. At higher frequencies, the conductivity increases as a power of frequency with a power exponent n < 1. The plot of log σ
AC versus log f is shown in Figure 9; and based on the condition that σ
0 is much less than σ
AC, then equation (7) can be simplified to Log (AC conductivity) versus Log (frequency).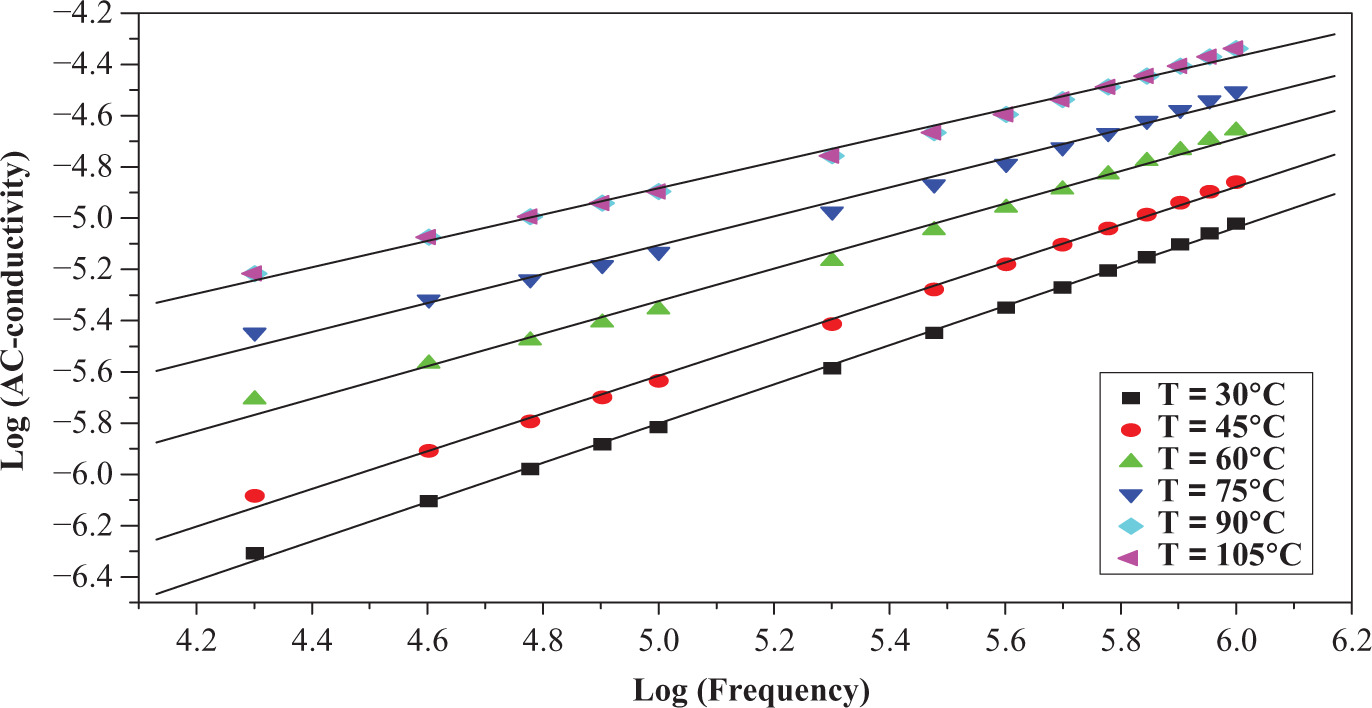

It was found that the power exponents (n) included in Table 1 decrease with increasing temperature. It seems that the present analysis is a good approximation and gives n < 1 values in the selected frequency range.
The estimated coefficients A and n for the polymer/cement composite.
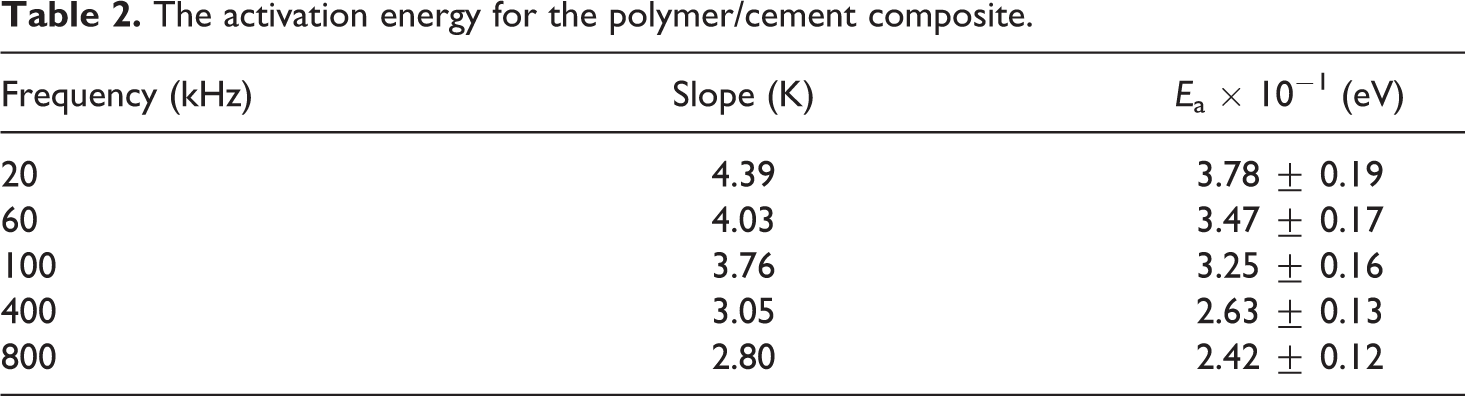
Figure 10 shows the variation in the AC conductivity with a temperature measured in a range from 30 to 105°C. The activation energy of the thermal conduction process that takes place in the composites can be estimated from the slopes of the plots of ln σ
AC versus 1000/T as in Arrhenius equation (Figure 11)
The AC conductivity as a function of temperature. Ln (AC conductivity) versus (1000/T).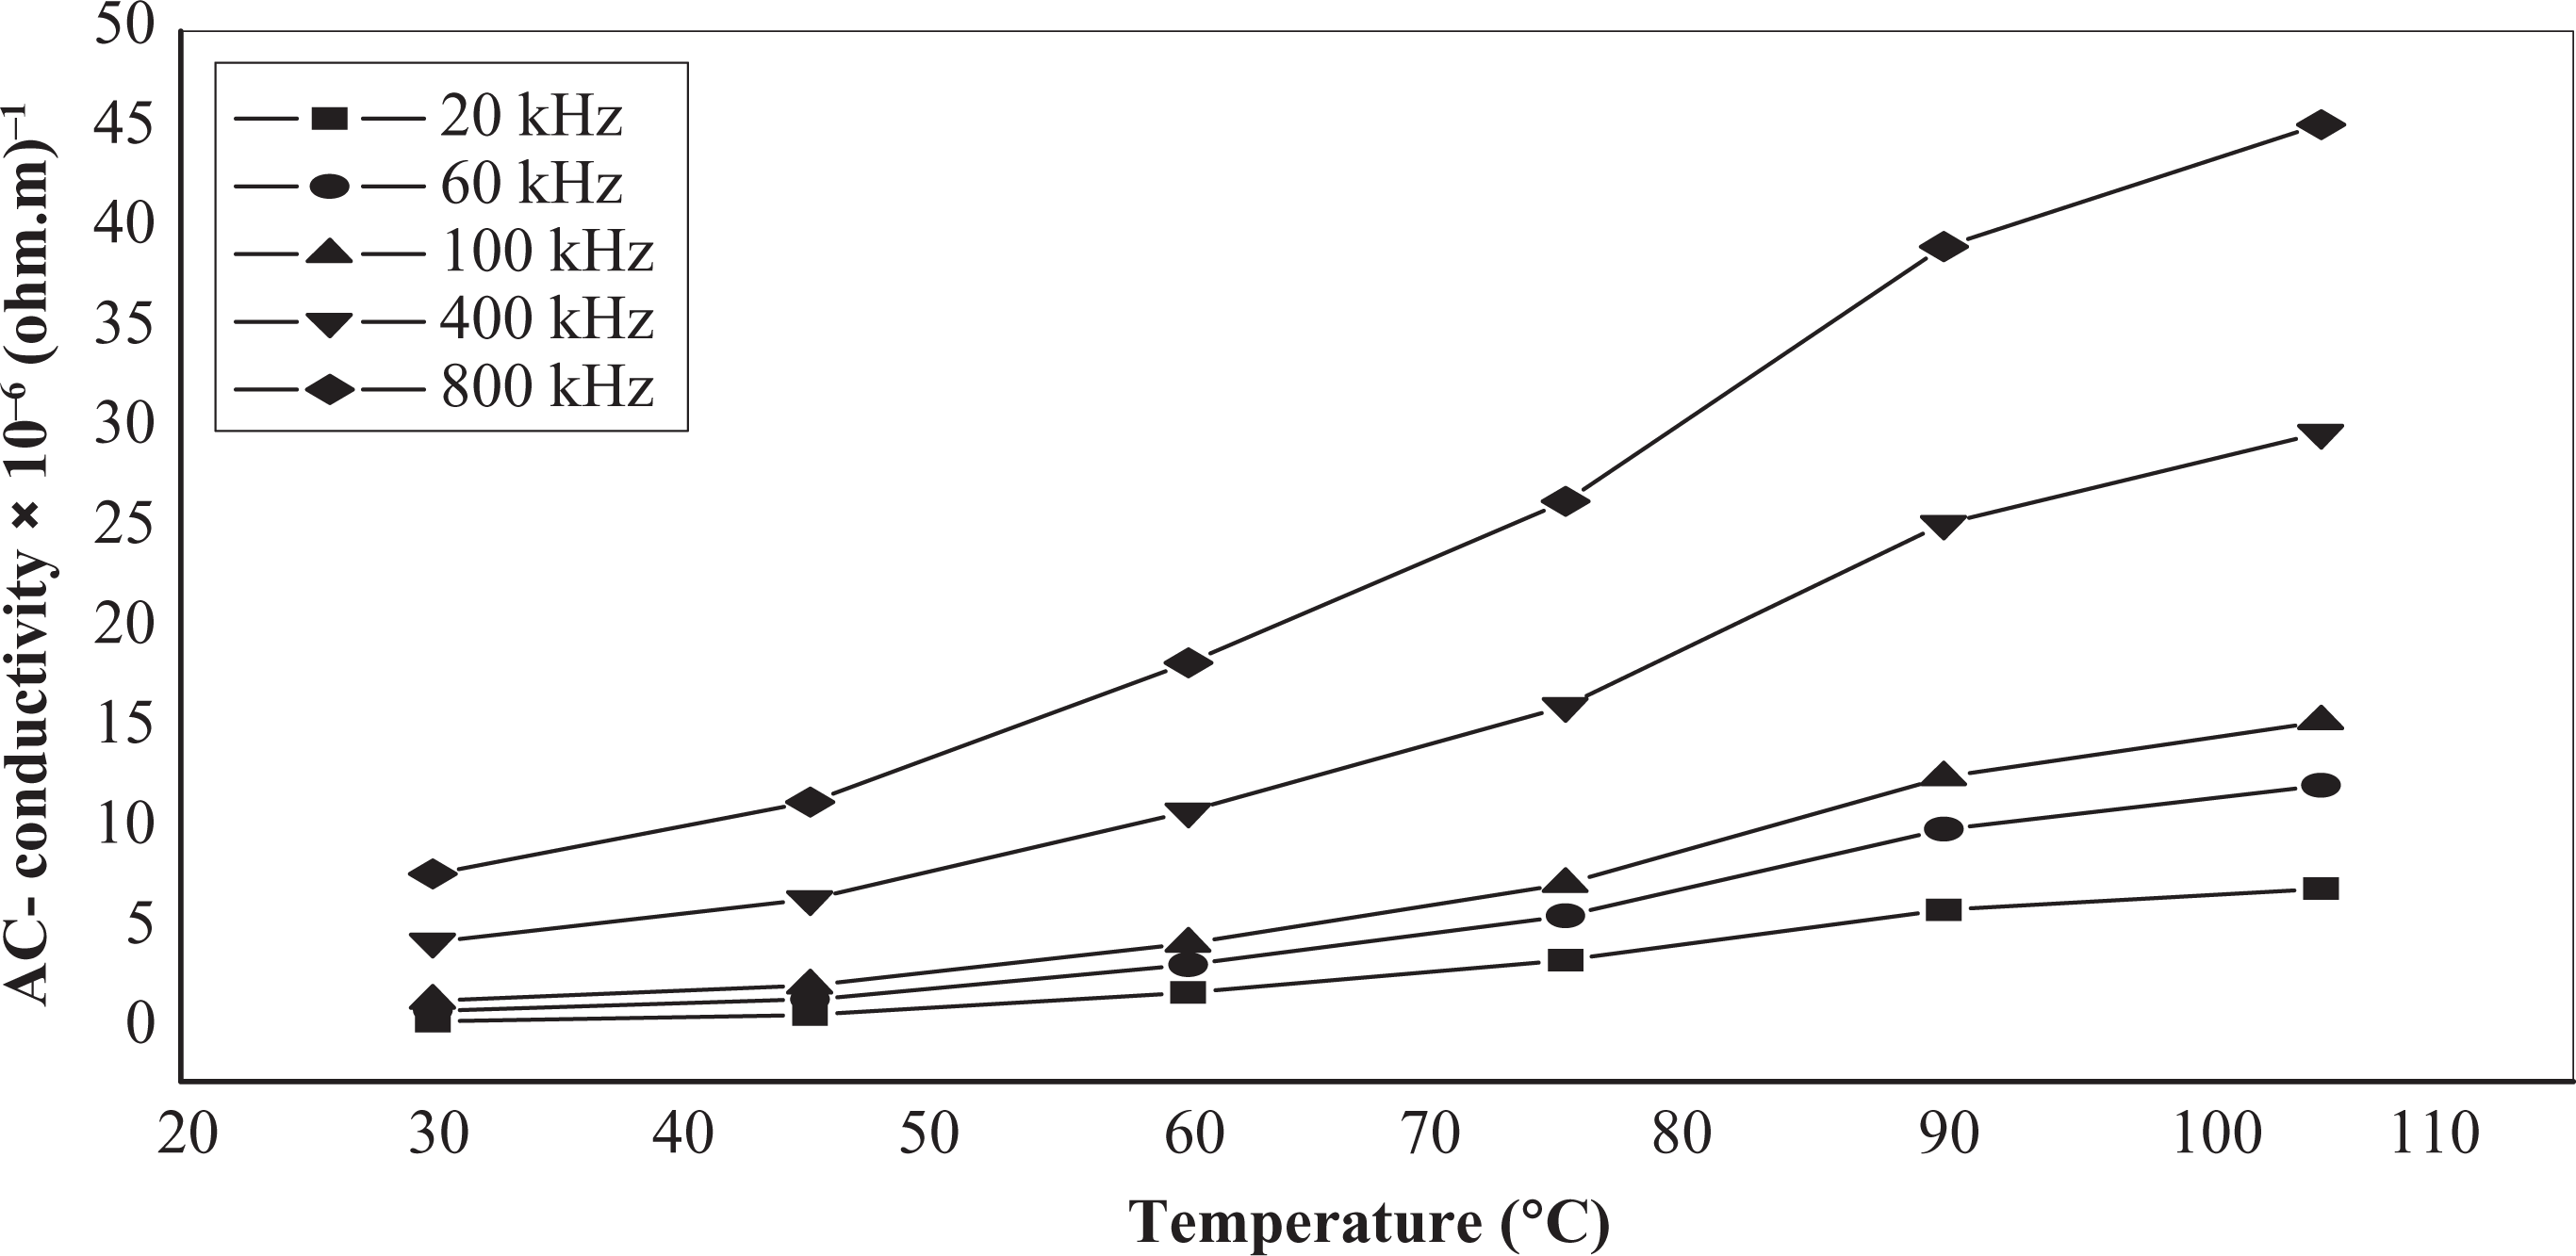
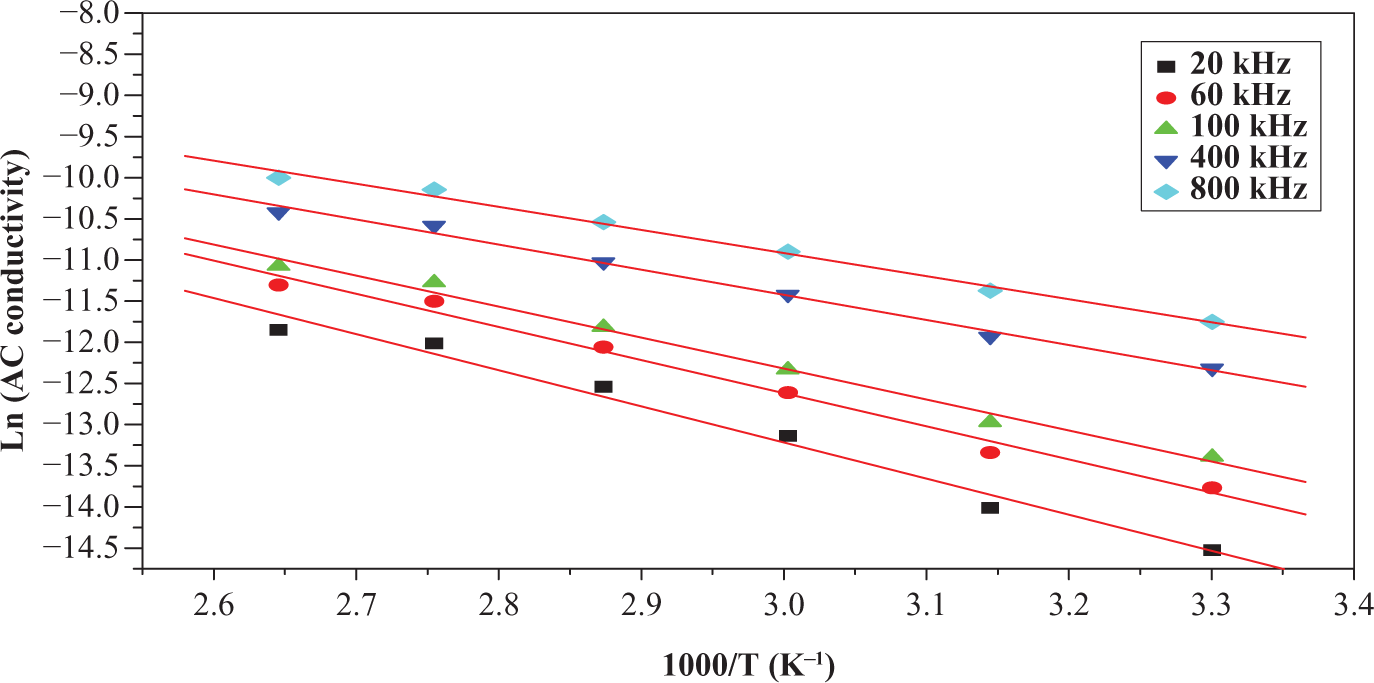

Where σ is the measured electrical conductivity, σ 0 is a material constant, k B is Boltzman constant, and T is the temperature in kelvin. The activation energy values included in Table 2 decrease with temperature at different frequencies, this means that the cement composite has better electrical conduction. The enhanced σ AC with the temperature is due to the increase in the electronic and ionic mobility of existing impurities in the cement structure. The increase in σ AC with the frequency may be due to less polarization contribution at a high frequency range.
The activation energy for the polymer/cement composite.
Conclusion
The AC electrical properties as the dielectric constant and electrical conductivity of cement/PVA composite were investigated as a function of temperature and applied frequency.
In general, the observed changes in the dielectric and electronic behavior of the studied cement/PVA composites may be attributed to both polarization and electrical effects. The enhancement in the AC conductivity implies that the electrical conduction mechanism occurring in the composite includes motion of the ions, charge transfer, and electrons hopping between the extrinsic localized states, which result from the impurities and oxides existing in the silicate structure of the cement composite.
The universal power law of frequency-dependent conductivity observed in the composite gives power exponent value near unity, which is physically acceptable in the present case of study.
Footnotes
Acknowledgements
The authors thank Dr G.L. Guerrini in the laboratorio Materiali/CTG Company-Bergamo for providing the cement composite and the Department of Geology for the scanning electron microscopy observations.