
Abstract
In order to improve the mechanical properties, crystallization behavior and processing viscosity of the poly(trimethylene terephthalate) (PTT), maleinized poly(octene–ethylene) (POE) and organomontmorillonite (OMMT) were used to prepare nanocomposites of PTT/POE/OMMT by melt blending method, and their morphology and properties were investigated in detail. The results suggest that some of the OMMTs are peeled off and the nanosheets are dispersed evenly in the polymer matrix. The nanocomposites have higher melt viscosity with increasing OMMT content due to the interaction between OMMTs and polymers, which is favorable for improving the processing property of the material. The nanocomposite with 2 wt% OMMT has the largest tensile and impact strength. The elastic modulus of the glassy nanocomposite increases, and the glass transition temperature first slightly decreases and then increases with increasing OMMT content. The nanocomposites form smaller or imperfect microcrystallites with lower melting point and the nanocomposites have increased crystallization rate because of the effective nucleation agent of OMMT. However, the crystallinity decreases because of the thickening effect of OMMT and POE in the composites. OMMT and POE have small influence on the thermal stability of the nanocomposite.
Introduction
Poly(trimethylene terephthalate) (PTT) is introduced as a prospective thermoplastic polyester because of its property advantages, and it possesses potential and important application values in the area of engineering plastics. However, its further application in the broader field is also limited by some of its shortcomings, such as narrow processing temperature range, low melt viscosity, low-temperature impact resistance, low heat distortion temperature and so on. Recently, the research on reinforcing and toughening of PTT has been receiving much attention. 1 Researchers have reported some blends and composites of PTT with other polymers, fillers or fibres. 2 –17 Run et al. 4 reported the isothermal crystallization and melting behavior of PTT/nano-CaCO3 nanocomposites, the results suggest that nano-CaCO3 increases the crystallization rate of PTT. Liu et al. 5 reported the PTT/organomontmorillonite (OMMT) nanocomposites and suggest that the thermal stability and the storage modulus have been greatly improved because of the nanometer-scale layers of the OMMT. Xue et al. 6 prepared the PTT/acrylonitril–styrene–butadiene (ABS) blends with the maleinized styrene–butadiene copolymer as compatibilizer. The results suggest that PTT and ABS are partially compatible with the compatibilizer. Mishra et al. 15 first prepared the PTT/ethylene–propylene copolymer (EPDM) blends with a small amount of maleic anhydride (MAH) EPDM as a compatibilizer, then prepared the PTT/EPDM/organic clay nanocomposites. The results suggest that the nanocomposite has a strong shear thinning behavior, and organic clay is partly peeled off and infiltrated into the network structure. The organic clay can improve the stiffness but not reduce the toughness of the PTT/EPDM blends.
Poly(octene–ethylene) (POE) is a kind of thermoplastic elastomer with a narrow molecular weight distribution and narrow comonomer distribution. Compared with other elastomers, POE has excellent toughness, weather resistance, transparency, flexibility, light weight and relatively low prices, and so on, thus it is widely used in toughening of plastics. 18 –23 OMMT has also been widely used in modifying various polymers. 24,25 Favaro et al. 24 studied the effect of the copolymer compatibilizer on PTT/OMMT nanocomposites and found that when the compatibilizer is added, OMMT can form the intercalation and exfoliation structure, and the epoxy bond of the compatibilizer reacts with the hydroxyl of the OMMT forming the cross-network structure. Wang et al. 25 prepared the PTT/EPDM/OMMT composites and suggested that the lamellar structure of OMMT was in the EPDM phase, and some formed the core-shell structure. With the increasing OMMT content, the Young’s modulus of the composites increases but the tensile modulus reduces.
Herein, in order to reinforce and toughen PTT, and increase the melt viscosity and crystallization rate, POE and OMMT were used to prepare the PTT/POE/OMMT nanocomposites by melt blending method. In order to improve the compatibility between PTT and POE, the maleinized POE (POE-g-MAH) was used in the nanocomposites. Generally, the rubber phase of POE will depress the tensile strength of the material, so the content of POE-g-MAH is fixed at 4 wt% in these nanocomposites. Using the X-ray diffraction (XRD), polarized optical microscopy (POM), transmission electron microscopy (TEM), dynamic mechanical analyzer (DMA), differential scanning calorimetry (DSC), impact testing machines, electronic universal testing machine, thermogravimetric analyzer (TGA) and rotational rheometer, the morphology, dynamic mechanical properties, crystallization behavior, mechanical properties, thermal stability and rheological behavior of the nanocomposites were characterized in detail. The objectives of the present work are to enhance the processing viscosity, increase the distortion temperature, reinforce and toughen PTT.
Experimental
Materials
PTT homopolymer was supplied in pellet form by Shell Chemicals (USA) with an intrinsic viscosity of 0.92 dL/g which was determined by the phenol/tetrachloroethane mixed solvent at 25°C. POE-g-MAH, SWR-3A (MI190/2160 = 2.5–4.0 g/10 min), was supplied by Shenyang Siwei Co. Ltd (China) with a grafting ratio of MAH of 0.8%. The OMMT was prepared by the specific method as follows: the cetyltrimethylammonium bromide (CTAB) of 0.67 g, triphenyl phosphate (TPP) of 5.35 g and acetone of 100 mL were taken in a beaker, whisking and making CTAB and TPP to dissolve completely. The MMT of 2.01 g and distilled water of 100 mL were taken in a flask, whisking and making MMT to disperse evenly in the water. Then the solution in the beaker was poured into the flask to mix with MMT, whisking and circumfluence at 56.5°C for 4 h, then the mixture was filtered and the solid product named as OMMT was dried at 80°C for 24 h. The spacing of the OMMT interlayer was 3.45 nm characterized using XRD. 26
Nanocomposites preparation
The dried samples of PTT, POE and OMMT were premixed with different weight ratios as follows: C0:96/4/0, C1:95/4/1, C2:94/4/2, C4:92/4/4 and C6:90/4/6. Then the premixtures were melt blended to prepare nanocomposites using a co-rotation twin-screw extruder (SHJ-20, Nanjing Giant Machinery Co., China) with screws of 20 mm and L/D= 45. The cylinder temperature of 6 sections are 225°C, 245°C, 255°C, 255°C, 255°C and 250°C, respectively, and the screw speed is 120 r/min. Then the melt was extruded, cooled in cold water and cut into pellets. The contents of OMMT in different products were as follows: C0: 0%, C1: 1%, C2: 2%, C4: 4% and C6: 6%.
X-ray diffraction characterization
The change in the gallery distance of the OMMT was monitored with an X-ray diffractometer (D8 Advance, Bruker, Germany) equipped with a Ni-filtered Cu Kα radiation (λ = 1.54 Å). The generator voltage and current were 40 kV and 30 mA, respectively. The data were obtained from 1.0° to 10° at a scanning speed of 1°/min. The basal spacing of the OMMT in different nanocomposites was estimated from the position of the d 001 peak in the XRD pattern.
Dynamic rheological characterization
The dried nanocomposite pellets were molded into the standard wafer with the size of Φ25.0 × 1.1 mm using a microvolume injection molding machine (Wuhan Ruiming Plastic Machine Co., China) with a cylinder temperature of 240°C and mold temperature of 35°C. The dynamic rheological property of the nanocomposites was performed on a rotational rheometer (AR2000ex, Waters-TA Co., USA) with a plate diameter of 25 mm. The frequency scan is from 0.1 Hz to 100 Hz and the testing temperature is held at 240°C with N2 protection.
Dynamic mechanical characterization
The dried nanocomposite pellets were molded into the standard splines with size of 10 × 5 × 2 mm using a microvolume injection molding machine with cylinder temperature of 240°C and mold temperature of 35°C. The dynamic mechanical properties were performed on the thermodynamic mechanical analyzer (DMA8000, Perkin-Elmer Co., USA). The temperature ranges from 20 to 80°C, with a heating rate of 2°C/min and the frequency of 1 Hz.
Phase morphology characterization
The phase morphology and distribution of OMMT in nanocomposites were observed by transmission electron microscopy (TEM, JEX-100SX, JEOL Corporation of Japan) operated at an accelerating voltage of 20 kV without staining. The nanocomposite samples were frozen by liquid nitrogen and sliced using a Reichert ultra-microtone equipment with a diamond knife.
Thermogravimetric characterization
The thermal stability properties of different nanocomposites were studied by the thermogravimetric analyzer (TGA; Pyris 6, Perkin-Elmer Co., USA) in the following manner: the sample was heated at a rate of 20°C/min from 30°C to 700°C under a nitrogen atmosphere, and the degradation process was recorded. The temperature data at different weight losses were taken from the curves.
Crystal morphology characterization
POM studies were carried out with a Olympus BX51 POM in conjunction with a hot stage. Small pieces of dried samples were melted on glass slides with coverslips to form thin films of 20–50 μm thick at 240°C for 5 min, and then cooled to room temperature at a cooling rate of 1°C/min, taking micrographs of the growing crystal using a digital camera.
Melting and crystallization characterization
The melting and crystallization behaviors were performed on the differential scanning calorimetry (DSC, Diamond, Perkin-Elmer Co., USA) under N2 atmosphere with the sample weight of 8.0 mg. The sample was heated from −5°C to 250°C at a rate of 10°C/min, held for 5 min to remove the thermal history. Then the melt was cooled to −50°C at a rate of 10°C/min, held for 2 min, and finally heated again to 250°C. The cooling and heating processes were recorded. The T m(s) and the value of fusion heat (▵H m) were taken from the second heating curve to minimize different thermal history effects.
Characterization of mechanical properties
Tensile tests were performed on a screw-drived universal testing machine (WSM20, Changchun Intelligent Instrument Co. Ltd, China) equipped with a 20 kN electronic load cell and mechanical grips. The tests were conducted at room temperature at a crosshead rate of 10 mm/min. All tests were carried out according to American Society for Testing and Materials (ASTM) D638-99 standard, and the data reported were the mean and standard deviation from five determinations. Charpy impact tests were carried out according to International Organization for Standardization (ISO) 179-1982 standard using the V-notch splines using an impact tester (JJ-20; Changchun Intelligent Instrument Co. Ltd, China), and the data reported were the mean and standard deviation from five determinations.
Results and discussions
XRD characterization of the nanocomposites
Figure 1 shows the XRD patterns of OMMT and different nanocomposites. For OMMT sample, its XRD curve shows a strong diffraction peak at 2θ = 4.5°, which is corresponding to the basal spacing of the OMMT. According to the Bragg’s equation, 2d sin θ = nλ, the basal spacing is calculated as 3.45 nm. For the nanocomposites of C0, C1 and C2, nearly no diffraction peak are shown in 2θ < 8°, indicating that most of OMMT layers are exfoliated in the polymer matrix. However, for the nanocomposites of C4 and C6, shallow and broad diffraction peaks are observed in 2θ < 4°. This result suggests two things: first, the polymer molecular chains are intercalated into and disordered the layer structures; second, the coherent layered scattering occurs in the composites, which should be induced by the aggregate of some OMMTs, and this deduction can be verified by the TEM images in Figure 2.
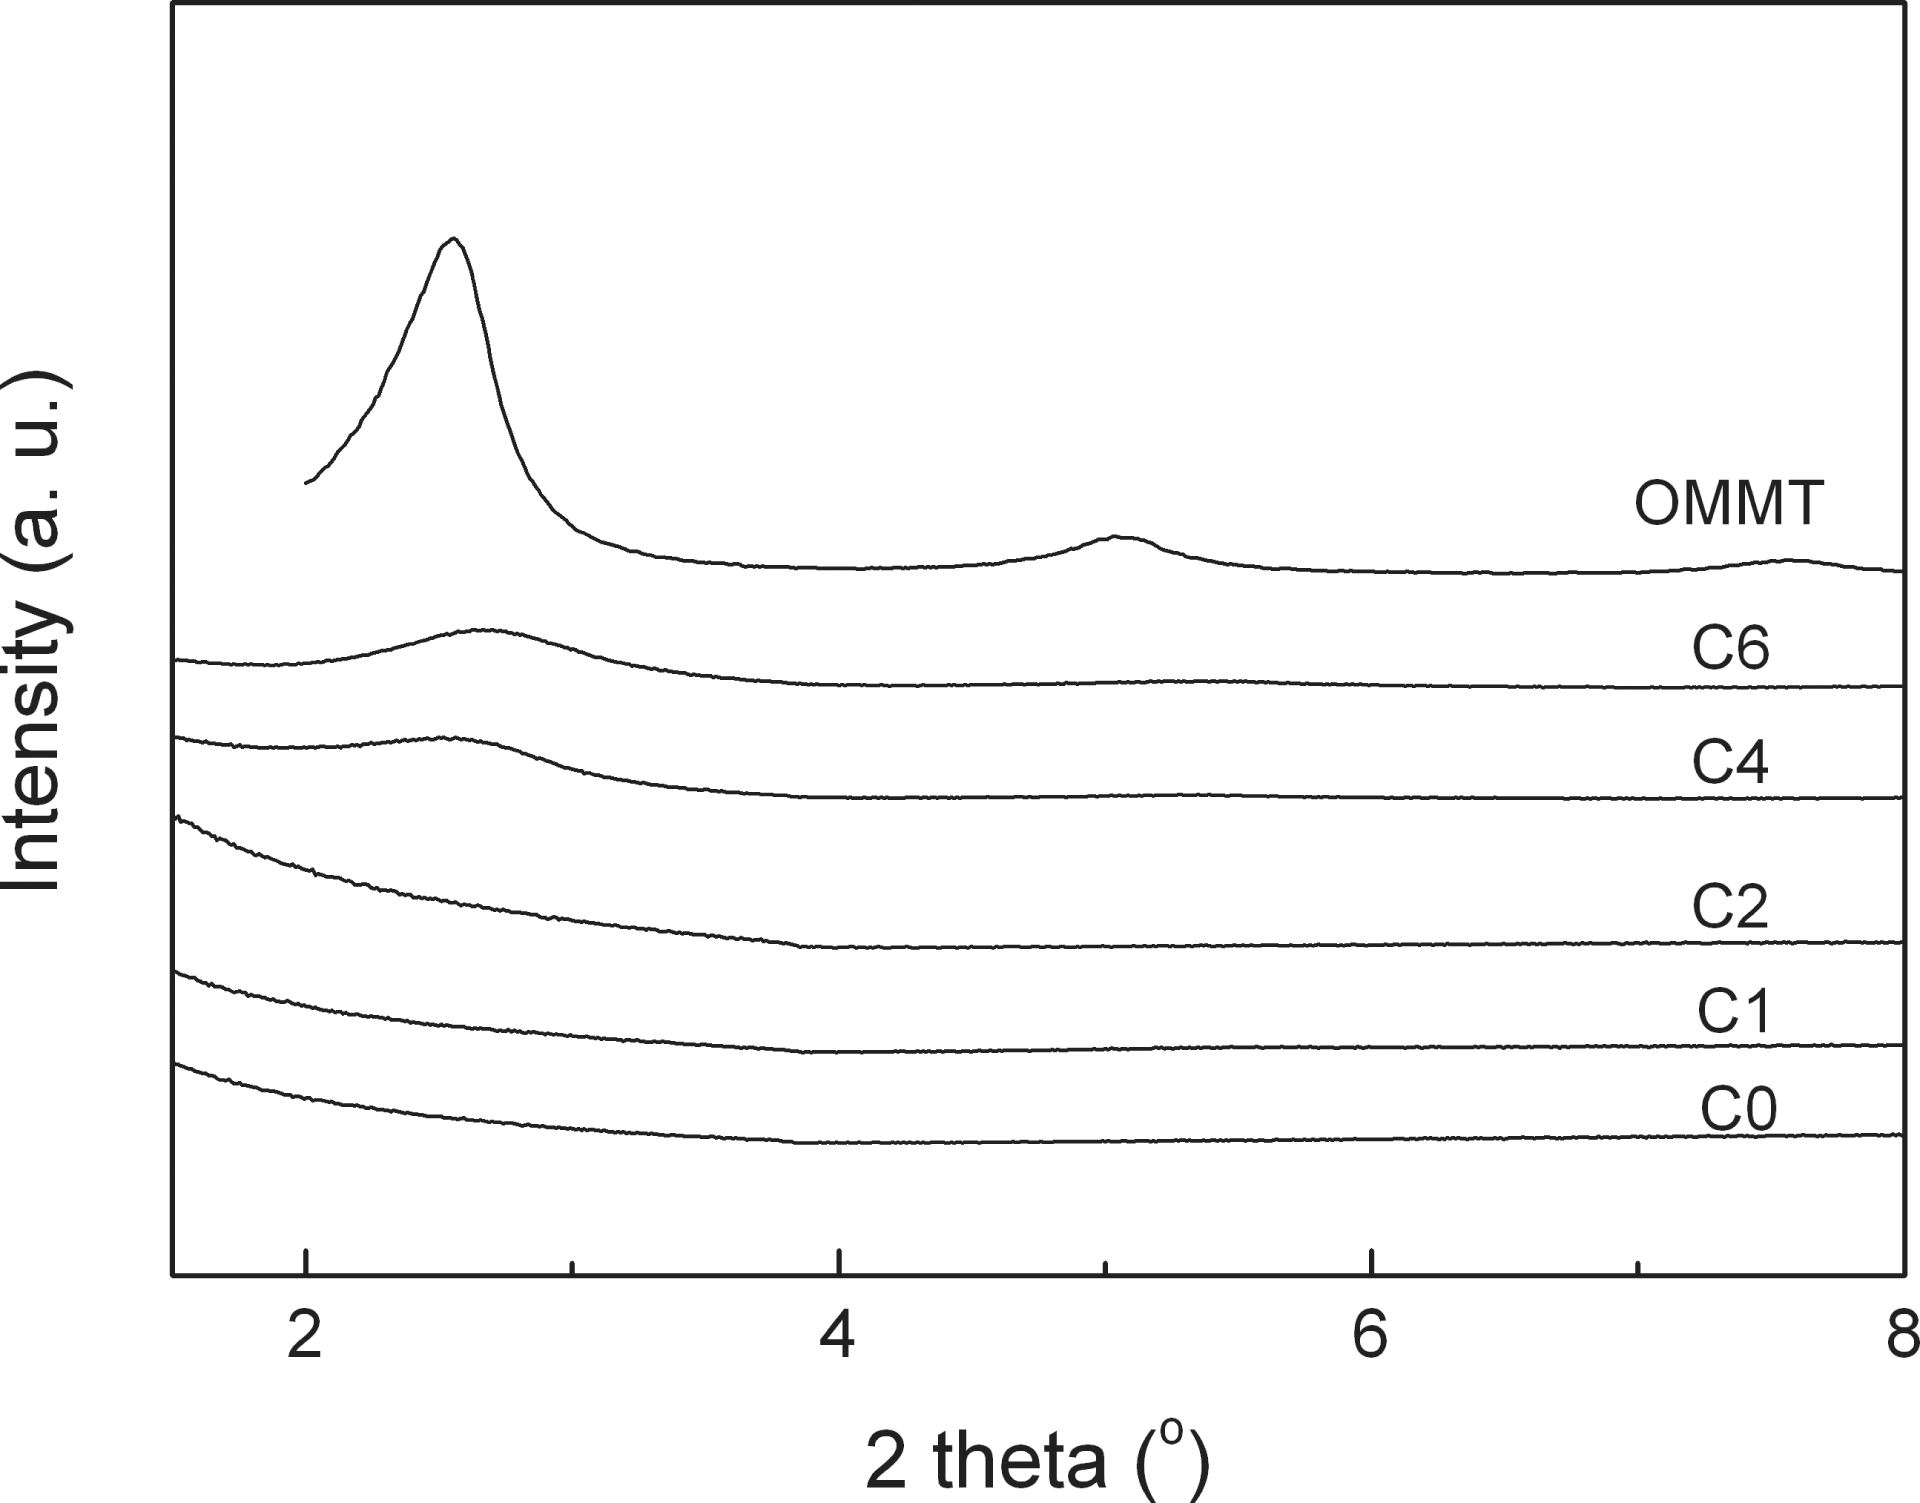
X-ray diffraction (XRD) patterns of organomontmorillonite (OMMT) and different nanocomposites C0–C6.
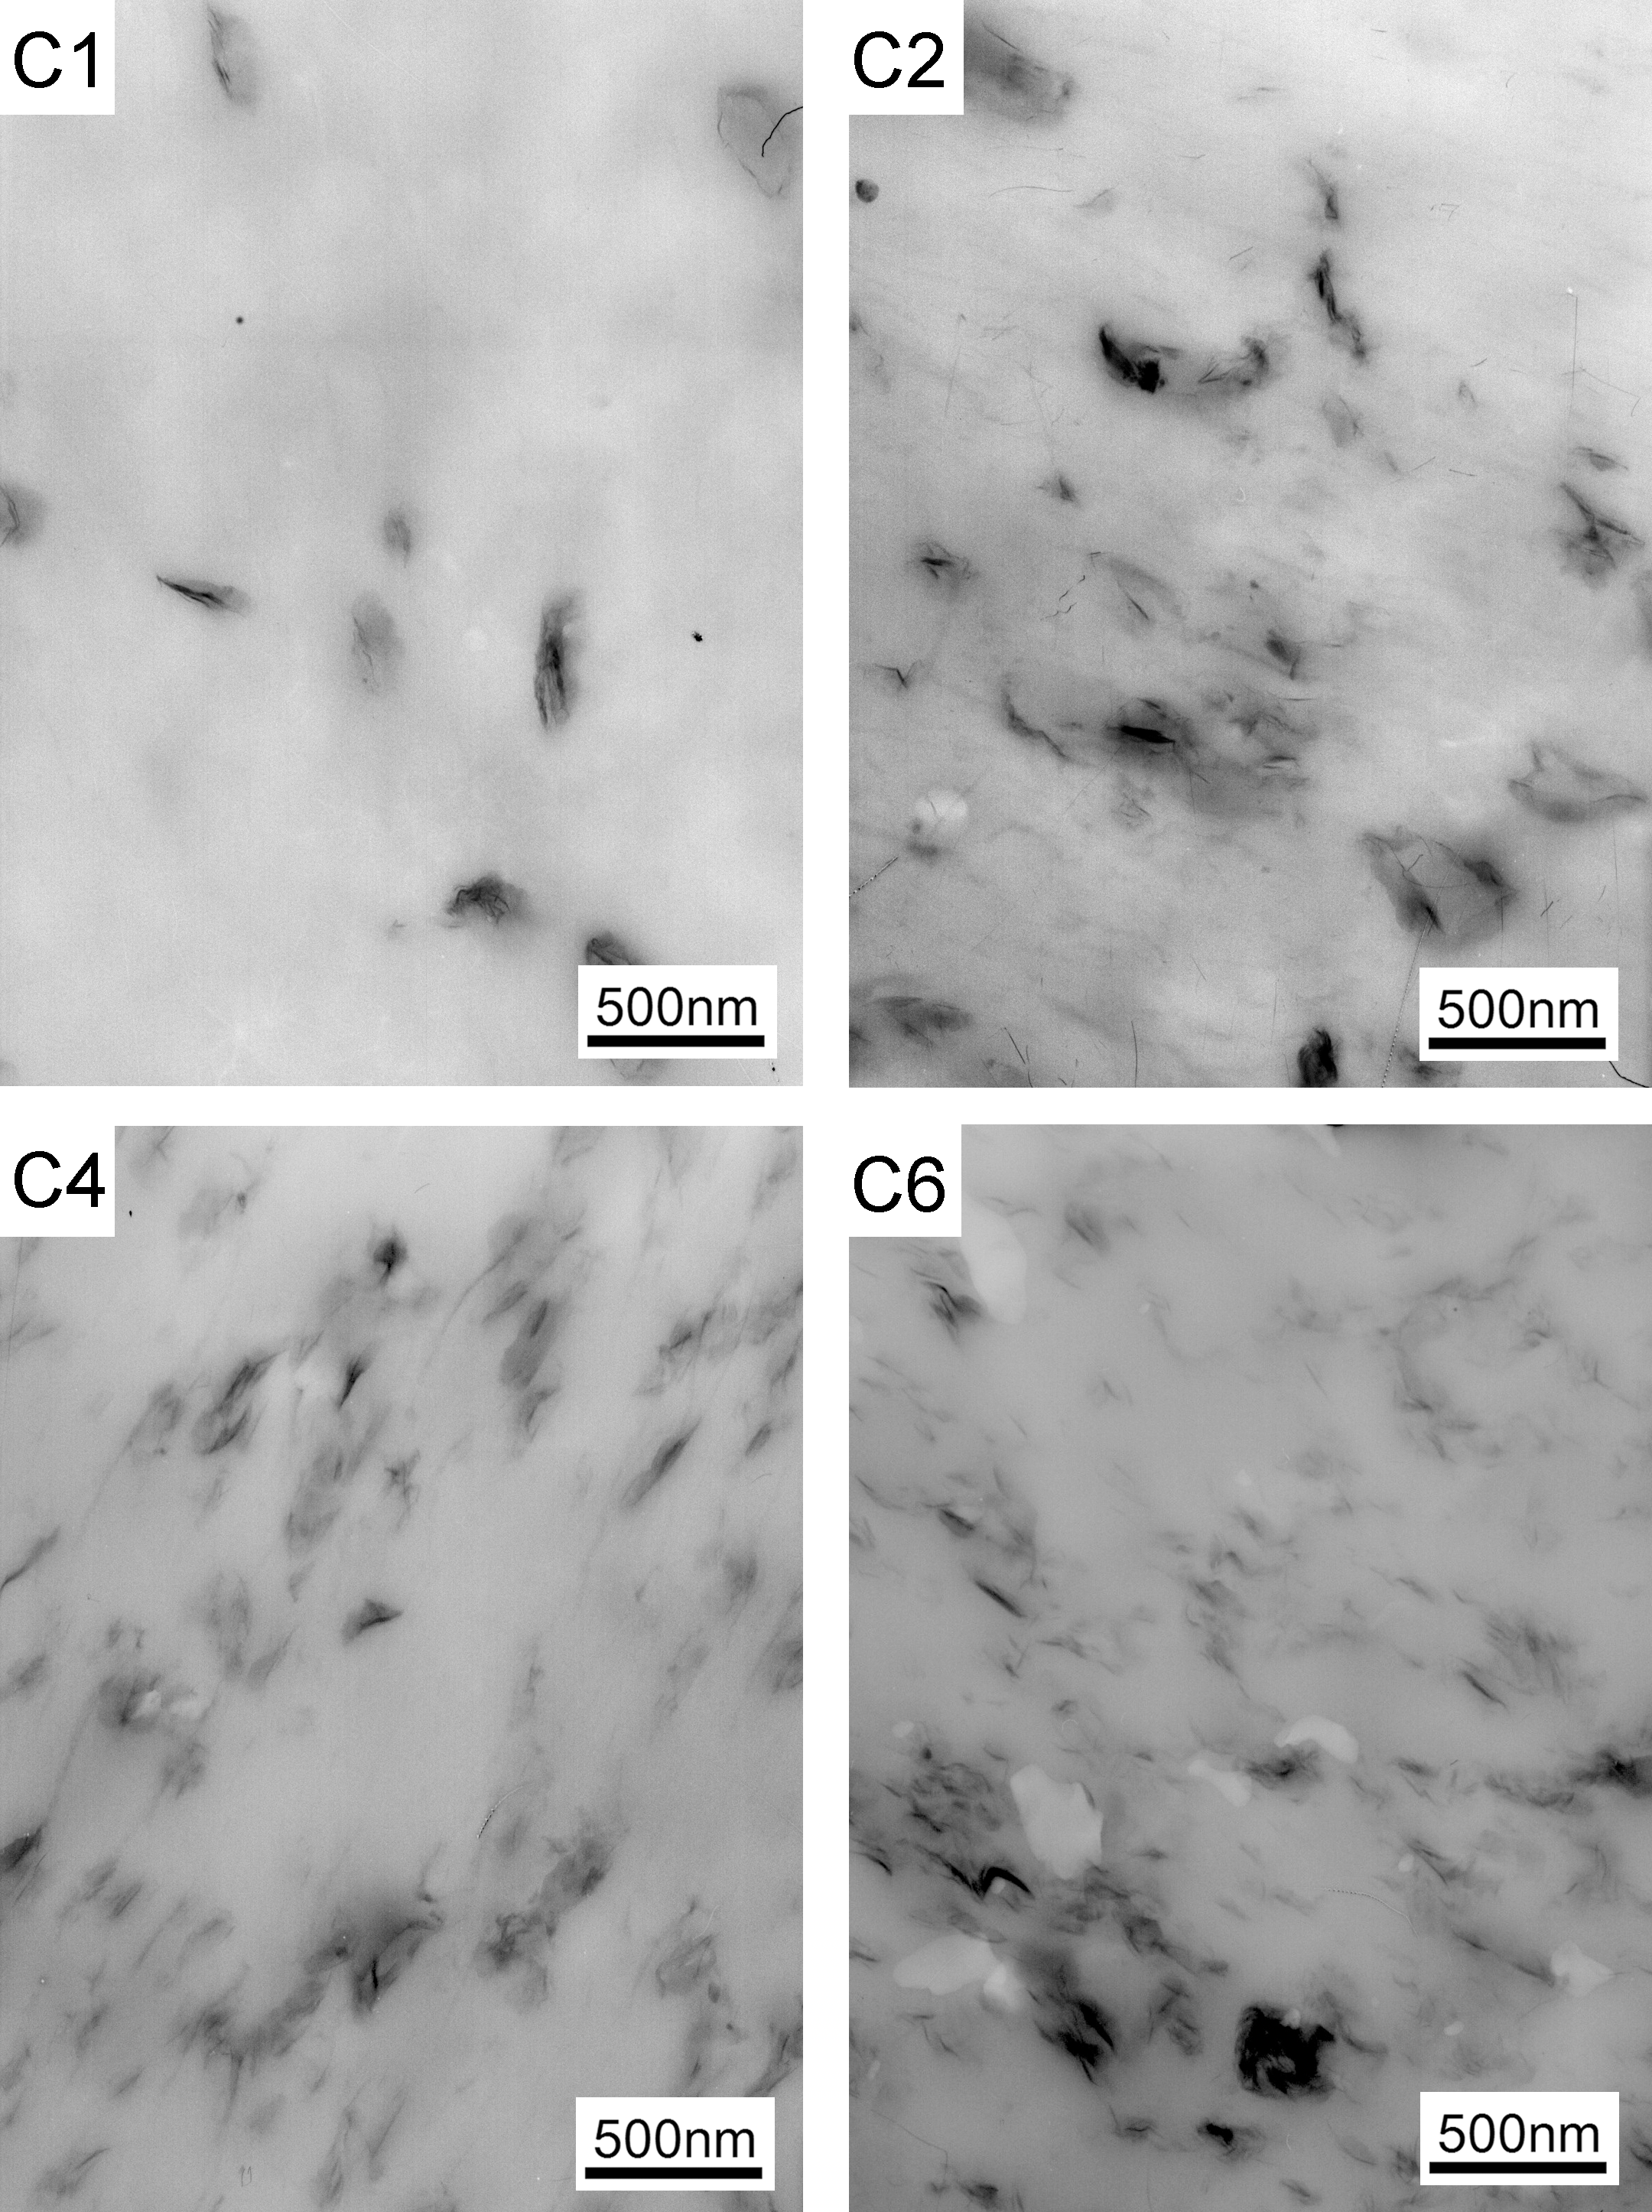
Transmission electron microscopy (TEM) micrographs of different PTT/POE/OMMT nanocomposites. OMMT: organomontmorillonite; POE: poly(octene–ethylene); PTT: poly(trimethylene terephthalate).
Phase morphology
TEM images of C1–C6 nanocomposites are shown in Figure 2. It can be seen from the picture that more and more lamellas of OMMT (black part) are dispersed in polymer matrix with the increasing OMMT content. In picture C1–C4, OMMT has a uniform distribution in the matrix and some of the OMMTs have a performance of strip-like sheet morphology. This kind of OMMT morphology will favor the improvement in the mechanical properties of the nanocomposites. When OMMT content reaches 6%, as seen in picture C6, there is not only results in dispersed sheet morphology of OMMT, but also in a small amount of larger size aggregates of OMMT. Thus, too much OMMT in polymer is difficult to disperse because of the increasing viscosity of the melt, which will be unfavorable for improving the mechanical property of the nanocomposite. However, there is no phase morphology of POE clearly shown in all the pictures because of the small content of POE (4%) in all the composites; moreover, POE-g-MAH may have some compatibility with PTT component, and this result can further undifferentiate POE phase with PTT phase.
Dynamic rheological behavior
Figure 3 shows the plots of complex viscosity versus frequency (η*–ω) of different nanocomposites. In the experimental frequency range, the complex viscosity of nanocomposites is significantly increased with increasing OMMT content, especially for the nanocomposite with 6 wt% of OMMT, which has the largest complex viscosity among all the nanocomposites. It is observed from Figure 3, at 1 rad/s, that the complex viscosity of C4 and C6 is 127% and 512% higher than that of C0, respectively. This result indicates that OMMT has a strong interaction with polymer molecules. The nanosheets of OMMT and polymer molecules form more and more entangled structure, which restricts the flow of the molecular chains. So the OMMT has played a significant role in increasing the melt viscosity. In addition, the complex viscosity of each nanocomposite declines with increasing frequency, and the complex viscosity of different nanocomposites is tended to be close to each other at higher frequency. This result suggests that the entanglement structure is continuously destructed and shear orientation structure is gradually formed at increasing shear rate. Especially for the nanocomposite with 6 wt% OMMT, its complex viscosity decreases greatly with increasing frequency, suggesting that the most entanglement structure has formed in this nanocomposite and this structure destructs rapidly under larger shearing rate. Above results show that all the melt of all nanocomposites are pseudoplastic fluid and adjusting the shear frequency can control the processing viscosity.
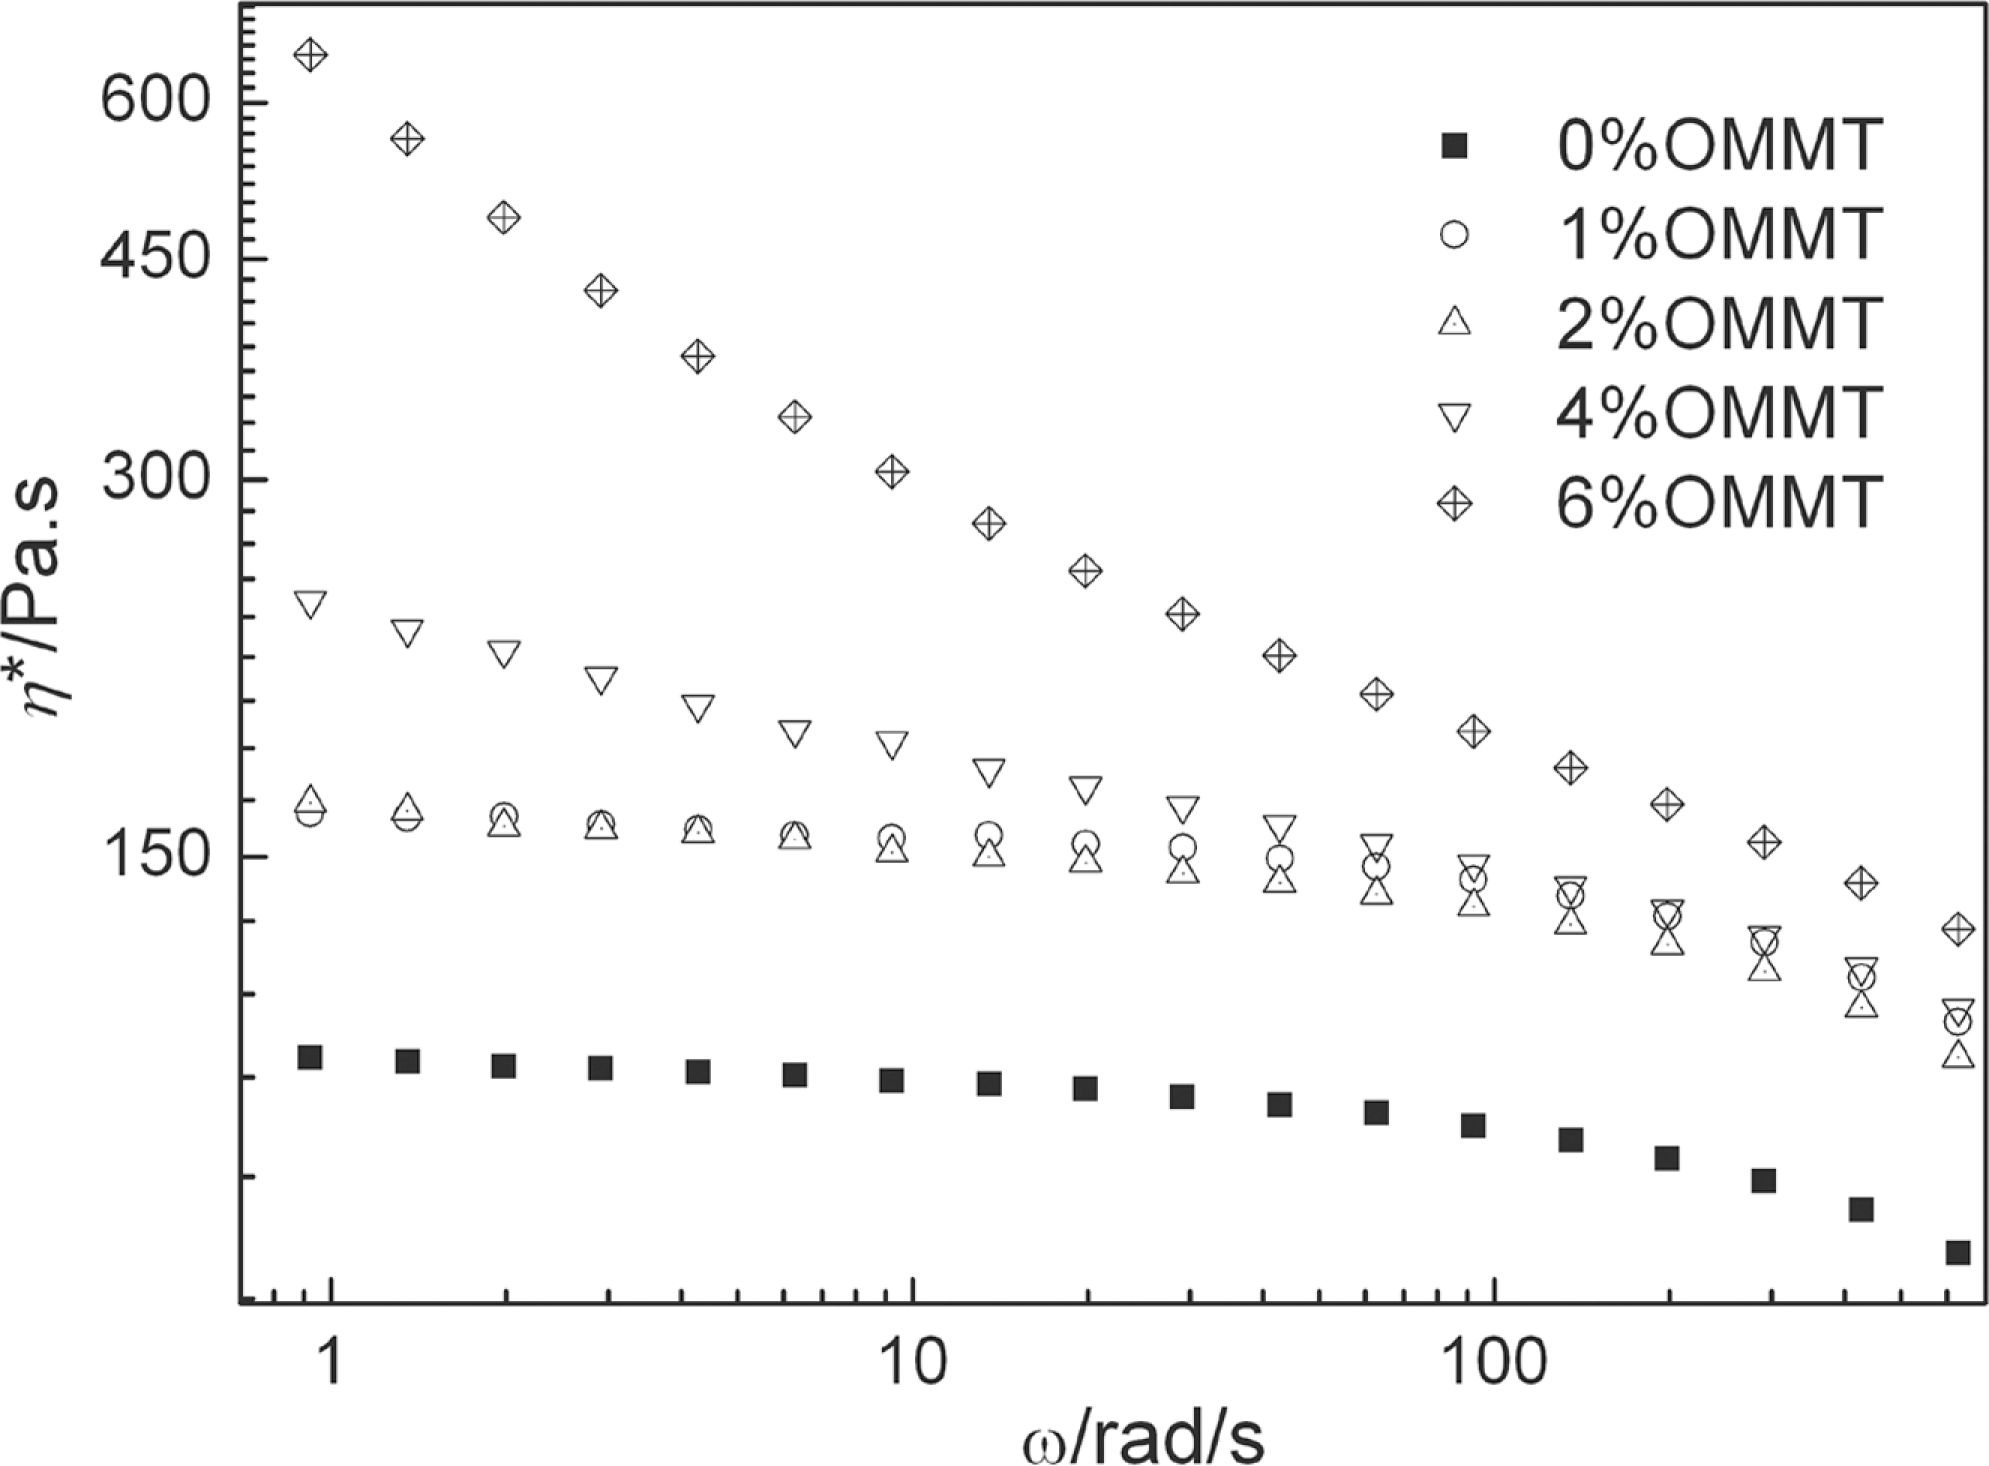
η*–ω curves of different nanocomposites.
The plots of shear storage modulus (G′) and loss modulus (G″) of different nanocomposites are shown in Figures 4 and 5. It can be observed that G′ and G″ increase with increasing OMMT content, especially in the lower frequency region. At higher frequencies, the difference decreases gradually. These results suggest that the rheological behavior at lower frequencies is dominated by the OMMT filler while it is dominated by the polymer at higher frequencies. The entanglement structure between OMMT and polymer chains can store more elastic modulus, at the same time, the friction between OMMT nanosheets and polymer molecules is increased with increasing OMMT content.
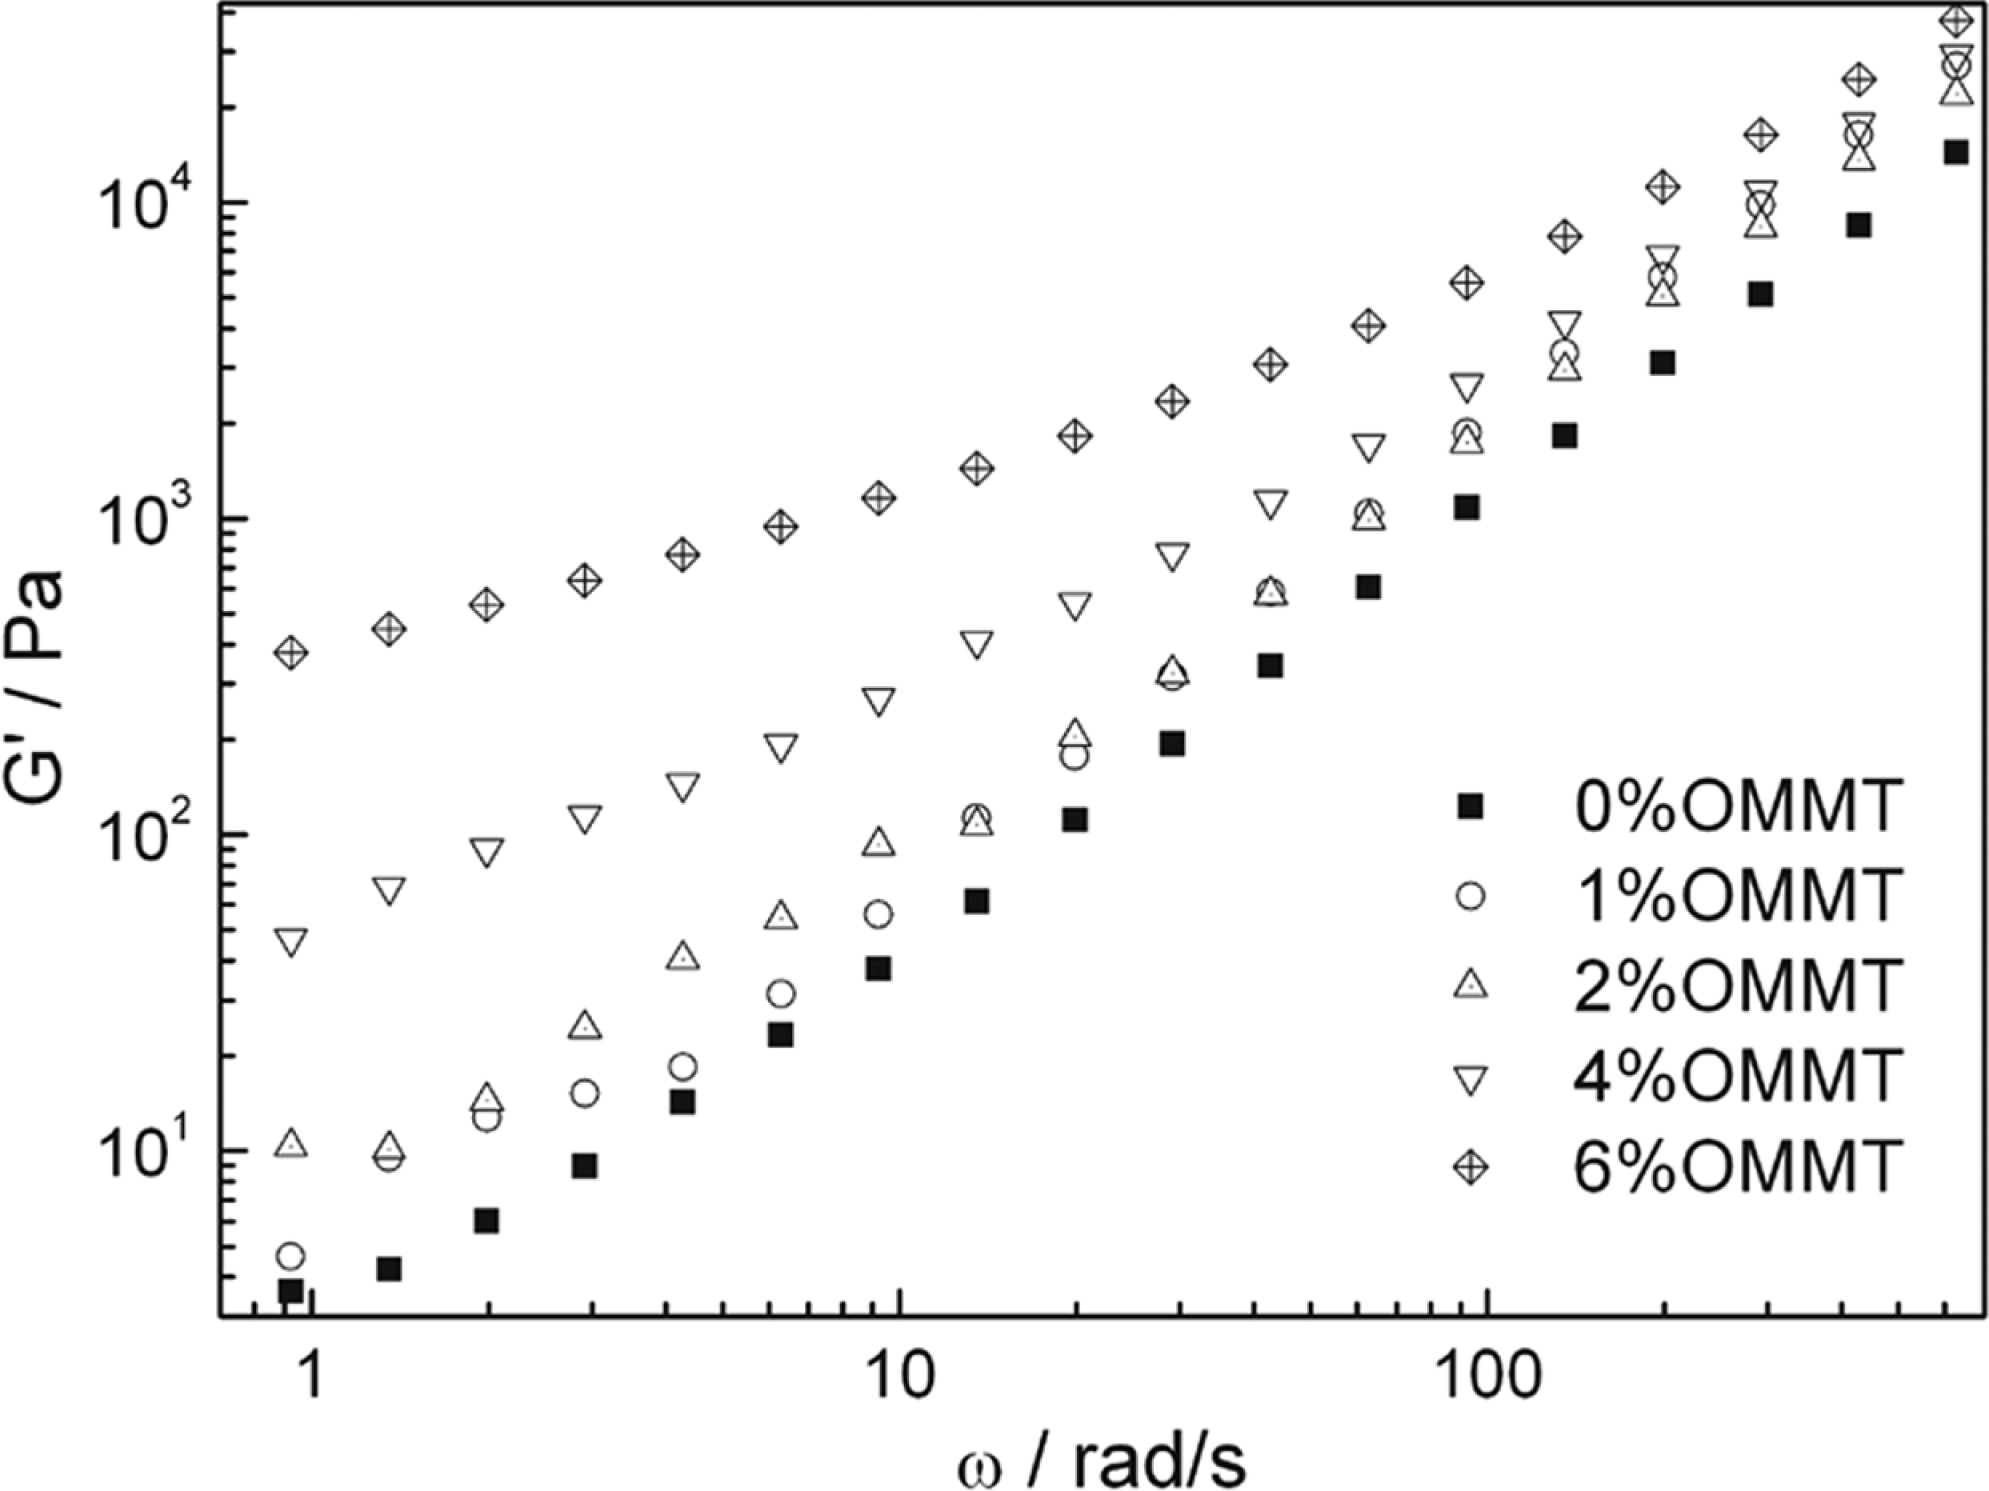
G′-ω curves of different nanocomposites.
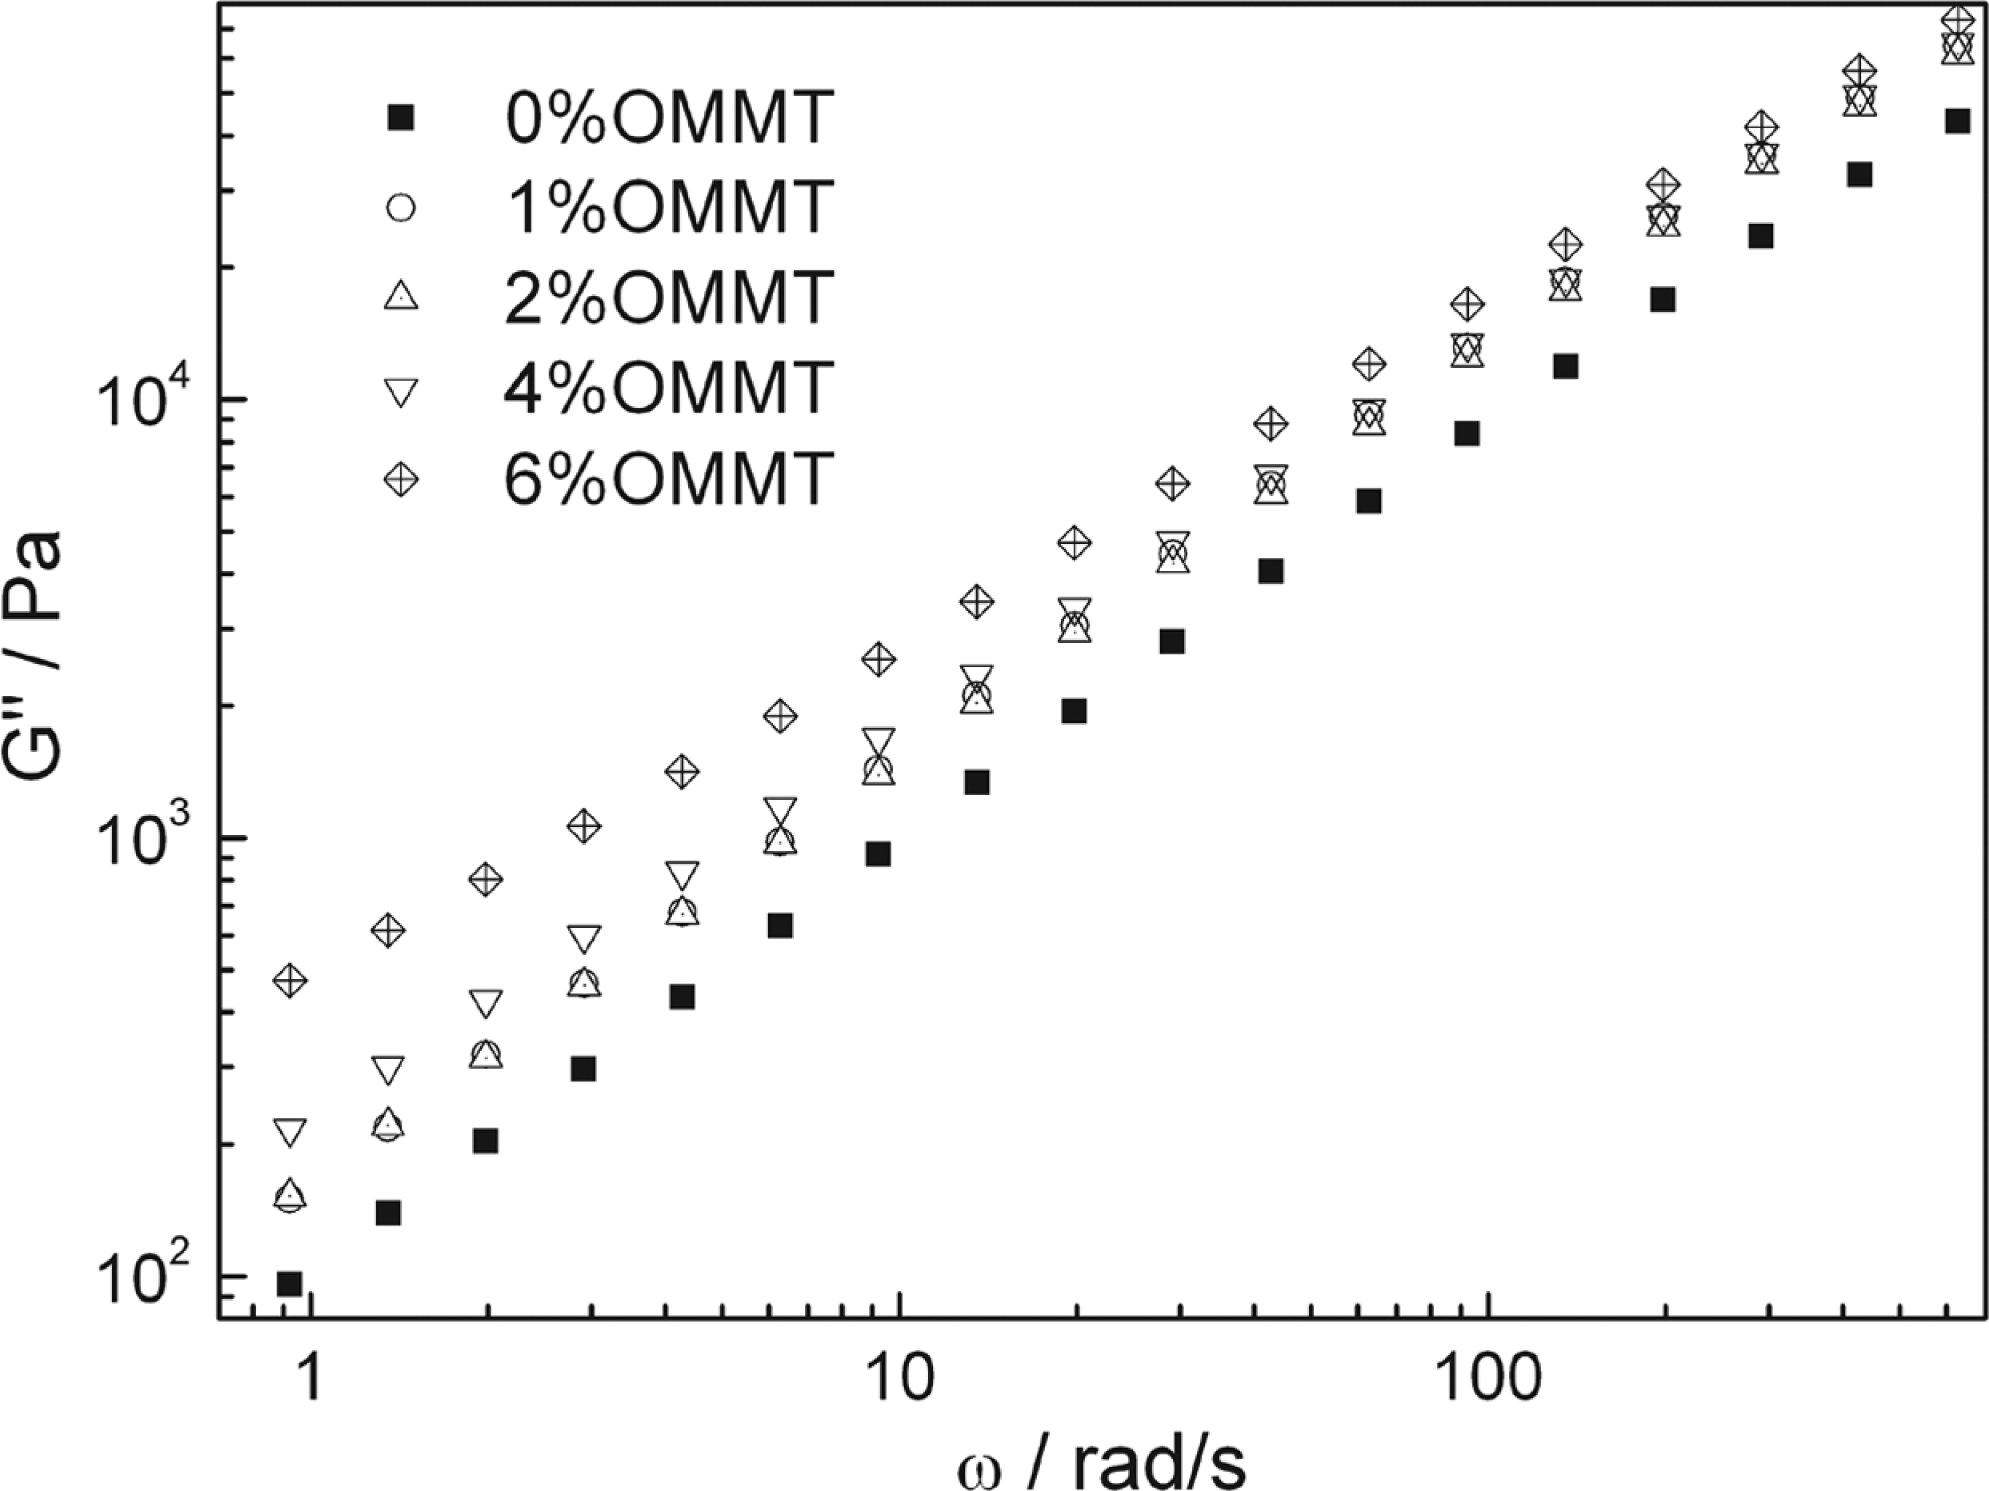
G′′-ω curves of different nanocomposites.
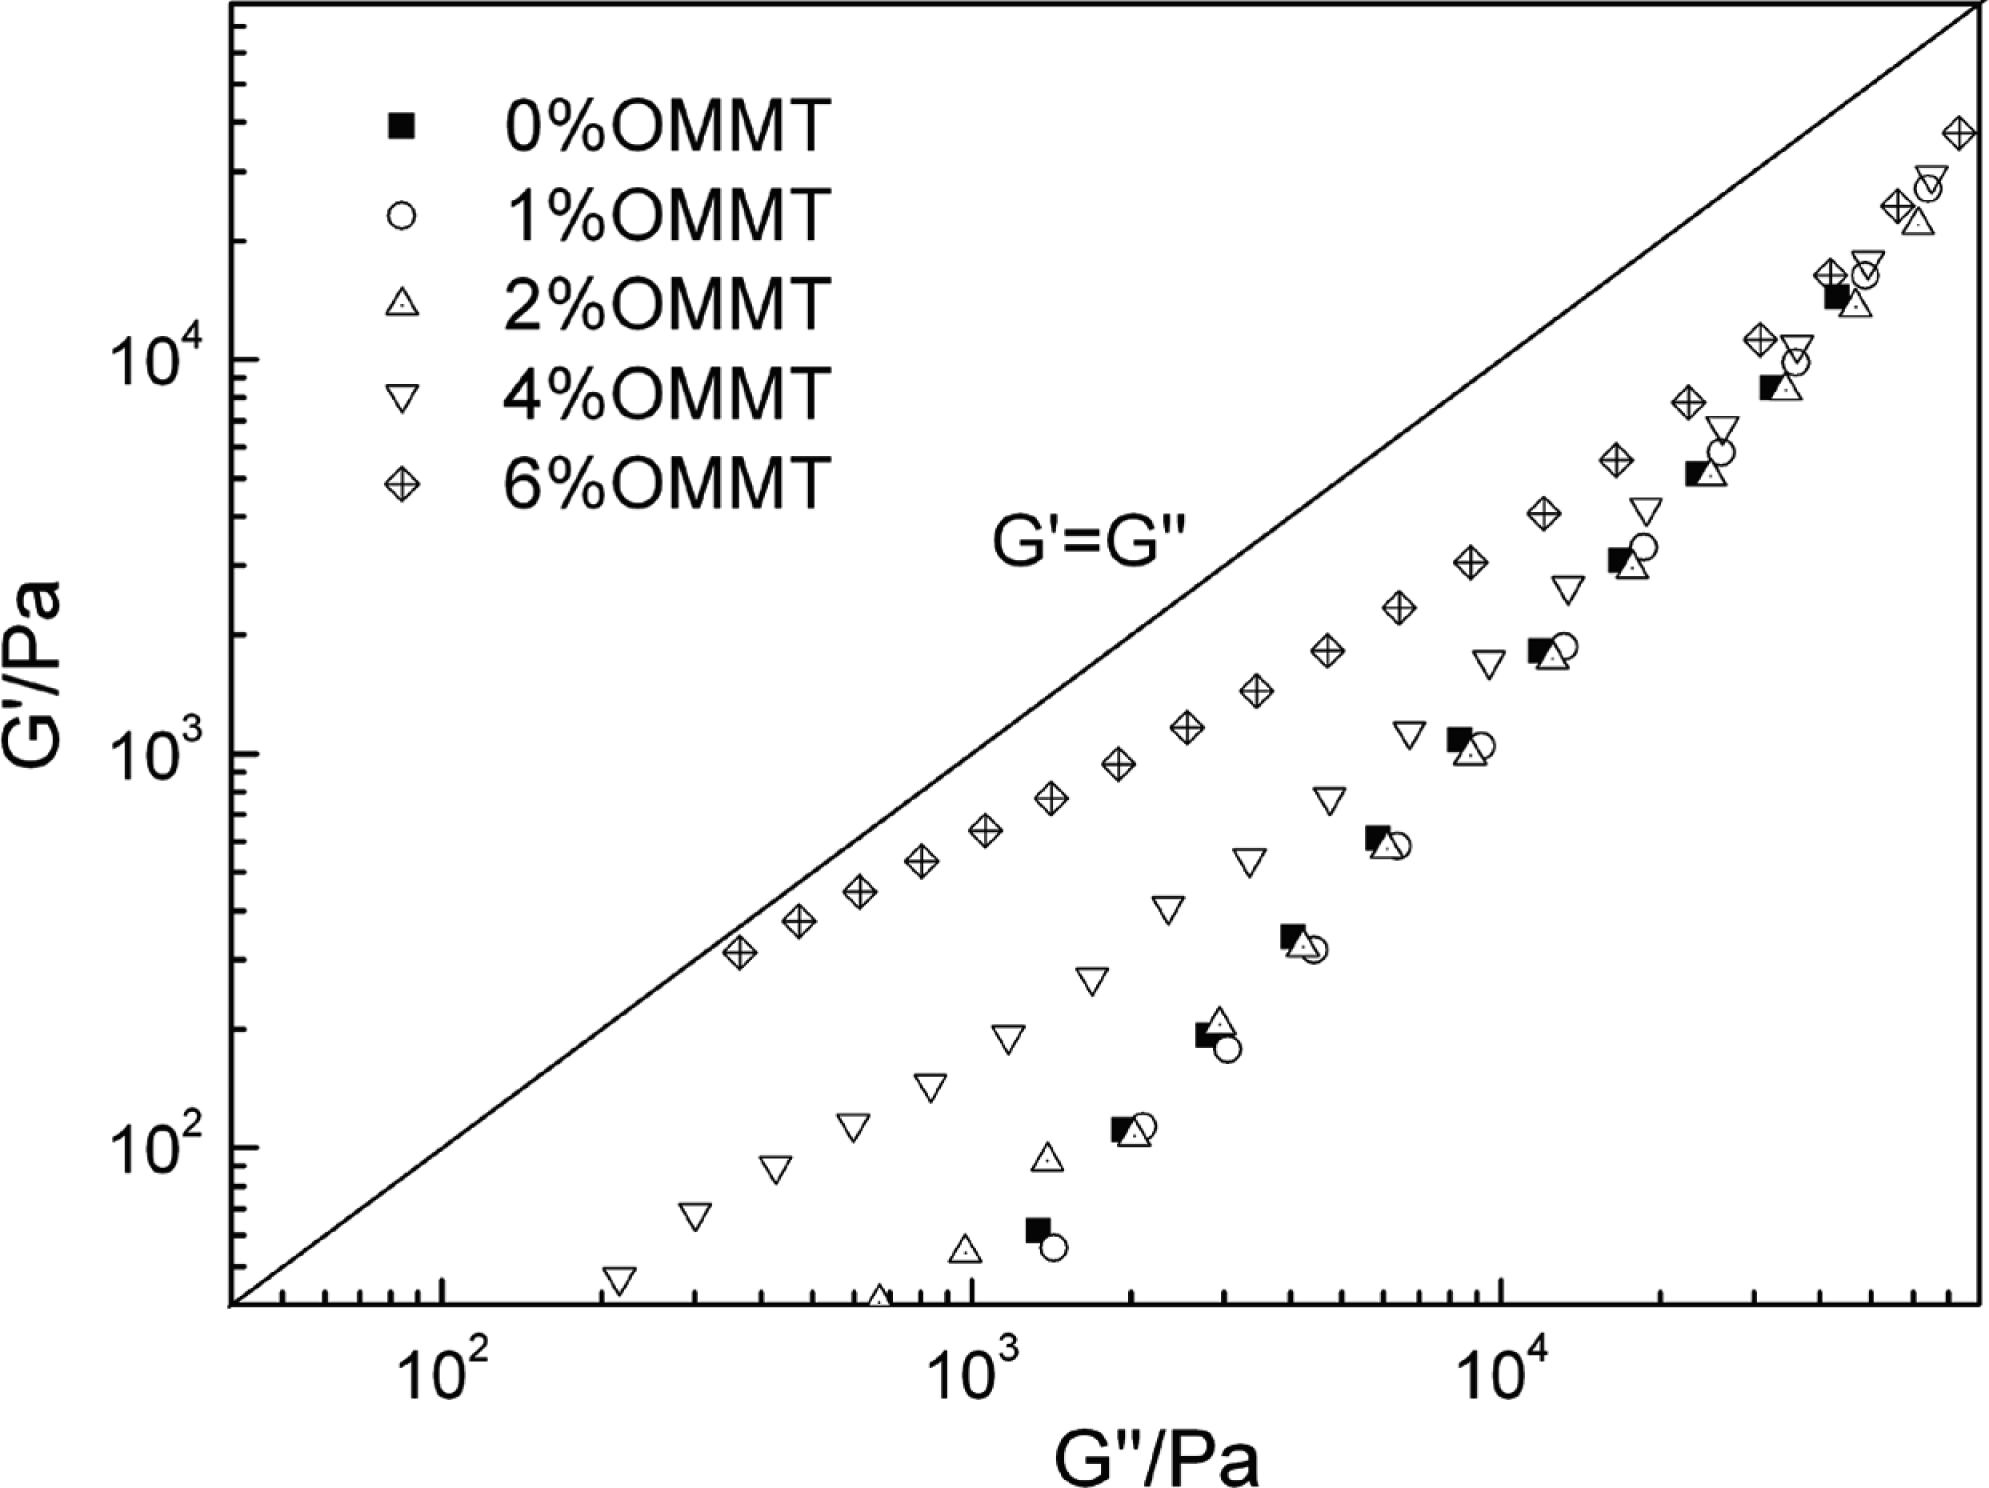
Figure 6 is the Cole–Cole patterns of shear storage modulus versus shear loss modulus of different nanocomposites. The crossing point (G′ = G″) provides direction of changes of the melt viscoelasticity. Under the experimental conditions, G′ < G″, viscosity behavior of all the melts has an advantage than the elastic behavior. At low frequencies, with the increase in OMMT content, the elastic behavior of the melt increases gradually, especially when OMMT% >2%, the elastic behavior is significantly increased, mainly because of the good dispersion of the nanolayers in the matrix and the entanglement structure or interaction between OMMT and the polymer molecules, which increases the elasticity of the melt. However, at the large frequencies, the viscoelastic behavior of the nanocomposites is close to each other mainly because the OMMT nanosheets and polymer molecules are unentangled at large shear frequencies and the melt viscoelasticity of different nanocomposites is irrelative to their OMMT content.
Plots of G′–G″ of different nanocomposites.
Crystal morphology
Figure 7 shows the POM images of the sample of PTT and C0–C6. It can be seen in Figure 7 that pure PTT can form the spherulites with large size and perfect morphology. And owing to the influence of POE, the blend C0 can only form smaller spherulites with less perfect morphology. For all the nanocomposites, as shown in image C1–C6, the crystal size of PTT becomes much smaller and imperfect; evenly no spherulites can be seen in these images. It indicates that OMMT is served as an effective nucleation agent for the crystallization of PTT, and it makes the crystal morphology become microcrystallites, which will improve the mechanical properties of the nanocomposite. As seen in images of C1–C6, when OMMT content is more than 2 wt%, the crystal morphology is nearly unchanged, suggesting that the nucleating effect of OMMT has reached saturation.
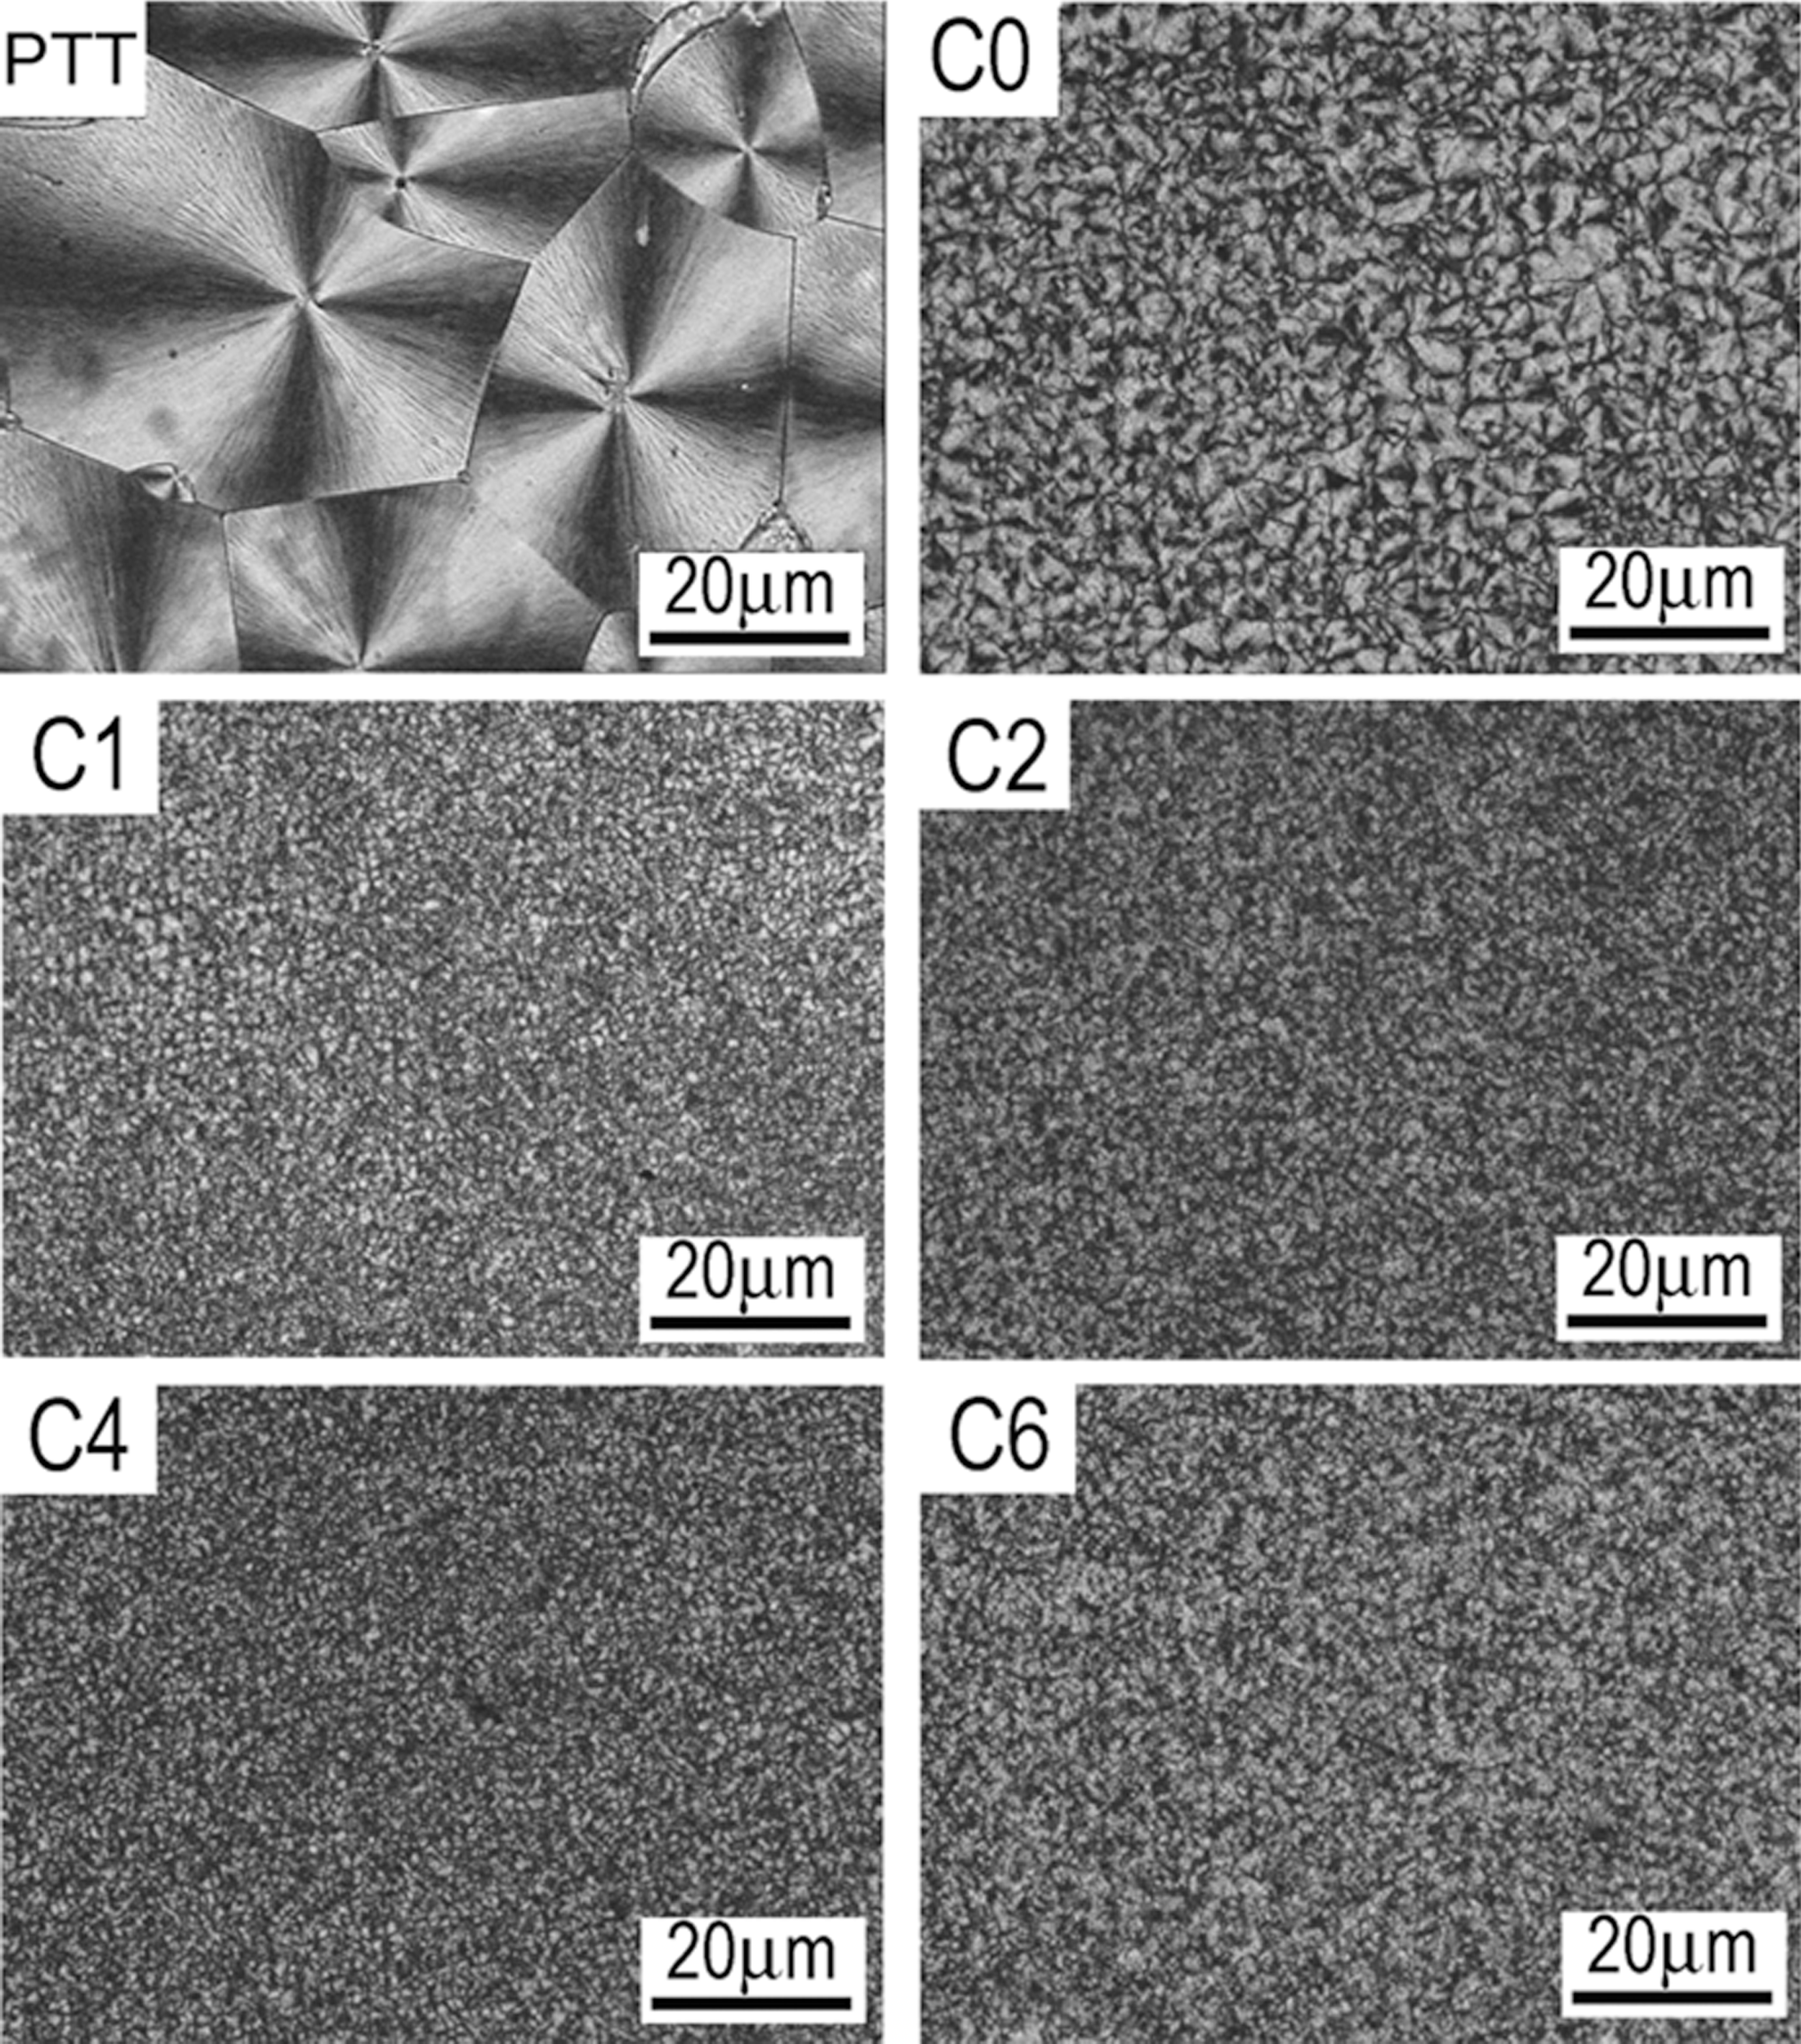
Polarized optical microscopy (POM) micrographs of PTT/POE/OMMT nanocomposites. OMMT: organomontmorillonite; POE: poly(octene–ethylene); PTT: poly(trimethylene terephthalate).
Melting and nonisothermal crystallization
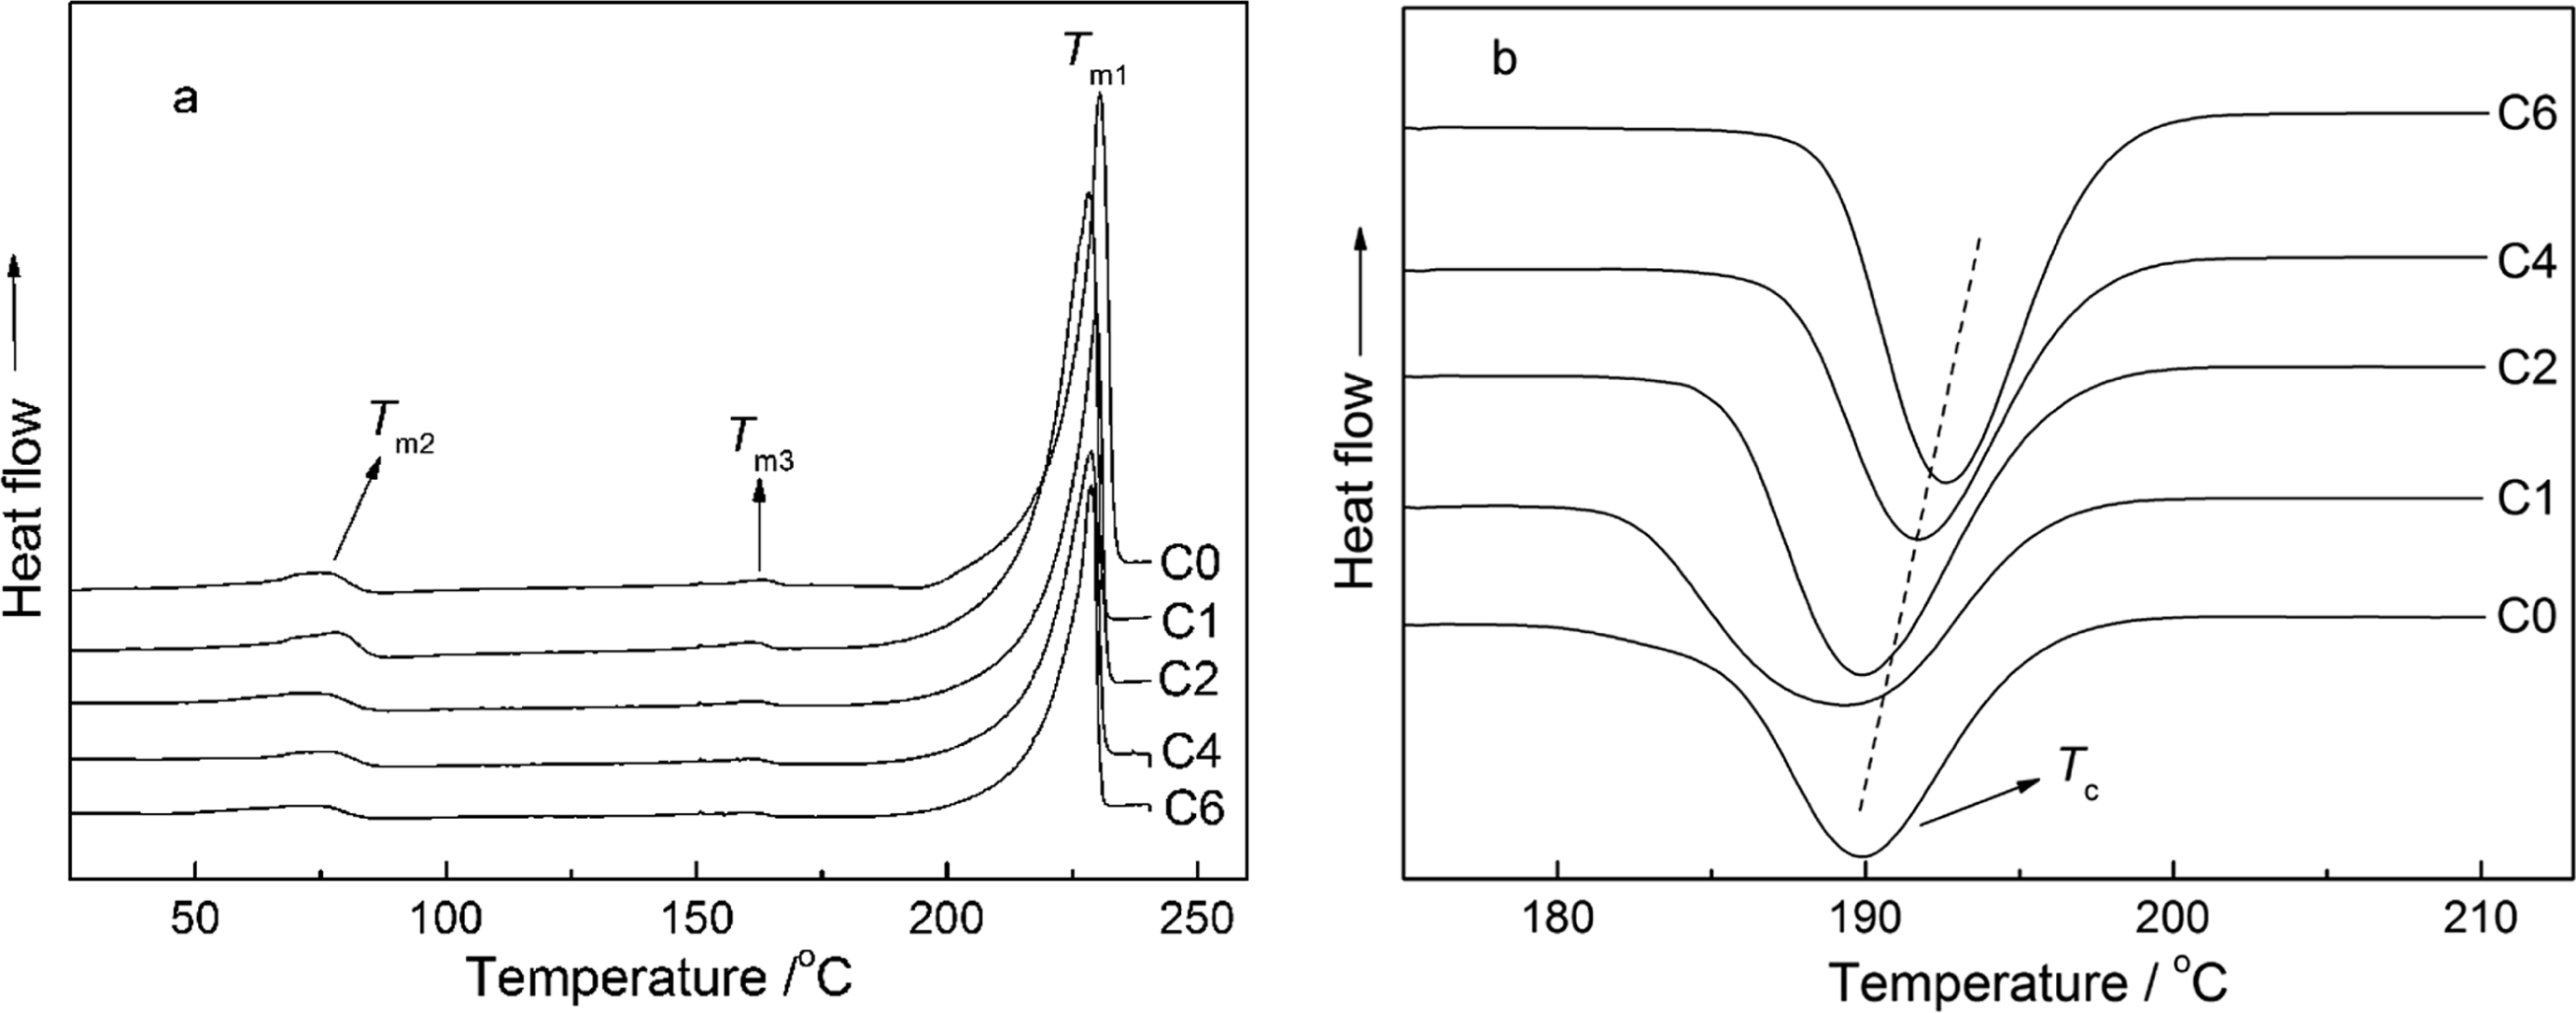
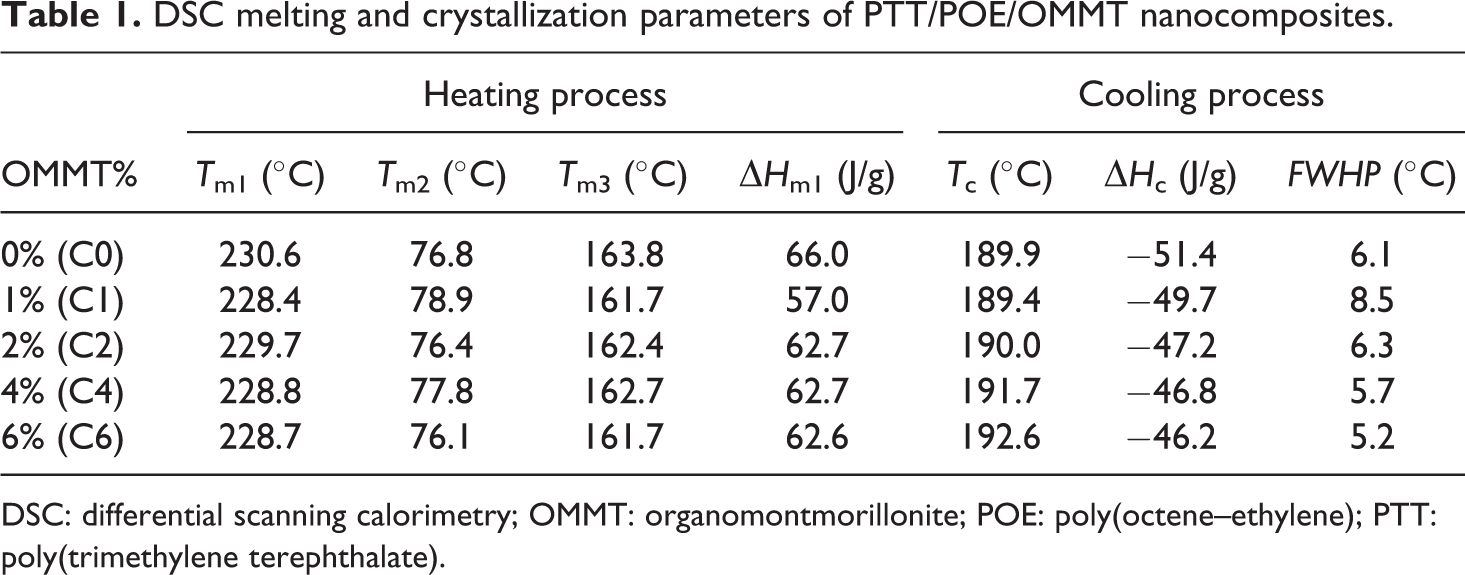
Figure 8(a) shows the first DSC heating curves of different nanocomposites extruded by melt blending, cooled in cold water. The melting parameters are listed in Table 1. It can be seen that the DSC curve of each sample exhibits three endothermic peaks, in which the largest endothermic peak T m1 is the melting peak of PTT, while the two small endothermic peaks T m2 and T m3 are the melting peak of the ethylene and octene section of the POE molecule, respectively. Besides, with the increase in OMMT content, T m2 and T m3 are not changed significantly, resulting from the unchanged POE content. When 1% OMMT is added, the values of T m1 and ▵H m1 decrease slightly; while the content of OMMT is more than 2 wt%, T m1 is nearly unchanged. As we know, proper content of OMMT will cause the large crystal transferring into microcrystal, so the microcrystallites will have lower melting point; however, the above effect will reach saturation if too much of OMMT exists, and so the melting point will keep unchanged. Also, no obvious glass transition can be observed in all DSC curves at around 50°C. This may be because the samples have crystallized rapidly in the cooling process by cold water, and DSC does not detect the glass transition of the less amorphous phase in the composites.
Differential scanning calorimetry (DSC) melting (a) and melt crystallization (b) curves of different nanocomposites.
DSC melting and crystallization parameters of PTT/POE/OMMT nanocomposites.
DSC: differential scanning calorimetry; OMMT: organomontmorillonite; POE: poly(octene–ethylene); PTT: poly(trimethylene terephthalate).
Figure 8(b) shows the nonisothermal crystallization curves of different samples, and the crystallization parameters are listed in Table 1. It is revealed in Figure 8(b) and Table 1 that with the increase in OMMT content, the melt-crystallization peak temperature (T c) of the nanocomposite shifts to higher temperature, and the full width at half peak height (FWHP) is also taken on a trend of growing narrow. Moreover, the crystallization enthalpy (▵H c) is lower than that of C0 (PTT/POE) blend obviously. The above results suggest that OMMT has acted as a nucleation agent for the crystallization of PTT. When the OMMT content increases, the nucleation effect is more obvious and the crystallization rate is increased gradually. However, the crystallinity will decrease because of the thickening effect of OMMT and POE in the composites.
Mechanical properties
The tensile and impact strength of different nanocomposites are shown in Figure 9. It can be seen from Figure 9 that the tensile and impact strength reach maximum when the OMMT content is 2%. Comparing the tensile and impact strength value of C2 with those of C0, the tensile strength increases about 23% and the impact strength increases about 24% than those of C0. When the OMMT content is 4–6 wt% both the tensile and impact strengths decrease gradually. Thus, it can be concluded that the proper content of OMMT can both reinforce and toughen the PTT/POE blend.
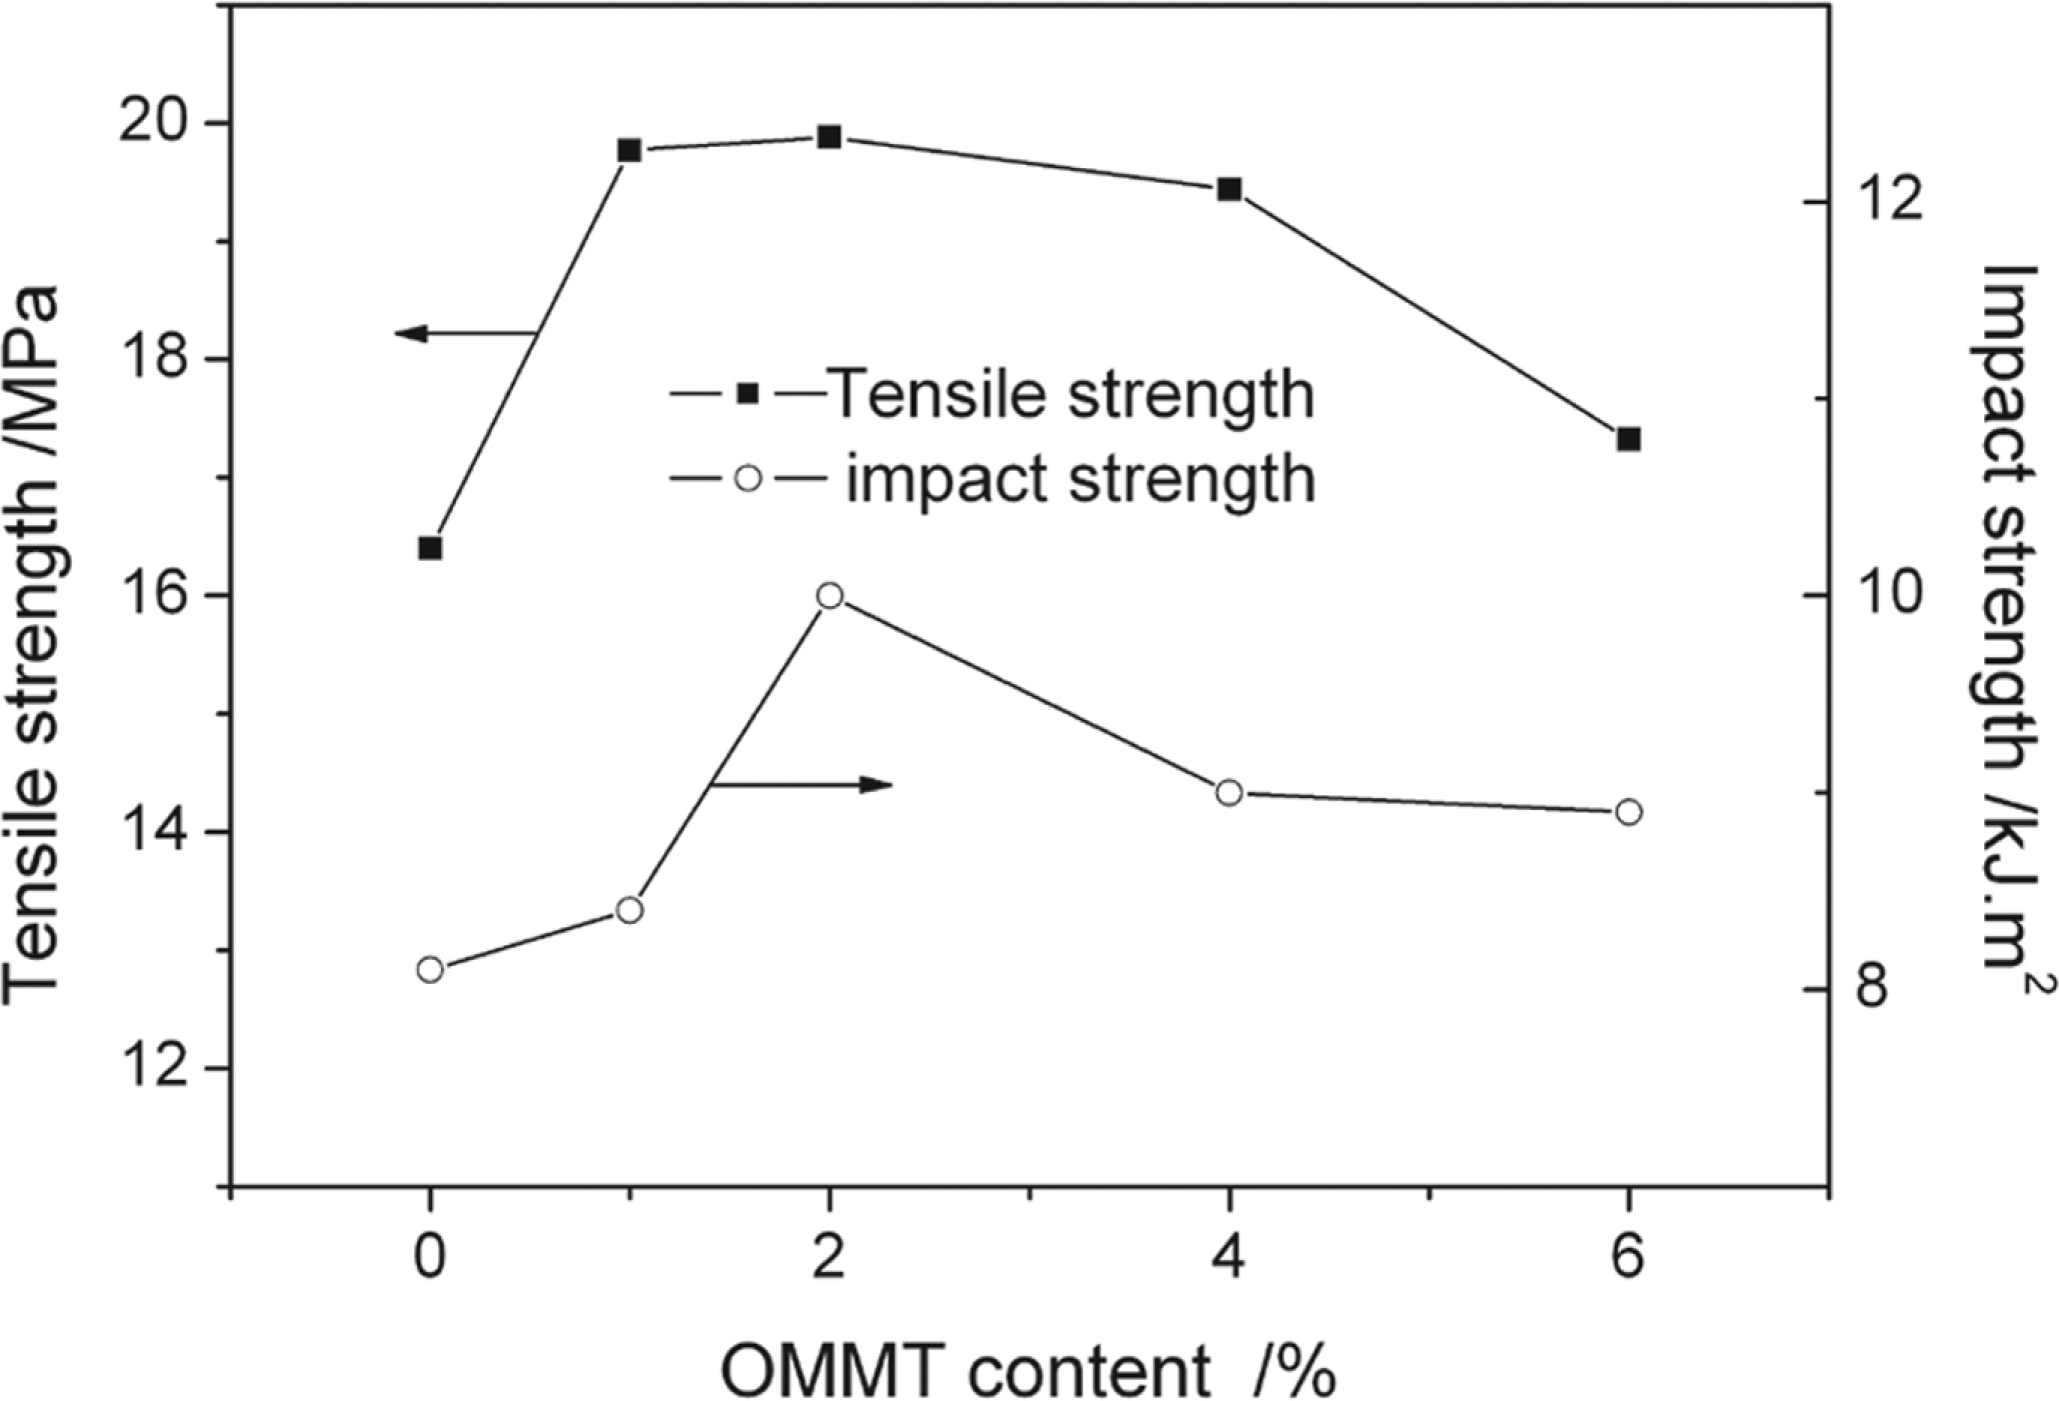
Tensile and impact strength of PTT/POE/OMMT nanocomposites. OMMT: organomontmorillonite; POE: poly(–ethylene); PTT: poly(trimethylene terephthalate).
Dynamic mechanical properties
Figure 10 shows the dependence of elastic modulus on temperature of PTT/POE/OMMT nanocomposites. In the temperature range of 20–30°C, the elastic modulus of the nanocomposites with 1 wt% and 2 wt% OMMT content is lower than that of the PTT/POE blend (0% OMMT), while the elastic modulus of the nanocomposites with OMMT content of 4 wt% and 6 wt% is higher than that of the PTT/POE blend. In the temperature range of 30–80°C, the modulus of all samples decreases sharply with increasing temperature, suggesting that the glass transition occurs. After the glass transition temperature, the modulus of PTT/POE increases because the cold crystallization of PTT in the range of 63–80°C, which leads to an apparent increase in the material modulus. But the nanocomposites’ modulus only increases a little, indicating that OMMT component limits the cold-crystallization behavior of the PTT.
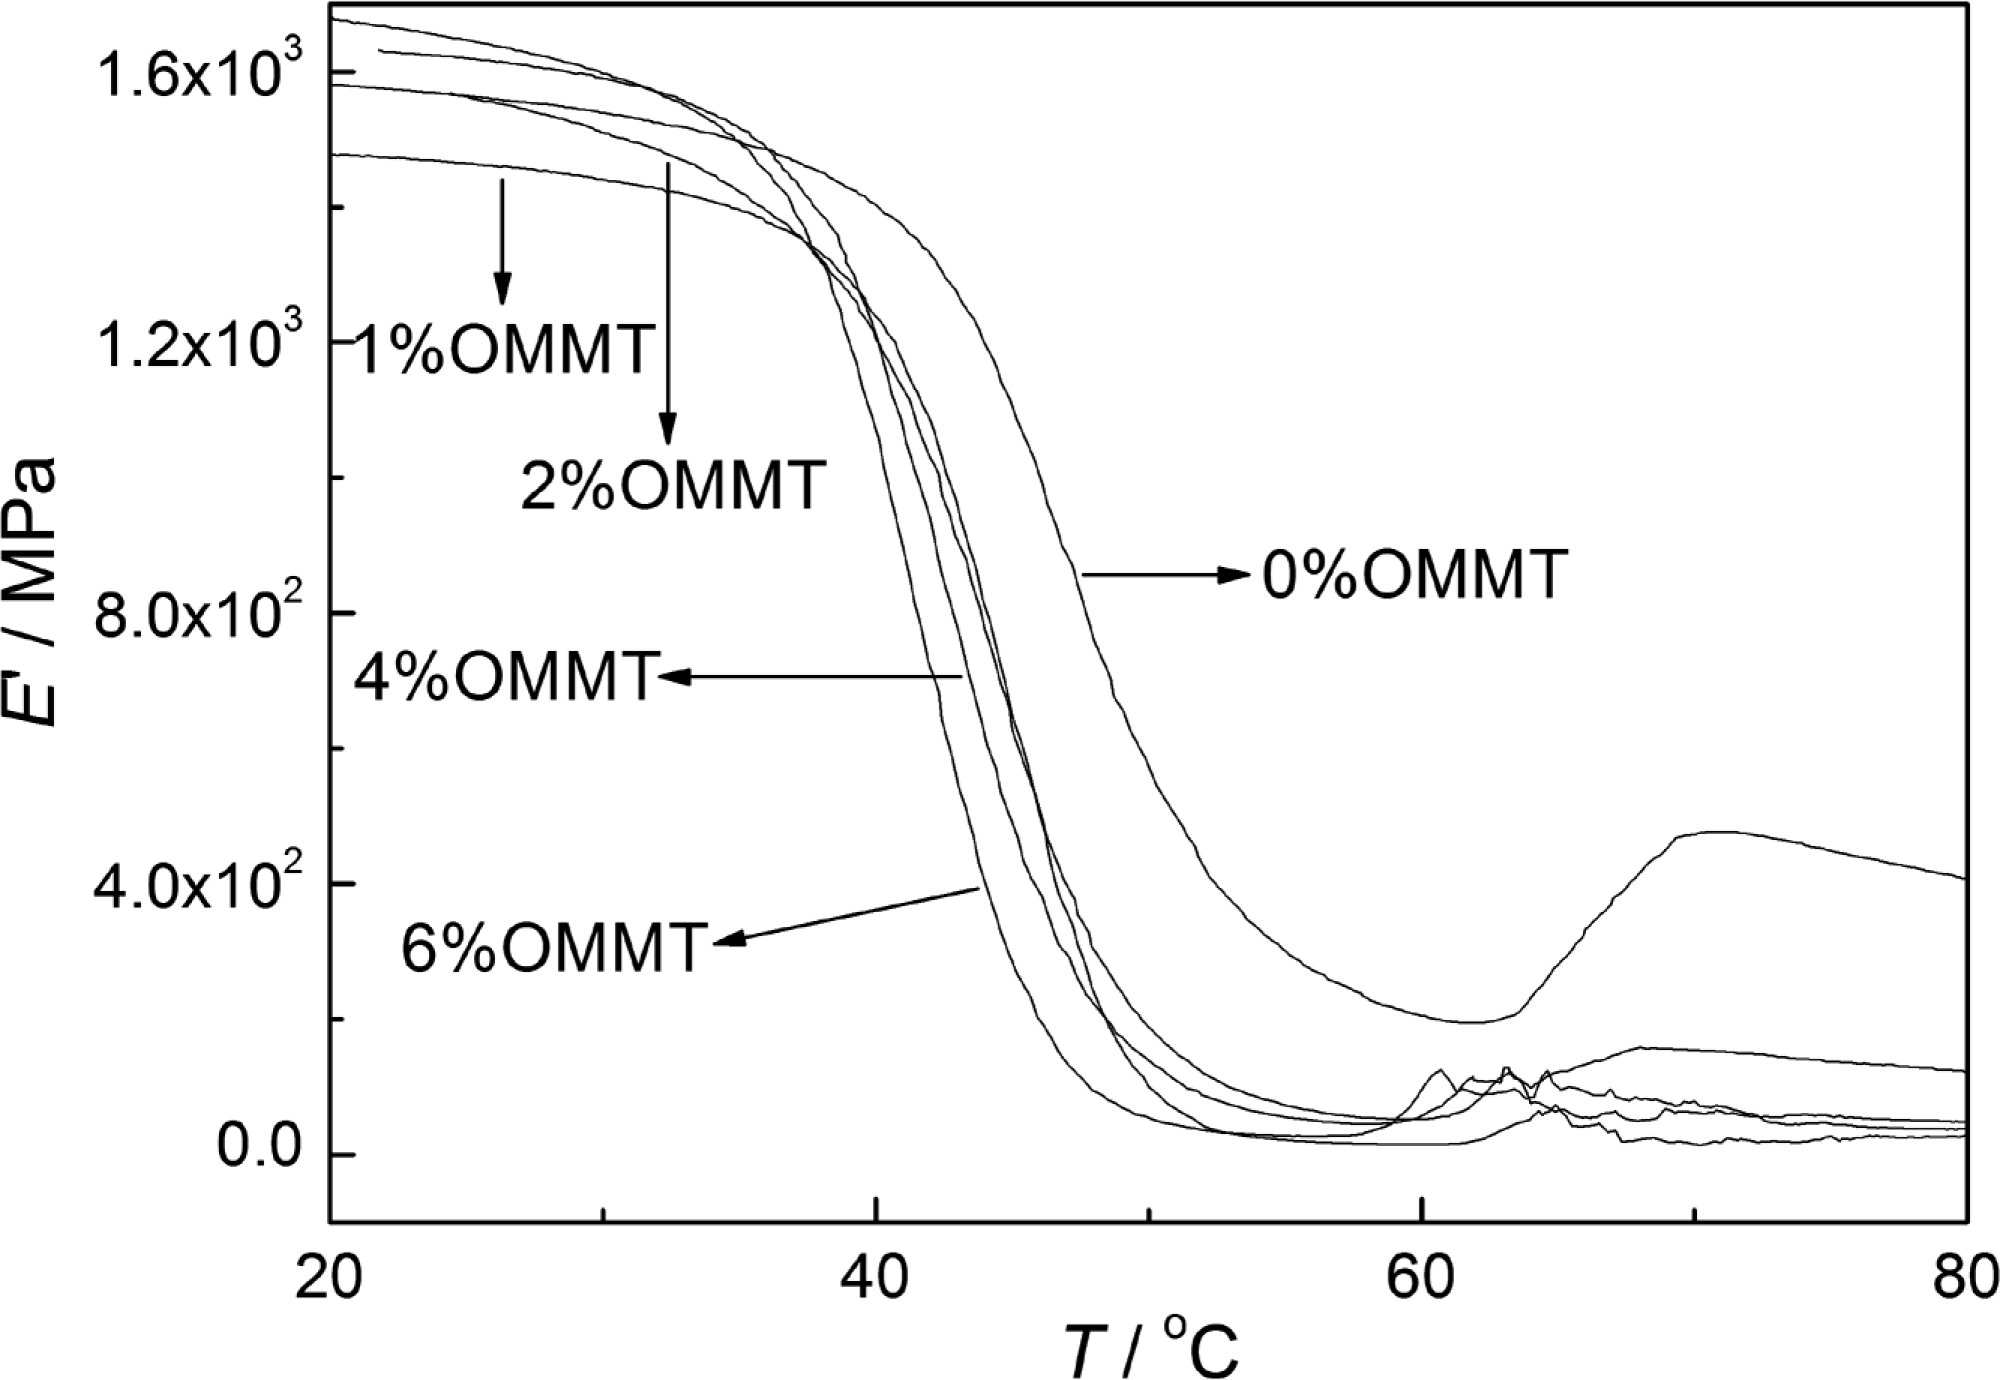
Relationship of E′ versus T of different nanocomposites.
Figure 11 shows the tan δ−T curves of different nanocomposites. For the PTT/POE blend, the glass transition peak of the material is at about 50°C. When the OMMT content is 1%, the glass transition temperature decreases slightly; and when OMMT content is in the range of 2%, the glass transition temperature is drifted to about 40–45°C. This may be due to the TPP on the surface of OMMT in the matrix which plays the role of plasticizer, and it increases the free volume of the material and decreases the glass transition temperature. But when OMMT content is 4% and 6%, the glass transition temperature of the material is higher than that when the OMMT content is 2%, indicating that the OMMT plays the main role in decreasing the move ability of the polymer molecular segments.
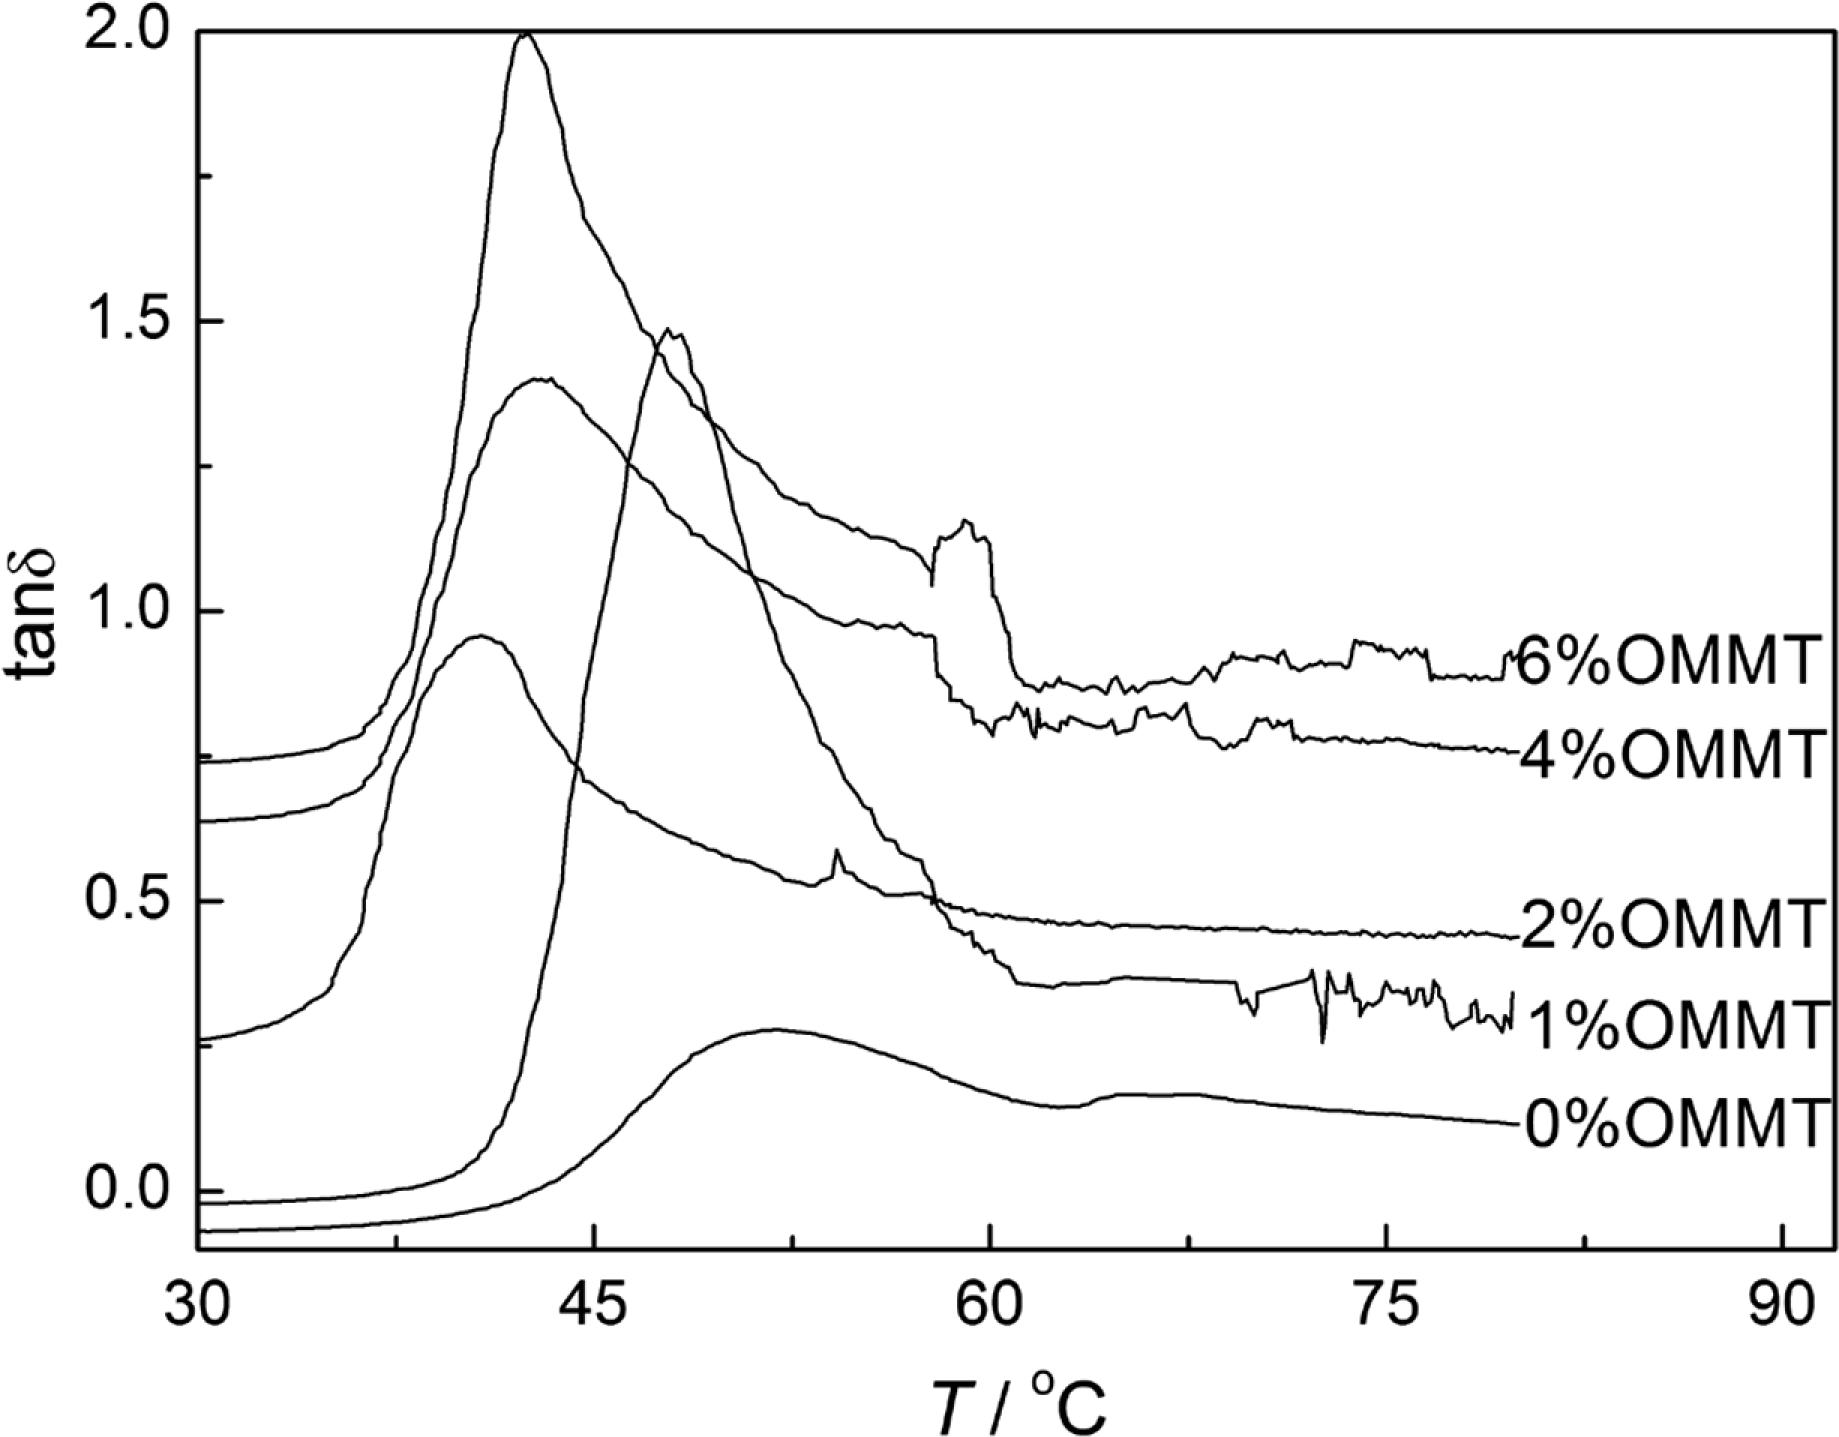
Relationship of tan δ versus Tof different nanocomposites.
Thermal stability
Figure 12 shows the TGA curves of each compound system and the relevant data are listed in Table 2. In Table 2, it is known that when OMMT is added in the system, the initial degradation temperature (T 2%) of the nanocomposite is slightly lower than that of PTT/POE blends, and the maximum weight-loss rate temperature (T max) first decreased and then gradually raised with increasing OMMT content, and it is even higher than that of PTT/POE blends when the OMMT content is 6%. These results suggest that the thermal stability of the nanocomposite is not apparently influenced by OMMT component.
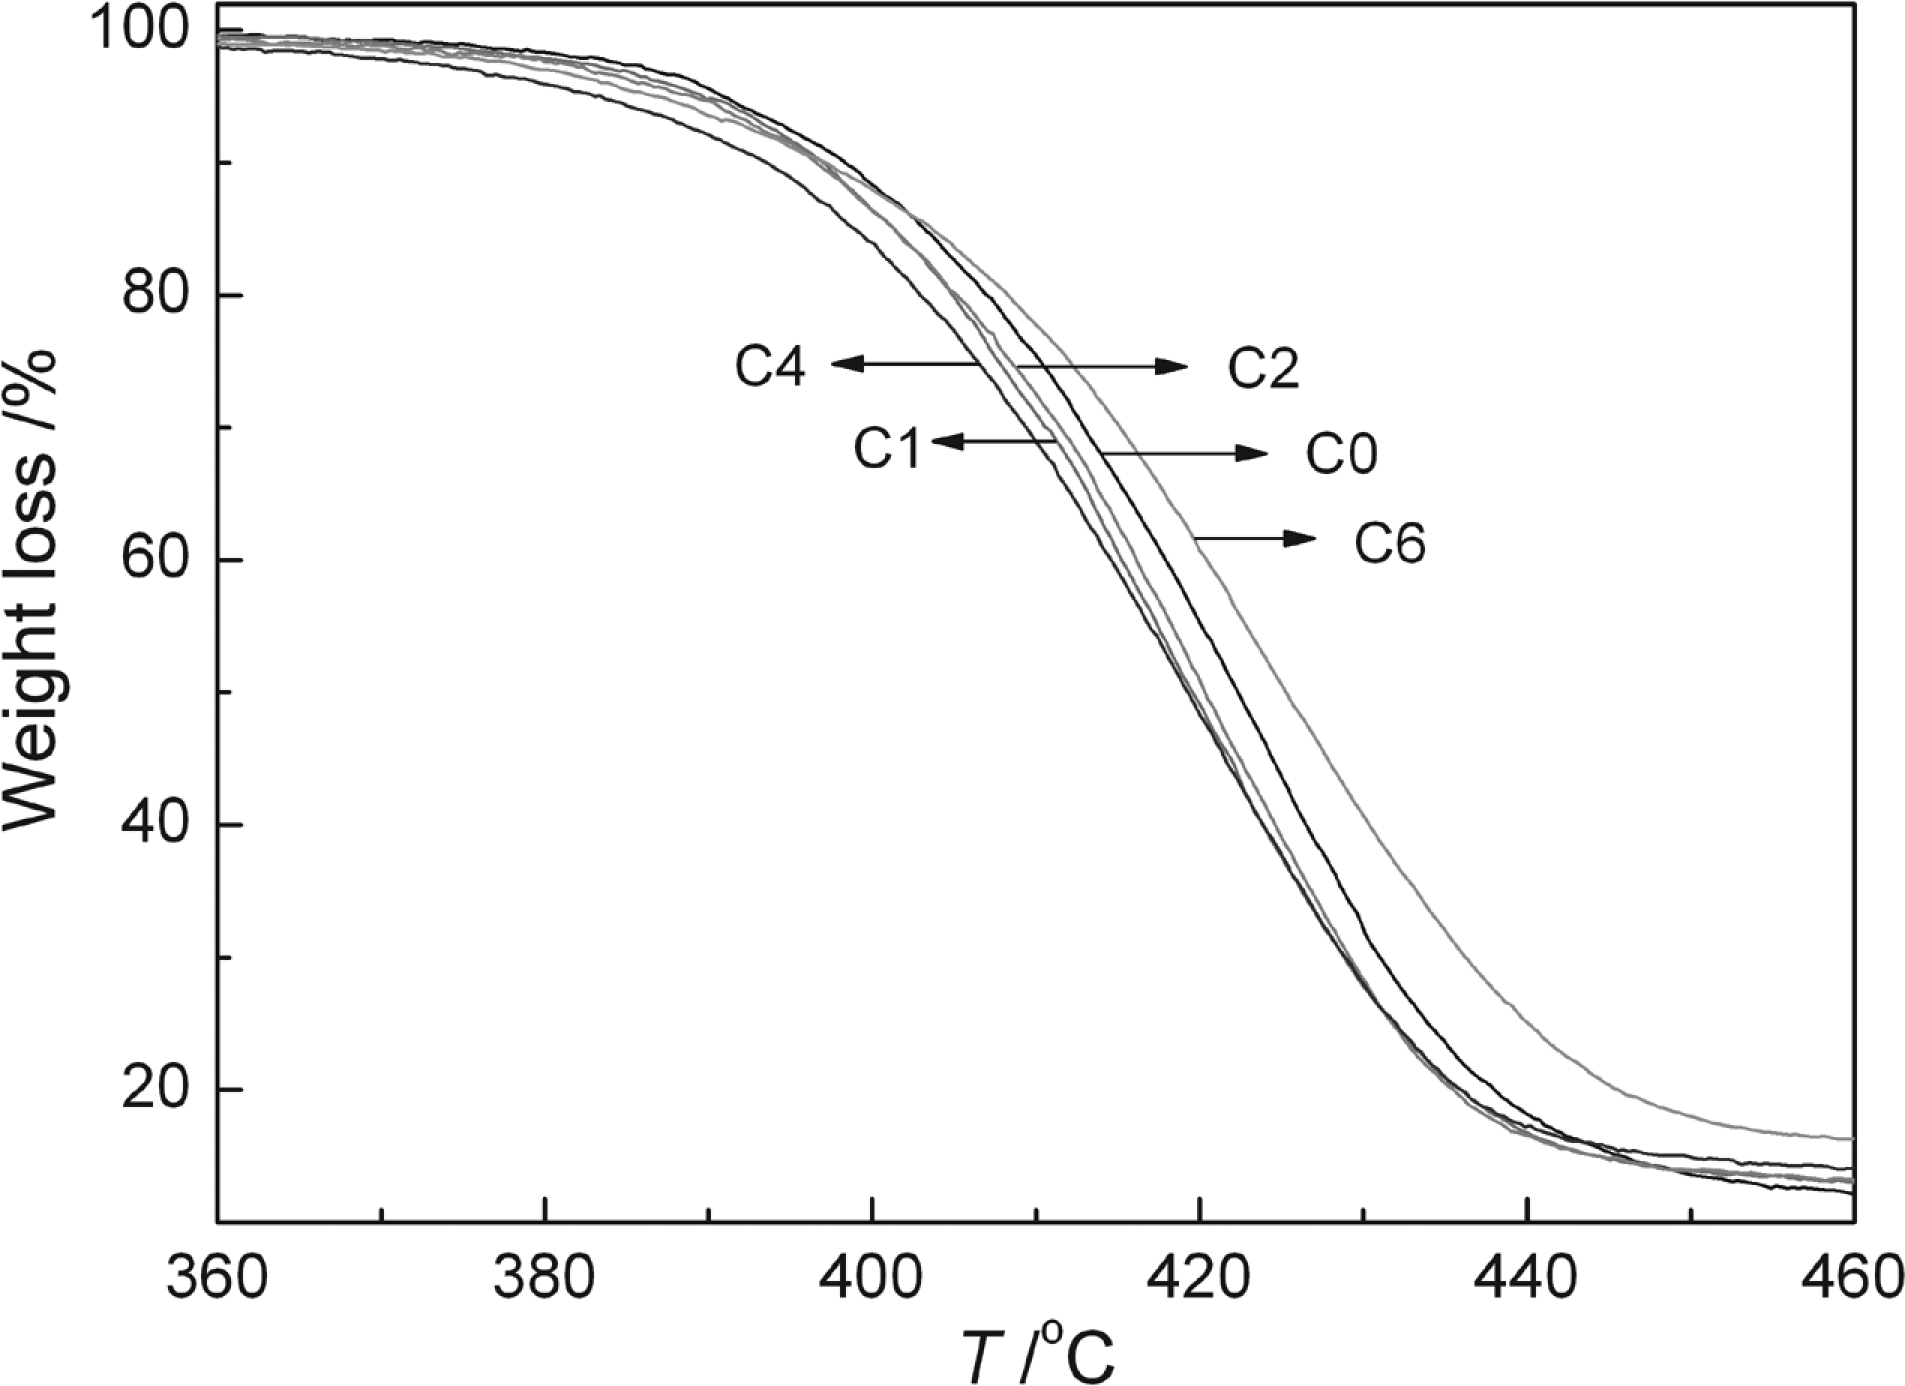
Thermogravimetric analyzer (TGA) curves of PTT/POE/OMMT nanocomposites. OMMT: organomontmorillonite; POE: poly(octene–ethylene); PTT: poly(trimethylene terephthalate).
Parameters of the TGA curves for PTT/POE/OMMT nanocomposites.
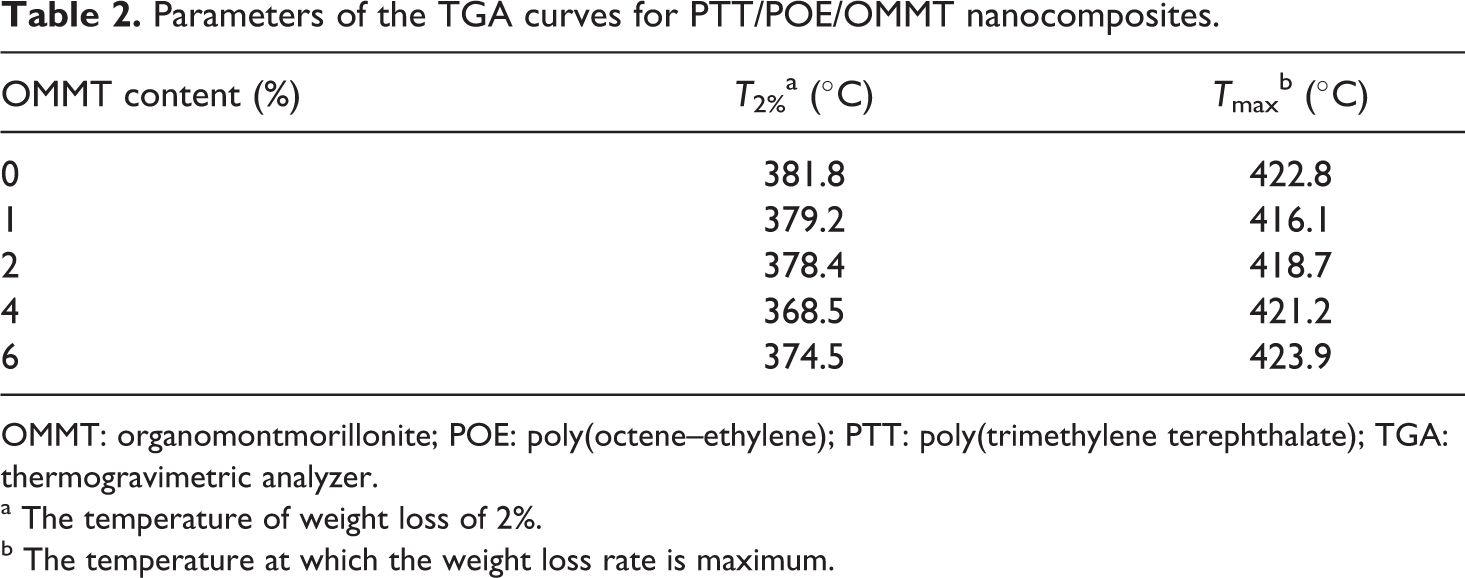
OMMT: organomontmorillonite; POE: poly(octene–ethylene); PTT: poly(trimethylene terephthalate); TGA: thermogravimetric analyzer.
a The temperature of weight loss of 2%.
b The temperature at which the weight loss rate is maximum.
Conclusions
In order to combine the advantages of both OMMT and POE, the nanocomposites of PTT/POE/OMMT were prepared by melt-blended method and their properties were characterized in detail. The results suggest that the nanocomposites have greatly improved processing viscosity, good mechanical and crystallization properties. OMMTs are evenly dispersed in the polymer matrix and some OMMTs have been exfoliated into nanosheet morphology. When OMMT content is 6%, a few of them tend to aggregate. The nanocomposite’s melt is pseudoplastic fluid, especially when the OMMT content is large. The melt viscosity increases with increasing OMMT content, which is favorable for processing PTT material in a wider temperature range. Combining the advantages of OMMT and POE, the nanocomposite with 2 wt% of OMMT and 4 wt% of POE has the maximum tensile and impact strength. Because of the nucleating effect of OMMT in the nanocomposites, PTT can only form microcrystallites or even imperfect crystals. The melt crystallization rate increases with increasing OMMT content. The elastic modulus and the glass transition temperature of the nanocomposites decrease first and then increase with increasing OMMT content.
Footnotes
Funding
This research received the financial support by the Natural Science Foundation of Hebei Province (B2010000219).