
Abstract
This article presents an experimental study on the relationship between surface quality (roughness) and water absorption for wood–plastic composites (WPCs) in an extrusion process. A problem that usually occurs in the production of extruded parts of polymeric materials, and in special case of WPC, is flow instabilities at the extrusion die exit. The instabilities lead to the production of profiles with unacceptable surface quality. In this article, the influences of the important material and process parameters on the surface quality and water absorption are investigated. The attempt was made to find a relationship between surface roughness and water absorption of WPC extruded profiles. The variable parameters were selected as wood content, polymer melt flow index (MFI), screw speed, melt temperature, die diameter, and finally length-to-diameter ratio (L/D) of the die land. The experiments specified that increasing die land L/D, die temperature and wood content and decreasing screw speed and polymer MFI lead to improved surface quality. It was found that increasing die diameter and also decreasing die land L/D, die temperature, speed, wood content, and polymer MFI lead to an improvement in water resistance. The results also showed that a rough surface quality could cause a low water resistance specification.
Introduction
In the past 10 years, wood–plastic composite (WPC) has become a commercial product with a growing market potential in the area of building, construction, automotive, and furniture. 1 WPC materials are made by mixing (compounding) plastic and cellulose fibers with additives (lubricants, coupling agents, pigments, etc.) and manufactured using a high-volume process such as extrusion, compression or injection molding. Plastic, in this context, usually is chosen from industrial thermoplastics such as polyethylene, polypropylene (PP), and polyvinyl chloride. Wood component is typically in the form of milled wood products or particles of waste lumber, bleached cellulose fiber or natural fiber of different grades and origins. 2 –5 The use of cellulosic fibers is beneficial due to their availability, renewability, and adequate strength-to-weight balance. The biodegradability of the natural fibers can contribute to a friendly ecosystem, while their low cost and high performance are able to fulfill the economic interest of industry. Moreover, compared with glass and mineral fillers, the wood fillers are less abrasive to the processing equipment, which make them suitable for high-volume applications, such as decking, fencing, siding, window profile systems, and so on. 6,7 Although adding wood fillers to a polymeric matrix has many benefits, their addition may also result in some disadvantages such as reduction of ductility and poor impact resistance. 8 –10 Another important issue is that adding wood fillers to thermoplastics cause a considerable increase in melt viscosity, which creates some difficulties in process such as flow instabilities, and surface defects. 11,12
The most important process for producing WPC is extrusion. There may exist a high probability of flow instabilities at the die exit in manufacturing WPC profiles, which is exhibited in the form of unsuitable surface quality. 13 The instabilities are also recognized with phenomena such as ‘melt fracture’ and wall slip. The phenomena of melt fracture and wall slip have been studied for the past 50 years but have not yet been fully explained. Not only these phenomena are of academic interest but are also industrially relevant as they may limit the rate of production in processing operations. For example, in a continuous extrusion of a typical linear polyethylene at some specific output rate, the extrudate starts losing its glossy appearance; instead, a matte surface finish is evident and, at slightly higher output rates, small amplitude periodic roughness appear on its surface. This phenomenon is known as ‘sharkskin’ or surface melt fracture. At higher values of the output rate, the flow ceases to be consistent; instead, the pressure oscillates between two limiting values and the extrudate surface alternates between relatively smooth and distorted portions. These phenomena are known as ‘oscillating slip–stick’ or cyclic melt fracture. At even higher values of the output rate, a new instability known as ‘gross melt fracture’ (GMF) occurs. 14 A typical flow curve for a linear polyethylene is shown in Figure 1. In this diagram, the first regime represents a stable flow and the surface of the extrudate is smooth. The second regime denotes the sharkskin instability. The third regime indicates the slip–stick flow characterized by oscillations in the pressure and flow fields and the dramatic transitions in the extrudate. The final regime represents GMF, which is characterized by a chaotic appearance of the extrudate of large-scale amplitude. 15
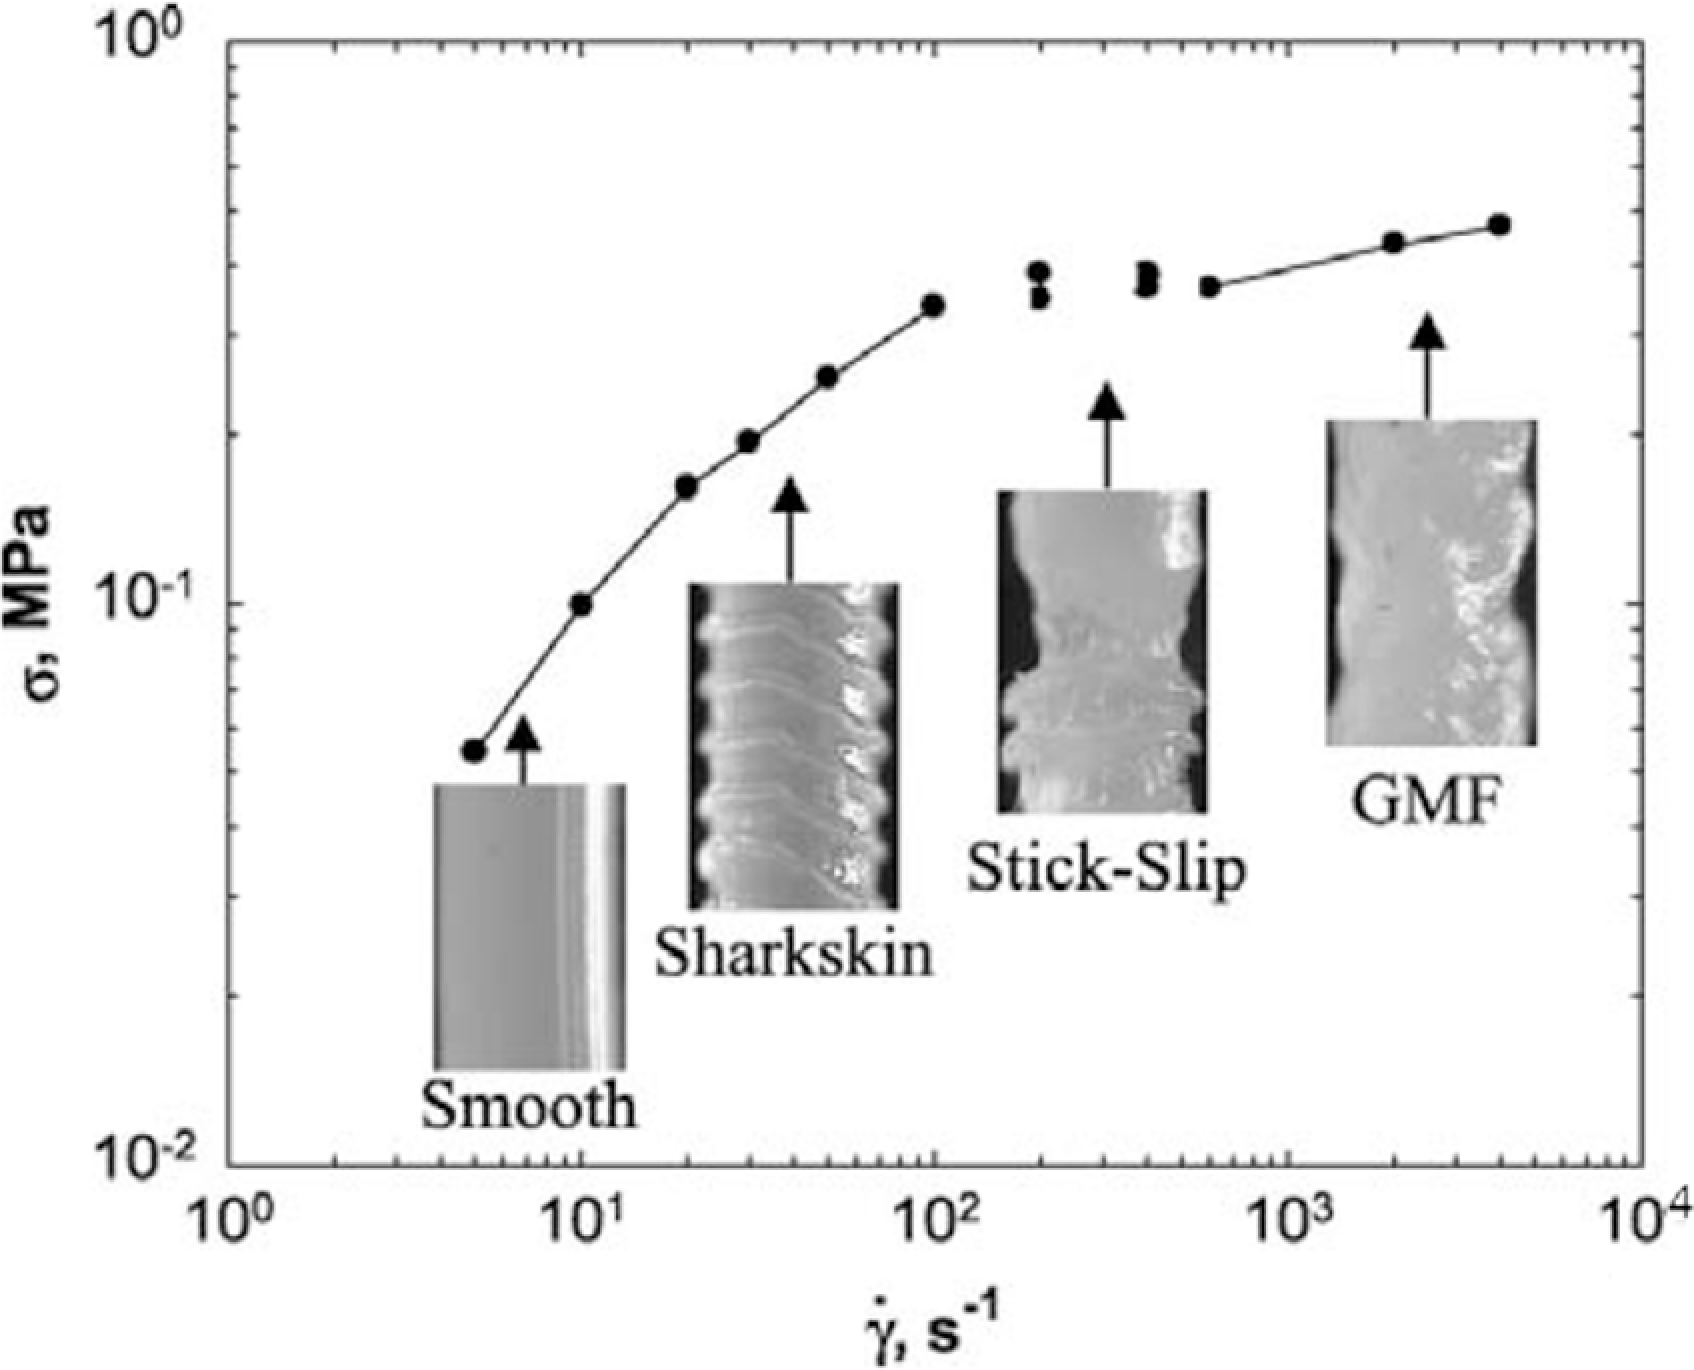
Typical flow curve relating the apparent wall shear stress to the apparent wall shear rate in flow instability. 15
Many research works have been carried out on flow instabilities at the die exit in extrusion process of neat polymers and also on the defects created due to these instabilities. The main focus of the research works can be described as below:
Numerical and analytical simulation of instabilities
Graham 16 used simple models for the fluid elasticity and slip to theoretically and computationally study the nonlinear dynamics of melts in oscillatory shear. Den Doelder et al. 17 compared three model curves in order to model spurt instabilities in polymer melt flows. In another research work, 18 they apply a quantitative model to describe slip phenomena in capillary rheometer experiments of high-density polyethylene (HDPE). Lan et al. 19 used a sliding plate rheometer, incorporating a shear stress transducer to study slip in both steady and unsteady flows. Ngamaramvaranggul and Webster 20 sought steady solutions for free boundary problems involving combinations of die-swell and stick–slip conditions and also investigated flows with and without drag flow. Taliadorou et al. 21 performed a two-dimensional numerical study on the stick–slip extrusion instability and studied the effects of the reservoir volume, the imposed flow rate, and the capillary length on the amplitude and the frequency of the pressure.
Molecular discussions and explanations of instabilities
Munstedt et al. 22 investigated the flow behavior of two polyethylene samples; a linear and a long-chain branched in a slit die using laser Doppler velocimetry in order to explore the influence of branching on stick and slip phenomena. Santamaria et al. 23 investigated the effect of temperature on extrusion rheometry of some polyethylene samples with various molecular weights and chain branching degrees. Tchesnokov et al. 24 described the dynamics of polymer molecules grafted on a solid wall using a new quantitative model based on the bond vector probability distribution function, which contains the necessary information about the spatial conformations of the grafted chains.
Displaying instabilities by the aid of visualization methods
Inn et al. 25 studied the sharkskin melt fracture phenomena of polybutadiene using a video camera with close-up lenses focused at the die exit and observed the development of sharkskin in profile. Also in another research work, 26 they tried to observe any relevant periodic changes inside the die land during the sharkskin condition. They used particle tracking and time-resolved birefringence and two-dimensional light scattering in conjunction with a slit die attached to an extruder and a tubular glass die attached to a pressurized reservoir. Robert et al. 27 studied the flow behavior of two molten linear HDPE carefully using a single screw extruder equipped with a transparent slit die. In another research work, 28 they used the same equipments and materials in order to investigate and visualize the oscillating flow instabilities.
Materials and process effects
Hatzikiriakos and Dealy 29 performed some experiments in a sliding plate rheometer with a high-density polyethylene to determine the conditions for the onset of slip and the relationship between slip velocity and shear stress. El Kissi et al. 30 performed a birefringence experiment in order to determine the stress field in the outflow section. They found that it is possible to significantly delay or eliminate the appearance of sharkskin by considering the polymer flow through fluorinated extrusion dies. Wang and Drda 31 studied some polymer melt rheological phenomena including flow instabilities, stick–slip transitions, interfacial melt/wall slip, gross extrudate distortion, and sharkskin-like surface roughening of extrudates in some grades of polyethylene and polystyrene. Pruvost et al. 32 applied capillary rheometry to a number of starch pastes with a range of water contents. Over a range of shear rates, they found that water content value could change flow from slip to stick conditions. Hong et al. 33 used hyperbranched polymers as a processing aid for linear low-density polyethylene and evaluated the processability, the surface appearance, and the rheological properties of the blends. Kay et al. 34 studied the stick–slip phenomenon for two linear polyethylenes. Their results clearly confirmed the hypothesis that the flow jumps from one stable branch to the other during oscillations. Kalyon and Gevgilili 35 investigated flow behaviors of three polymers, a HDPE, a polydimethylsiloxane, and an oxetane-based alternating block thermoplastic elastomer, which were subjected to steady torsional and capillary flows. Meulenbroek et al. 36 studied melt fracture instabilities in extrusion of polymers in a cylindrical tube and a slit die. Also they presented the results of a nonlinear analysis of viscoelastic Poiseuille flow. Sentmanat and Hatzikiriakos 37 elucidated the mechanism by which the addition of a small amount of boron nitride into a polyethylene eliminates GMF and also found that the presence of boron nitride decreases the extensional viscosity of polyethylenes. Azhdar et al. 38 studied dynamic friction, sliding friction, and the stick–slip phenomenon on compacted polymer powders during high-velocity compaction.
Instabilities in composites
Haworth and Khan 39 determined slip velocities of unfilled and talc-filled PP compounds, detectable at the die wall during pressure-driven shear flow, using capillary rheometry. Roy et al. 40 studied the effect of filler addition and temperature on the stick–slip transition in a filled high-density polyethylene melt. They changed filler content and measured stick–slip transition shear stresses.
A few patents 41 –44 have been published to claim methods to reduce instabilities at the die exit via changes in the die shape. It should be mentioned that in the majority of research works, the studied material was selected from polyethylene family, while flow instabilities of other polymers have been rarely investigated. As WPC is a relatively new material, there are few studies reported on their flow instabilities.
Hristov et al. 11 investigated sharkskin phenomenon in extruded profiles made of polyethylene with a high wood content and showed its relationships with rheological characteristics and slip phenomenon in capillary dies and rotational rheometer. Later, Hristov and John Vlachopoulos 45 studied the possibility of using thermoplastic silicone elastomer lubricant in extrusion of metallocene PP wood flour composites in order to decrease the surface defects. These researchers 46 scrutinized the effect of change in variables of wood contents, melt flow speed, and capillary die diameter on surface quality of WPC product. In another research, 47 they investigated the effect of polymer molecular weight and the size of wood particles on the flowability of WPC using rotational and capillary rheometers. In these researches, they used capillary dies with small diameters of 1, 1.5, and 2 mm and maximum die length of 32 mm.
The issue of flow instabilities at the die exit often causes restriction in choosing process parameters such as speed, material type, temperature, and so on. Two criteria are important for evaluating a sound production process: (i) quality of parts and (ii) production rate. If these two factors can be in anyway enhanced simultaneously, it is considered as the most desirable condition of production. The advantage of conducting a research on this phenomenon is that the process parameters can be predicted, thus avoiding the trial and error process .Hence, it is required to perform a wide range of research works on the influencing parameters of a next-to-final shape WPC extrusion to attain this goal.
It is understood from previous research works that the processing WPC is not the same as the neat polymer; for example, Hristov and coworkers 11 showed that increasing the shear rate in capillary rheometer for neat polyethylene caused sharkskin followed by GMF. But, with WPC, it caused an improvement in surface quality of the exit flow. Furthermore, the equations that are useful for theoretical modeling of neat polymer instability behavior are not necessarily applicable for modeling of WPC. 11,48
The goal of this article is to experimentally investigate the surface defects of extruded WPC profiles with a relatively larger dimension (diameter) and to inspect the effects of material and processing parameters on surface quality (roughness) and water absorption specifications of produced parts. The chosen die diameters in this research work are 10, 20, and 30 mm and the maximum die land length is 300 mm, which are much larger than the dimensions studied in the previous works and are thus comparable with the industrial extrusion dies.
Experimental
Materials
Polymers:
The main polymers for producing WPC are PP and high-density polyethylene (HDPE). In this research work, these two types of commercial polymer were selected, and furthermore, for inspecting the role of melt flow index (MFI), two grades of PP were chosen. The characteristics of the experimental materials are listed in Table 1.
Characteristics of the experimental polymers used as the matrix.
MFI: melt flow index; PP: polyethylene; HDPE: high-density polyethylene.
Wood:
Wood flours were prepared of Russian fir trees supplied by the local sources and were sieved to obtain particle sizes below 841 μm (mesh size <20). The particle size distribution of the wood flour was measured via seven standard meshing sieves. The standard numbers of these sieves are 20, 30, 40, 50, 60, 80, and 100. By measuring the weight ratio at each level and by converting the standard mesh numbers to mesh sizes in micron, the final size distribution is obtained, which is given in Figure 2. Each column in this diagram shows the weight fraction (in percentage) of each mesh size. Wood flour was dried in a hopper drier at 85°C for 24 hours prior to processing to minimize moisture content and to avoid porous structure which may result in a low-strength product. 2
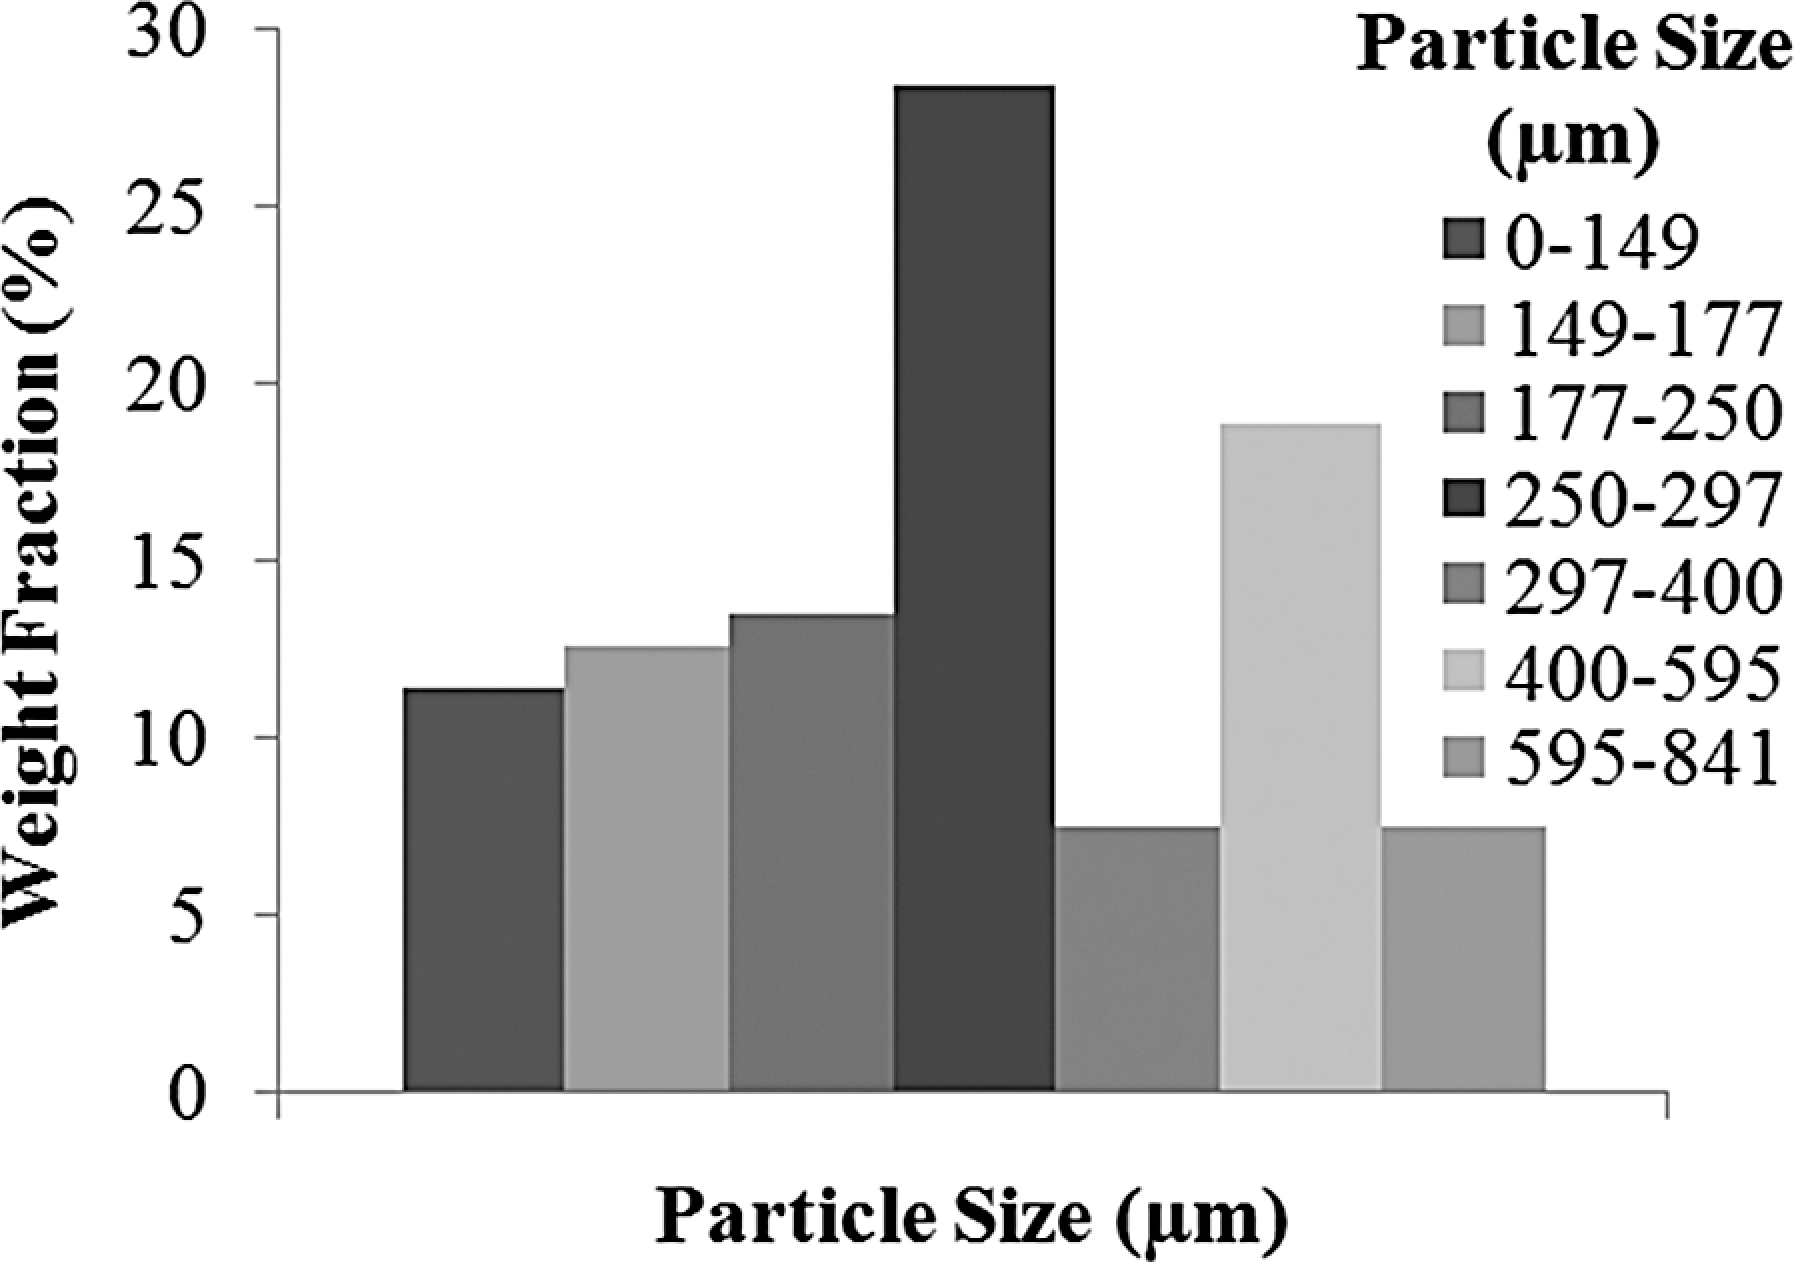
Wood flour particle size distribution.
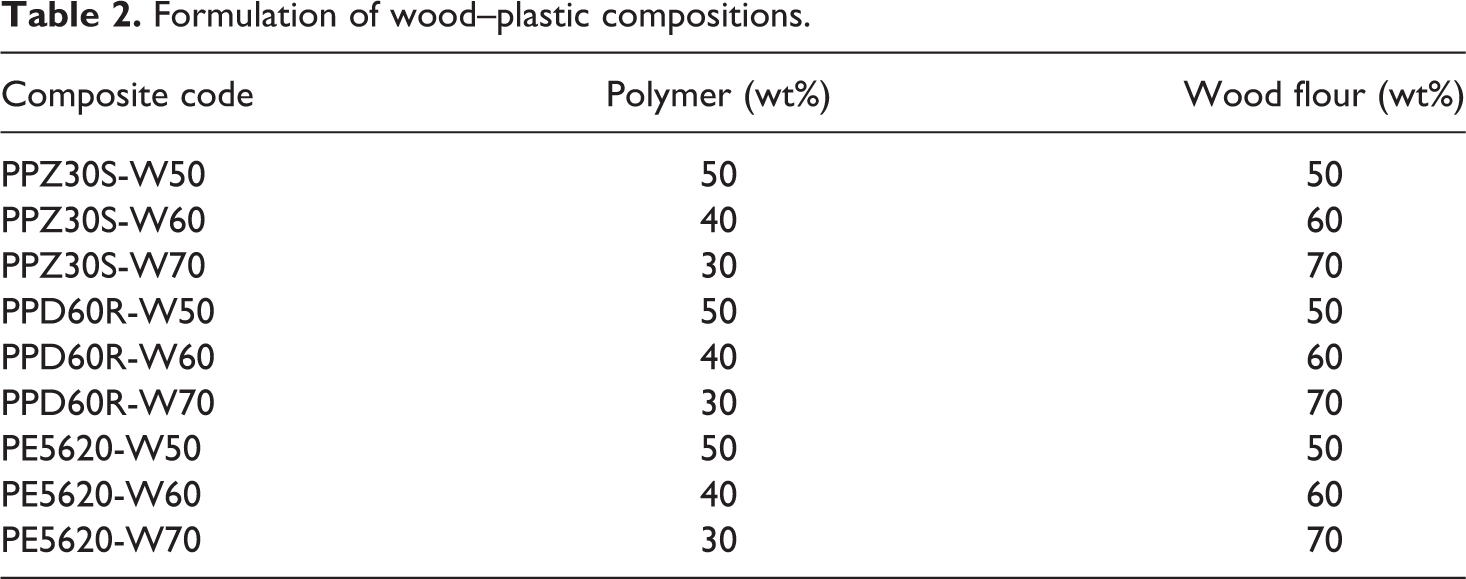
The composite formulations used in the experiments are given in Table 2. In order to achieve an accurate composition, two feeders were employed, one for polymer and another one for wood flour.
Formulation of wood–plastic compositions.
Equipment
Extruder:
To produce WPC profiles, a laboratory made counterrotating twin screw extruder was utilized with a screw diameter of 62.5 mm and an L/D ratio of 22.4. This extruder was specially designed and manufactured for WPC production, considering an enhanced mixing and appropriate pressure at the entrance of die. The barrel consists of four heating zones and also a vent to exhaust the excessive water vapor and other gasses that may be produced during process and also via burning of the wood component.
Dies:
Six circular extrusion dies were designed and fabricated to investigate the effect of die dimensions on the quality of final produced profiles. The two principle parameters were selected die: diameter (D) and die land length-to-diameter ratio (L/D). Figure 3 and Table 3 illustrate the dimensional characteristics of these dies. These two parameters are the two important geometrical parameters of an extrusion die that are investigated in the literatures. Varying geometrical parameters of dies can affect melt flow behavior in a die and also the surface quality of extruded profiles. Band heaters were used to heat the dies.
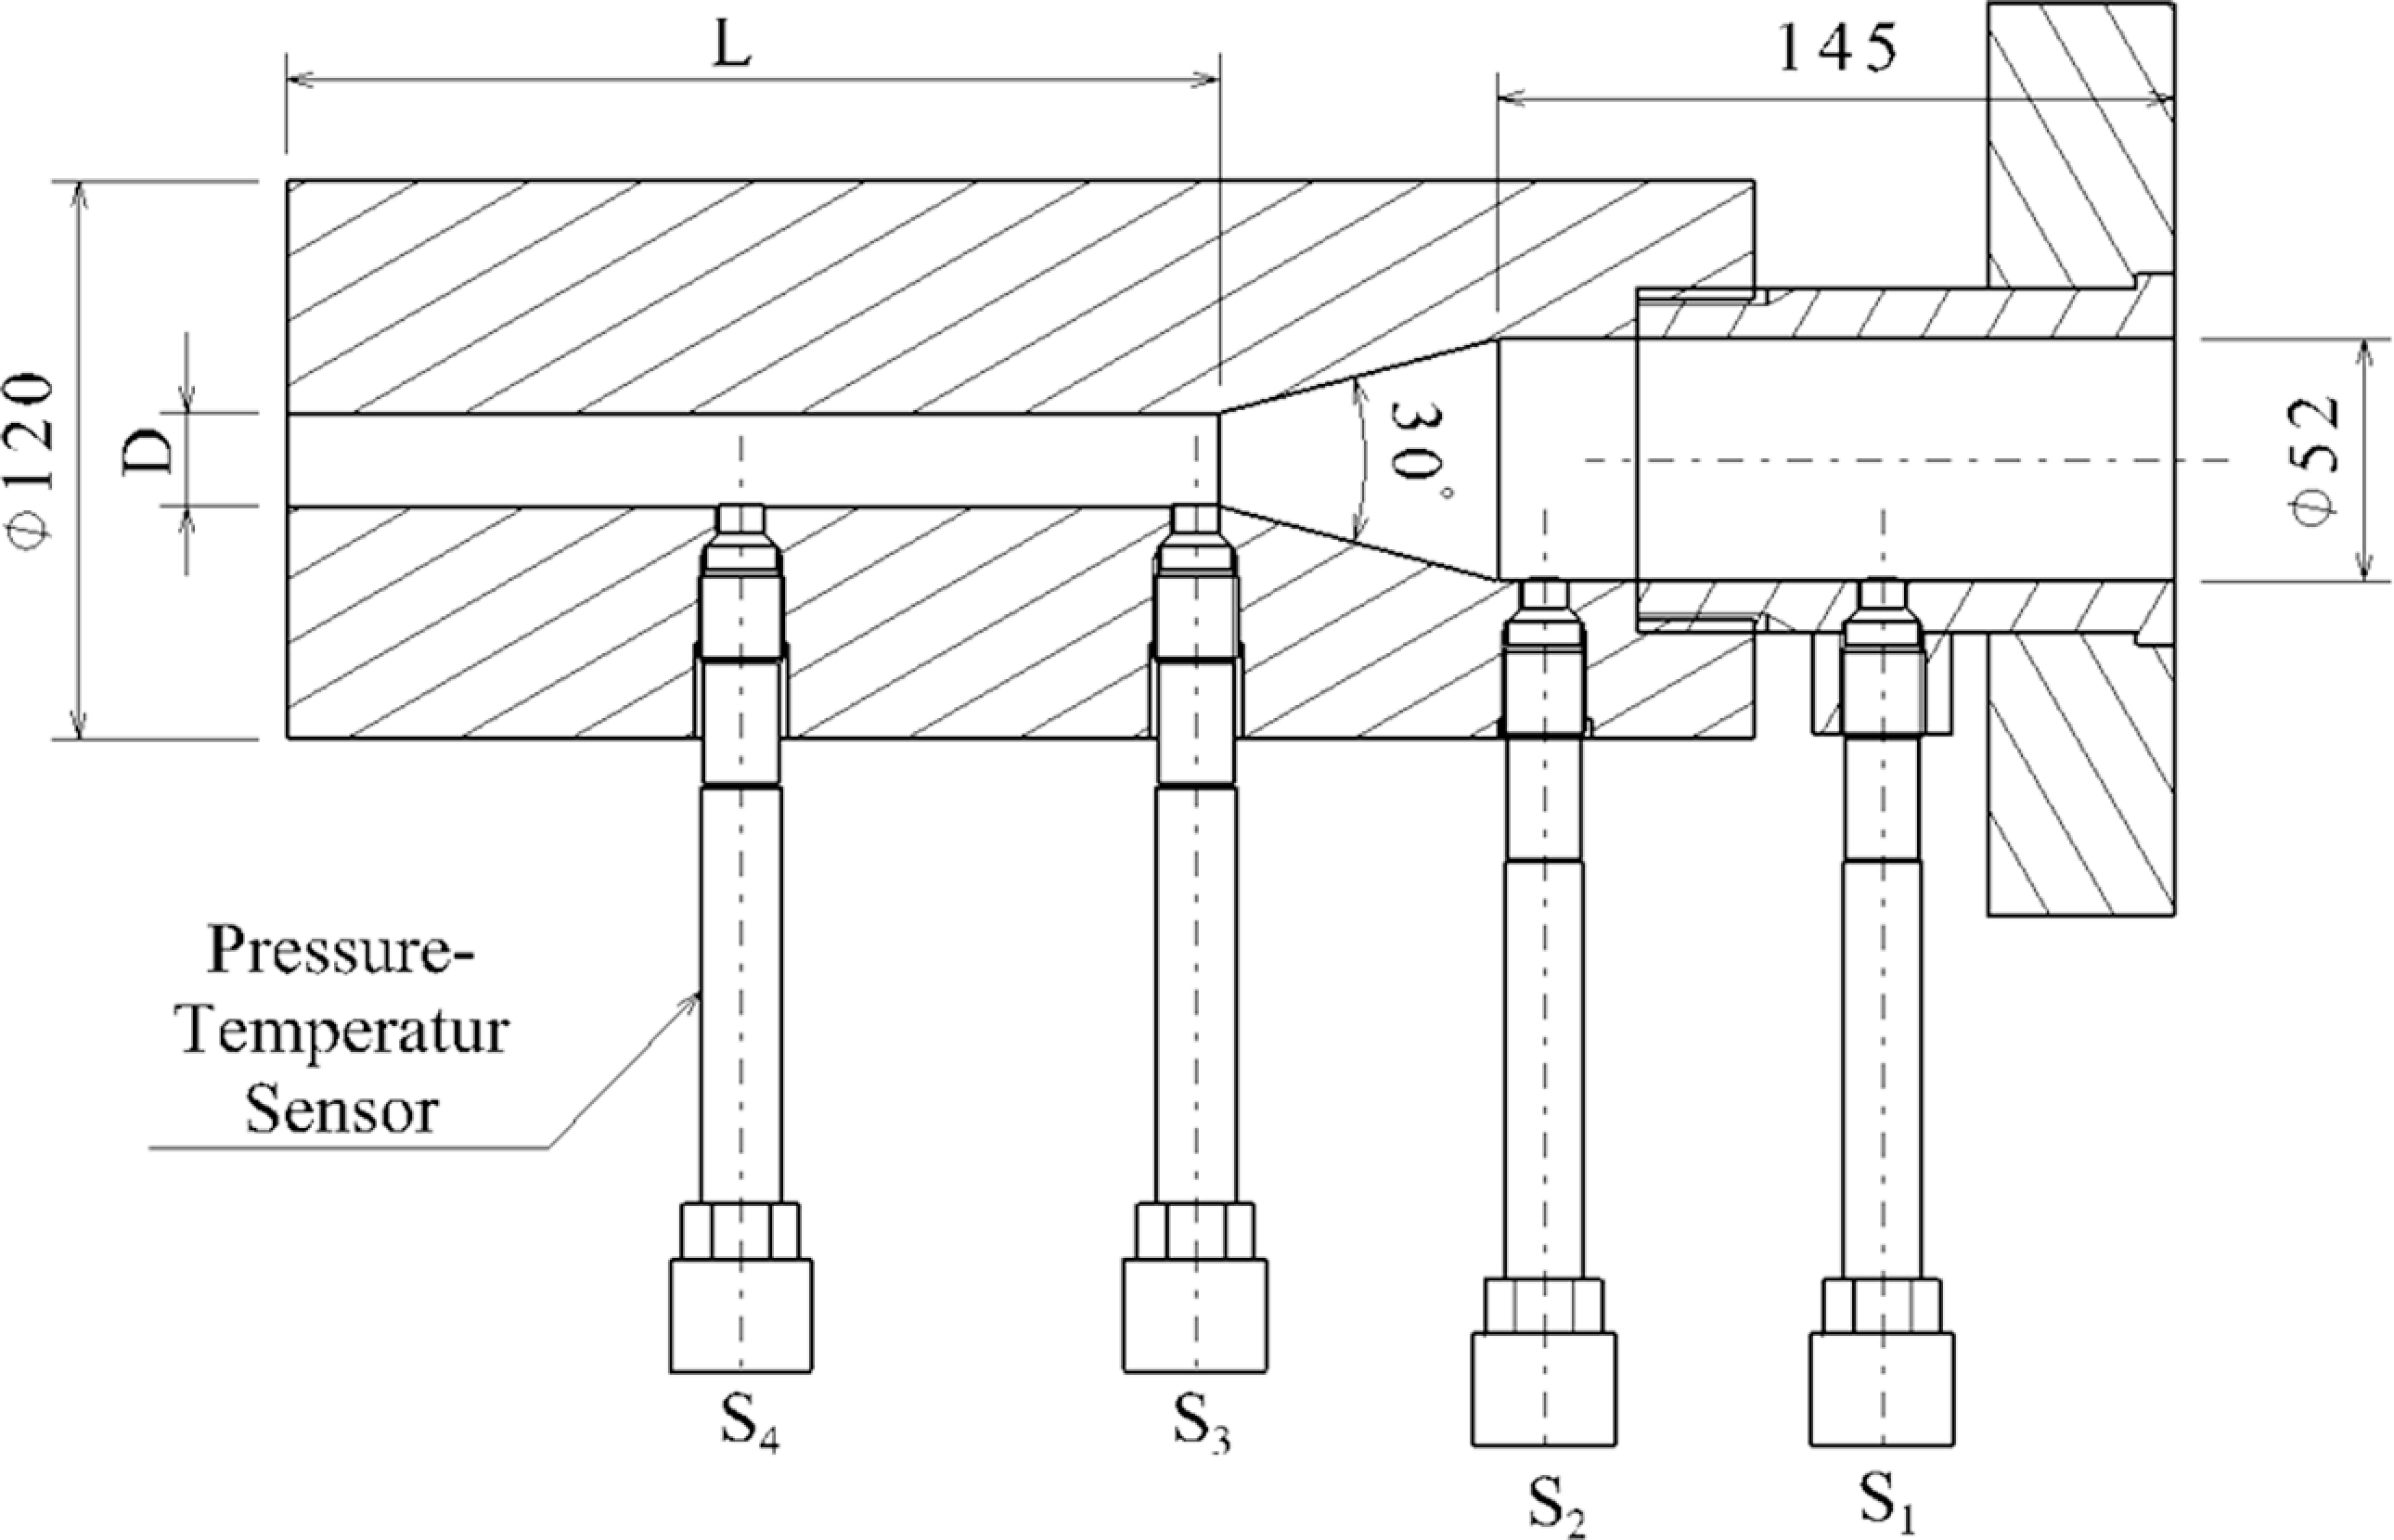
Detailed design of the extrusion die and the sensors locations (dimensions in mm).
Variable dimensions of extrusion dies.
Sensors:
As shown in Figure 3, the temperatures and pressures were simultaneously measured at the four locations. The pressure sensors were piezoelectric type, purchased from Sand Company (Cheng Du, China), Model PT131, which can be connected to a PC using RS232 serial port. The pressure and temperature data could be displayed and saved online in PC.
Surface roughness measurement
In order to compare the surface quality of the produced parts, a surface quality indicator, Model SurfScan 200, was utilized to measure the surface roughness with a resolution of 0.1 μm. This instrument has a capability of showing the surface quality based on some standard gauges; but in this case, the two popular gauges Schematics of measuring 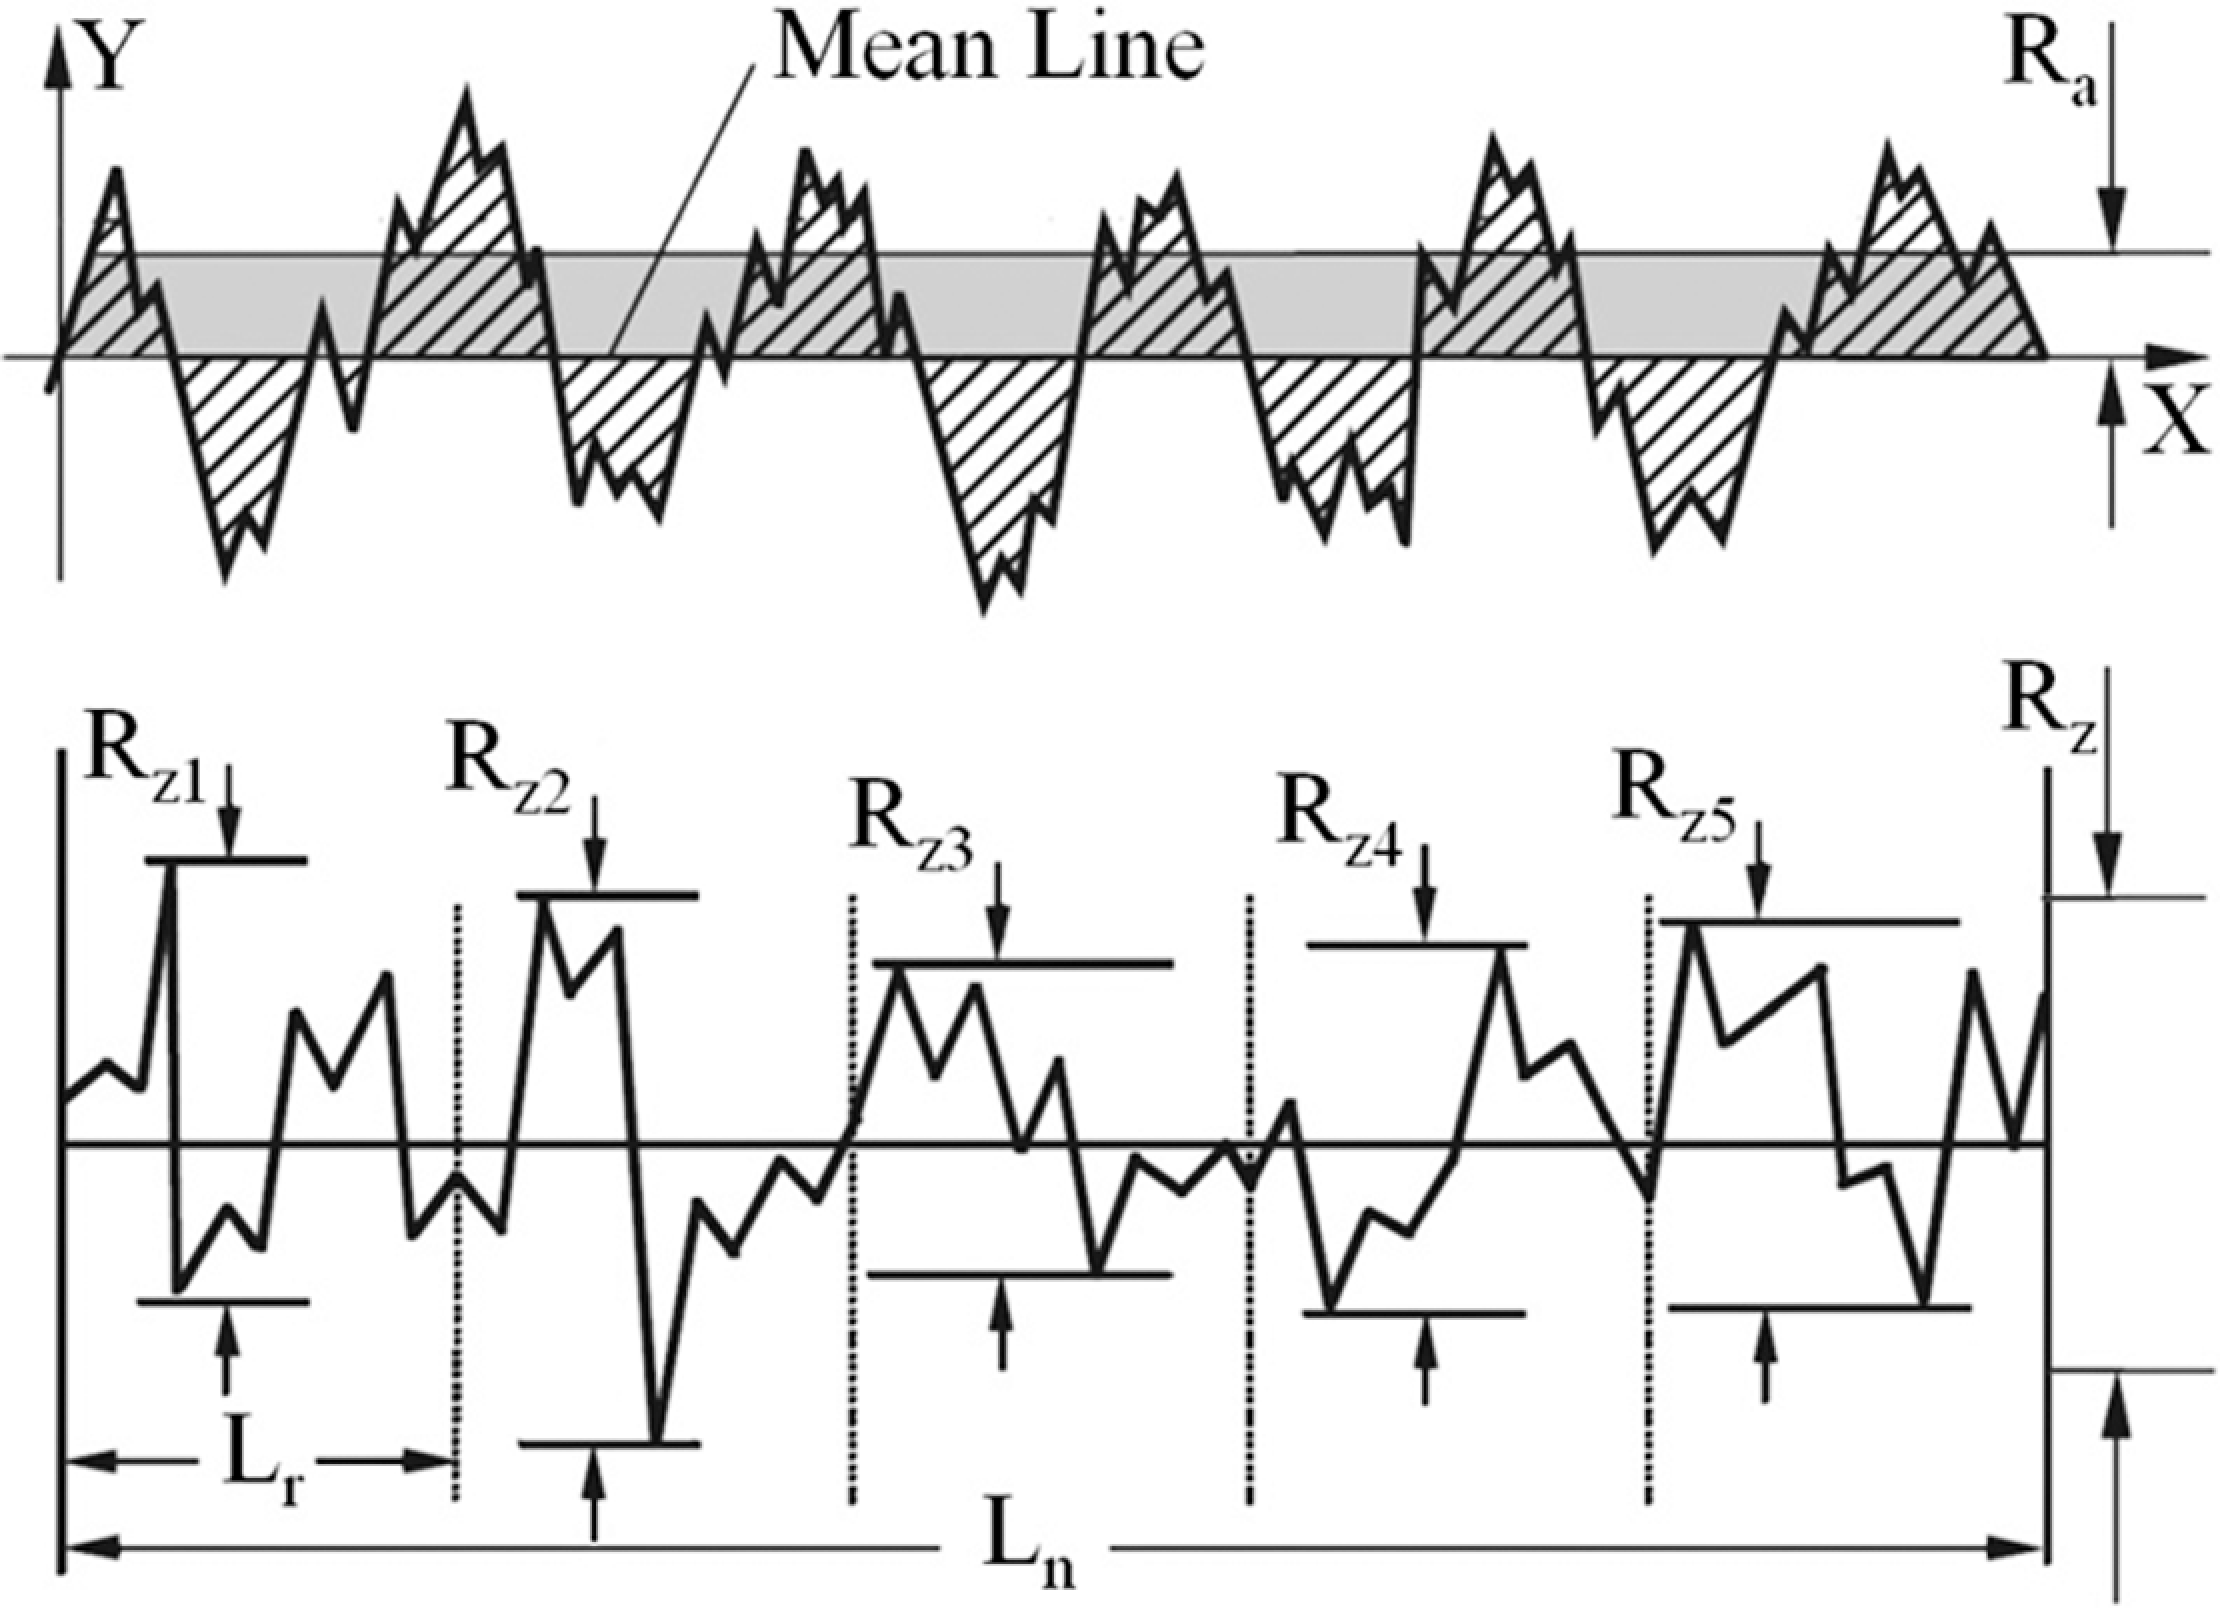

where 
In this equation,
In some cases, the surface quality was too rough to be indicated by this instrument because it could exceed the probe range. In order to resolve this issue, a high-resolution digital camera was utilized to capture the photo of the samples, and thereafter, through image processing and using the corresponding equations for
Water absorption
One of the properties that may be affected by a poor surface quality is water absorption; hence, a series of tests were designed and conducted to measure the water absorption of the extruded surfaces. For this purpose, three cuts of extruded profiles of 50 mm length, from each experiment, were selected. In order to eliminate the effect of end surfaces on the water absorption, the two surfaces of the cut profiles were painted using a waterproof paint. Then, the samples were weighed using a scale model FWE FEJ-200 with 0.01 g resolution and then soaked in water. Weight measurements were carried out in time intervals of 1 day, 1 week, and 3 weeks. At the end of each period, the specimens were removed from water and the excess water was wiped off the surface using a dry cloth and weighted immediately. The report includes the percentage of water absorbed based on the test method ASTM D570 as long-term immersion. 50
Design of experiments
In order to study the effects of material and process variables on the surface quality of extruded profiles, two separated series of experiments were designed: one for wood-PP and another one for wood-HDPE composites. For the case of wood-PP composites, there were six variables selected in the experiments: wood content, polymer MFI, screw speed, melt temperature, die diameter, and L/D of the die land. For the case of HDPE, one grade of polymer was selected, and thus, there were five variables in the experiments. The fully covering method in designing experiment is full factorial; because it can cover all possibilities that can occur. Considering the levels of each parameter, 216 experiments were designed for wood-PP composites and 108 experiments for HDPE. Table 4 shows the details of the design of experiments for each material. It should be mentioned that the limits of the processing parameters were selected by carrying some preliminary experiments. For example, in selecting the proper temperature, it appeared that above a certain temperature, WPC burns, and below a certain temperature, the pressure becomes too high to carry out the process. In case of screw speed, above a certain speed, the throughput control becomes very difficult, which then results in a very poor surface quality and GMF. A very low speed was not economically viable, on the other hand.
Details of experimental design.
MFI: melt flow index; PP: polyethylene; HDPE: high-density polyethylene.
Results and discussion
Figures 5 and 6 show examples of the extruded profiles with various surface qualities for both wood-PP and wood-HDPE composites, respectively. The photos listed at left side exhibit the best surface qualities, the photos at the middle column reveal a medium quality, and finally the right column photos indicate the worst. Due to extensive data obtained in this experimental work, only some important output values are listed in Table 5. As it is shown, the surface quality values are vast and the mean values of the variables are also high. This variety denotes that only at some limited conditions, a sound surface quality can be achieved. In order to specify the effect of each parameter on quantities 
where D is the die diameter in millimeter, F is the die land length-to-diameter ratio (
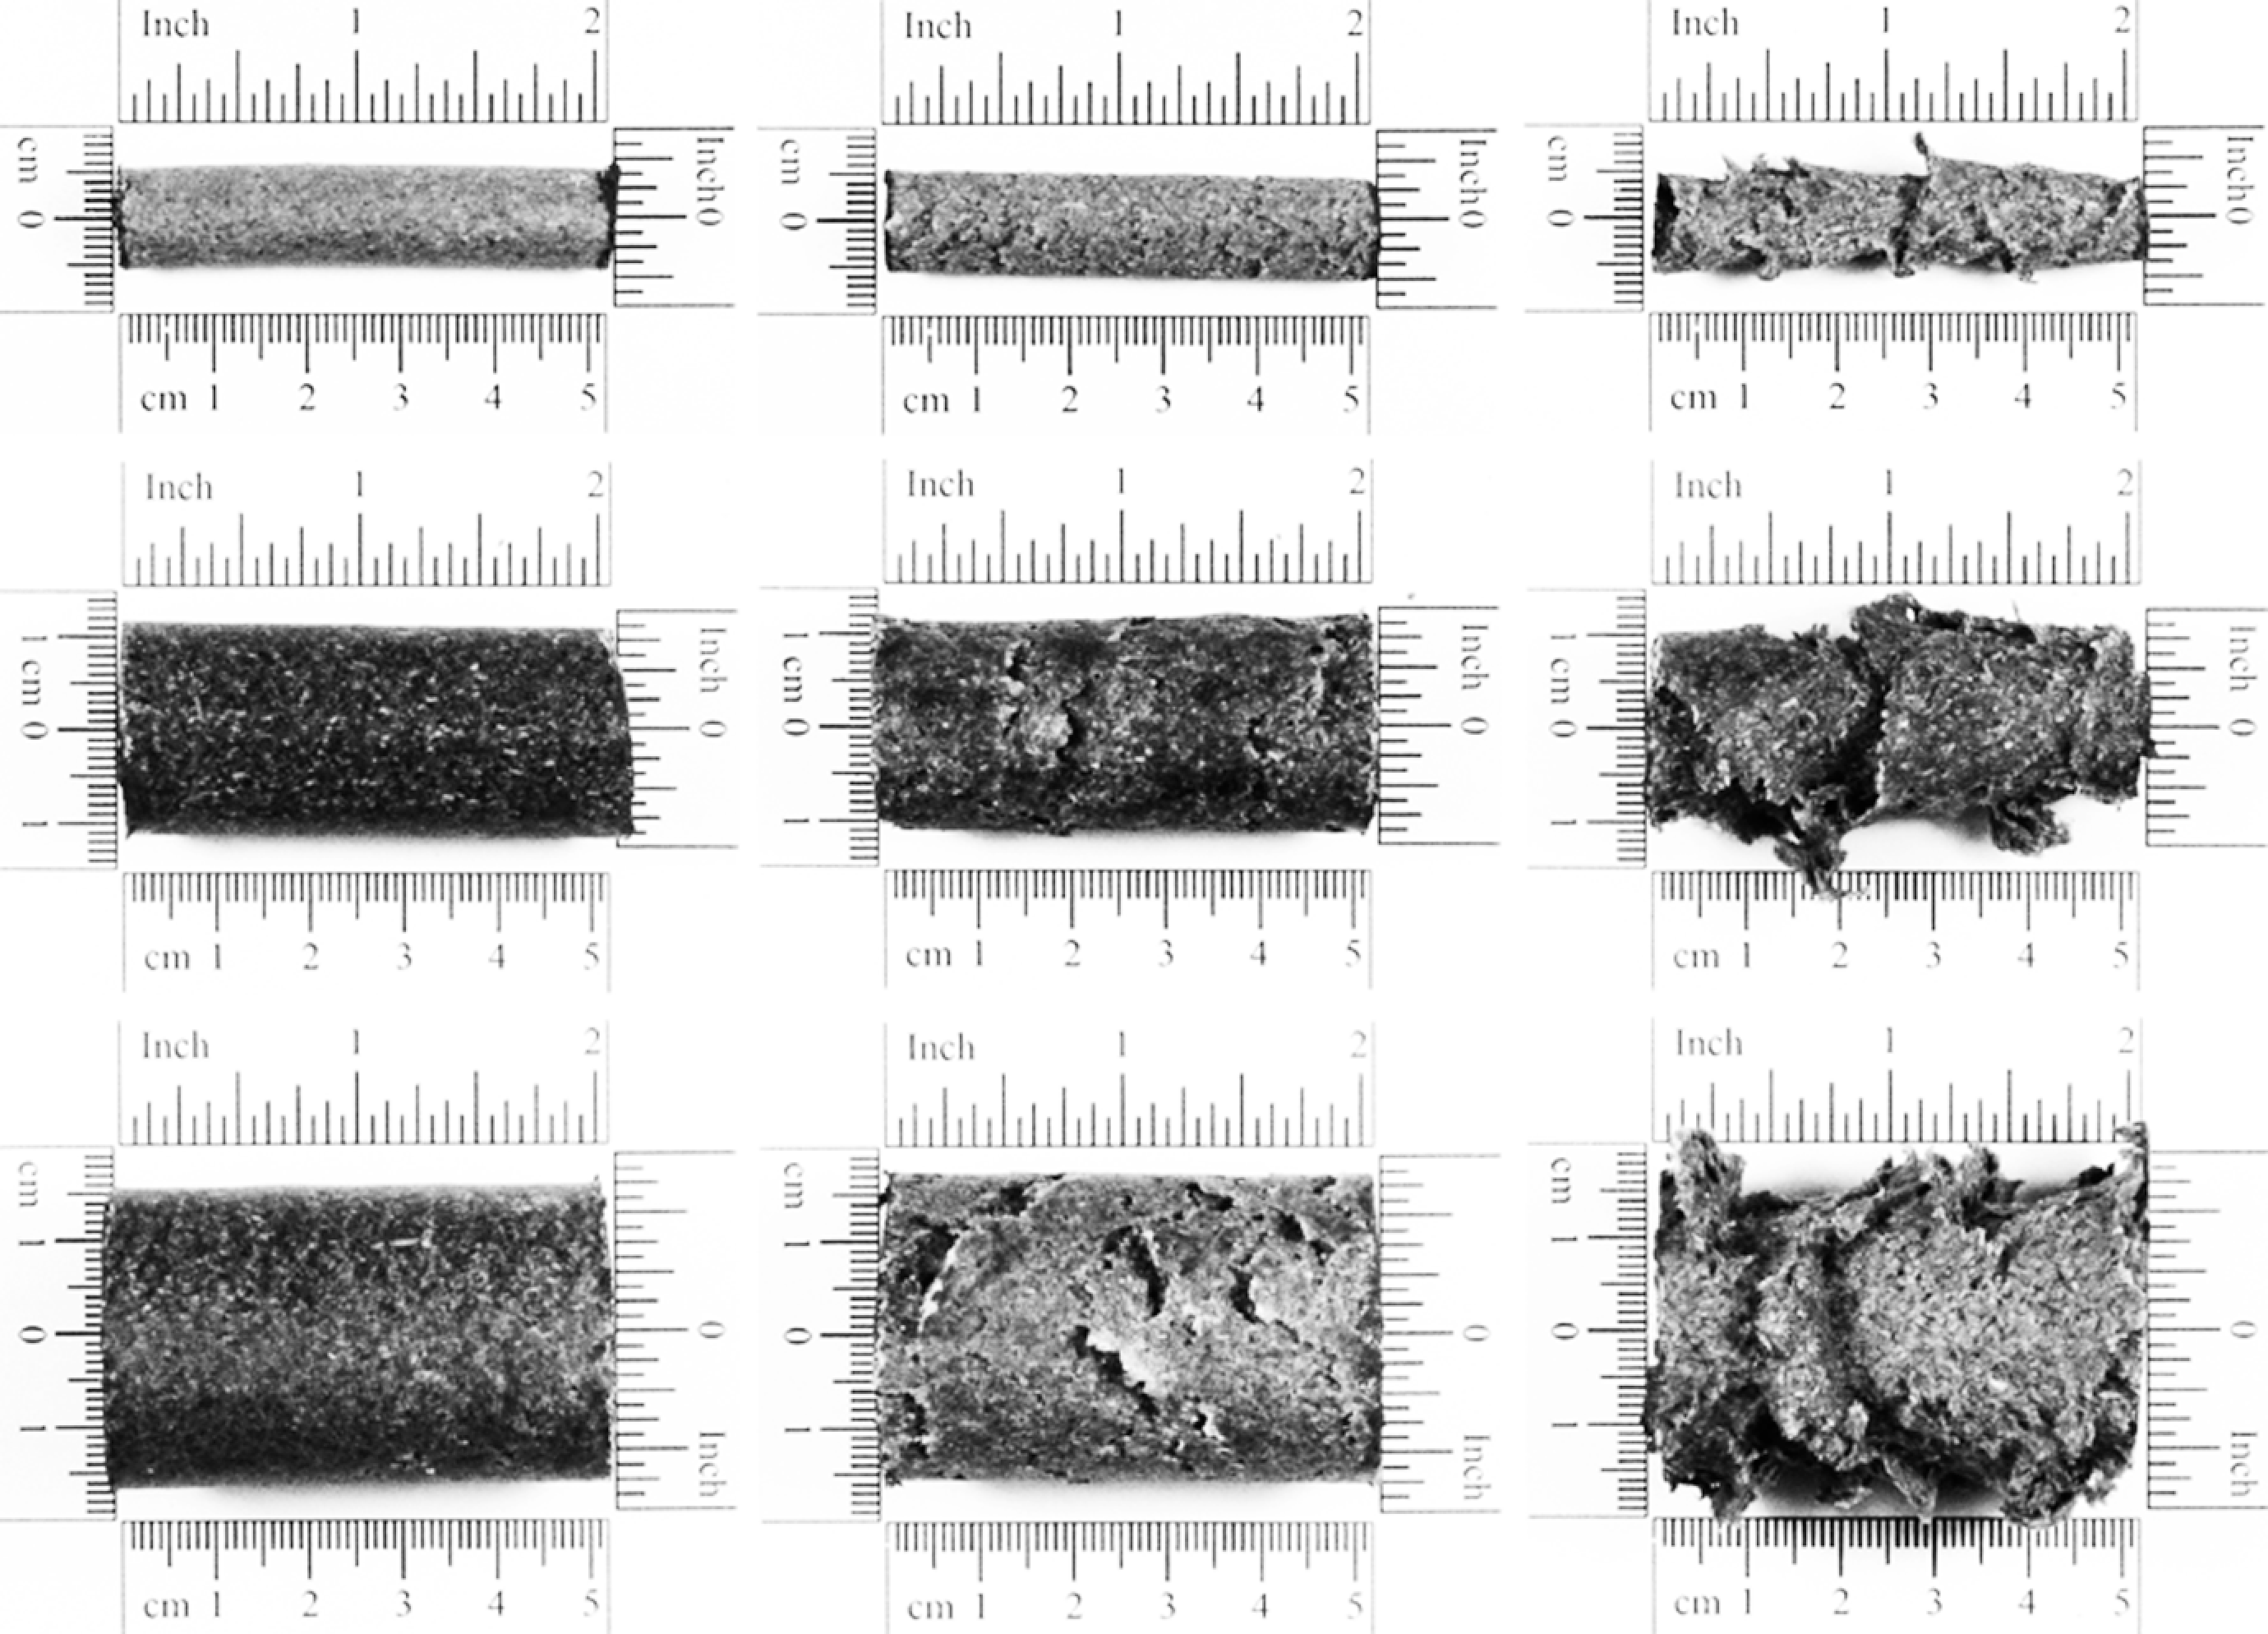
Some extruded profiles of wood–polypropylene composites.
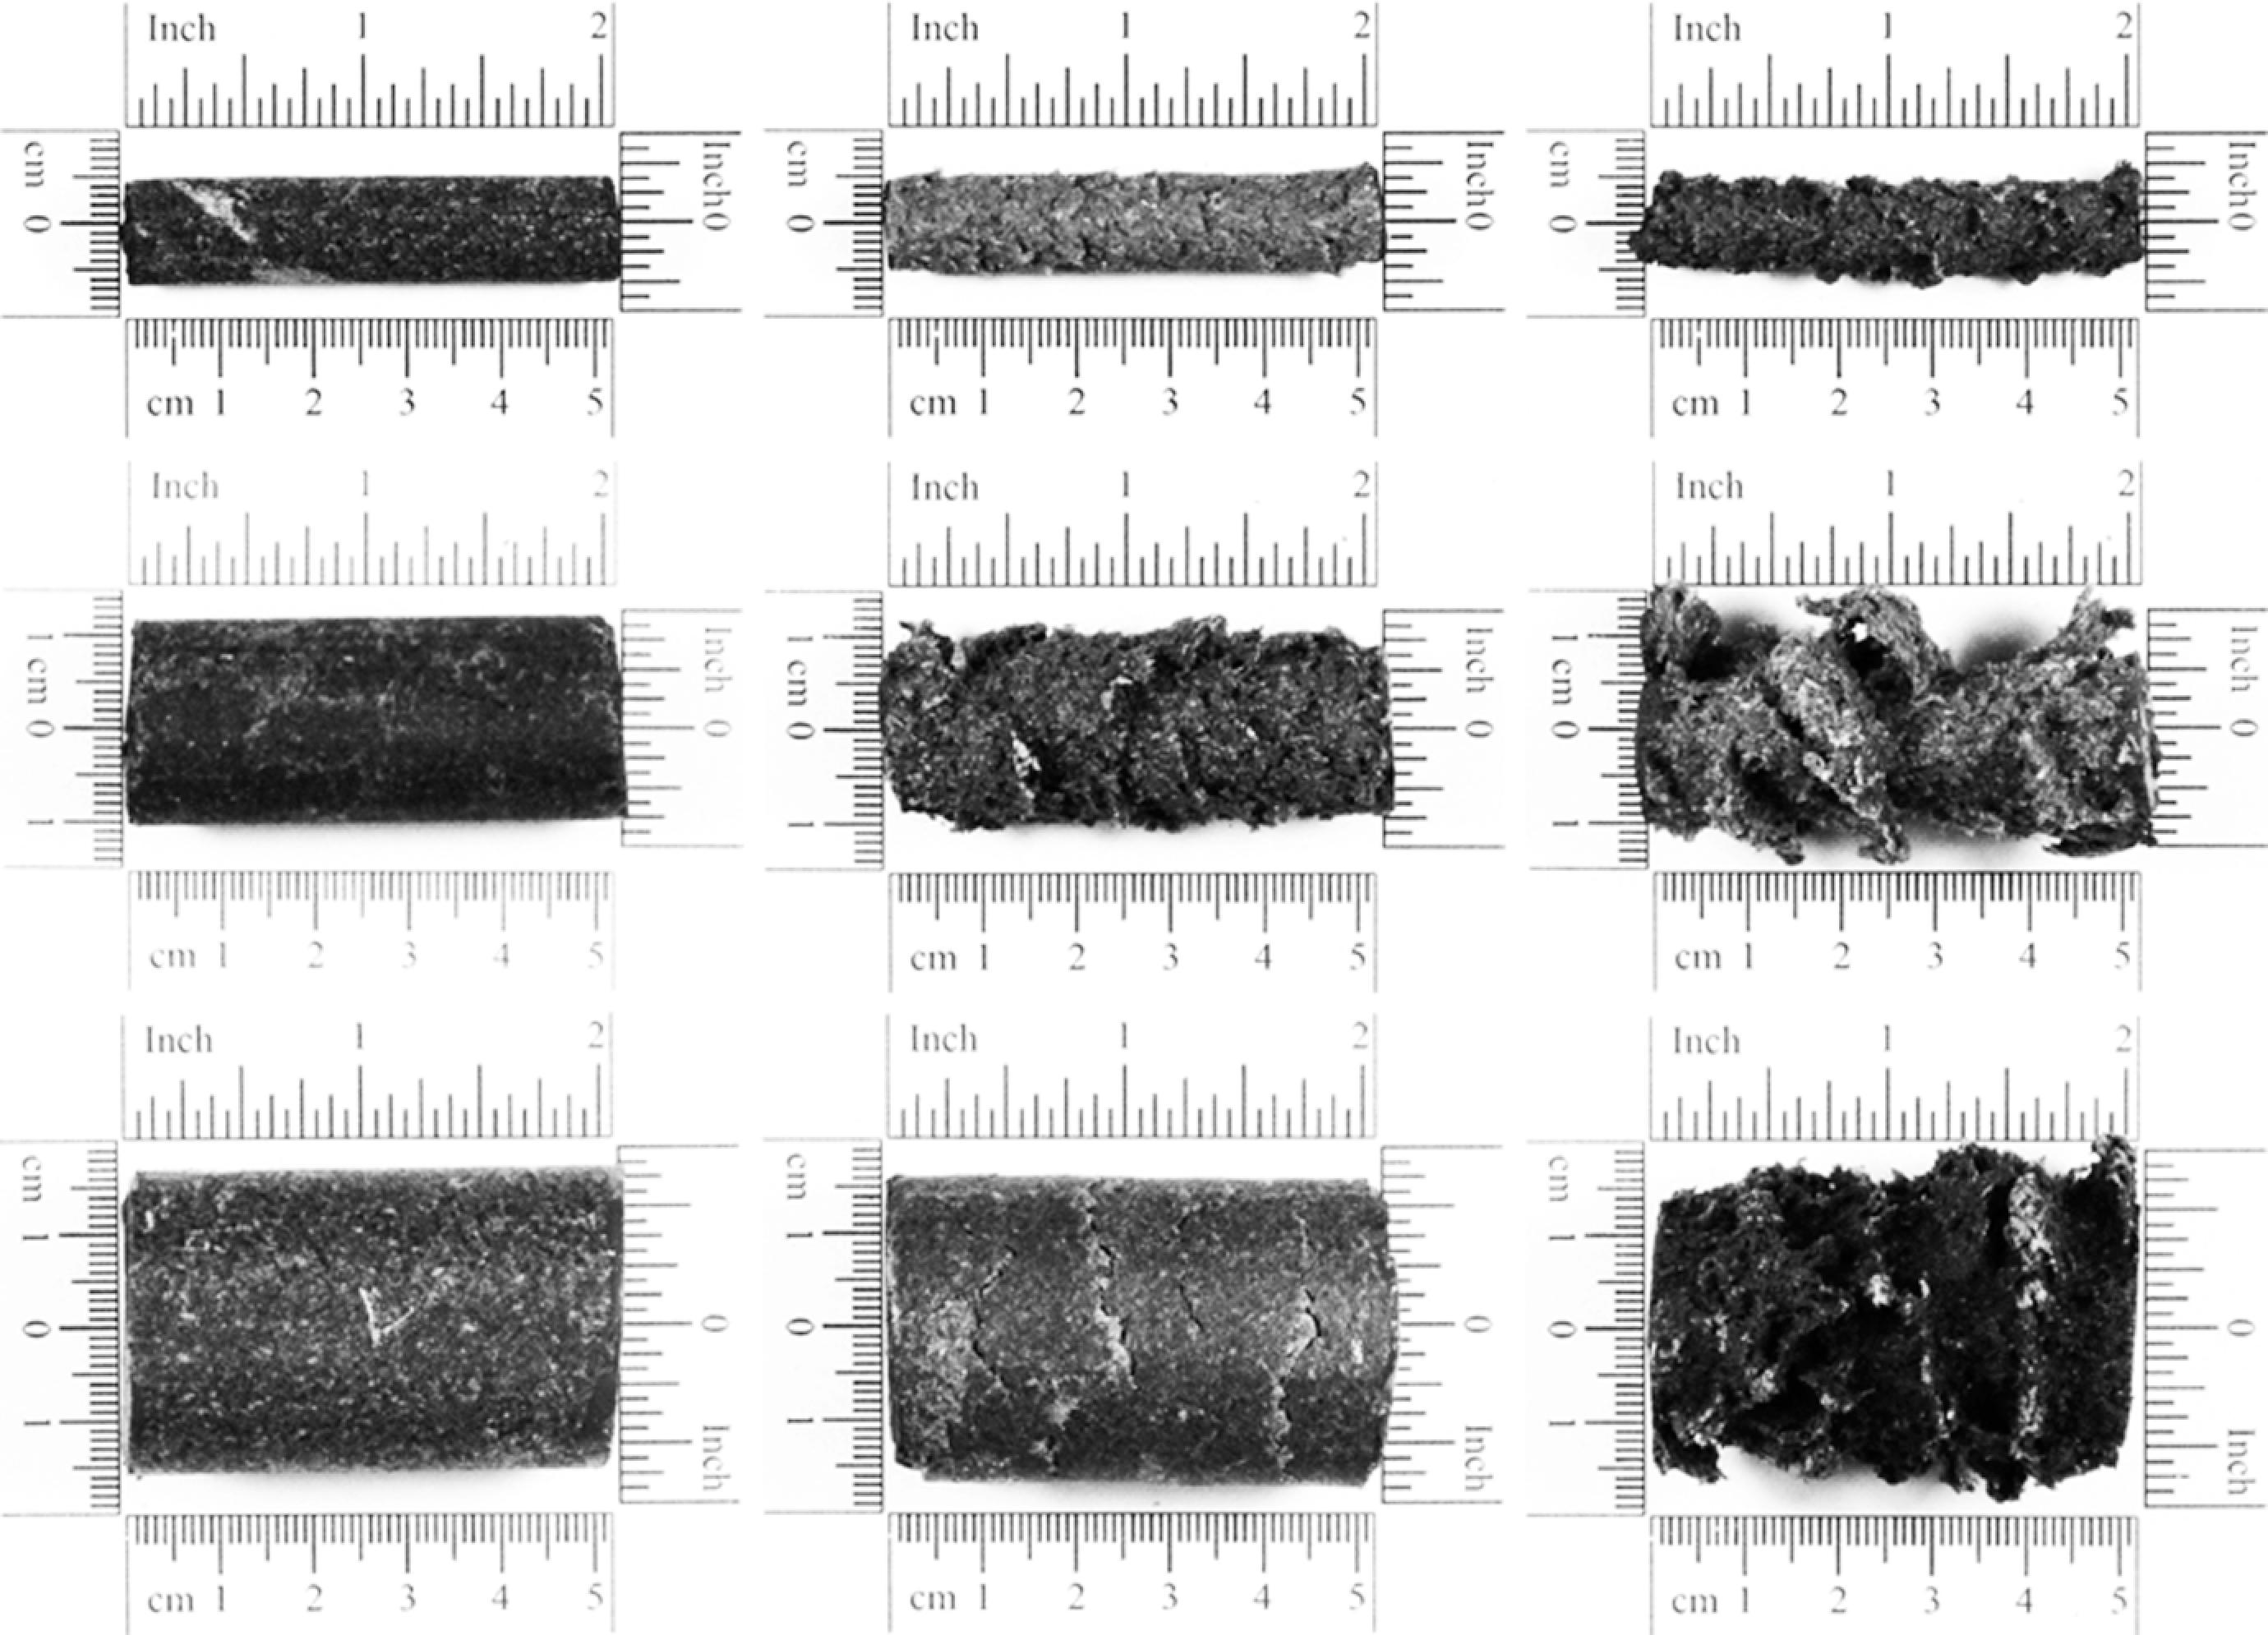
Some extruded profiles of wood–high-density polyethylene composites.
General information on the results of surface quality experiments.
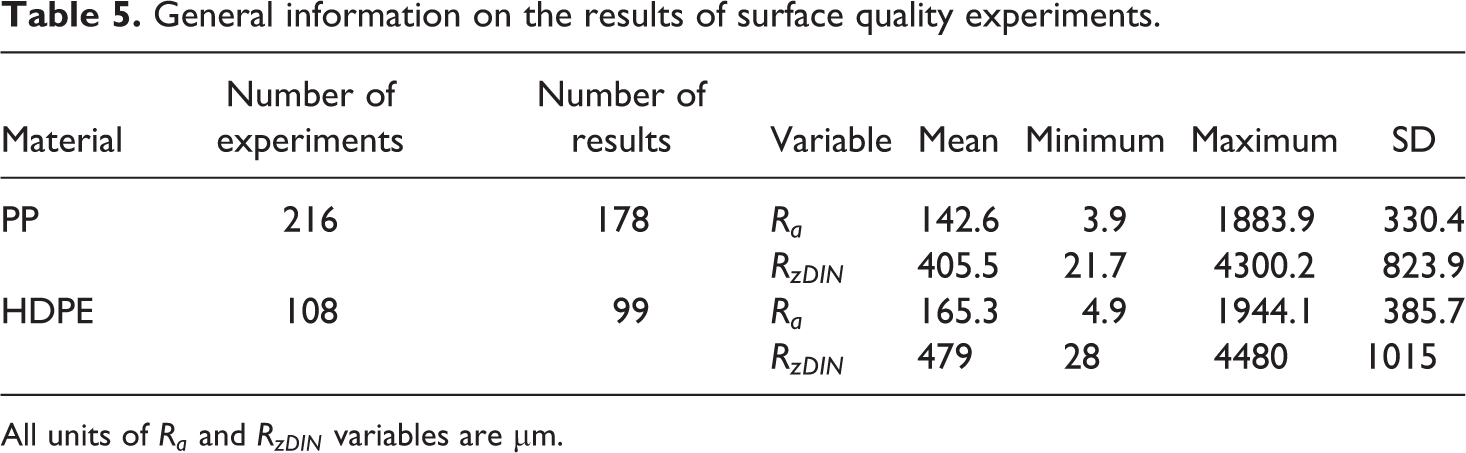
All units of
The statistical calculations were performed using Minitab software package. It is evident from the definition of surface quality that the lesser
In order to specify the effect of each parameter on surface quality variables, the p values (probability of null hypothesis) of parameters derived from regression analysis were compared (Table 6). The comparison shows that, in case of wood-PP composites, the important influencing parameters on
Average p values of regression analysis of surface quality and water absorption.
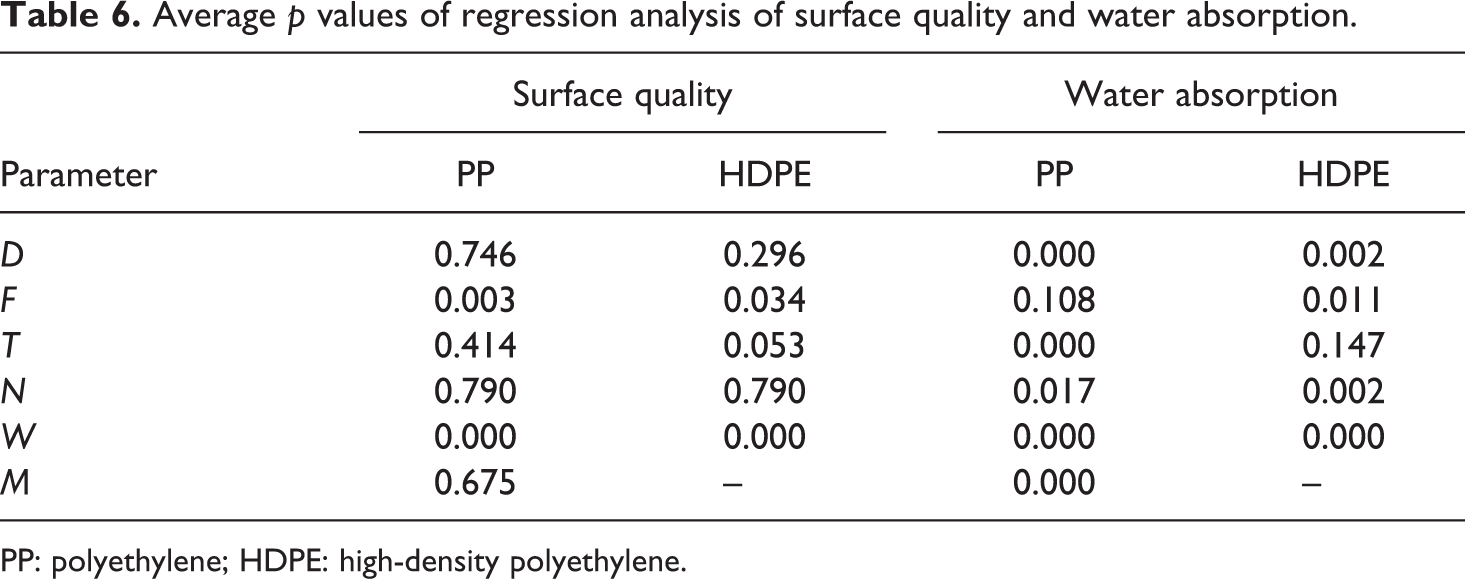
PP: polyethylene; HDPE: high-density polyethylene.
As indicated in the results, wood content exhibits more influential on the surface quality. It can be explained that a higher wood content gives rise to a more orientation of wood particles in the flow direction, which then results in a smoother extrudate surface. 11 Moreover, a higher wood content leads to an increase in melt viscosity and thus causes melt to behave as solid (plug flow). This in turn inhibits sticking to the die wall, developing an entirely slipping flow, and thus enhances the ironing effect. At a high L/D ratio, this ironing effect is more pronounced as the material residence time is longer. The results of water absorption measurement are given in Table 7. Due to the vast measured data, only some selected (but indicative) data are listed.
General information on the results of water absorption experiments.
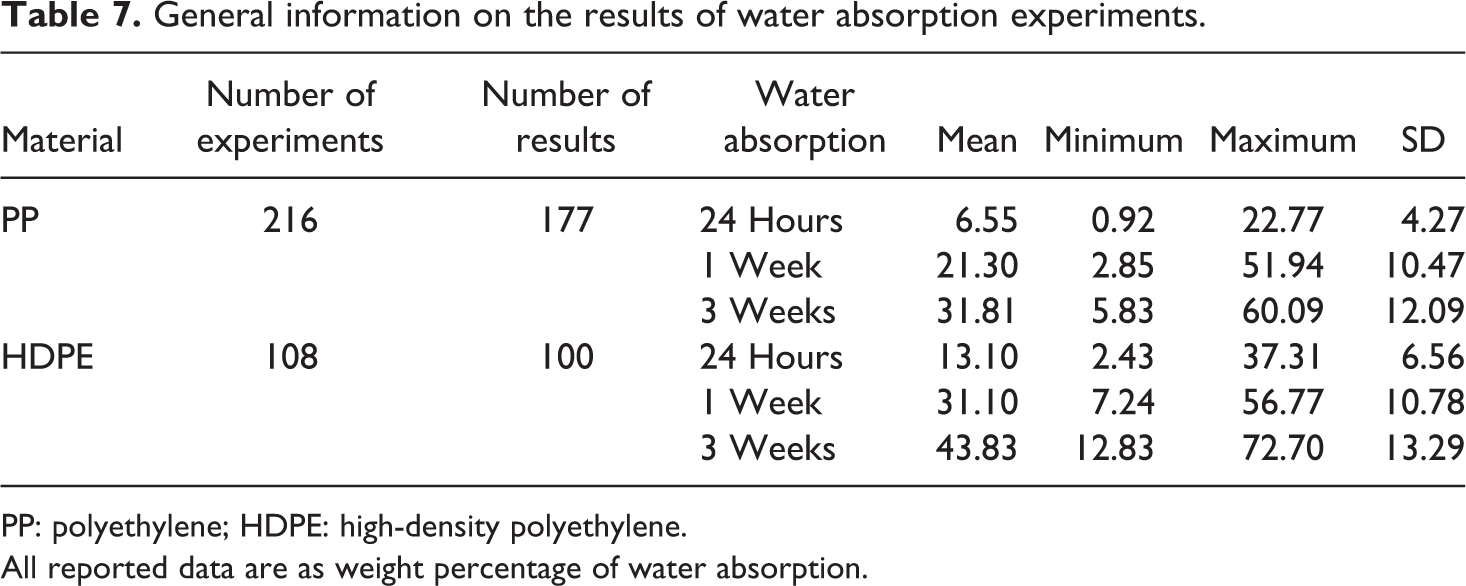
PP: polyethylene; HDPE: high-density polyethylene.
All reported data are as weight percentage of water absorption.
Similar to the surface quality calculations, linear regression analyses were carried out on water absorption data to identify the effect of each parameter on the surface roughness. The corresponding equations for wood-PP composites are as given below: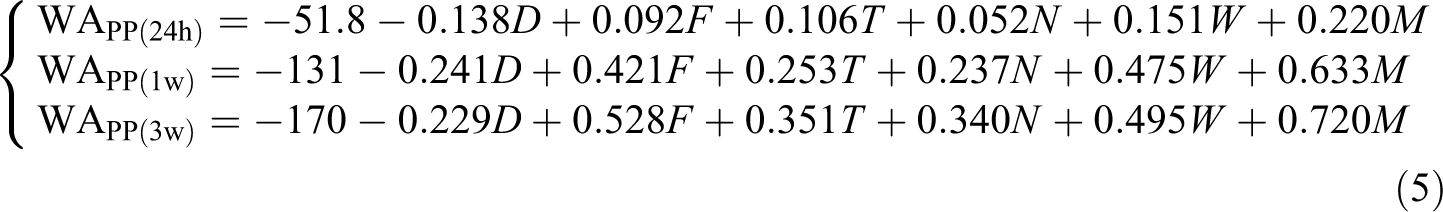
where 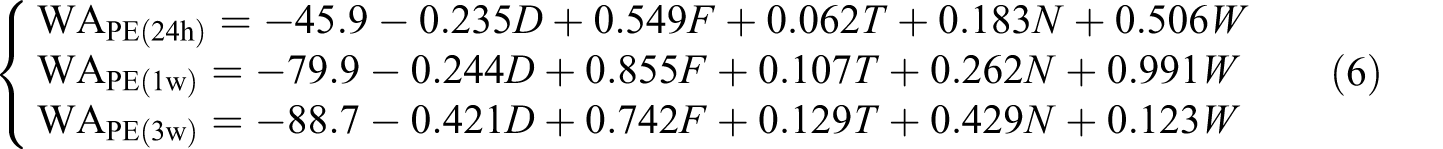
It should be mentioned that in practical point of view, usually a lower value of water absorption is favorable. It means that in equations (5) and (6), the increasing parameters, which decrease WA value could then improve the profile water resistance. Thus, increasing D value and also decreasing
The effect of diameter on water absorption can be explained via comparing surface-to-volume ratio. As the diameter increases, the surface-to-volume decreases (surface-to-volume = 4/D). By the same token, it is assumed that a profile with a poor surface quality gives a higher surface exposure (or a higher surface area due to the roughness). In order to verify the effect of surface quality on water absorption, the two parameters were plotted against each other, which are shown in Figures 7 to 9. As shown in these diagrams by linear curve fitting of each diagram, in eight fitted curves the equations have positive slopes. It means that increasing surface roughness leads to increasing water absorption values. Thus, it seems that in majority of situations, a poor surface quality leads to an increase in water absorption. By selecting proper processing parameters that can affect surface quality, the corresponding effect on the water resistance specification can be estimated.
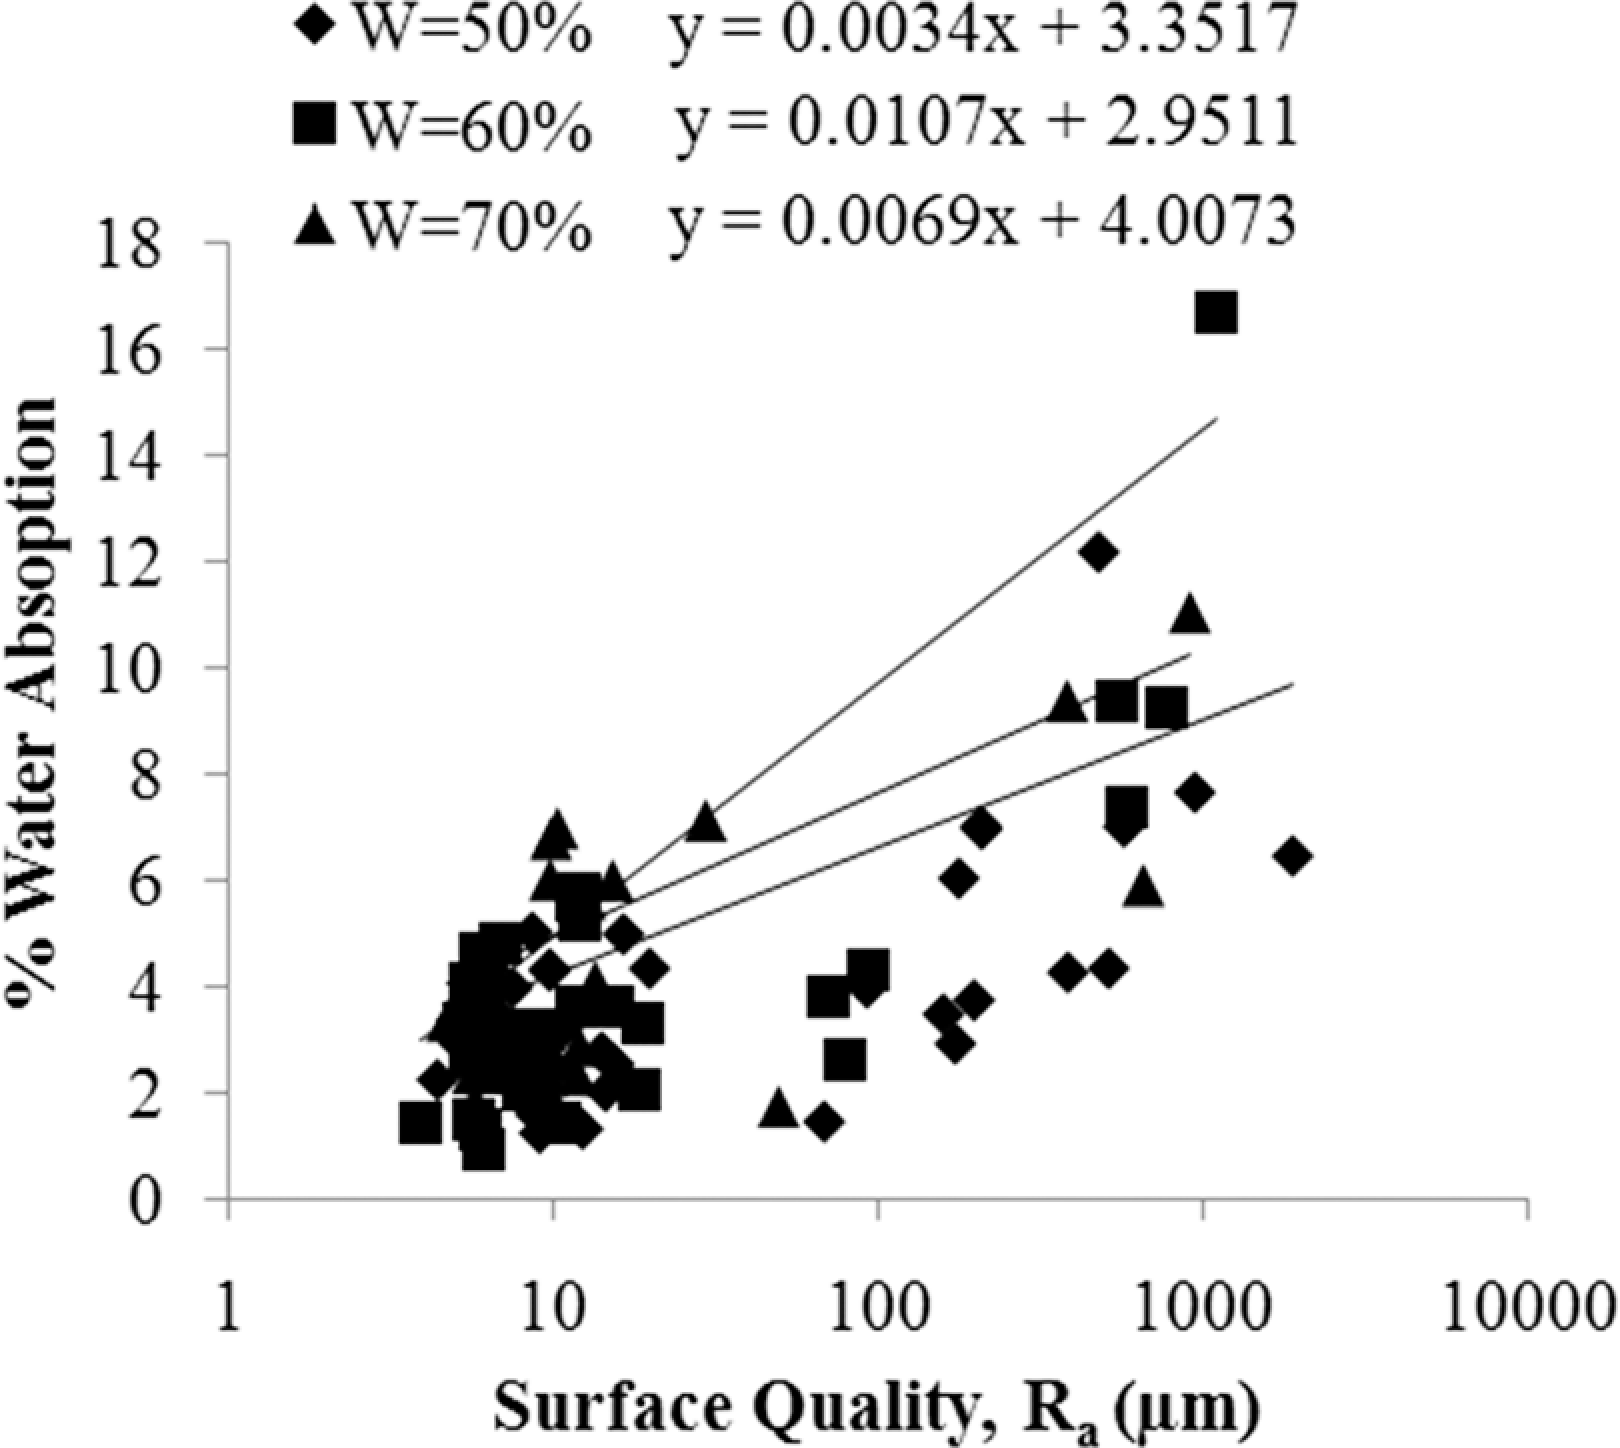
Diagram of water absorption for 24 hours (
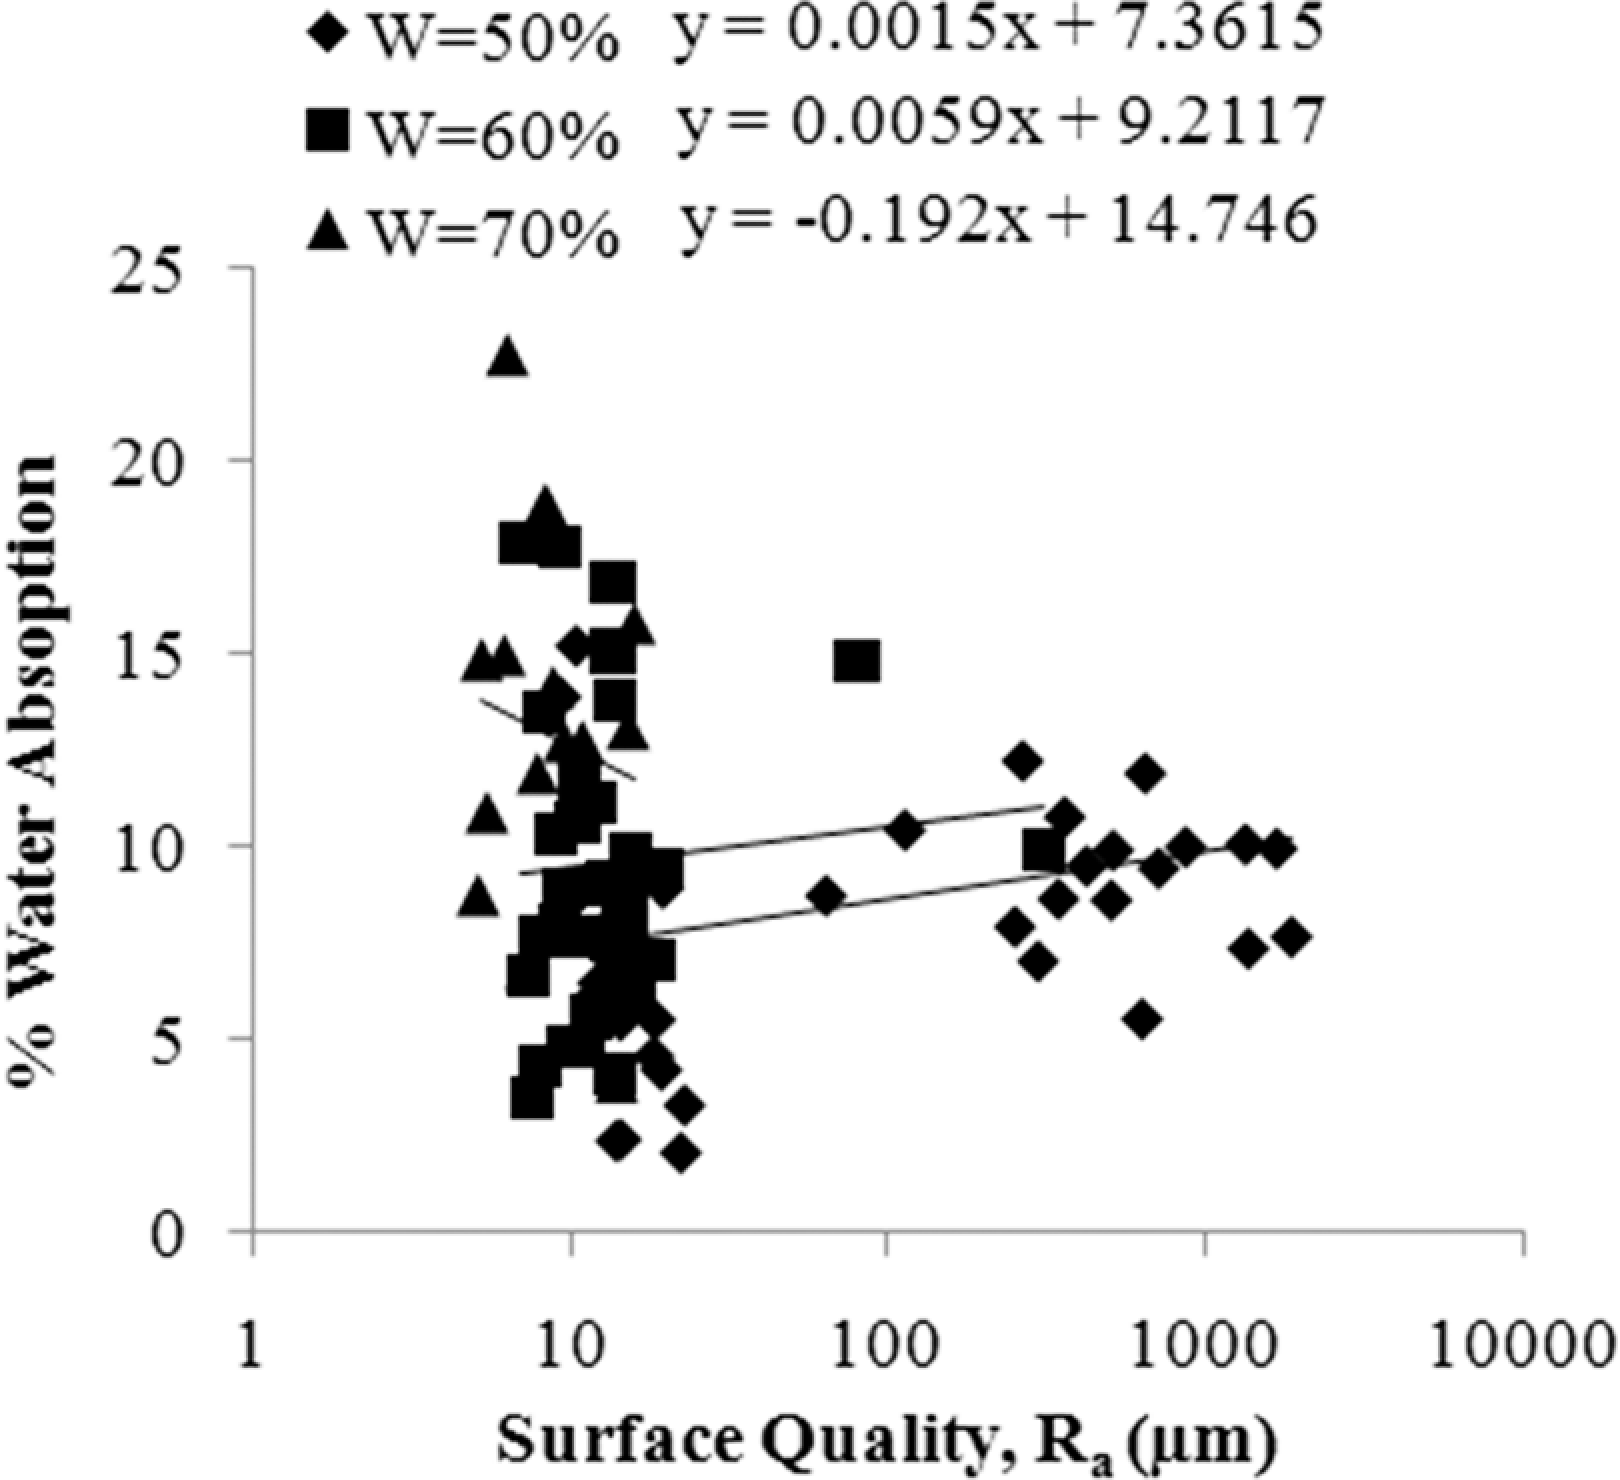
Diagram of water absorption for 24 hours (
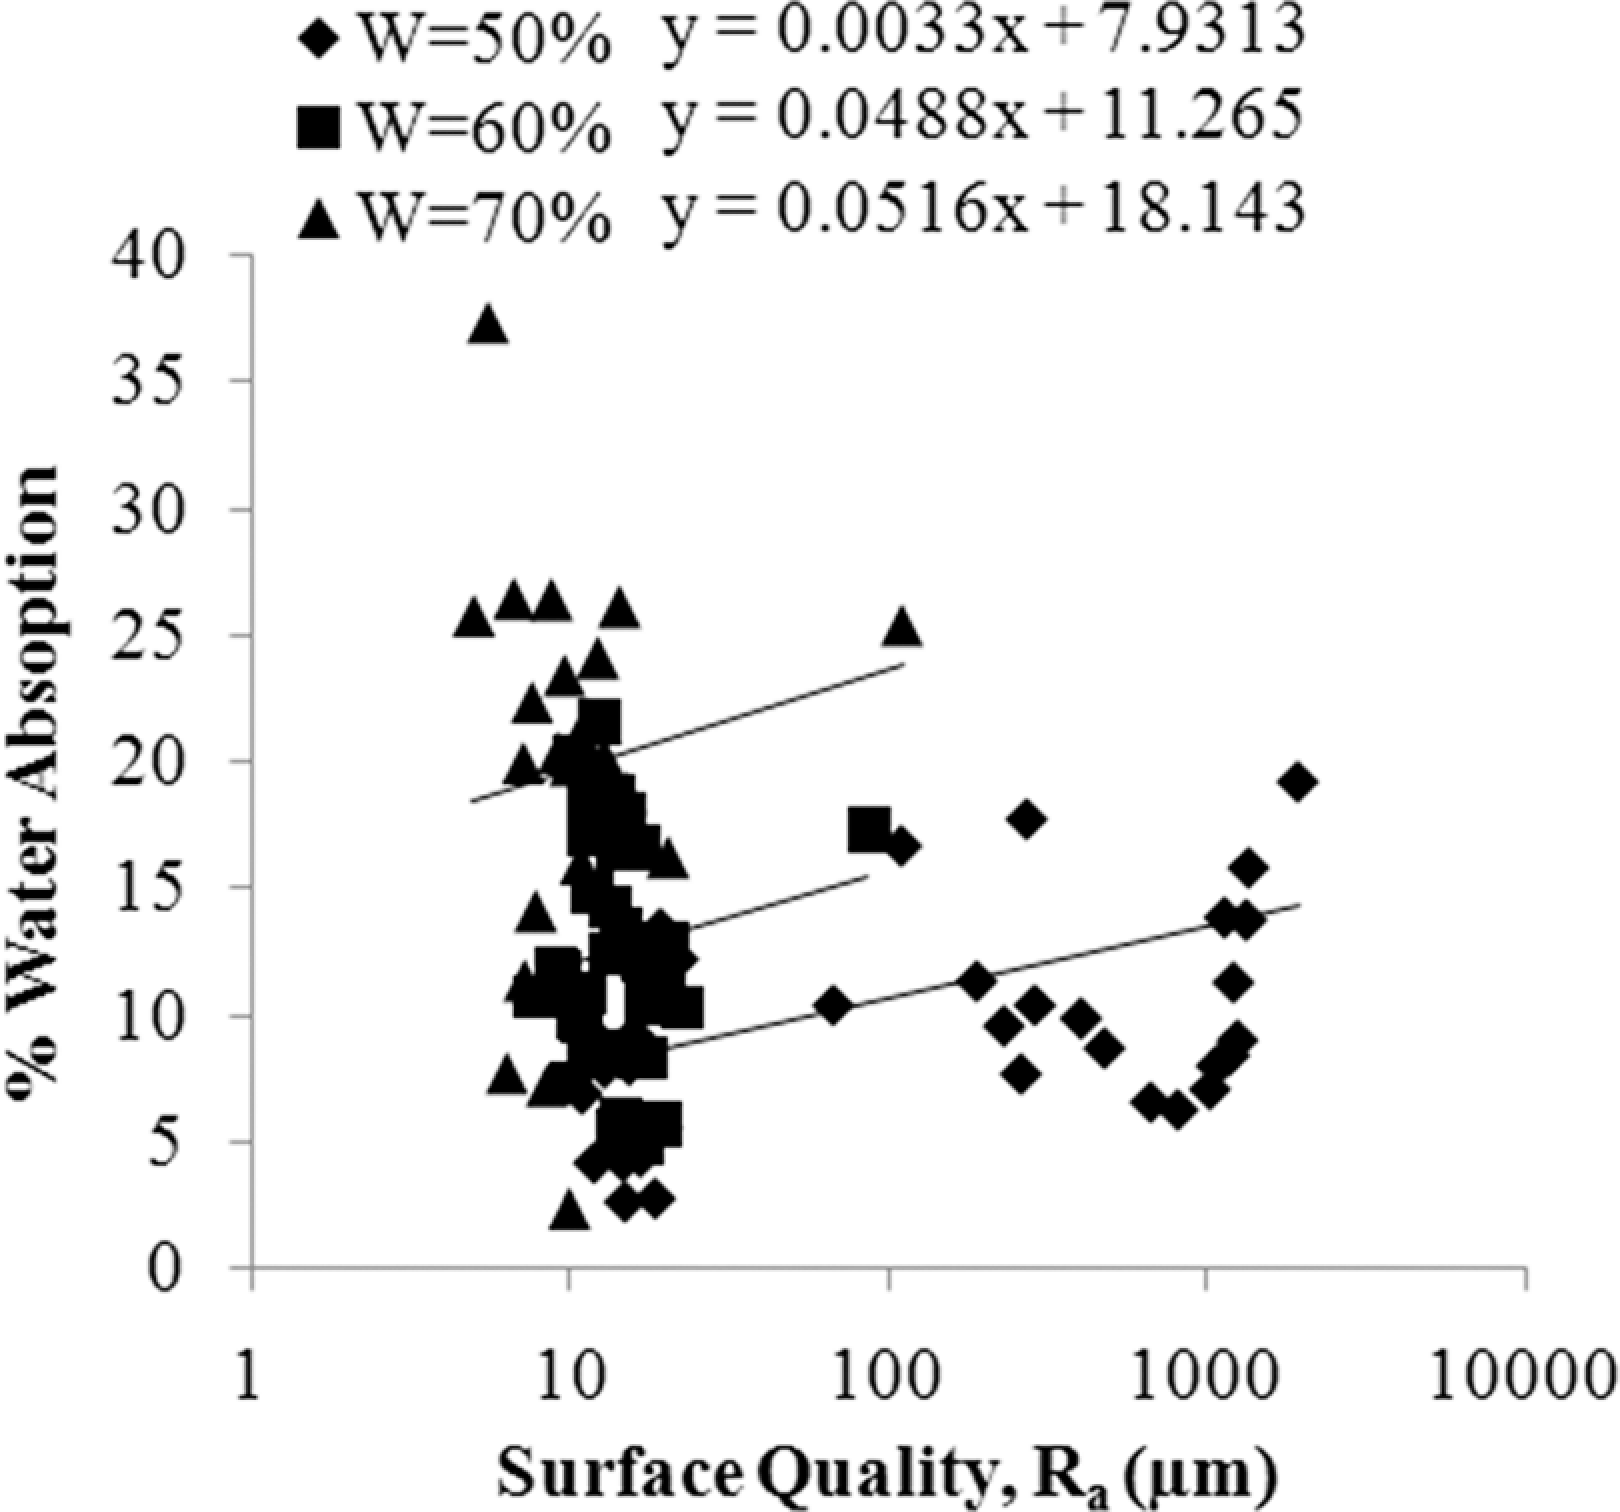
Diagram of water absorption for 24 hours (
Conclusions
In this article, a wide range of experiments were conducted to investigate the flow instabilities in WPC extrusion process. The selected polymeric matrixes were PP and HDPE. The material and processing parameters were chosen as wood content, polymer (MFI), screw speed, melt temperature, die diameter, and die land L/D. The measured output data included surface roughness and water absorption. The results showed that in case of wood-PP composites, increasing die diameter, die land ratio, die temperature, and wood content and decreasing screw speed and polymer MFI lead to improved surface quality. Similar effect was observed for wood-HDPE composite but only increasing die diameter showed the opposite effect. By performing water absorption experiments, it was found that increasing die diameter and also decreasing die land L/D, die temperature, speed, wood content, and polymer MFI lead to an improvement in water resistance. Finally, by plotting water absorption values versus the surface qualities of profiles, it was evident that a product with a good surface quality exhibits a better water resistance specification.
Footnotes
Acknowledgements
The authors thank the personnel of Machining Laboratory of Arak University of Technology, especially Dr Pak and Mr Rafienia who helped us in conducting measurements on surface roughness.
Declaration of Conflicting Interests
The author(s) declared no potential conflicts of interest with respect to the research, authorship, and/or publication of this article.
Funding
The author(s) received no financial support for the research, authorship, and/or publication of this article.