
Abstract
In this study, acrylonitrile–styrene–acrylic/styrene–acrylonitrile copolymer (ASA/SAN) binary blends with different compositions were prepared by mixing ASA and SAN by melt blending. Properties of the binary blends were studied by dynamic mechanical thermal analysis (DMTA), differential scanning calorimetry (DSC), fourier transform infrared spectra (FTIR), heat distortion temperature (HDT), melt flow rate (MFR), mechanical properties and scanning electron microscopy (SEM), respectively. Since a grafted SAN shell is contained in ASA’s core shell structure, it is considered to have a good compatibility with SAN, and the results confirmed it. The binary blends showed a single glass transition temperature (Tg) according to DSC and DMTA measurements. Only weak interactions between the characteristic groups were obtained in FTIR spectrum. No obvious phase separation observed in SEM photographs indicated good compatibility between ASA and SAN. With respect to mechanical properties, impact strength and elongation at break of ASA/SAN blends decreased significantly with the SAN content but tensile strength, flexural strength and modulus increased. In addition, the incorporation of SAN enhanced the heat resistance and processability of the blend system.
Introduction
Polymer blends are defined as mixtures of at least two polymeric species. 1 A new material system with desirable features was obtained by polymer blending. However, the morphology and properties of polymer blends were influenced by a variety of factors, including components of the blends, compatibility and molecular properties of the blend components, processing methods and conditions, rheological properties and thermal treatments. 2–5
Acrylonitrile–styrene–acrylic (ASA) terpolymer as an impact-resistance resin was developed in 1970s and was used in a wide variety of applications including outdoor materials, automobiles, electronics, and so on because of its excellent properties, such as good toughness, dimensional stability, aging and weatherability properties and thermal stability. The terpolymer can be processed repeatedly over a wide temperature range without yellowing. ASA has the similar chemical structure with acrylonitrile–butadiene–styrene terpolymer (ABS), both of them were composed of styrene–acrylonitrile (SAN) matrix containing rubber phase. However, there exist some differences between the two rubber phases, that is the core of ABS is butadiene rubber, while that of ASA is acrylic elastomer. This difference causes the difference of aging characteristics of the two polymers because the double bond in the repeat unit of ABS undergoes physical or chemical aging caused by oxygen condition and UV radiation when used in outdoors, resulting in aging of the rubber phase, a continuous decline in mechanical strength and color changes. As the acrylic rubber replaces the butadiene rubber in ABS, the aging of butadiene rubber is resolved. ASA closely resembles ABS but ASA is superior to ABS, because ASA presents better comprehensive properties, it enhanced the weather resistance of the polymer to great extents nearly without any loss of other properties, such as mechanical properties, processing properties, electric insulation and chemical resistance.
As a new material with good properties, ASA has attracted some attentions. Some of the examples that can be outlined are ASA/poly(butylenes terephthalate) (PBT), 6 ASA/poly(ethylene terephthalate) (PET), 7 polycarbonate (PC)/ASA, 8 –10 PC/ASA/SAN, 11 PC/modified ASA, 12 poly(vinyl chloride) (PVC)/ASA, 13 ,14 poly(methyl methacrylate) (PMMA)/ASA. 15 The morphology, rheological behavior, interfacial property, tensile and fracture properties of different blends were investigated, and the properties of blends were influenced by factors including rubber content, rubber particle size, processing temperature and compatibility. To enhance the mechanical properties of blends containing ASA, several types of compatibilizers, for instance, diblock copolymer composed of tetramethyl polycarbonate (TMPC) and SAN (TMPC-b-SAN), were combined into the blend systems. 9
Besides the blends containing ASA mentioned above, it may be interesting to investigate the properties of ASA/SAN blends since SAN is the shell of ASA terpolymer. We tried to prepare blends containing ASA showing better properties at lower costs, compared to pure ASA. ASA/SAN binary blends were prepared to evaluate the properties for further exploration. In the present work, ASA/SAN blends with different weight ratios were prepared by melt blending, and the properties of blends were investigated. Mechanical properties of the binary blends, such as fracture properties and tensile properties, were observed. Differential scanning calorimetry (DSC) and dynamic mechanical thermal analysis (DMTA) were used to characterize the glass transition behavior. Fourier transform infrared spectroscopy (FTIR) was used to study the interactions between ASA and SAN and heat distortion temperature (HDT) reflected heat resistance of the binary blends. In addition, the morphology of ASA/SAN blends was observed by scanning electron microscopy (SEM).
Experimental
Materials
ASA and SAN resins are the major raw materials used in this experiment. ASA (Luran S 776 SE) was procured from BASF Company Ltd, Korea, and SAN (D-178) was supplied by Zhenjiang GPPC Chemical Co., Ltd, China. ASA/SAN blends with weight ratios of 100/0, 85/15, 70/30, 50/50, 30/70, 15/85 and 0/100 were prepared by melt mixing.
Sample preparation
The mixtures of ASA and SAN were prepared in a two-roll mill at 180°C. The prepared blends were compression molded into sheets of 0.3 mm, 2 mm and 4 mm thickness at 180°C in a flat-plate vulcanization machine. The obtained sheets, with 0.3 mm thickness, were cut into strips of about 6 mm width for DMTA tests. Sheets of 2 mm were cut into dumbbell-shaped pieces for tensile tests. And a clipper was used to cut the 4-mm sheets into strips of about 10 mm width for flexural, impact and HDT tests.
Characterization
Glass transition temperature
Dynamic mechanical analysis of ASA/SAN blends was made by a dynamic mechanical thermal analyzer (DMTA-V, Rheometric Scientific, USA). The extension mode was used with a frequency of 1 Hz in the temperature range from 30°C to 150°C at a heating rate of 3°C/min. The dimensions of the rectangular bars for testing were approximately 25 × 6 × 0.3 mm3. But the exact dimensions of different samples were measured before the tests. T g was defined as the peak of the mechanical loss curve.
DSC measurements were performed using a DSC instrument (Q200, TA, USA). About 10 mg of each sample was placed in a sealed aluminum pan which was heated from room temperature to 180°C at the heating rate of 40°C/min, and equilibrated for 90 s followed by quenching to 0°C at the cooling rate of 40°C/min to erase the thermal history. After eliminating the thermal history, samples were scanned from 0 to 180°C at a heating rate of 10°C/min, and T g was performed in the obtained curves.
Fourier transform infrared spectra (FTIR) analysis
FTIR was used to characterize the interactions between the components of the ASA/SAN blends. FTIR spectra of thin films (less than 30 μm) were obtained by a FTIR spectrometer (Nexus670, Nicolet, USA) with the resolution of 4 cm−1 in the range of 4000–400 cm−1 wave number.
Heat distortion temperature
Vicat/HDT equipment (ZWK1302-2, Shenzhen SANS Testing Machine, Co., Ltd, China) was used to determine the HDT at a heating rate of 120°C/h, and the maximum bending stress is 1.80 MPa and 0.45 MPa, respectively. The test was carried out according to International Organization for Standardization (ISO) 75-1.
Melt flow rate (MFR)
The MFR of ASA/SAN blends with different weight ratios was measured by a melt flow indexer (XNR-400A, Changchun Second Factory, China). Values of MFR were determined at 220°C under a 10 kg load.
Scanning electron microscopy analysis
A SEM (JSM-5900, JEOL, Japan), 15 kV, was used to observe the impact-fractured surfaces of the blends. All the samples were coated with a thin conductive layer of sputtered gold prior to the analysis.
Characterization of mechanical properties
The test of Notched Izod impact strength was conducted on an Izod impact tester (UJ-4, Chengde Machine Factory, China) at room temperature according to ISO 180. Tensile and flexure tests were conducted using a universal testing machine (CMT 5254, Shenzhen SANS Testing Machine, Co., Ltd, China) at room temperature. The tests were carried out with a stable rate of 5 mm/min for tensile tests and 2 mm/min for flexure tests according to ISO 527 and ISO 178, respectively. Moreover, the Shore D hardness was determined by a XHS-D hardness tester (Yingkou Material Testing Machine Co., Ltd, China), according to ISO 868:2003.
Results and discussion
Glass transition temperature
Glass transition temperatures are usually used to characterize the miscibility of polymer blends because each T g corresponds to one amorphous phase. 16 Polymer blends are miscible when their components show a single homogeneous phase at the molecular scale and exhibit a single T g, accordingly. With respect to those immiscible polymer blends, they exhibit several distinct phases and T g s. Tg is an effective way to characterize the miscibility of amorphous polymer blends, and the miscibility affects properties of the blends. As a result, the measurement of Tg s may establish the relationship between micro-characterization and properties. Figure 1 showed the DSC curves of ASA/SAN blends with different weight ratios. Each curve of the binary blends exhibited a single glass transition temperature at about 107°C, which indicated that ASA/SAN blends may be miscible in all ranges of composition. ASA terpolymer was prepared by grafting copolymerization of styrene and acrylonitrile monomers onto acrylic rubber particles, 11 that is ASA contains some amount of SAN, and the addition of SAN to ASA, to a certain extent, reduced the rubber content of ASA, was expected to have good compatibility. Usually, DMTA is considered more sensitive than DSC to determine the glass transition behavior. 17 The measurements of DSC have been confirmed by DMTA and the results are shown in Figures 2 and 3 where E′ and tan δ are plotted as a function of temperature for ASA/SAN blends with varied weight ratios, respectively. The loss curves have been chosen for determining T g s of the binary blends, and the results showed that all the blends showed a single loss peak which is consistent with the results obtained from DSC. Since ASA and SAN both have the similar glass transition temperatures such as 109.7°C for ASA and 107.6°C for SAN in the present study, it is difficult to immediately judge the miscibility from DSC and DMTA results. Some other methods, such as SEM, were used to further characterize the miscibility of the ASA/SAN binary blends system.
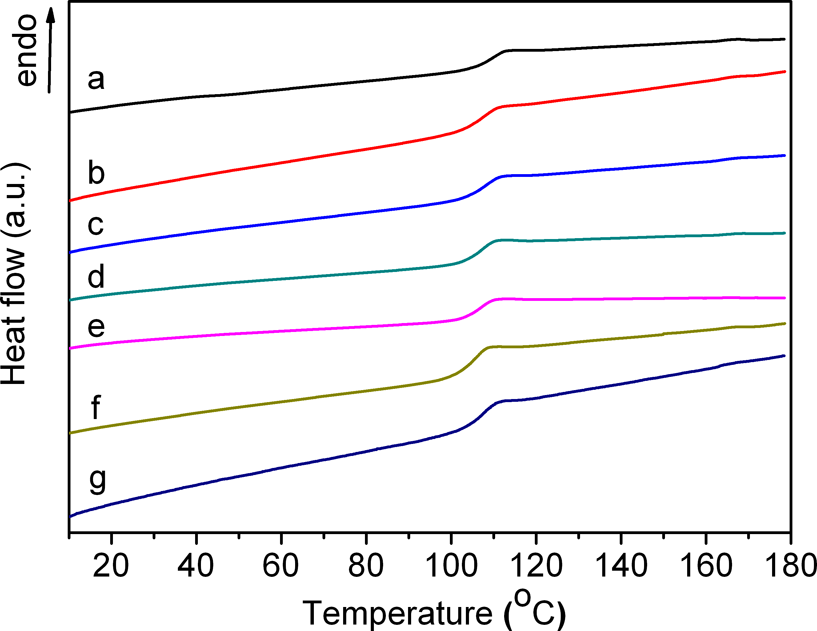
Differential scanning calorimetry (DSC) curves of acrylonitrile–styrene–acrylic/styrene–acrylonitrile (ASA/SAN) blends with different blend ratios (a) 100/0, (b) 85/15, (c) 70/30, (d) 50/50, (e) 30/70, (f)15/85 and (g) 0/100.
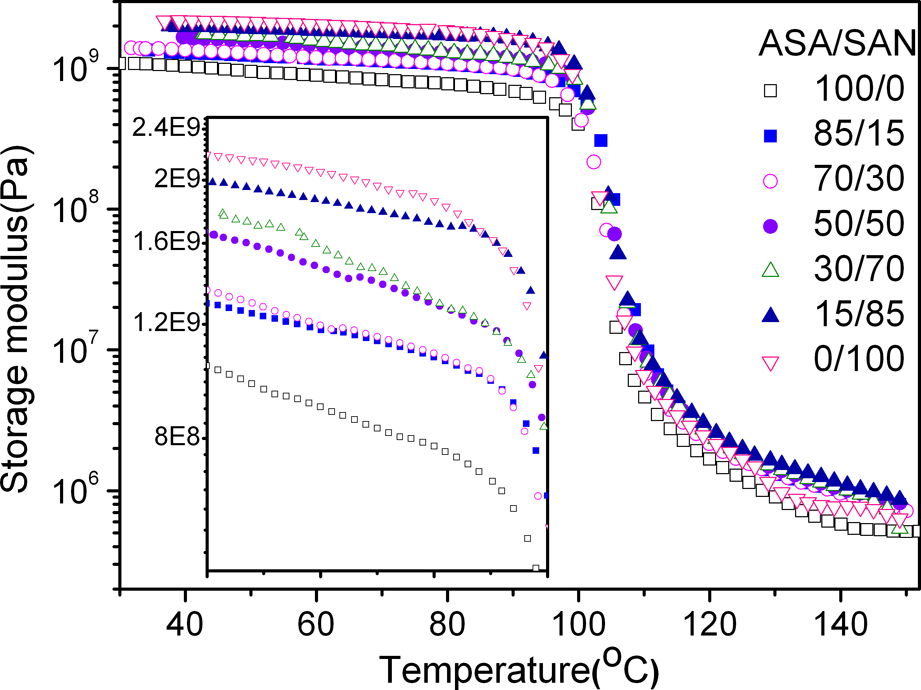
Variation in the storage modulus of acrylonitrile–styrene–acrylic/styrene–acrylonitrile (ASA/SAN) blends.
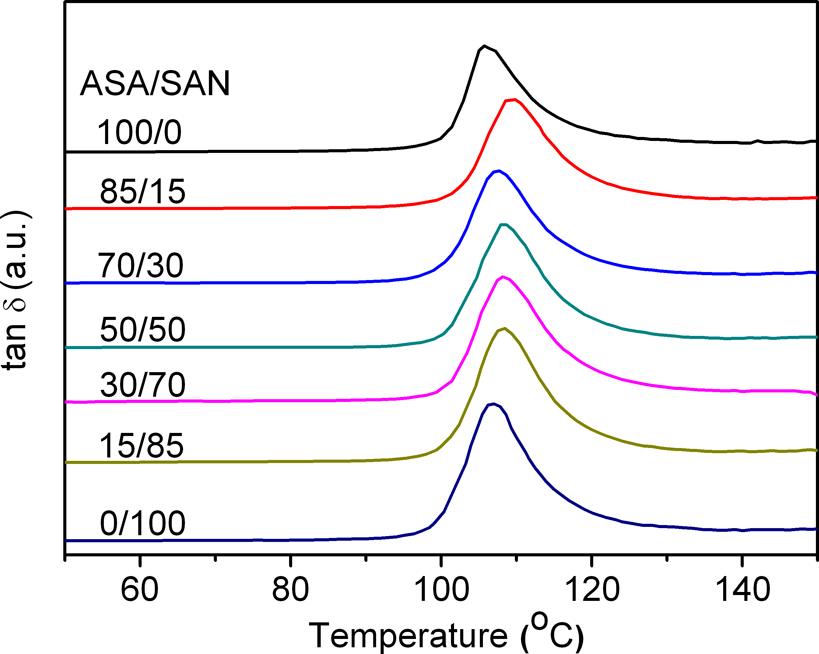
Tan δ as a function of temperature for acrylonitrile–styrene–acrylic/styrene–acrylonitrile (ASA/SAN) blends.
Table 1 listed the T g s obtained from DSC and DMTA measurements and storage modulus. The data showed that T g,ASA is almost the same as T g,SAN, and glass transition temperatures of ASA/SAN blends consisting of different blend ratios did not show evident difference, that is all blends exhibit almost the same T g. In Figure 2, the value of storage modulus increased with the increase in the content of SAN below the glass transition region. As listed in Table 1, the storage modulus at 40°C increased from 1.03 × 10⁹ Pa to 2.19 × 10⁹ Pa, with the increase in SAN, which is attributed to the higher modulus of SAN than ASA. As storage modulus is representative of the stiffness of materials, the increase in storage modulus indicated that the more SAN was contained, the higher stiffness of ASA/SAN blends was obtained.
Glass transition temperature and storage modulus (at 40°C) of ASA/SAN blends.
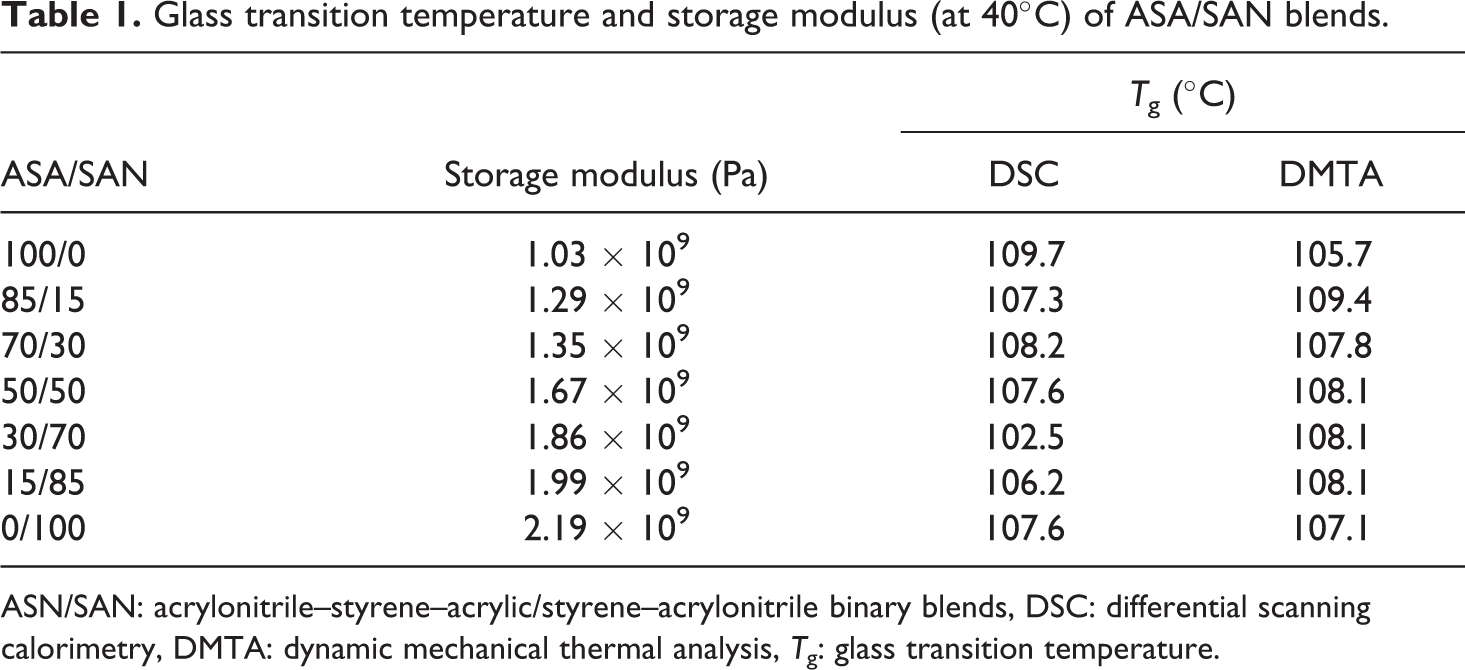
ASN/SAN: acrylonitrile–styrene–acrylic/styrene–acrylonitrile binary blends, DSC: differential scanning calorimetry, DMTA: dynamic mechanical thermal analysis, T g: glass transition temperature.
Heat distortion temperature
HDT is the main factor considered when selecting a material for high-temperature applications. In this regard, HDT experiments were carried out to examine the heat resistance of ASA/SAN blends. As shown in Figure 4, HDT exhibited a significant increase with increased content of SAN. It is worth noting that the HDT (measured under the maximum pressure of 1.80 MPa) can be increased from 83.5°C to 90.6°C, and the HDT (measured under the maximum pressure of 0.45 MPa) can be increased from 91.6°C to 98.3°C, respectively. The increase in HDT is due to the addition of SAN with relatively high stiffness, which is confirmed by the results of DMTA. And the almost linear relation between HDT and weight ratios of ASA/SAN illustrated the good miscibility between ASA and SAN. 18
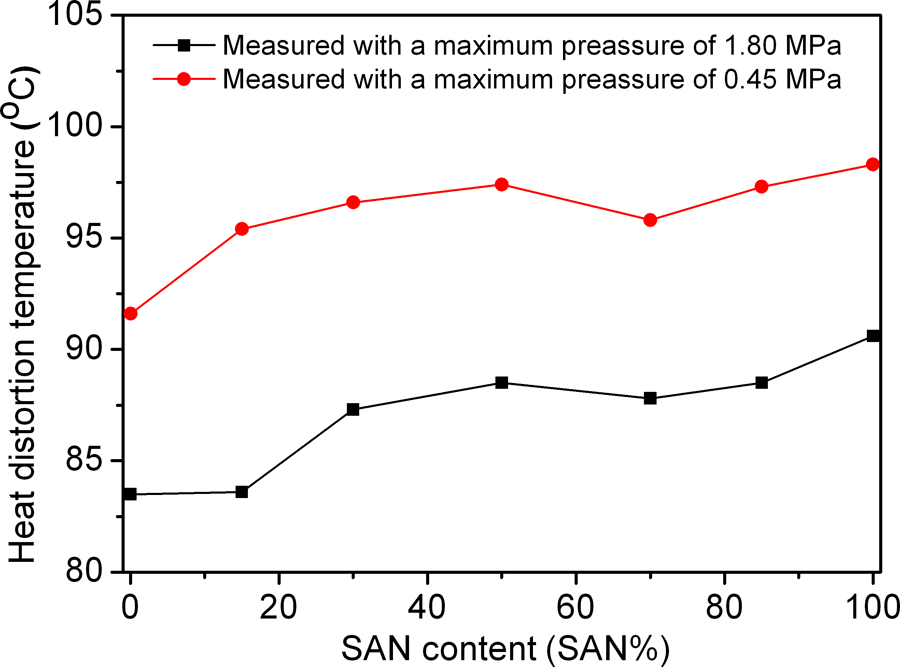
Heat distortion temperature (HDT) versus styrene–acrylonitrile (SAN) content.
Fourier transform infrared spectra analysis
To further examine the interactions between ASA and SAN, the FTIR analyses were carried out. Figure 5 showed the FTIR spectra of all composition of ASA/SAN blends in the range of 4000–400 cm−1. By and large, the addition of SAN to ASA did not influence its spectrum, that is no obvious change was observed when compared to its spectrum. The bands at 2238 cm−1, 702 cm−1 and 1602 cm−1 were characteristic peaks of cyano (C≡N) stretching vibration, single-substituted phenyl ring and vibrations of benzene skeletal ring, respectively. 2 ,19,20 The absorption bands at 1734 cm−1 were attributed to the carbonyl (C=O) stretching vibration of rubber phase in ASA. 21 Besides the characteristic peaks of C≡N and C=O, bands of >CH2 and CH3 were also used to characterize the interactions, and bands at 2932 cm−1 were attributed to C–H stretching vibration of >CH2, 21 1435 cm−1 and 1372 cm−1 were C–H bending vibration of –CH3. 22 As shown in Figure 5, the absorbance of the main vibrational bands remained at almost the same wave number for blends with different components. It can be concluded that there exists no strong specific intermolecular interactions in ASA/SAN blends since no obvious shift of wave number of groups such as C≡N and C=O was observed. This may be due to the special system of ASA/SAN blends; no new groups appeared with the addition of SAN to ASA, because ASA contains the SAN segments.
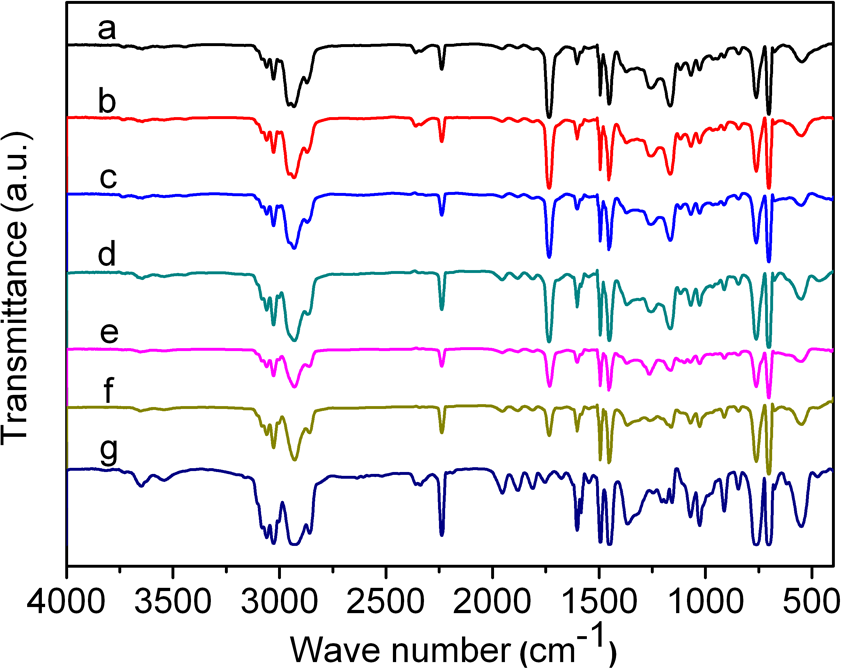
Fourier transform infrared spectra (FTIR) of acrylonitrile–styrene–acrylic/styrene–acrylonitrile (ASA/SAN) blends with different blend ratios (a) 100/0, (b) 85/15, (c) 70/30, (d) 50/50, (e) 30/70, (f)15/85 and (g) 0/100.
Mechanical properties
Figures 6 and 7 showed impact properties and tensile properties of ASA/SAN blends, respectively. As shown in Figures 6 and 7, both the impact strength and elongation at break decreased significantly with SAN content. The impact strength and elongation at break decreased dramatically as the weight fraction increased until 70%, and above this point, they decreased slightly and almost remained at balance. It is interesting to note that the region ranging from about 15% to 70% SAN addition exhibited steeper decrease in both impact strength and elongation at break. The impact strength, as well as elongation at break dropped sharply from 23.5 kJ/m2, 68% of pure ASA, to 1.0 kJ/m2, 3% for the composition of ASA/SAN blends was 70/30, which is almost the same as that of pure SAN. Usually, the impact strength and elongation at break are used to characterize the toughness of materials. The weight fraction, as one of structural variables, affects the mechanical properties in rubber-modified polymer blends. During the failure process of rubber-modified polymer, most of the energy is absorbed by the deformation of the rigid matrix. 11 So the properties and composition of the matrix are of great importance in determining the mechanical properties of ASA/SAN blends. In this work, since SAN is a relative brittle matrix compared to ASA, so more SAN added to ASA/SAN blends must cause the decrease in impact strength and elongation at break of the blends. It is worth noting that the experimental values of impact strength fall below the average, that is negative deviation, indicating that there is some interaction between the two polymers and changes in the micromechanisms of ASA/SAN blends. 7 ,23
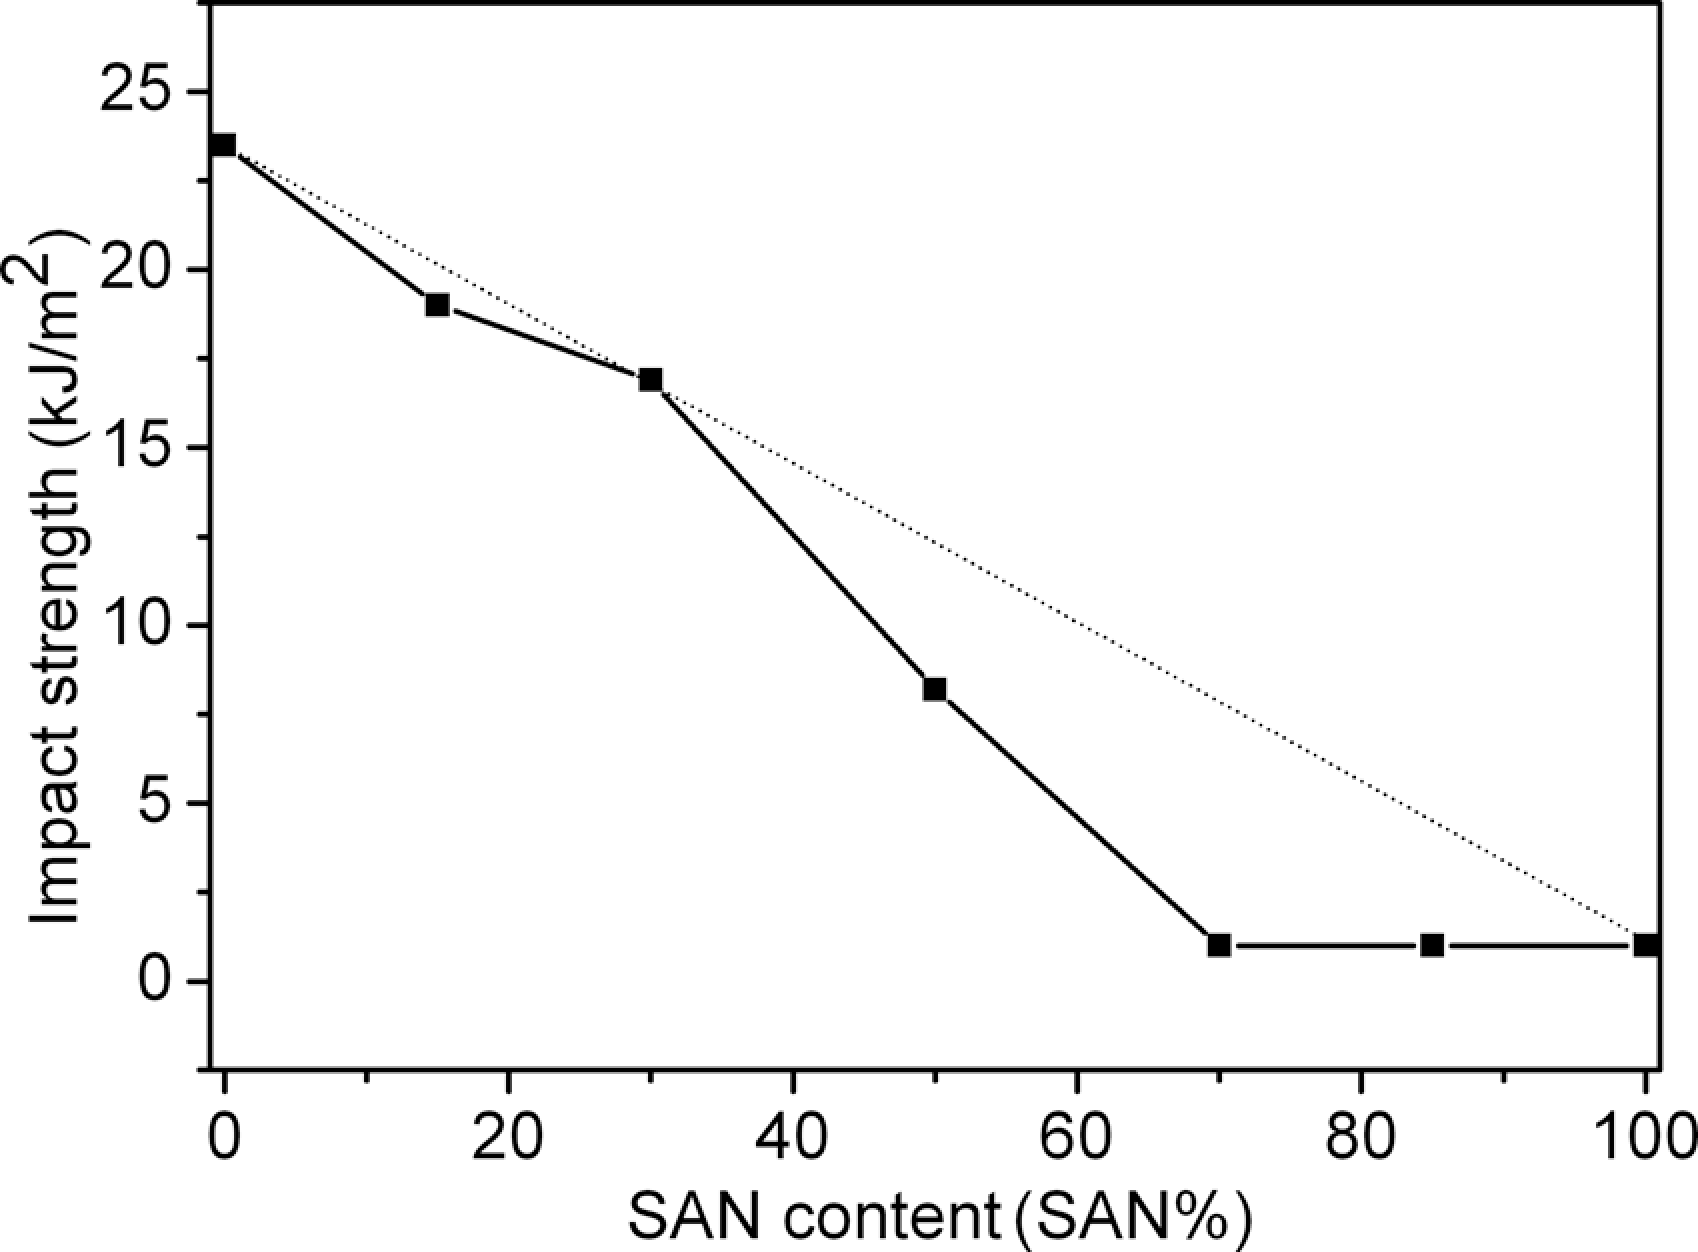
Effect of acrylonitrile–styrene–acrylic/styrene–acrylonitrile (SAN) content on Notched Izod impact strength of acrylonitrile–styrene–acrylic (ASA)/SAN blends.
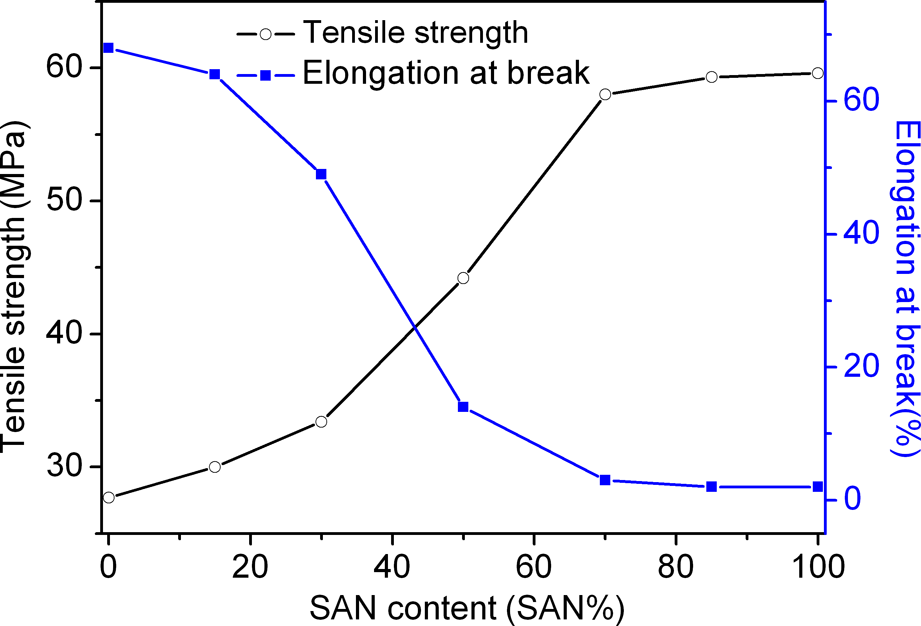
Tensile properties of acrylonitrile–styrene–acrylic/styrene–acrylonitrile (ASA/SAN) blends.
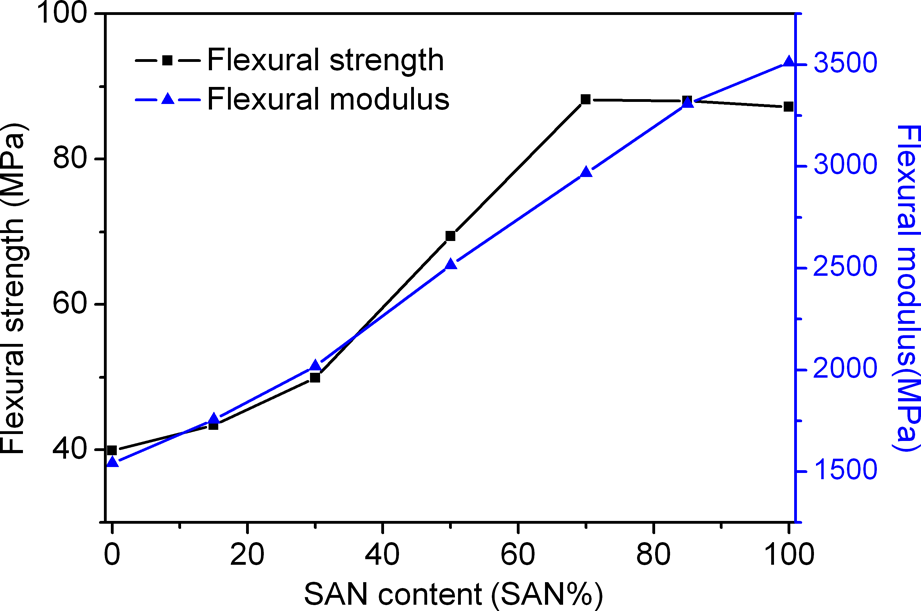
Flexural properties of acrylonitrile–styrene–acrylic/styrene–acrylonitrile (ASA/SAN) blends.
Although the toughness decreased with the incorporation of SAN, it is accompanied by an enhancement in other properties, including tensile strength, flexural strength, flexural modulus and hardness (showed in Figures 7 –9), which were used to characterize the stiffness. Tensile properties of ASA/SAN blends were carried out with a stable rate of 5 mm/min on a universal testing machine. The effect of the ratio of ASA to SAN on tensile properties was shown in Figure 7. In general, higher elongation at break is corresponding to lower tensile strength. Tensile strength increased sharply to 58.0 MPa for the blends containing 70 wt% SAN and then increased slightly. With regard to flexural strength, it parallels the variation tendency of tensile strength, exhibiting an S-shaped curve. When the content of SAN was added to 70 wt%, the flexural strength becomes 88.2 MPa, which is more than twice higher than that of pure ASA, and then it tends to level off at higher SAN content. Flexural modulus approximately linearly varied with SAN content, and a continuous increase was observed with the addition of SAN. The effect of SAN content on hardness of ASA/SAN blends was illustrated in Figure 9. It was found that the increase in SAN content led to an increase in the hardness of blends. The hardness increased from 72 Shore D to 82 Shore D; and when the content of ASA is less than 30%, the values of hardness remained at 82 Shore D. The results of mechanical properties indicated that the incorporation of relative brittle SAN into ASA increased the stiffness at the cost of the toughness of ASA, and after the content of SAN in ASA/SAN blends becomes 70 wt%, the further addition of SAN have little influence on the mechanical properties of the blends except flexural modulus.
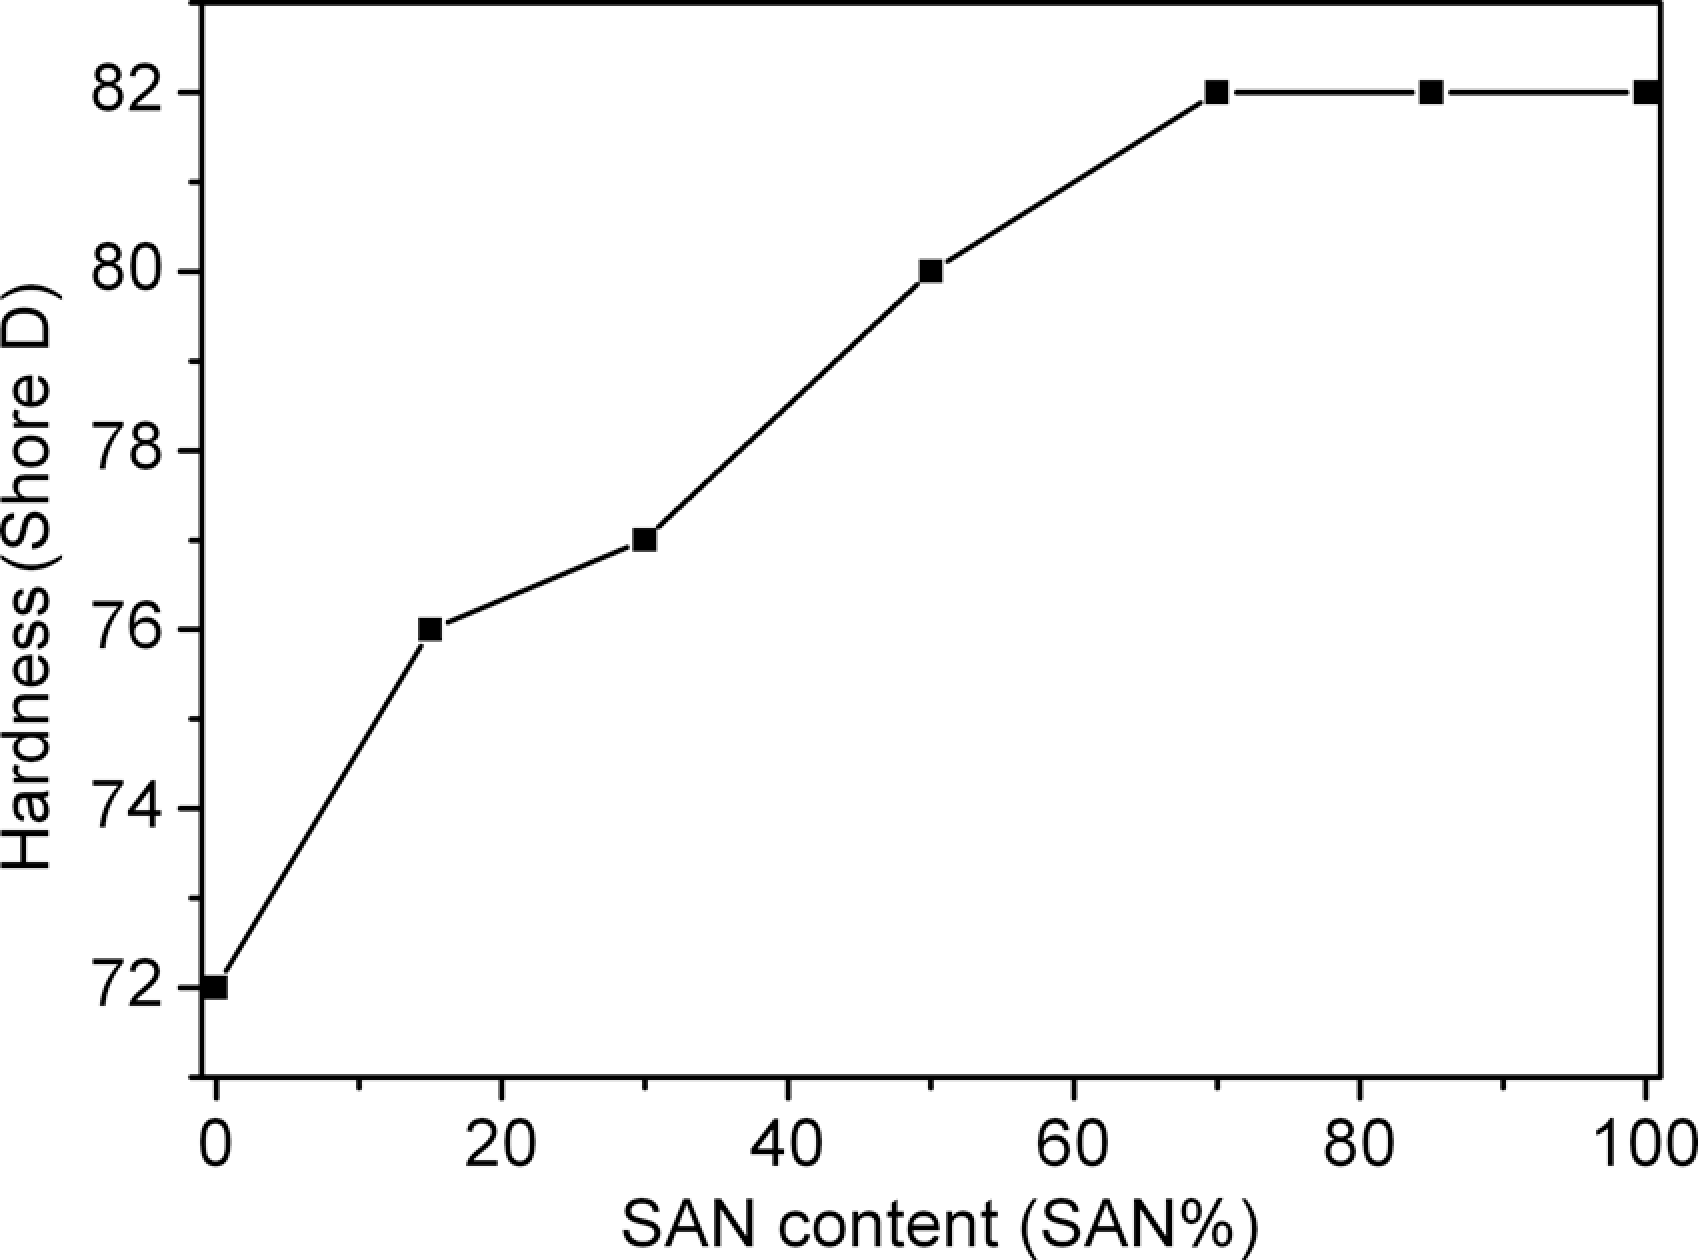
Hardness of acrylonitrile–styrene–acrylic/styrene–acrylonitrile (ASA/SAN) blends.
Melt flow rate
MFR is a measure of the melt flowing of a thermoplastic polymer. It is defined as the mass of polymer in grams flowing in 10 min through a capillary of specific diameter and length by a pressure applied via prescribed alternative gravimetric weights for alternative prescribed temperature. 11 MFR is an important parameter to evaluate the processability of ASA/SAN blends as it is inversely proportional to the viscosity of the melt. In Figure 10, MFR values of ASA/SAN blends were plotted against the SAN content. It can be seen that the MFR increased with the content of SAN; and the more SAN added, the greater the extent of MFR increase was. There may be two reasons that account for the variation in MFR: one, as mentioned above, is that the incorporation of SAN decreased the rubber content of the blend system, so the viscosity decreased with the addition of SAN. Since MFR is inversely proportional to viscosity, the value increased with the SAN content. The other is that SAN is a resin with relative good fluidity, and the more SAN added must lead to the increase in MFR.
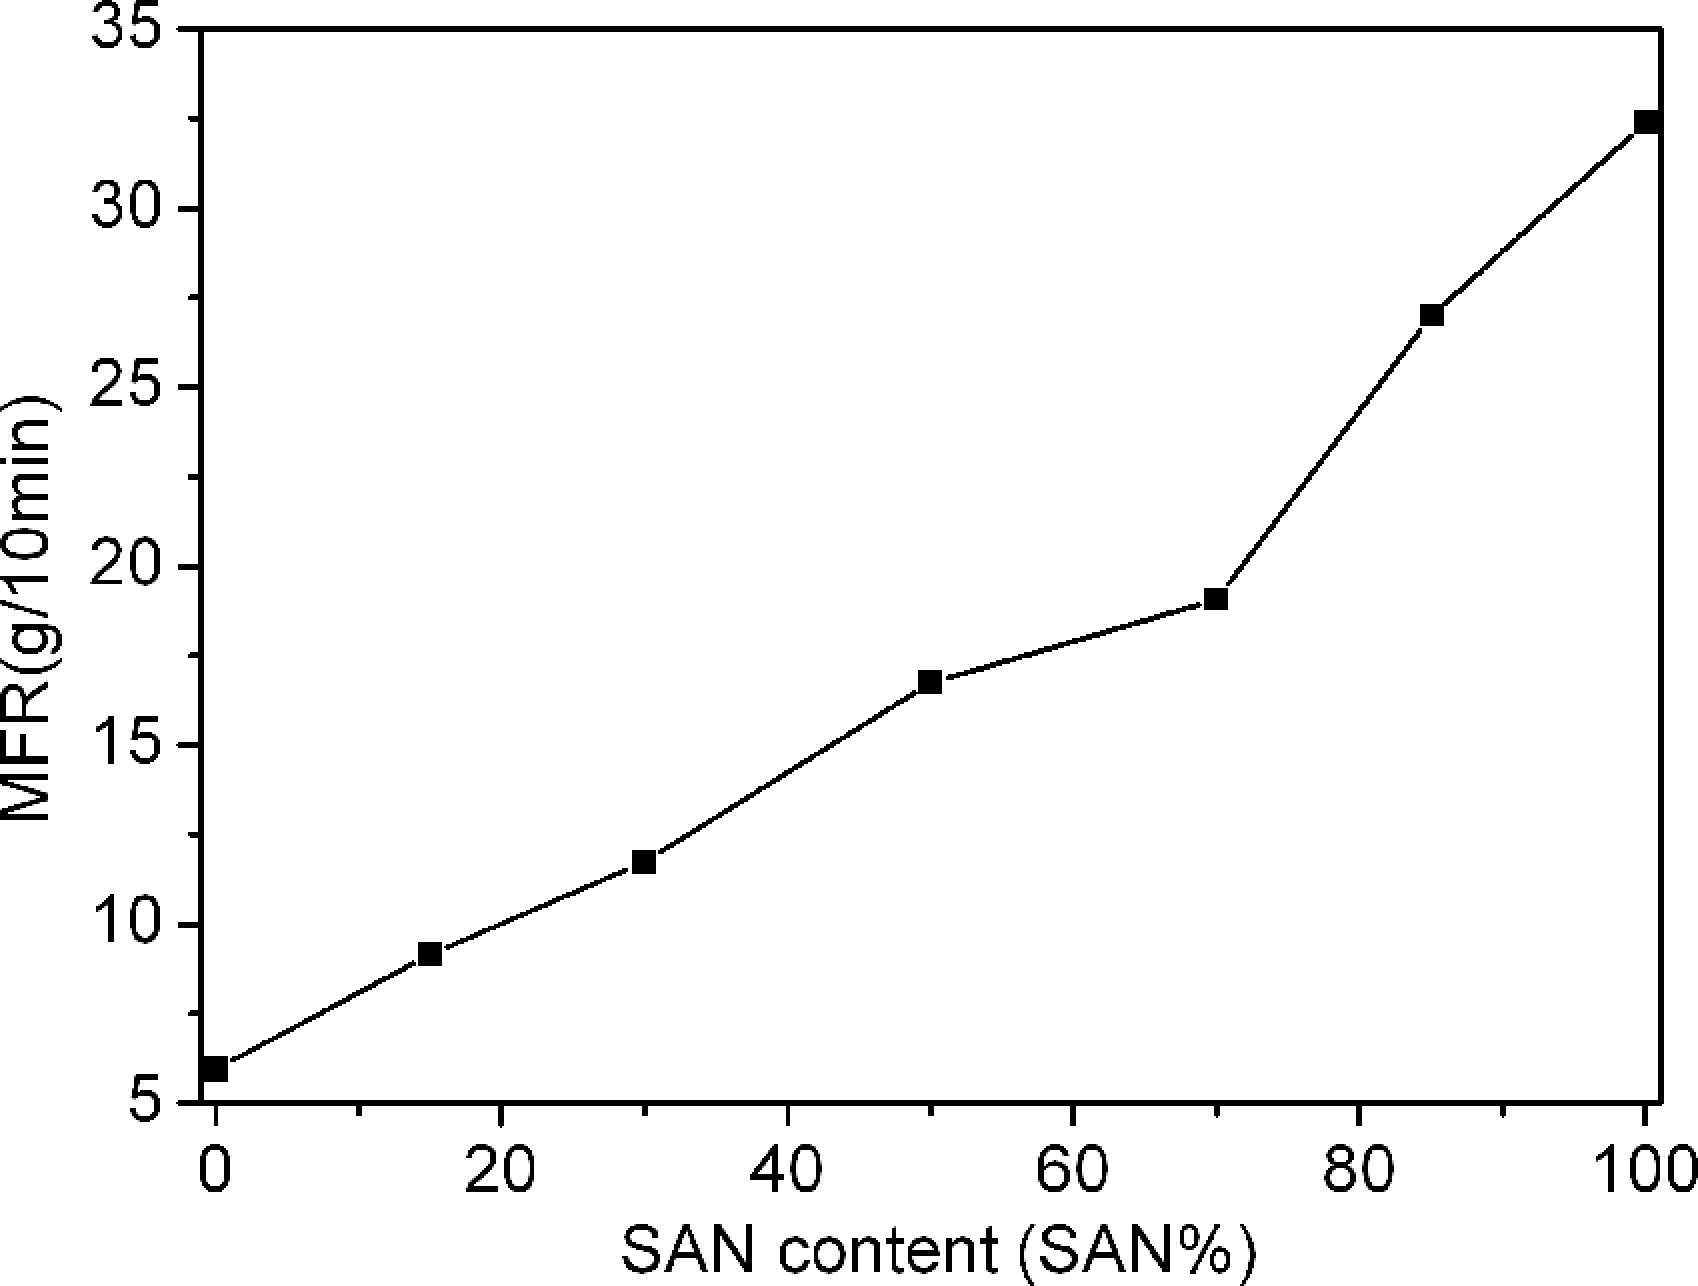
Melt flow rate (MFR) of acrylonitrile–styrene–acrylic/styrene–acrylonitrile (ASA/SAN) blends.
Scanning electron microscopy analysis
SEM was used to investigate the morphology of impact-fractured surfaces of ASA/SAN blends with different weight fractions. Since ASA is a core shell structure containing a grafted SAN shell, it is considered to have a good interfacial adhesion to SAN. 11 As shown in Figure 11, ASA/SAN system was a compatible one since no evident phase separation was observed and the results certified the ‘good miscibility’ assumption in the analyses of DSC and DMTA. It can be seen that the weight fraction of SAN contained in the blends had significant influence on the morphologies of ASA/SAN blends. In general, the impact-fractured surfaces with thread-like morphology indicated good toughness with relative high impact strength and high elongation at break. On the contrary, smooth impact-fractured surfaces were representative of the low toughness of materials with low impact strength and low elongation at break. With respect to ASA/SAN blends prepared in this work, two different types of morphology were observed from SEM micrographs. The surface of ASA-rich blends (Figure 11A and B) is rough, indicating ductile fracture under the impact load, but SAN-rich blends (Figure 11D and E) showed brittle fracture, and the morphology showed continuous transformation along with the increase in SAN. SEM analysis established the relationship between microstructure and properties, and the results obtained from SEM analysis are in great agreement with that of mechanical properties of the blends.
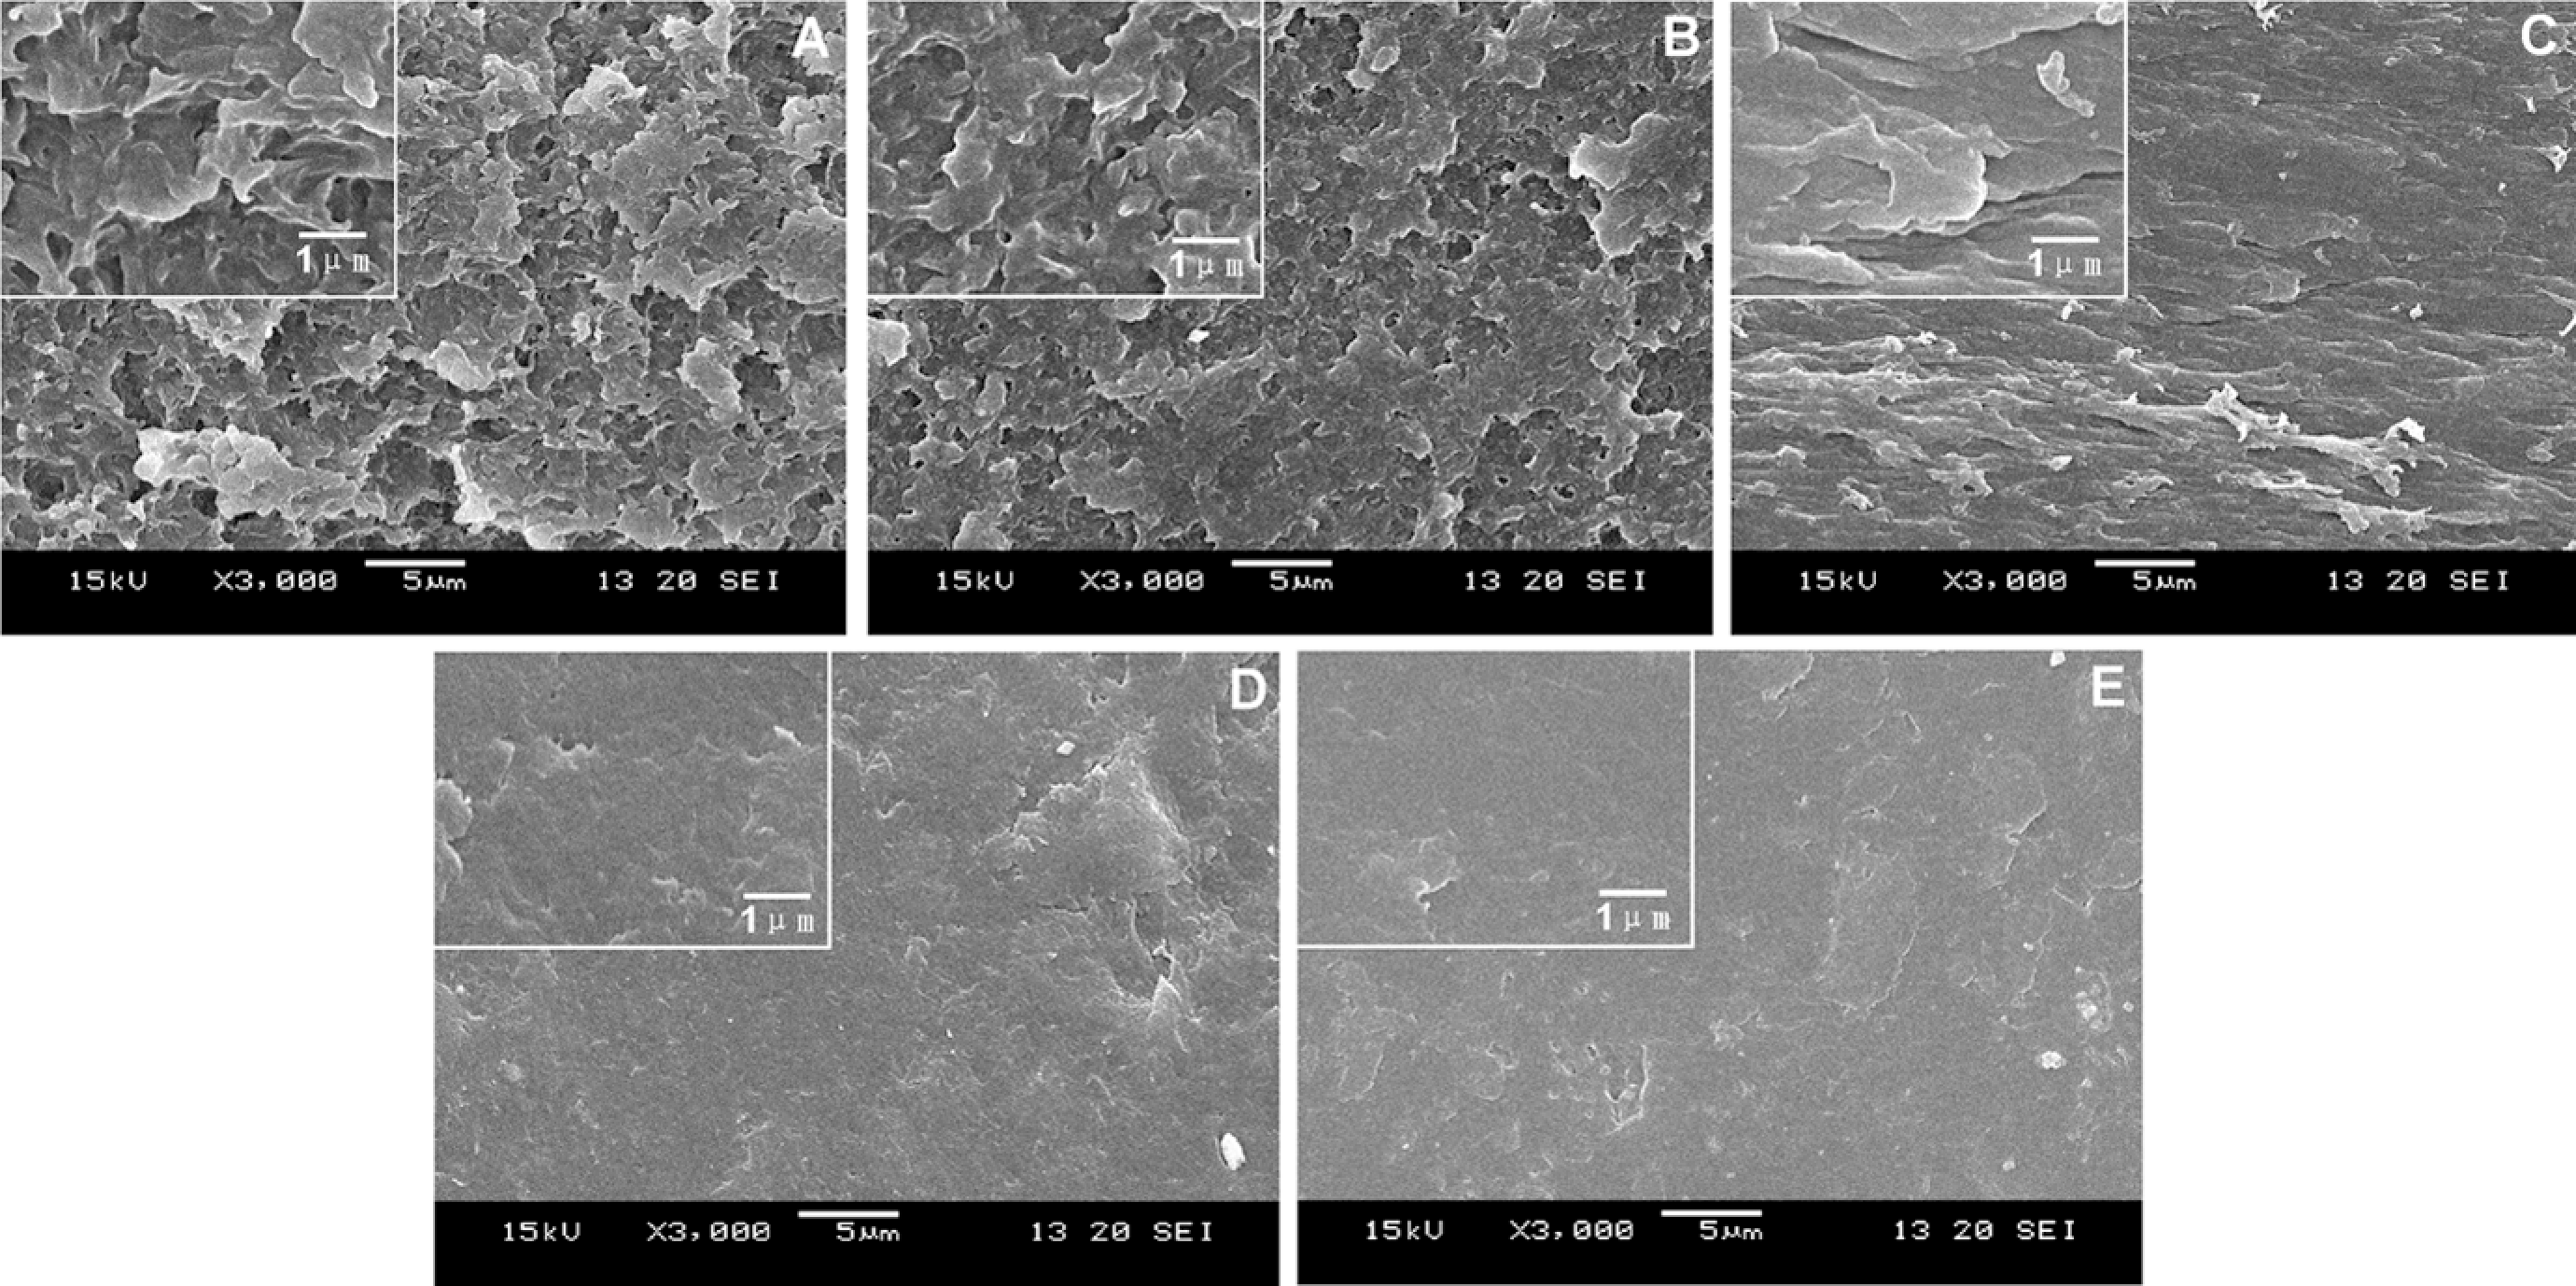
Scanning electron microscopy (SEM) micrographs of acrylonitrile–styrene–acrylic/styrene–acrylonitrile (ASA/SAN) blends with the different compositions of ASA/SAN: (A) 100/0, (B) 70/30, (C) 50/50, (D) 30/70 and (E) 0/100.
Conclusions
ASA/SAN binary blends with different composition were prepared by melt blending. The binary blends showed a single T g according to the results of DSC and DMTA, indicating that ASA/SAN blends may be miscible. And the results of SEM certified the assumption, since no obvious phase separation was observed. With respect to FTIR analyses, no evident shift in wave number of the characteristic groups indicated that no strong interactions exist in ASA/SAN blends. Addition of SAN into ASA decreased the impact strength, elongation at break with increased tensile strength, flexure strength and modulus. Furthermore, the HDT, hardness and processability enhanced with the incorporation of SAN.
According to the results, when SAN content is more than 70 wt%, the impact strength, that is toughness of the prepared blends decreased significantly although the heat resistance increased to some extent. In further work, methods to improve the toughness of ASA/SAN blends may be explored.
Footnotes
Funding
The financial support for this work was provided by the Scientific Achievement Transformation of Jiangsu Province (BA2010017) and the Priority Academic Program Development of Jiangsu Higher Education Institutions.