
Abstract
This study deals with the electrical characterization of polyethylene oxide (PEO) – alumina (Al2O3) composites at several concentrations, 0%, 5%, 10%, and 15% by weight Al2O3. The alternating current electrical properties were studied as a function of frequency in the range from 20 Hz to 1 MHz and studied with filler concentrations. Transmission light microscopy (TLM) and scanning electron microscopy (SEM) revealed that the dispersed Al2O3 particles were randomly distributed within the PEO matrix with some surface contacts between them and also revealed that the ceramic particles are tightly held by the host matrix material. The melting temperature, Tm, was determined for the composites via differential scanning calorimetry (DSC). The AC electrical properties (impedance, real part of impedance, imaginary part of impedance, dissipation factor, dielectric constant, real part of electric modulus, imaginary part of electric modulus, electrical conductivity, and relaxation time) were determined. It was found that the applied frequency and filler concentrations affected the AC electrical properties of the composites. The universal power-law of alternating current conductivity wasobserved in the PEO/Al2O3 composites. The calculated power exponent (n < 1) is physically acceptable within this applied model.
Introduction
Polymer-ceramic composite have recently attracted considerable attention due totheir improved mechanical stabilities and enhanced ionic conductivities. 1 Theinterest in solid materials with ionic conduction properties has become significant during the last few years due to their application in solid-state batteries and electrochromic devices. Among the most-studied polymer electrolytes is poly (ethylene oxide), which has been investigated due to its stability, high ionic conductivity in the amorphous phase, high capacity in salt complexation, mechanical flexibility, and corrosion resistance; however, these materials present low values ofionic conductivity (10-6 – 10-7 s/cm) at room temperature in the solid state.2,3 The polyethylene oxide (PEO) polymer structure is important for the ionic conductivity due to the interaction with the ions and the mobility of the segments of the polymer chain. So, PEO is most widely studied as polymer host and has a particular efficiency in co-ordinating cations, because of the spatial distance and orientation of the ether oxygen atoms in the polymer chain. 4
To enhance the ionic and mechanical properties, various attempts have been madein the past decade by the addition of different fillers, with the later leading to formation of composite polymer electrolytes. Several ceramic fillers, like SiO2, TiO2, alumina (Al2O3) etc., have been tried to achieve high conductivity. 2 Addition of ceramic fillers in PEO polymer has been known to give rise to improved physical properties of these ceramic polymer composites, among these fillers is alumina Al2O3. 5 Al2O3 is an inorganic material that has the potential to be used as particulate filler material in various polymer matrices. It is hard, wear resistant, has excellent dielectric properties, high strength and stiffness, and resistance to strong acid and alkali attack at elevated temperatures. Al2O3, in particular, has been of great interest in various application areas such as catalysis, coatings, microelectronics, and thin-film devices.6,7 Measurement of AC conductivity can be done by several techniques; here, we used the complex impedance spectroscopy technique. This method also gives information on electrical properties of materials and their interface with electronically conducting electrodes. The complex impedance spectroscopy measurement of AC conductivity is based on the measurement of cell impedance over a range of frequencies and analyzing them in the complex impedance plane.8,9
The physical behavior of polymer composites depends on a number of factors,including the filler type or structure and sample preparation methods. Understanding the chemical and physical nature of these factors on the composites structure helps greatly to evaluate and interpret the conduction mechanism taking place in the composite bulk.10–13 Many studies have shown that the polymer composites depend on these factors.14–23
In this work, we describe the AC electrical properties of PEO/Al2O3 composites measured through the powerful impedance technique. Transmission light microscopy (TLM), scanning electron microscopy (SEM), and differential scanning calorimetric (DSC) were also utilized. The AC electrical properties including the real and imaginary part of impedance, dissipation factor, real part of permittivity, real and imaginary part of electric modulus, electrical conductivity, and relaxation time were determined.
Experimental work
Composite preparation
The composite was prepared in The Institute of Chemistry and Polymer Technology (ICTP) CNR-Possouli, Napoli, Italy. Composites with the following PEO (Mw = 300,000)/Al2O3 weight ratios (100/0, 95/5, 90/10, 85/15) were prepared by melt mixing the components in a Brabender-like apparatus (Rheocord EC of Haake Inc.) at a temperature of 180 ± 5°C with a residence time of 5 min at 32 rpm. After mixing, the materials were compression-molded at 180°C in a common heated press to obtain sheets with a thickness of 1 mm.
Electrical measurement
Electrical measurements were performed in AC mode using an HP 4284a impedance analyzer at room temperature with voltage amplitude of 1.4 V over a frequency range from 20 Hz to 1 MHz. After curing, the samples were removed from the cavities, polished, and contacted for conductivity measurements by coating with conductive silver paint. For electrical analyses, the samples were prepared in the form of plates having 10 × 10 × 1 mm dimensions
Transmission light micrograph measurement
The light micrographs were taken in transmission mode of 1-mm thick samples at amagnification of 100 with a standard Leitz light microscope.
Scanning electron micrograph measurement
The SEM images were taken using a Leo (Zeiss) 1530 with a field emission cathode backscatter detector (resolution of 1 nm at 30 kV) up to 700,000 magnifications with an accelerating voltage of 0.1 kV to 30 kV. For cross-section analysis, the composite samples were frozen and fractured in liquid nitrogen. All samples were coated with gold before analysis.
Differential scanning calorimetry measurement
The DSC thermal analysis was executed with a NETZSCH DSC 204 F1 Phoenix® on 6–10 mg of the PEO/Al2O3 composite sealed in aluminum pans. All thermograms were obtained in the temperature range from –50°C to 100°C, at a cooling rate of 10°C/min from room temperature to –50°C, and then heated at 10°C/min from –50°C to 100°C, under nitrogen flux.
Electrical measurements fundamentals
Impedance is a more general concept than resistance because it takes phase differences into account. In AC, the resistance, R, is replaced by the impedance, Z, which is the sum of resistance and reactance. Impedance can be written as:


With phase angle ϕ= tan–1(Z″Z′) and |Z| = [(Z′) 2 + (Z″) 2 ]1/2.
The dielectric constant ε′ and the dielectric loss ε″ of the sample can be calculated from the following equations:
[= 0.08085A/d pF], A is the area and d is the thickness of the sample.
The real and imaginary part of electric modulus M* was calculated from the relation:

AC conductivity was calculated using the relation:
Results and discussions
Figure 1 shows the TLM micrographs for 15 wt.% Al2O3 composite, which is takenas a typical example to show the influence of content on the dispersion. The average interparticle distance gets smaller, and some agglomerates are formed. The dispersed Al2O3 particles are randomly distributed within the PEO matrix with some surface contacts between them for the higher concentrations.
Transmission light micrographs for 15 wt.% Al2O3 composite.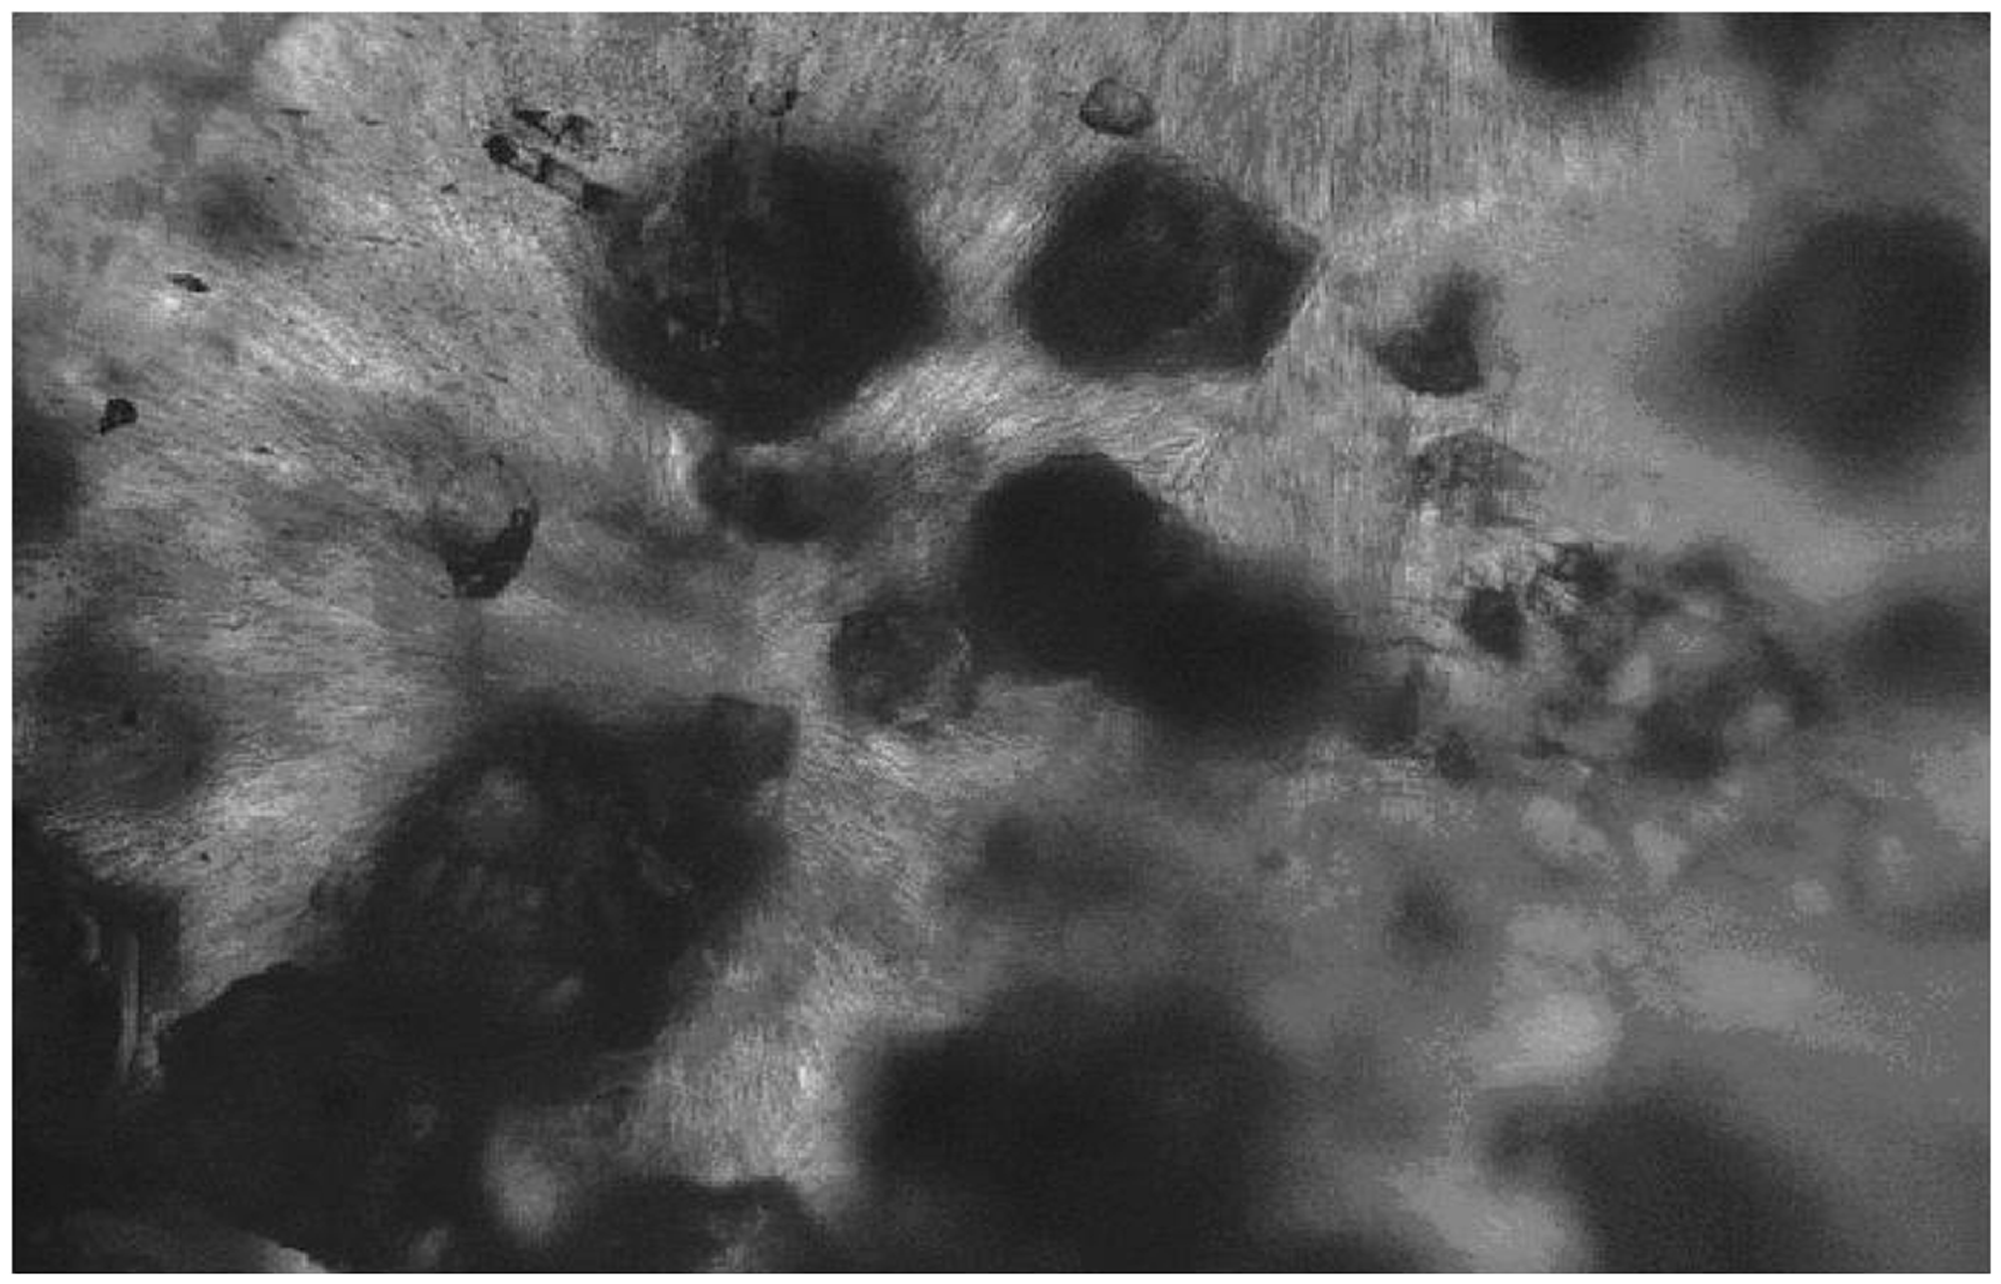
From the SEM study, some information may be inferred about strength of ceramic-matrix interactions and ceramic surfaces. Extensive interfacial adhesion can also be observed using SEM analysis. Figure 2(a) and (b) show the SEM micrographs for PEO/Al2O3 composites with different shape and size of the Al2O3 particles being dispersed in the PEO matrix. It was claimed that a strong interaction occurs between ceramic and PEO resin. It was found that the ceramic particles are tightly held by the host matrix material. The Al2O3 grain size ranging from approximately 8 µm to 146 µm (as shown in Figure 2(a) and (b)) implanted in the PEO matrix reveals that the dispersion of the ceramic particles differs with particle size when the content is the same.
Scanning electron micrographs for polyethylene oxide (PEO)/alumina (Al2O3) composites; (a) 15wt.% Al2O3 (8.787 µm); (b) 15 wt.% Al2O3 (146.2 µm).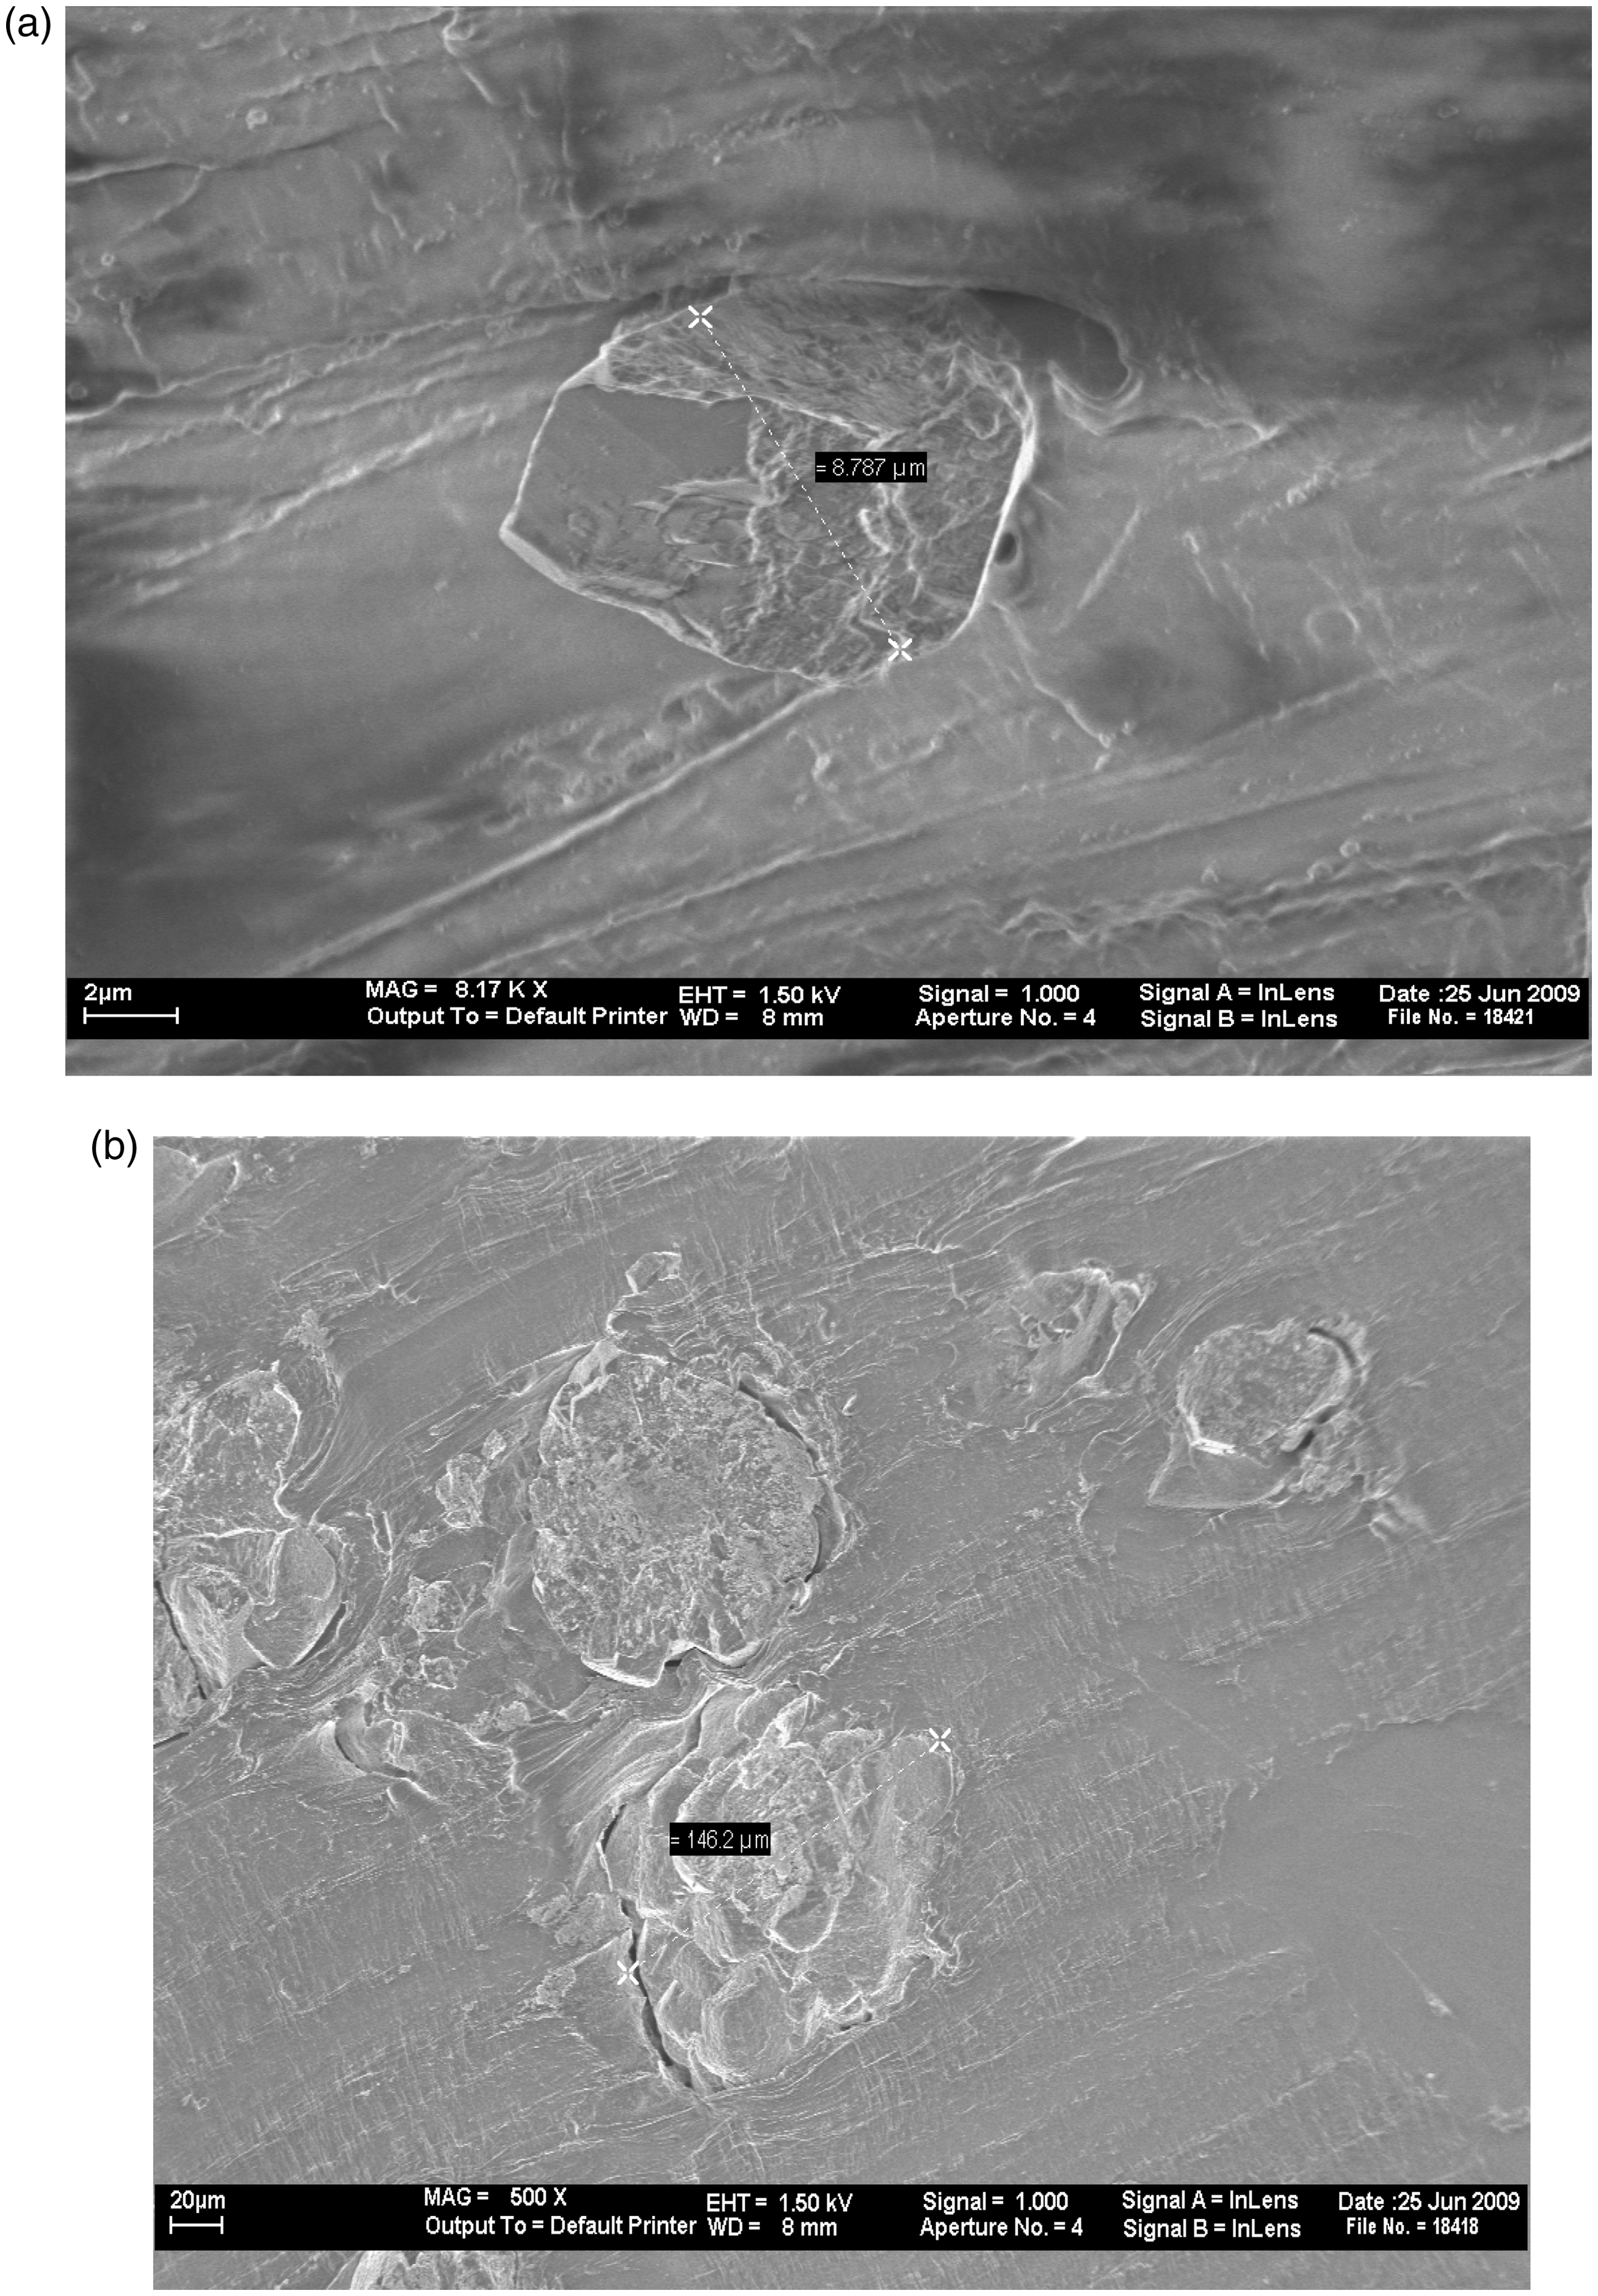
Figure 3 shows the DSC curves for the different samples investigated in this work. The heat of fusion changed slightly with filler addition with an endothermic phase transition occurring in the 60–80°C temperature range. The melting temperature, Tm, was determined for the composites as shown in the figure; the peaks represent the melting temperature values (i.e Tm for PEO is 74.3°C; 71.7°C for 5 wt.%; 74.9°C for 10 wt.%, and 70.5°C for 15 wt.% Al2O3). Priya et al. reported that change in crystal structure/morphology of composite due to the addition of filler affect the melting temperature of the polymer and due to the degree of crystal perfection.24,25 The melting temperature value of the 10 wt.% Al2O3 is 74.9°C reduced to 70.5°C for 15 wt.% Al2O3, which may be attributed to the formation of less-perfect spherulites that is, 'crystallites.'
26
Since the ceramic particles will enhance the formation of spherulite by acting as nucleation centers
5
in the 15 wt.% Al2O3 composites as a result of the strong heterogeneous nucleation effect of the Al2O3 particles, a large number of nuclei formed by the strong nucleation effect of the Al2O3 resulted in many spherulites existing in a limited space within the 15 wt.% Al2O3 composites, which made the formation of perfect spherulites difficult with increasing Al2O3 content. Therefore, the decrease in melting value with increasing Al2O3 content suggests that the crystals in 15 wt.% Al2O3 composites are less perfect than those in 10 wt.% Al2O3 composites. This leads to higher charge mobility and hence increased electrical conductivity.27–29 Itshows that the melting temperature is mostly lowered when the ceramic particles are added. The lowering of melting temperature upon filler addition has been attributed to the decrease of spherulite sizes.1,30
Differential scanning calorimetry (DSC) thermal analysis for polyethylene oxide (PEO)/alumina (Al2O3) composites.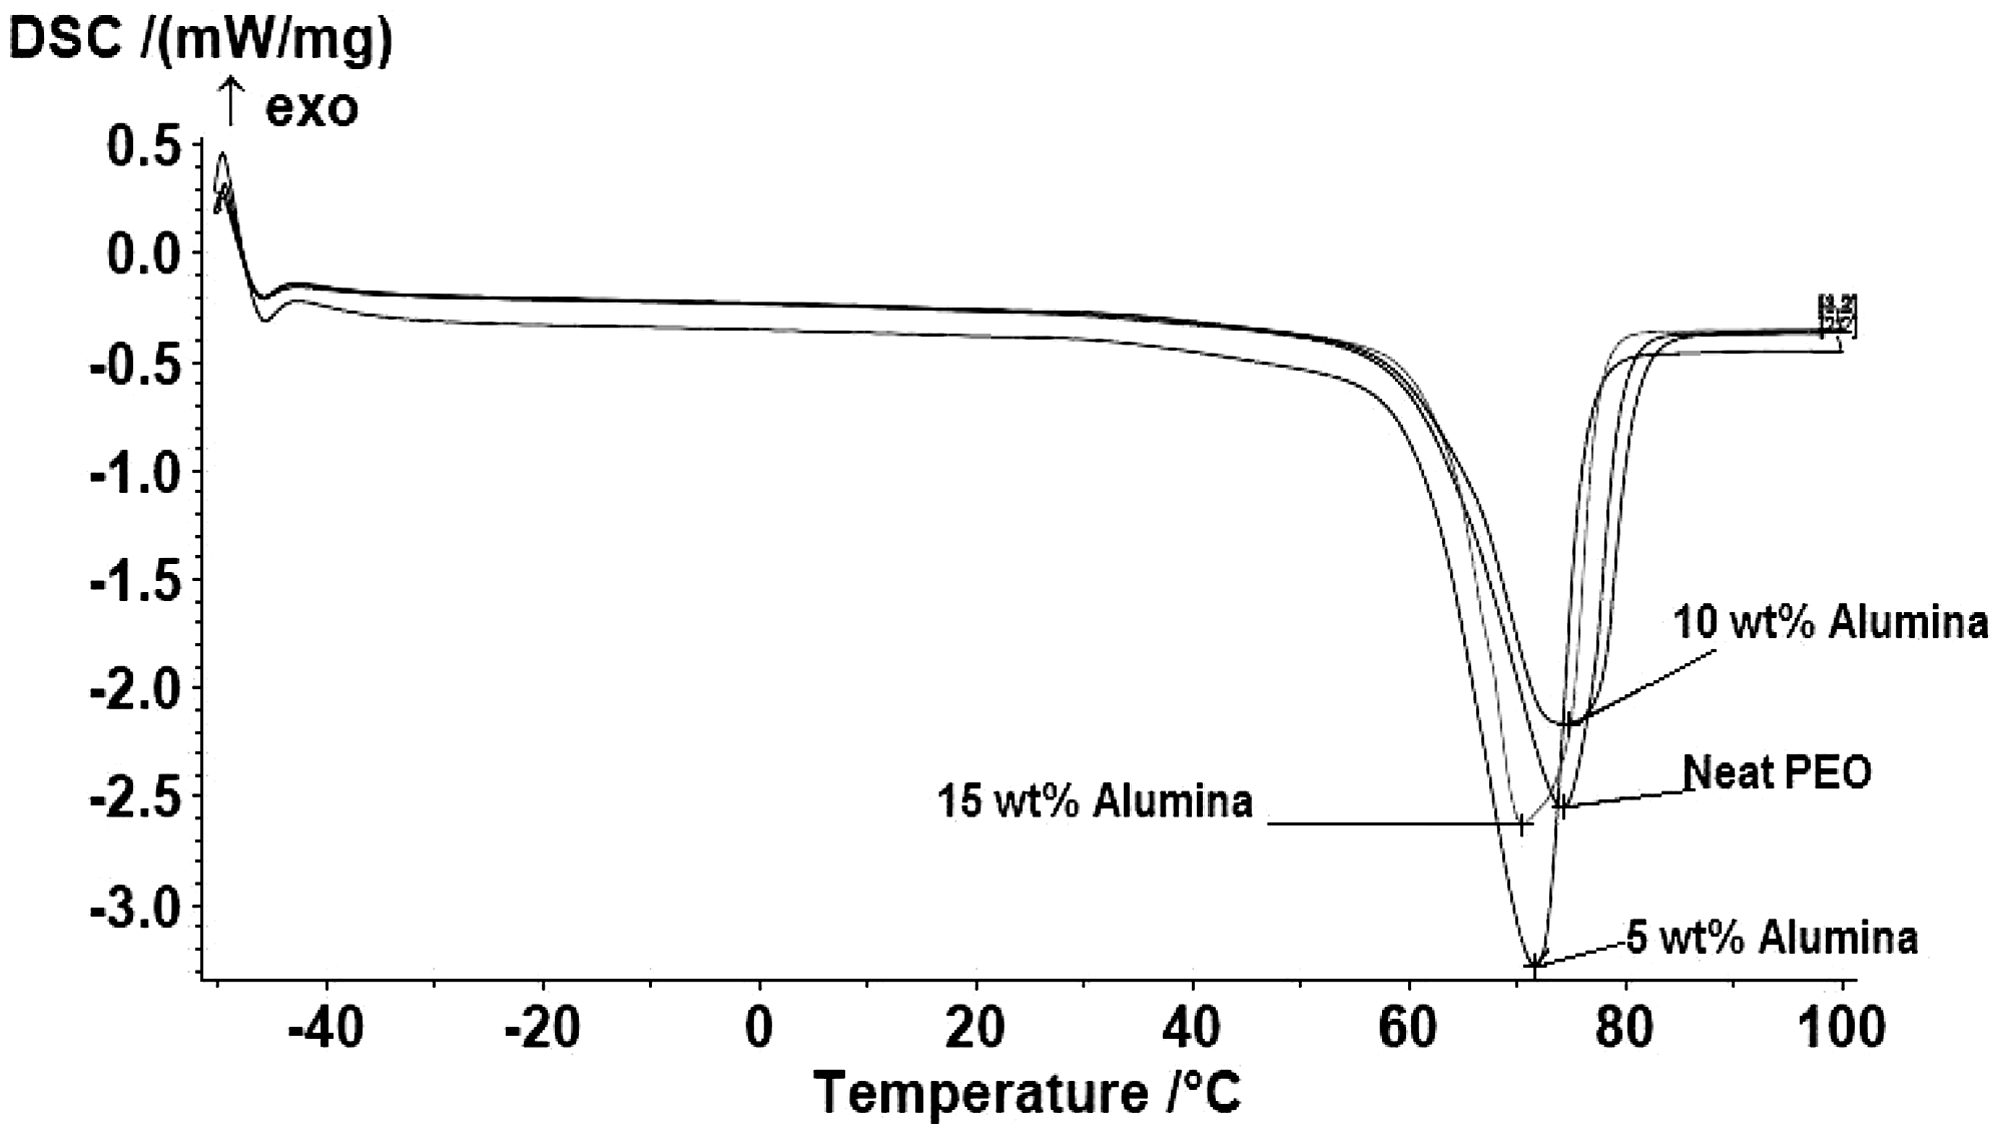
Figure 4 shows the dissipation factor (tan δ) behavior with frequency. tan δ is the ratio of an imaginary dielectric constant to the real dielectric constant and it is the measure of the electric energy loss to the electric energy stored in a periodic electric field. tan δ decreased gradually with increasing frequency, that is there is a strong dependence on frequency. High loss at low frequency in all the composites may be attributed to DC conduction losses.
31
The dissipation factor increased as Al2O3 concentration increases. The high dissipation factor is good for electromagnetic interference shielding applications.
32
Dissipation factor behavior with frequency for polyethylene oxide (PEO)/alumina (Al2O3) composites.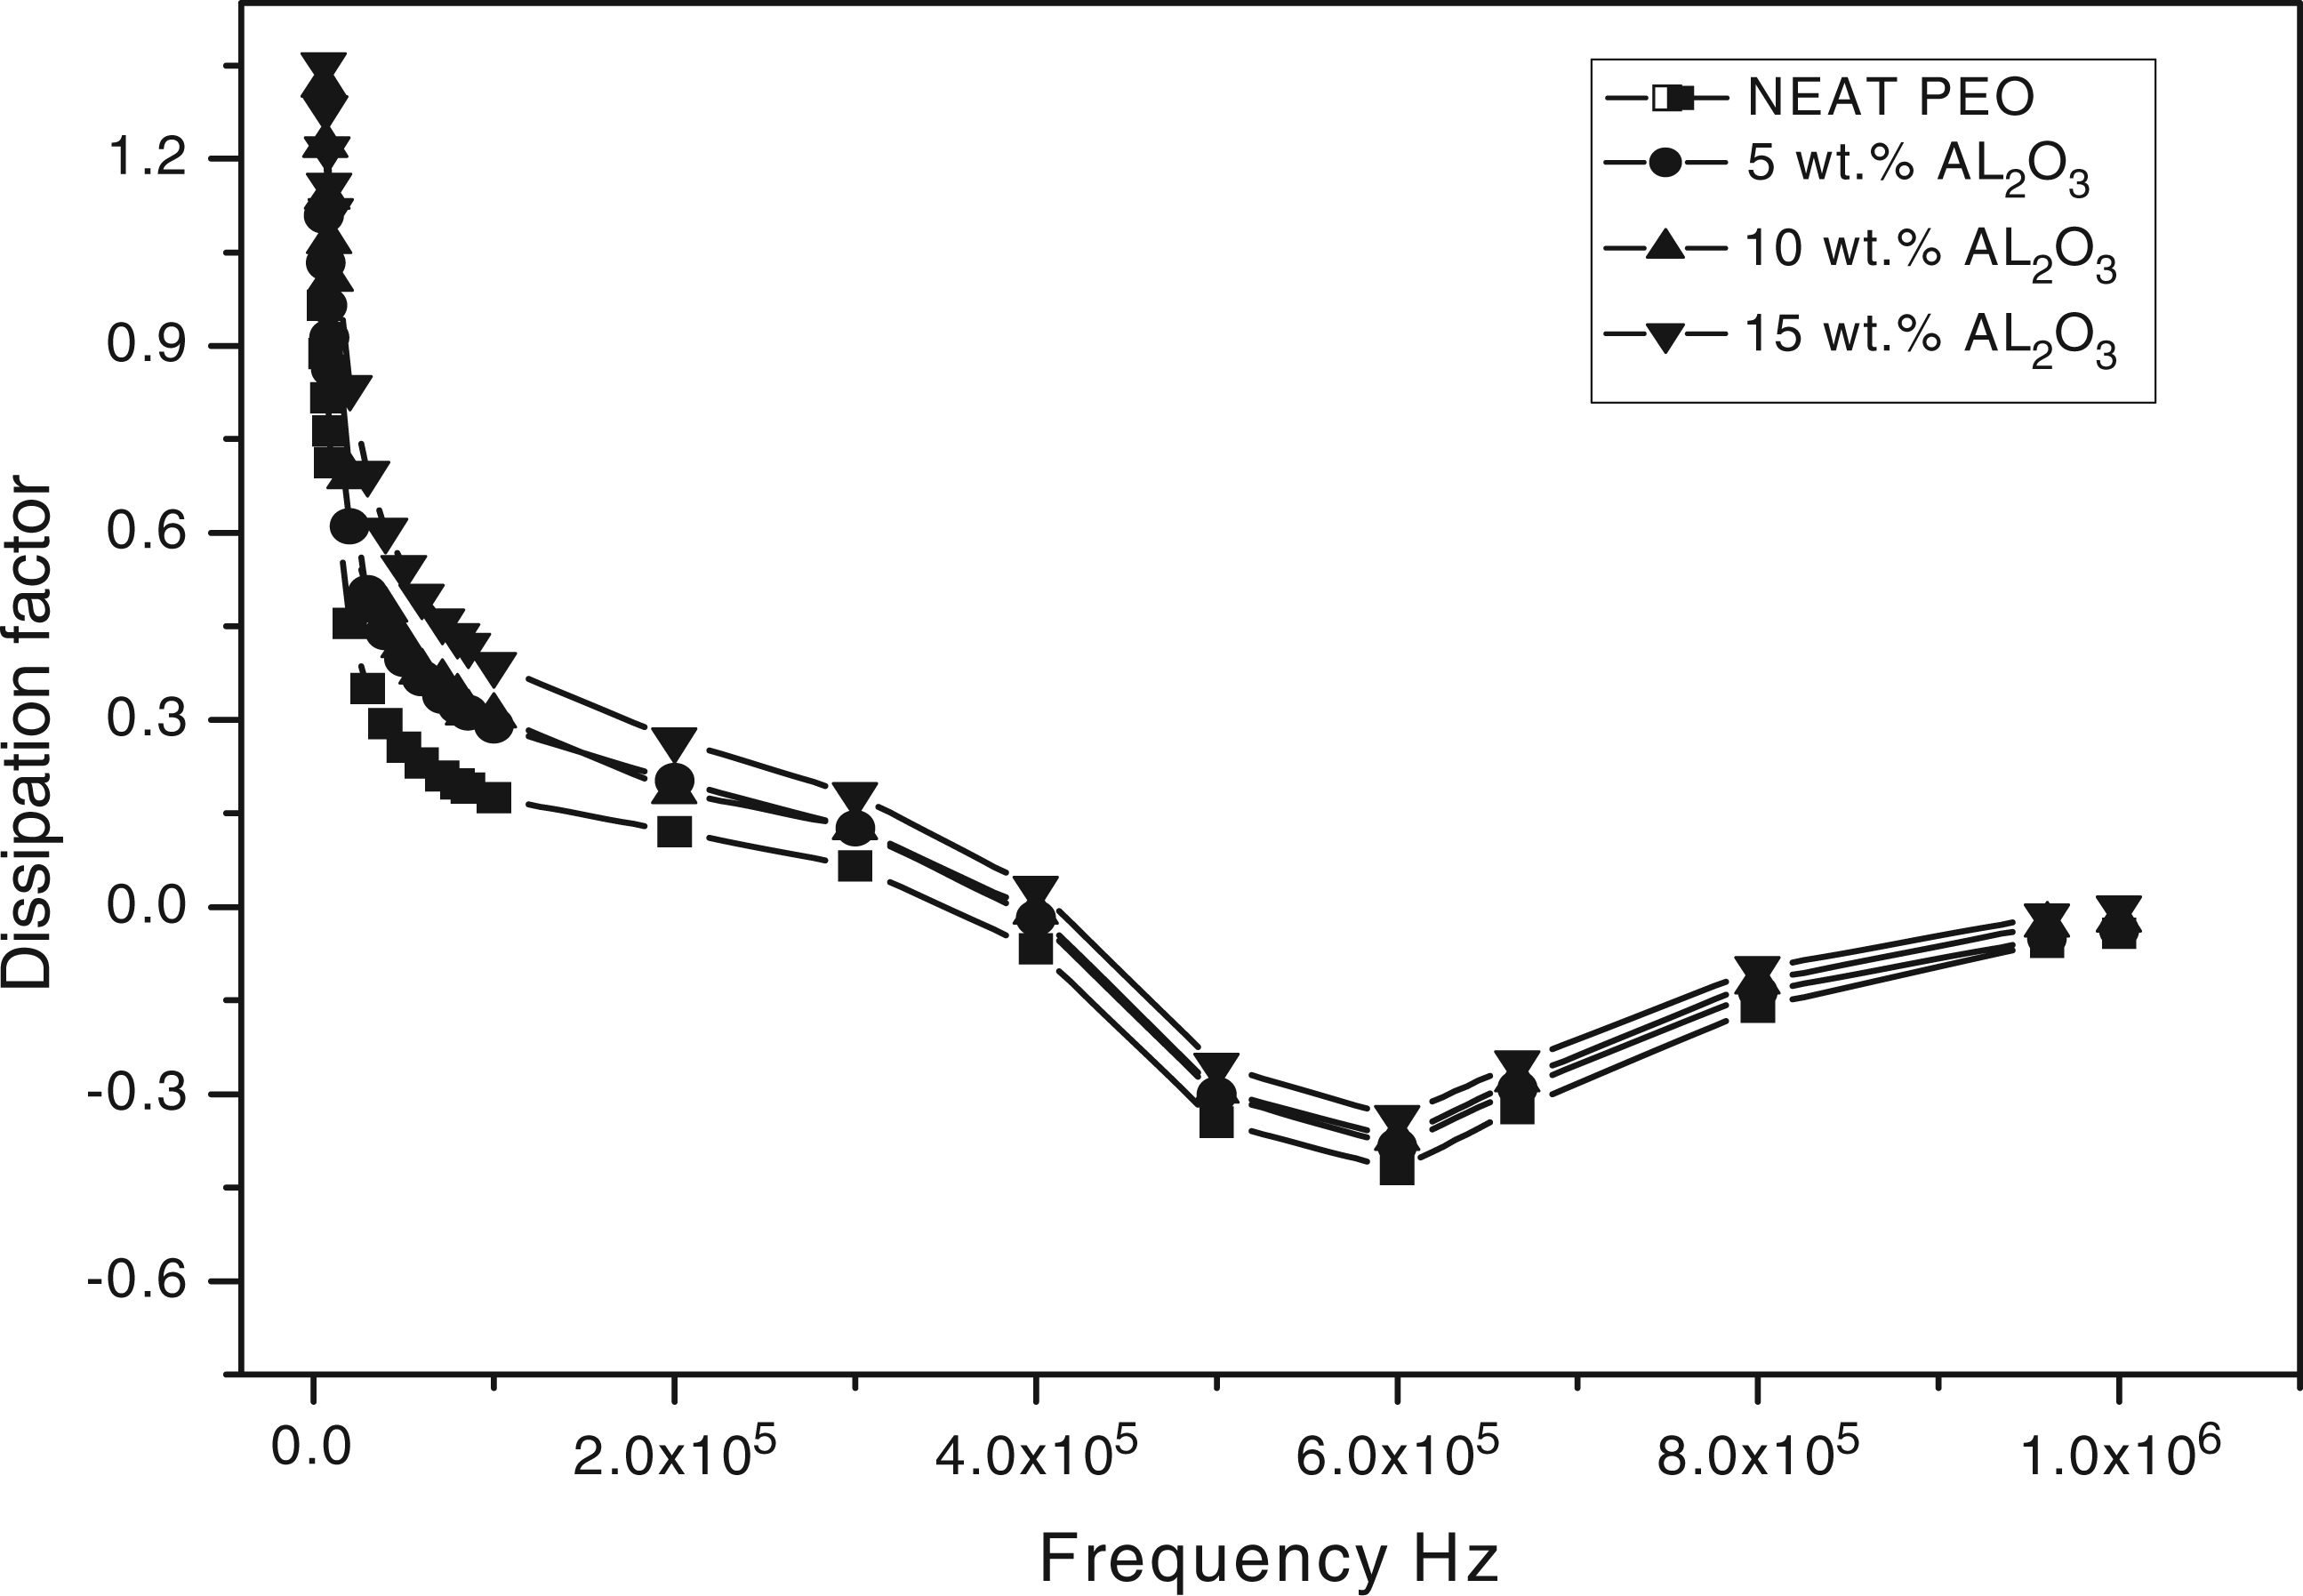
Figure 5 shows the impedance behavior with frequency. The curve shows a sharp drop of the impedance with increasing frequency. High impedance values at low frequencies may result from interfacial polarization in the matrix and from voids surrounding certain parts of the Al2O3 filler and causing some potential barriers which, in turn, increase the impedance. The potential barriers delay the dipoles rotation and, hence, reduce the effect of the orientation polarization under the applied electric field.
11
Impedance behavior with frequency for polyethylene oxide (PEO)/alumina (Al2O3) composites.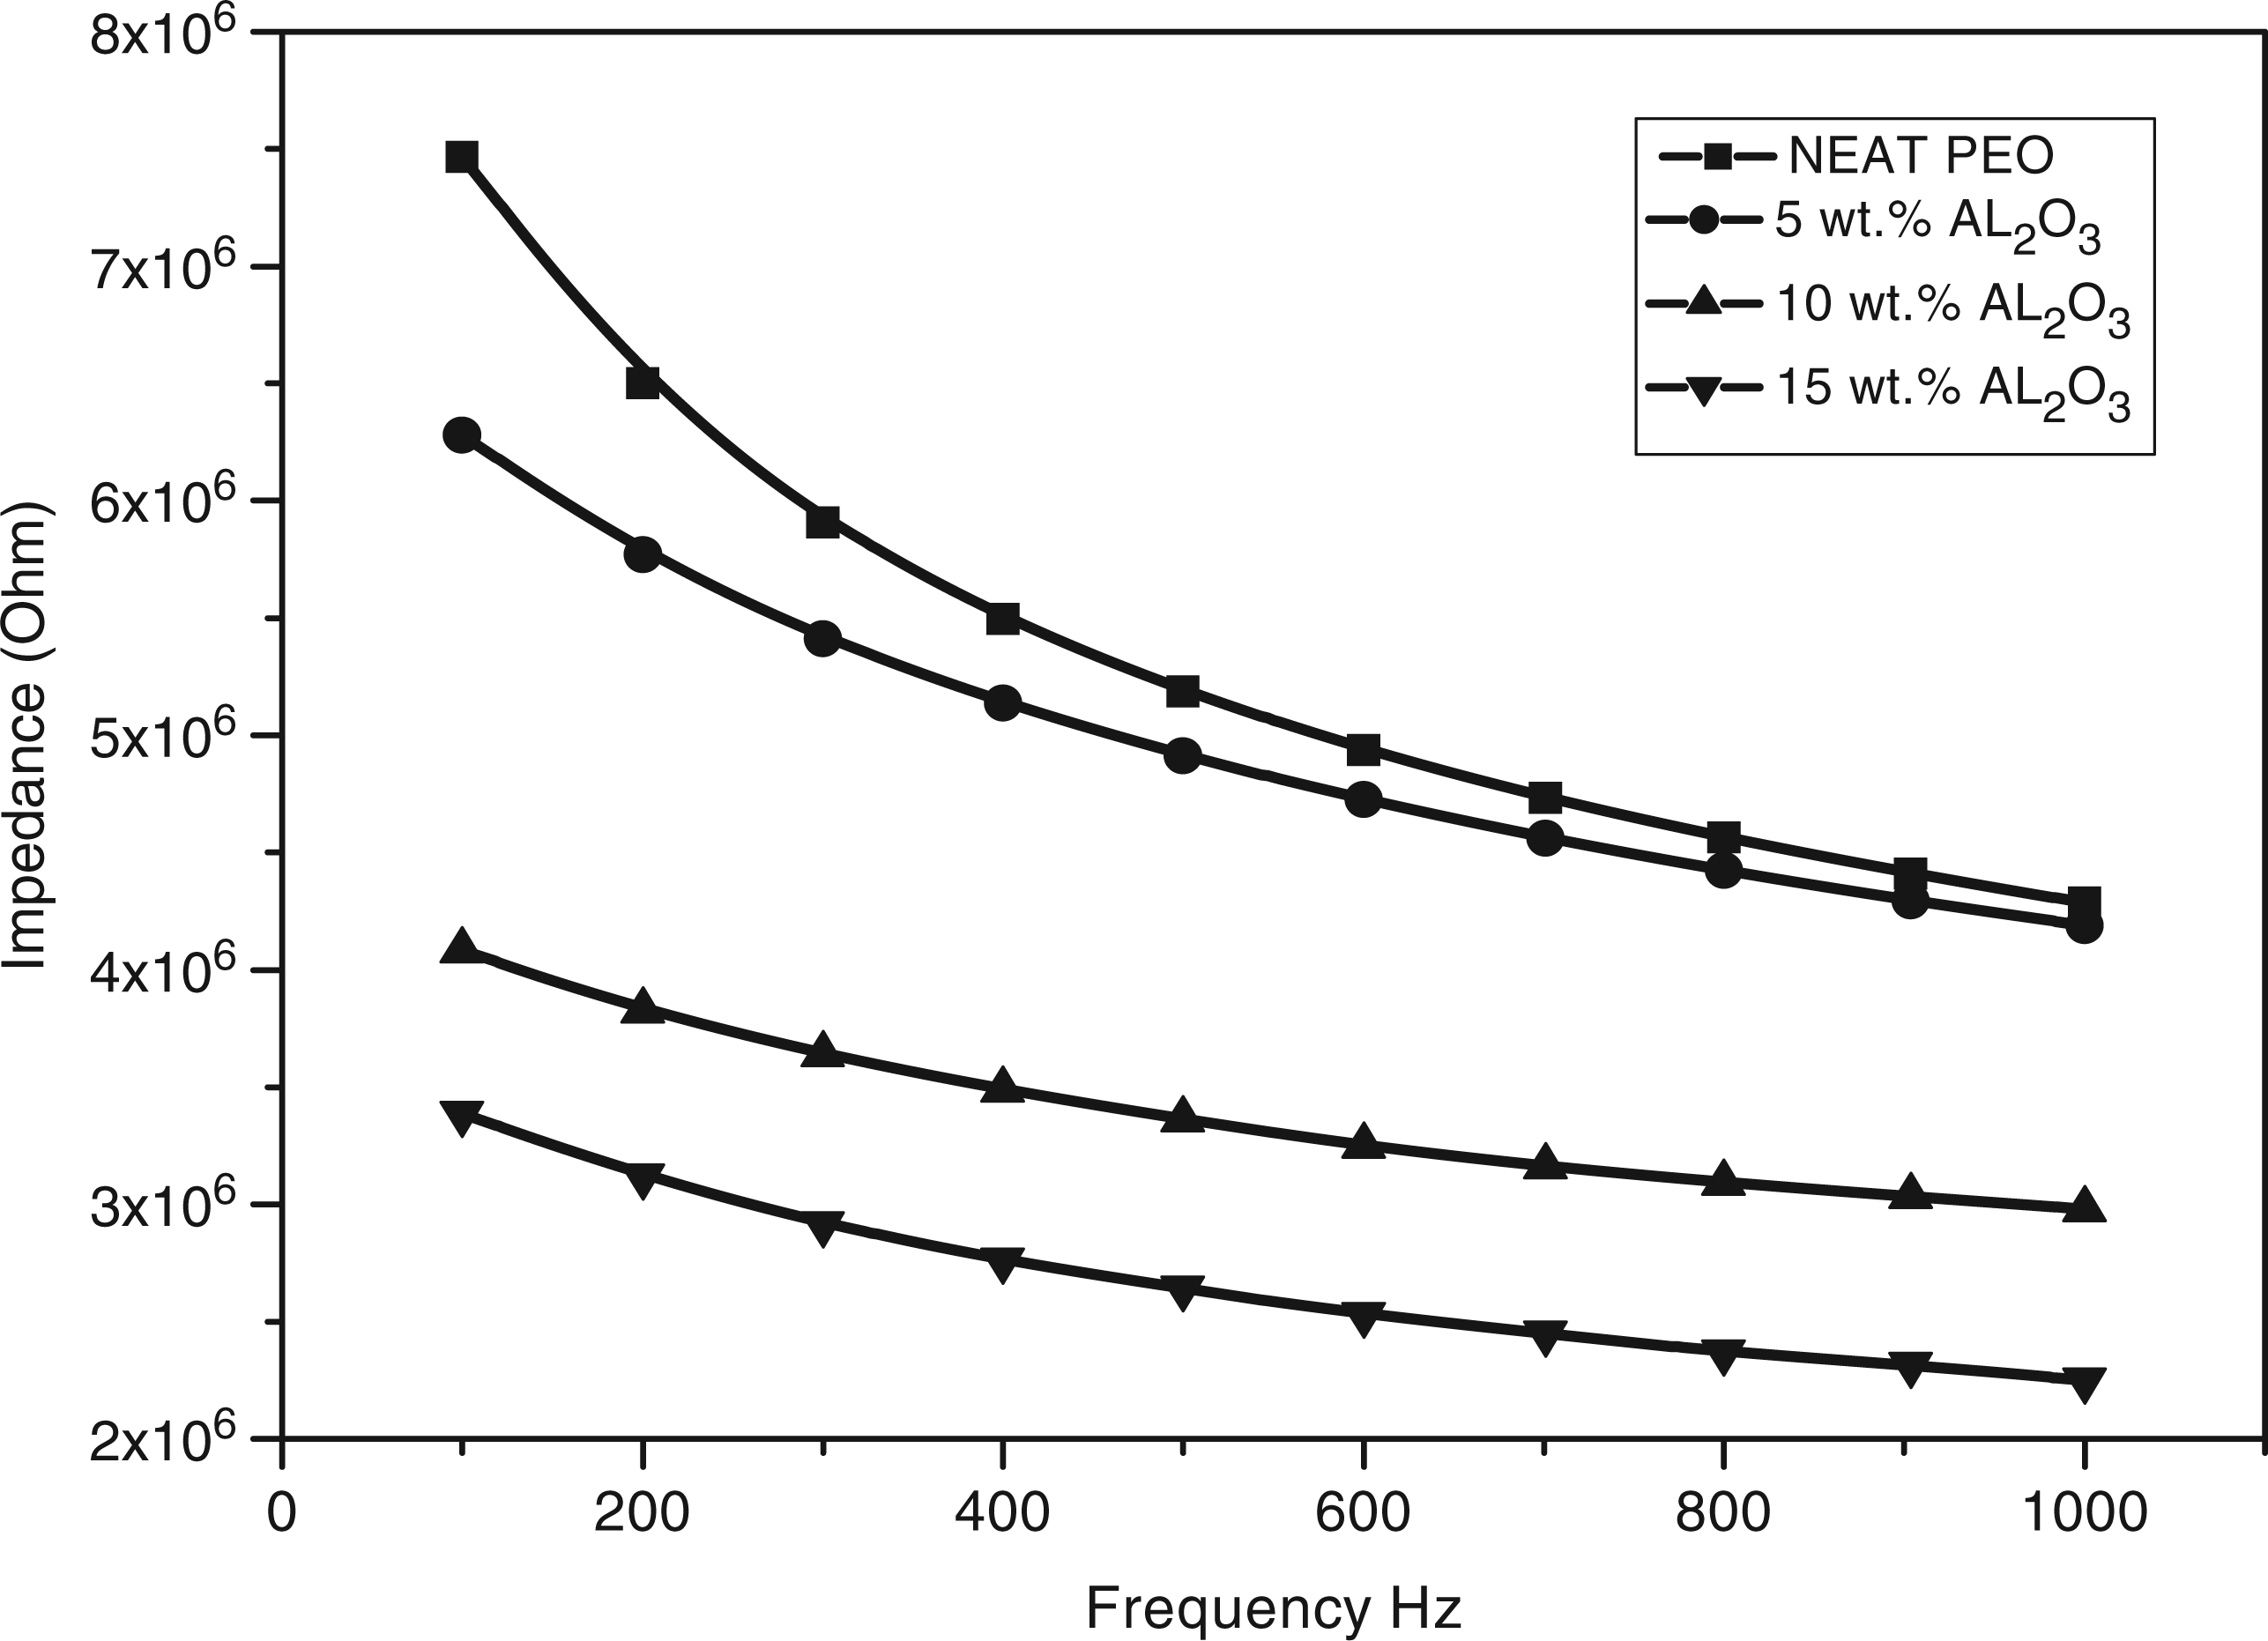
A plot of real impedance components versus imaginary components for the PEO/Al2O3 composites is shown in Figure 6. The Cole–Cole constructions yield slightly inclined and distorted semicircles. The geometrical shapes of the complex impedance plane plots indicate that the composite materials are electrically equivalent to (RC) networks that reduce to a pure resistance.
20
The distance of the extrapolated intersection with the x-axis away from the origin represents the bulk resistance. The bulk resistance decreases as the Al2O3 filler concentration increases, which corresponds to an increase in the electrical conductivity.
33
This may be related to more charge carriers being able to translate within the matrix, resulting in the decrease in the bulk resistance.
Plot of real impedance components vs imaginary components for the polyethylene oxide (PEO)/alumina (Al2O3) composites.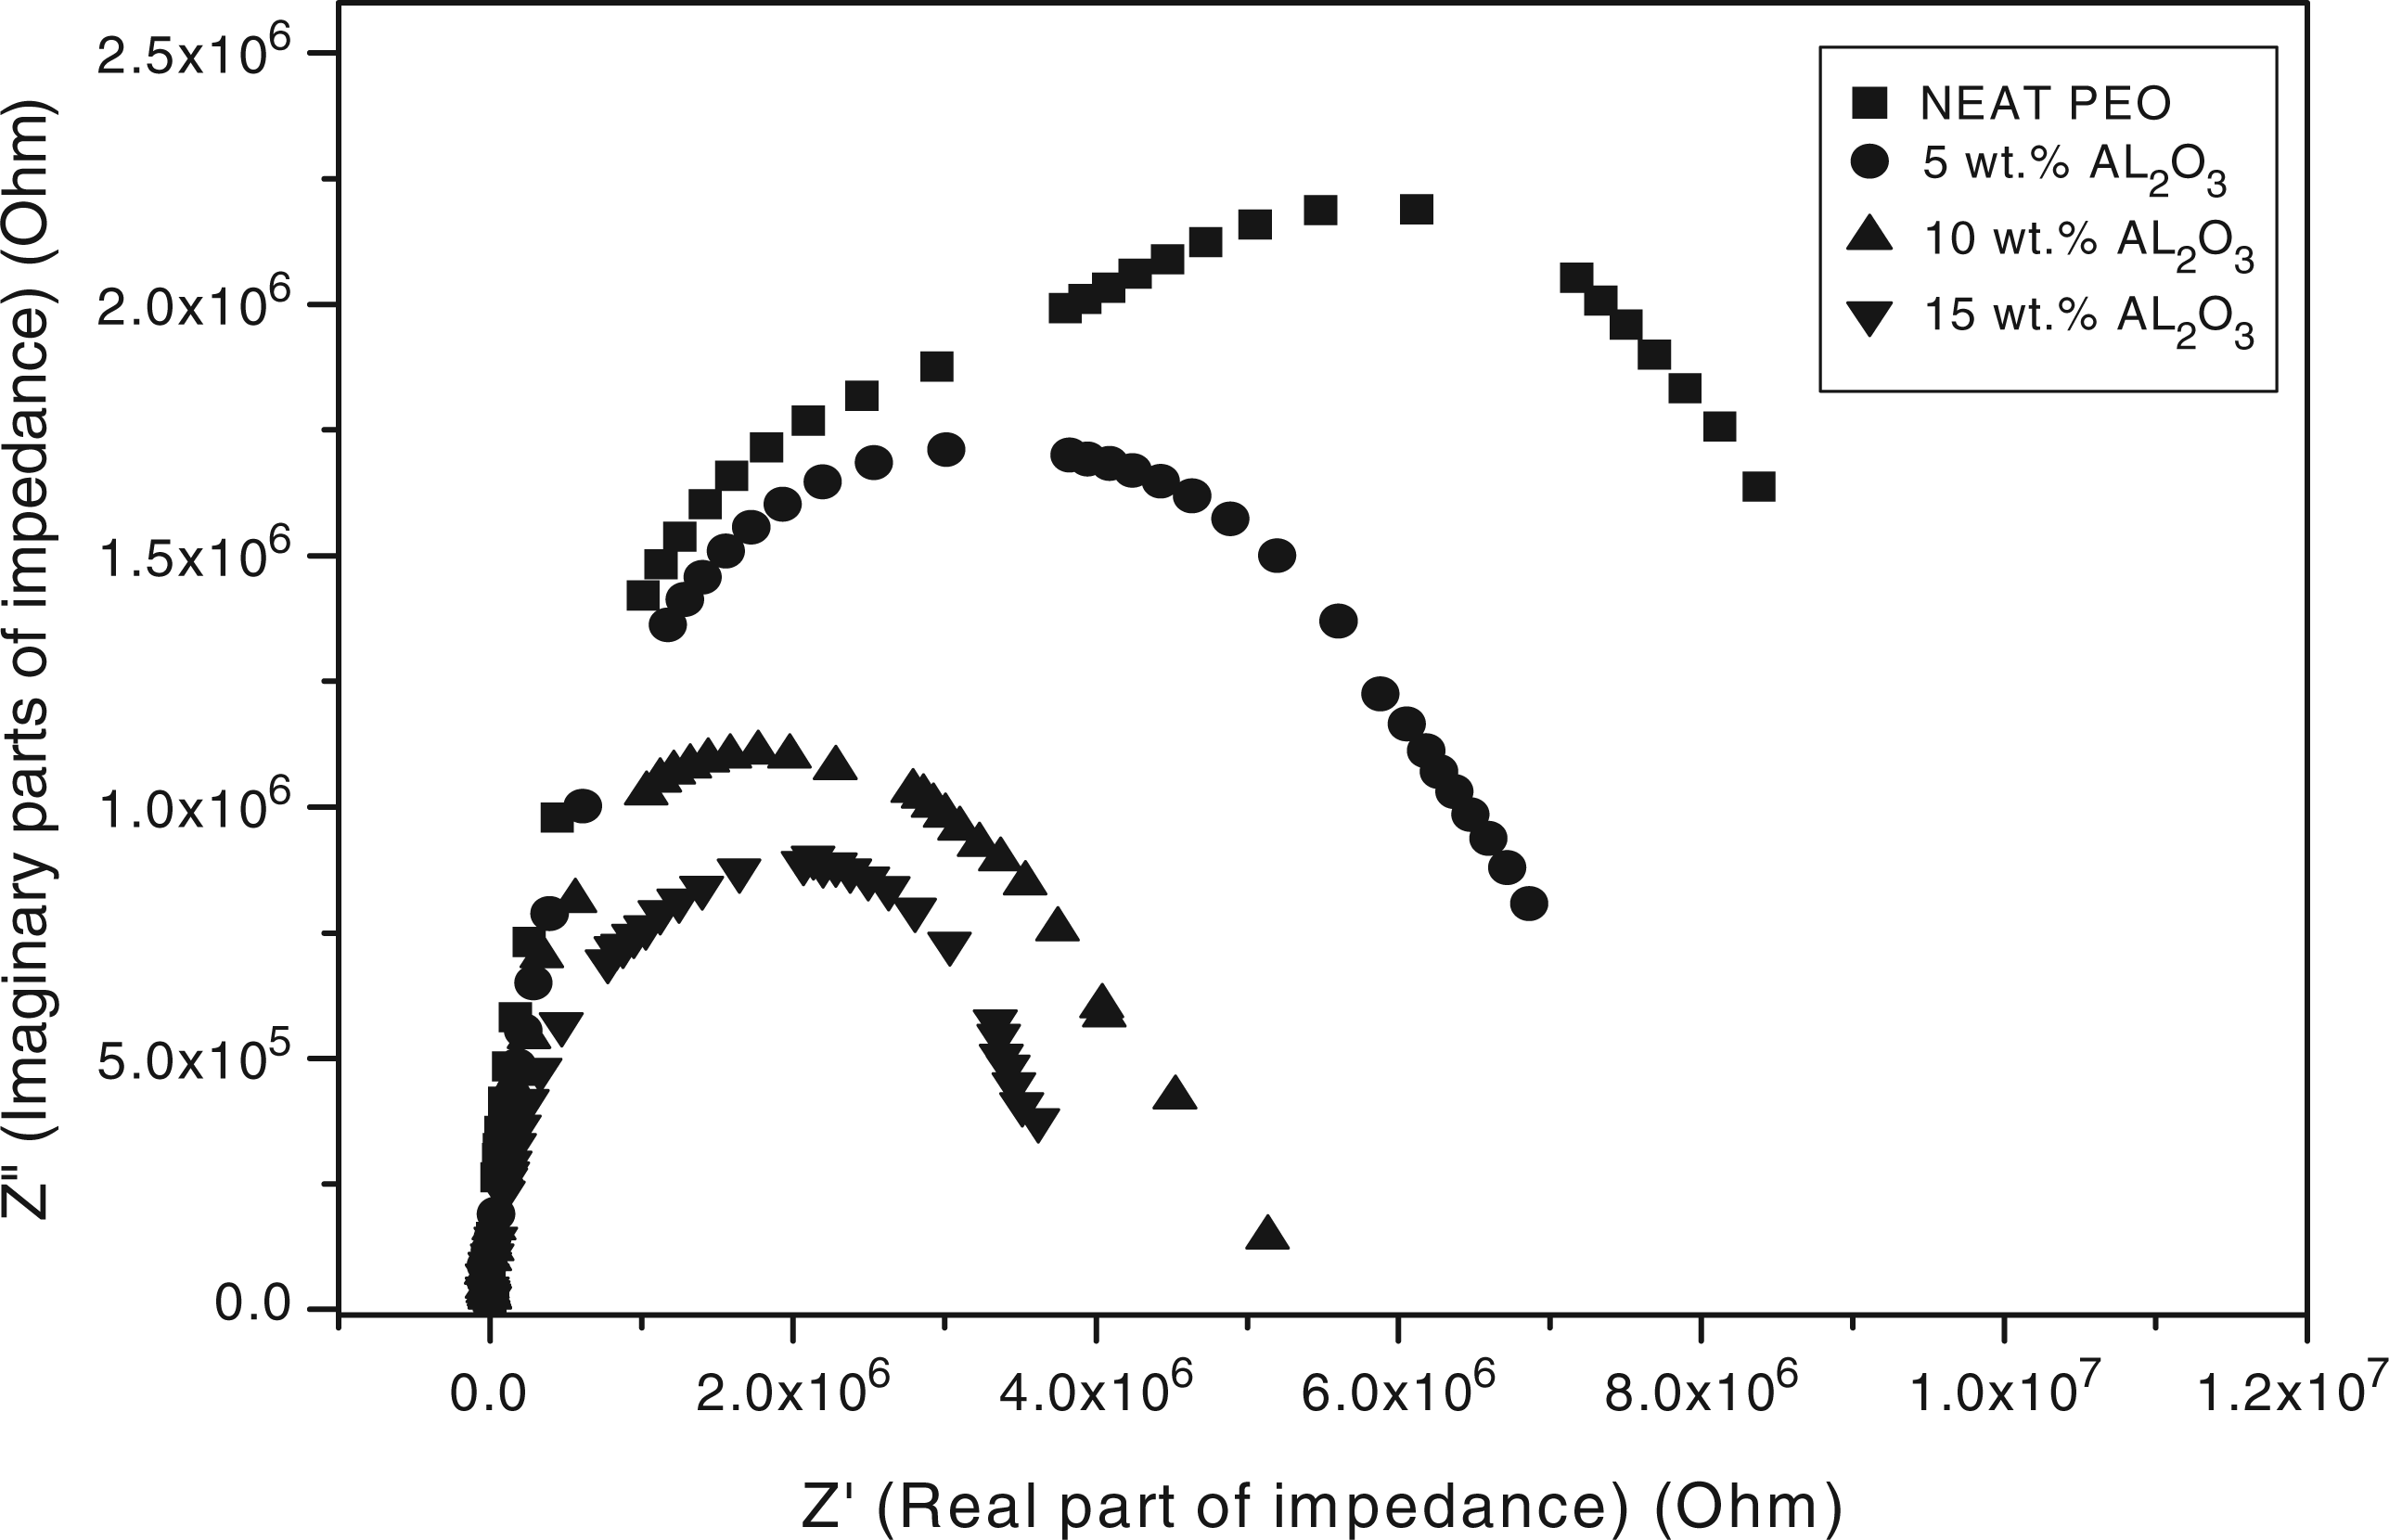
Figure 7 shows the decrease of ε′ with increasing frequency. It may be attributed to electrical relaxation or to inability of dipoles to rotate rapidly leading to a lag between the frequency of oscillating dipoles and that of the applied field. As the frequency increases, the ionic and orientation source of polarizability decreases and finally disappears due to inertia of mobile ions and we obtained a constant value of dielectric constant as a function of frequency. The large value of the dielectric constant at low frequency (∼160) in the present system can be due to the existence of electrode interface polarization.
6
The same behavior of dielectric constant is consistent with previous papers in literature.34–37
Dielectric constant behavior with frequency for polyethylene oxide (PEO)/alumina (Al2O3) composites.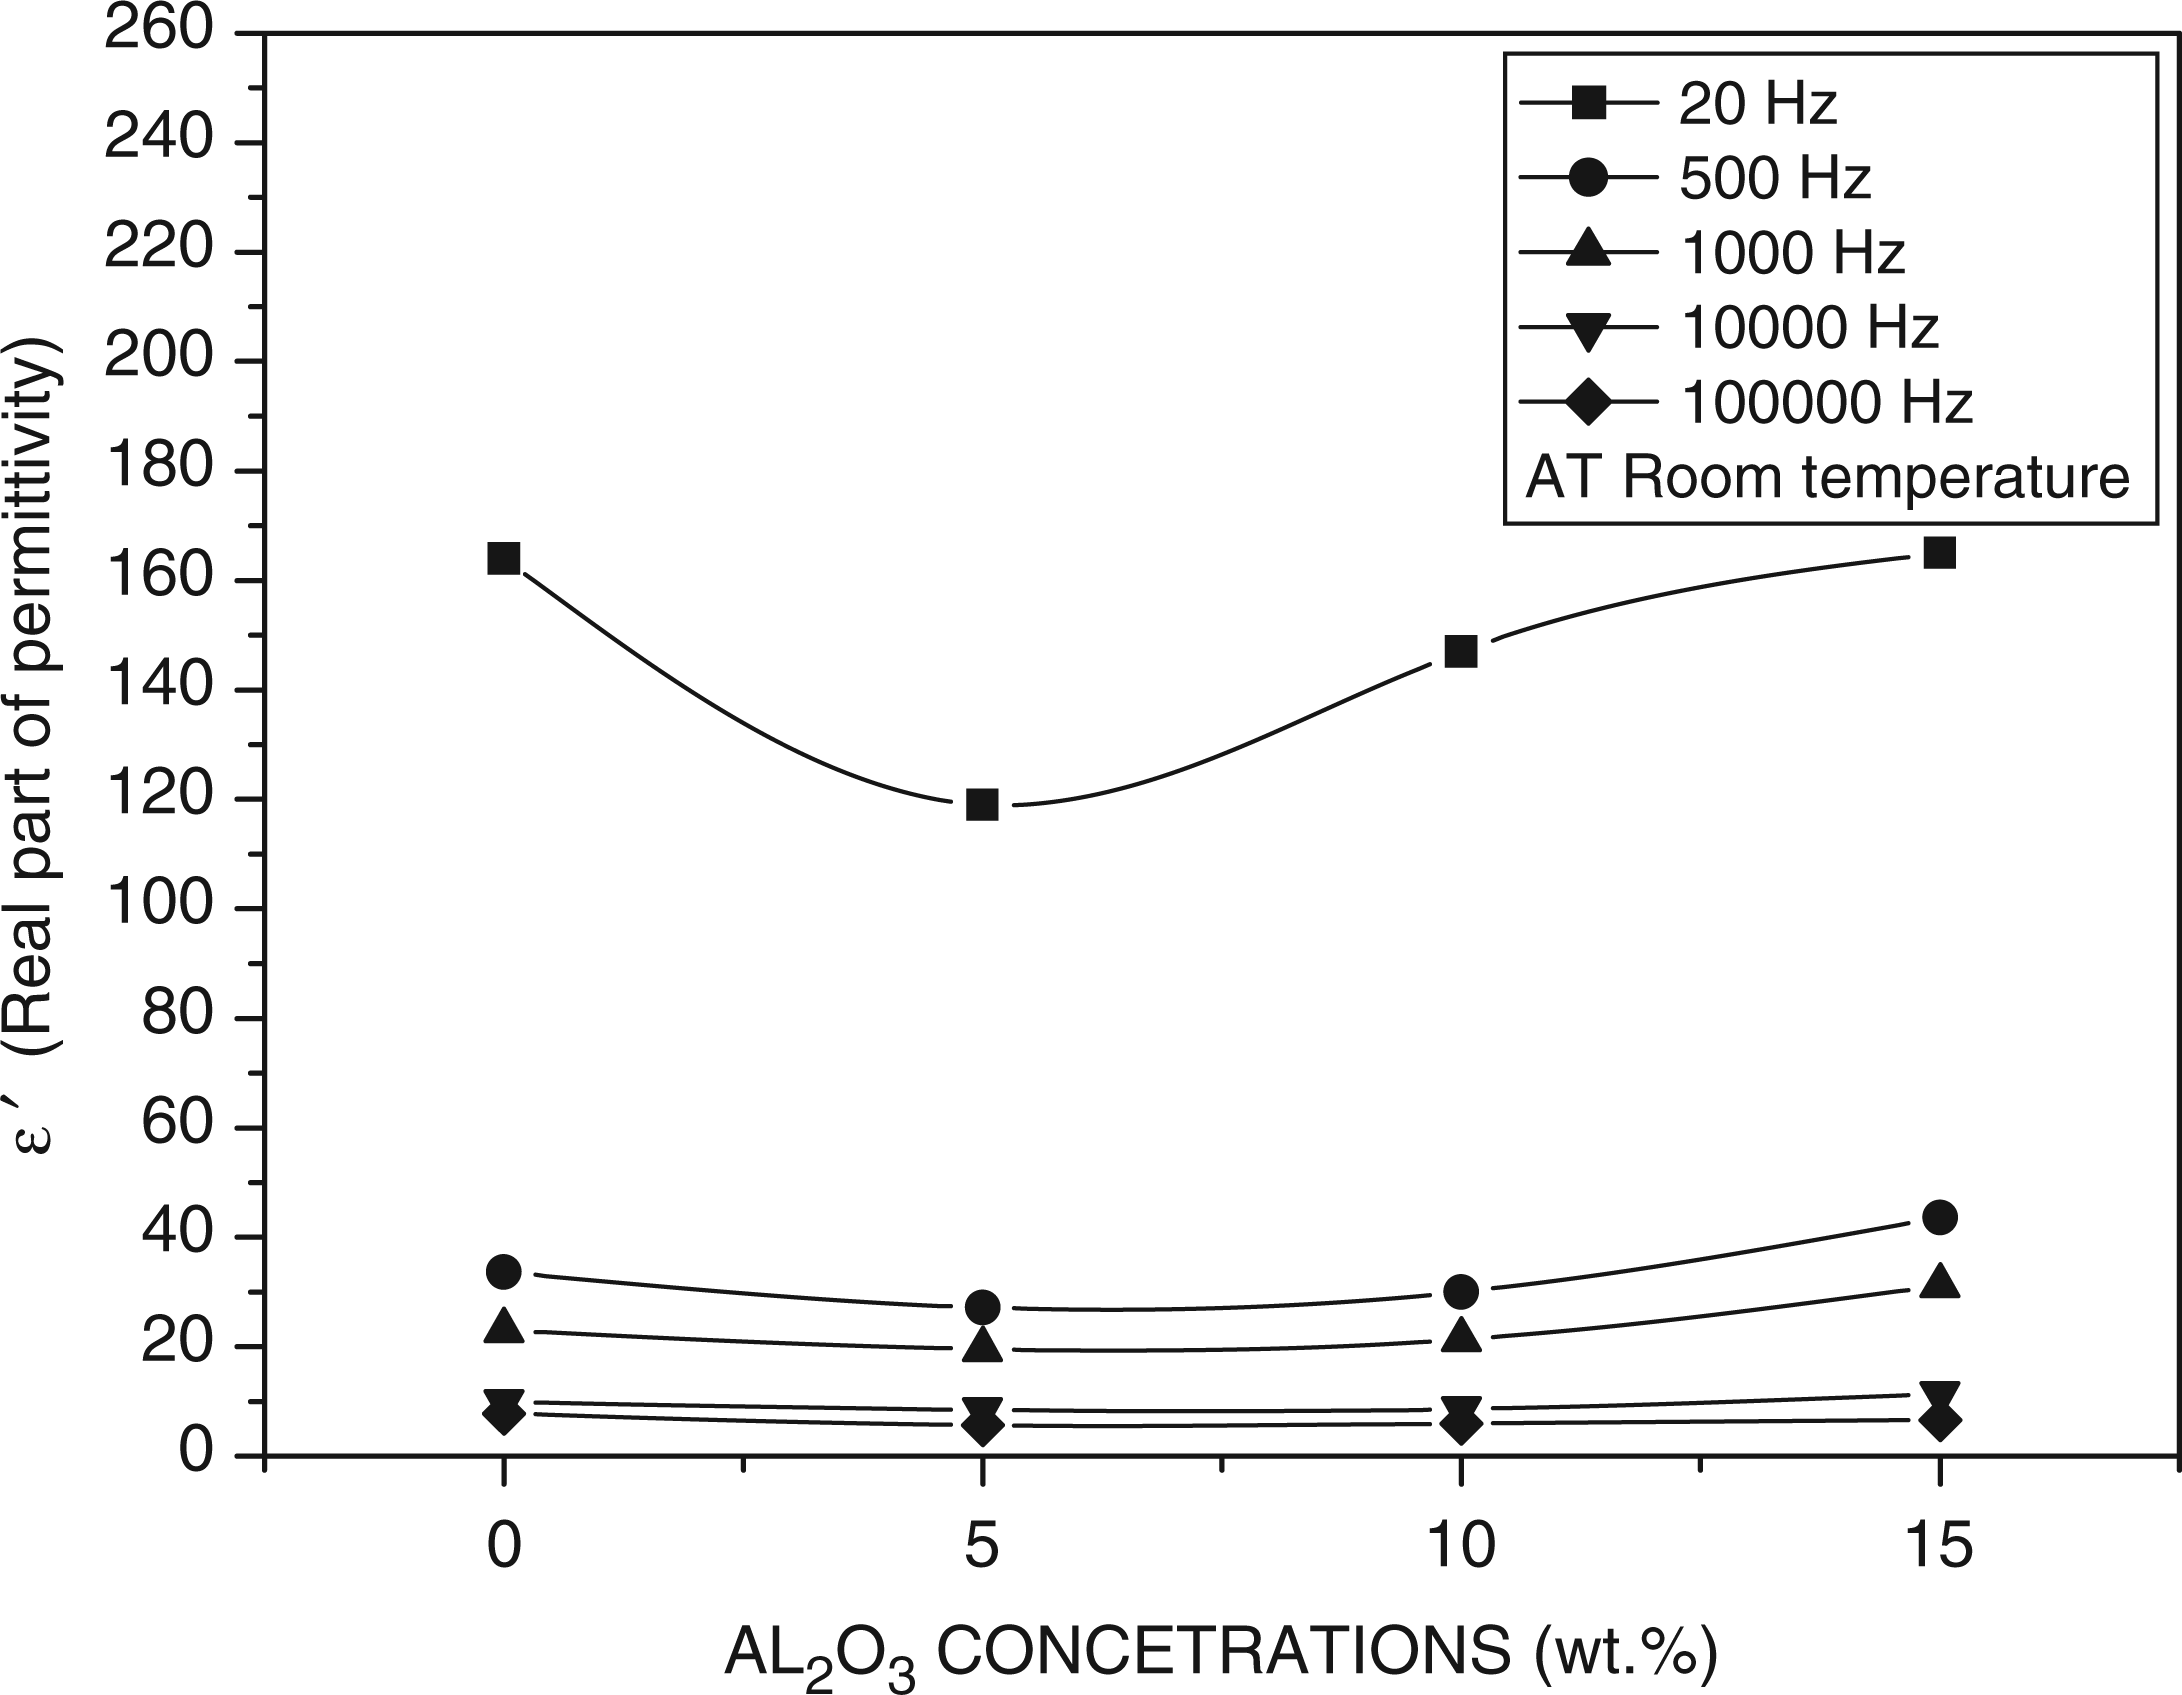
Figures 8(a) and (d) show the complex plane of the electric modulus (Nyquistsdiagram) for the PEO/Al2O3 composite. The suppressed semi-circles in the Cole–Cole diagram correspond to the relaxation processes for each of the specimens. Generally, in systems with a conductive component, interfacial relaxation is obscured by conductivity and the dielectric permittivity may be high at low frequencies. To overcome this difficulty in evaluating interfacial polarization, it has been decided to use the electric modulus formalism. It has also been used to study the conductivity relaxation behaviors of polymers. An advantage of adopting the electric modulus to interpret bulk relaxation properties is that variations in the large values of permittivity and conductivity at low frequencies are minimized. Inthis way, the familiar difficulties caused by electrode nature and contact, space charge injection phenomena and absorbed impurity conduction effects, which appear to obscure relaxation in the permittivity presentation, can be resolved or ignored.38,39
Complex plane plots of the electric modulus (Nyquists diagram) for the polyethylene oxide (PEO)/alumina (Al2O3) composite; (a) neat PEO; (b) 5 wt.% Al2O3; (c) 10 wt.% Al2O3; (d) 15 wt.% Al2O3.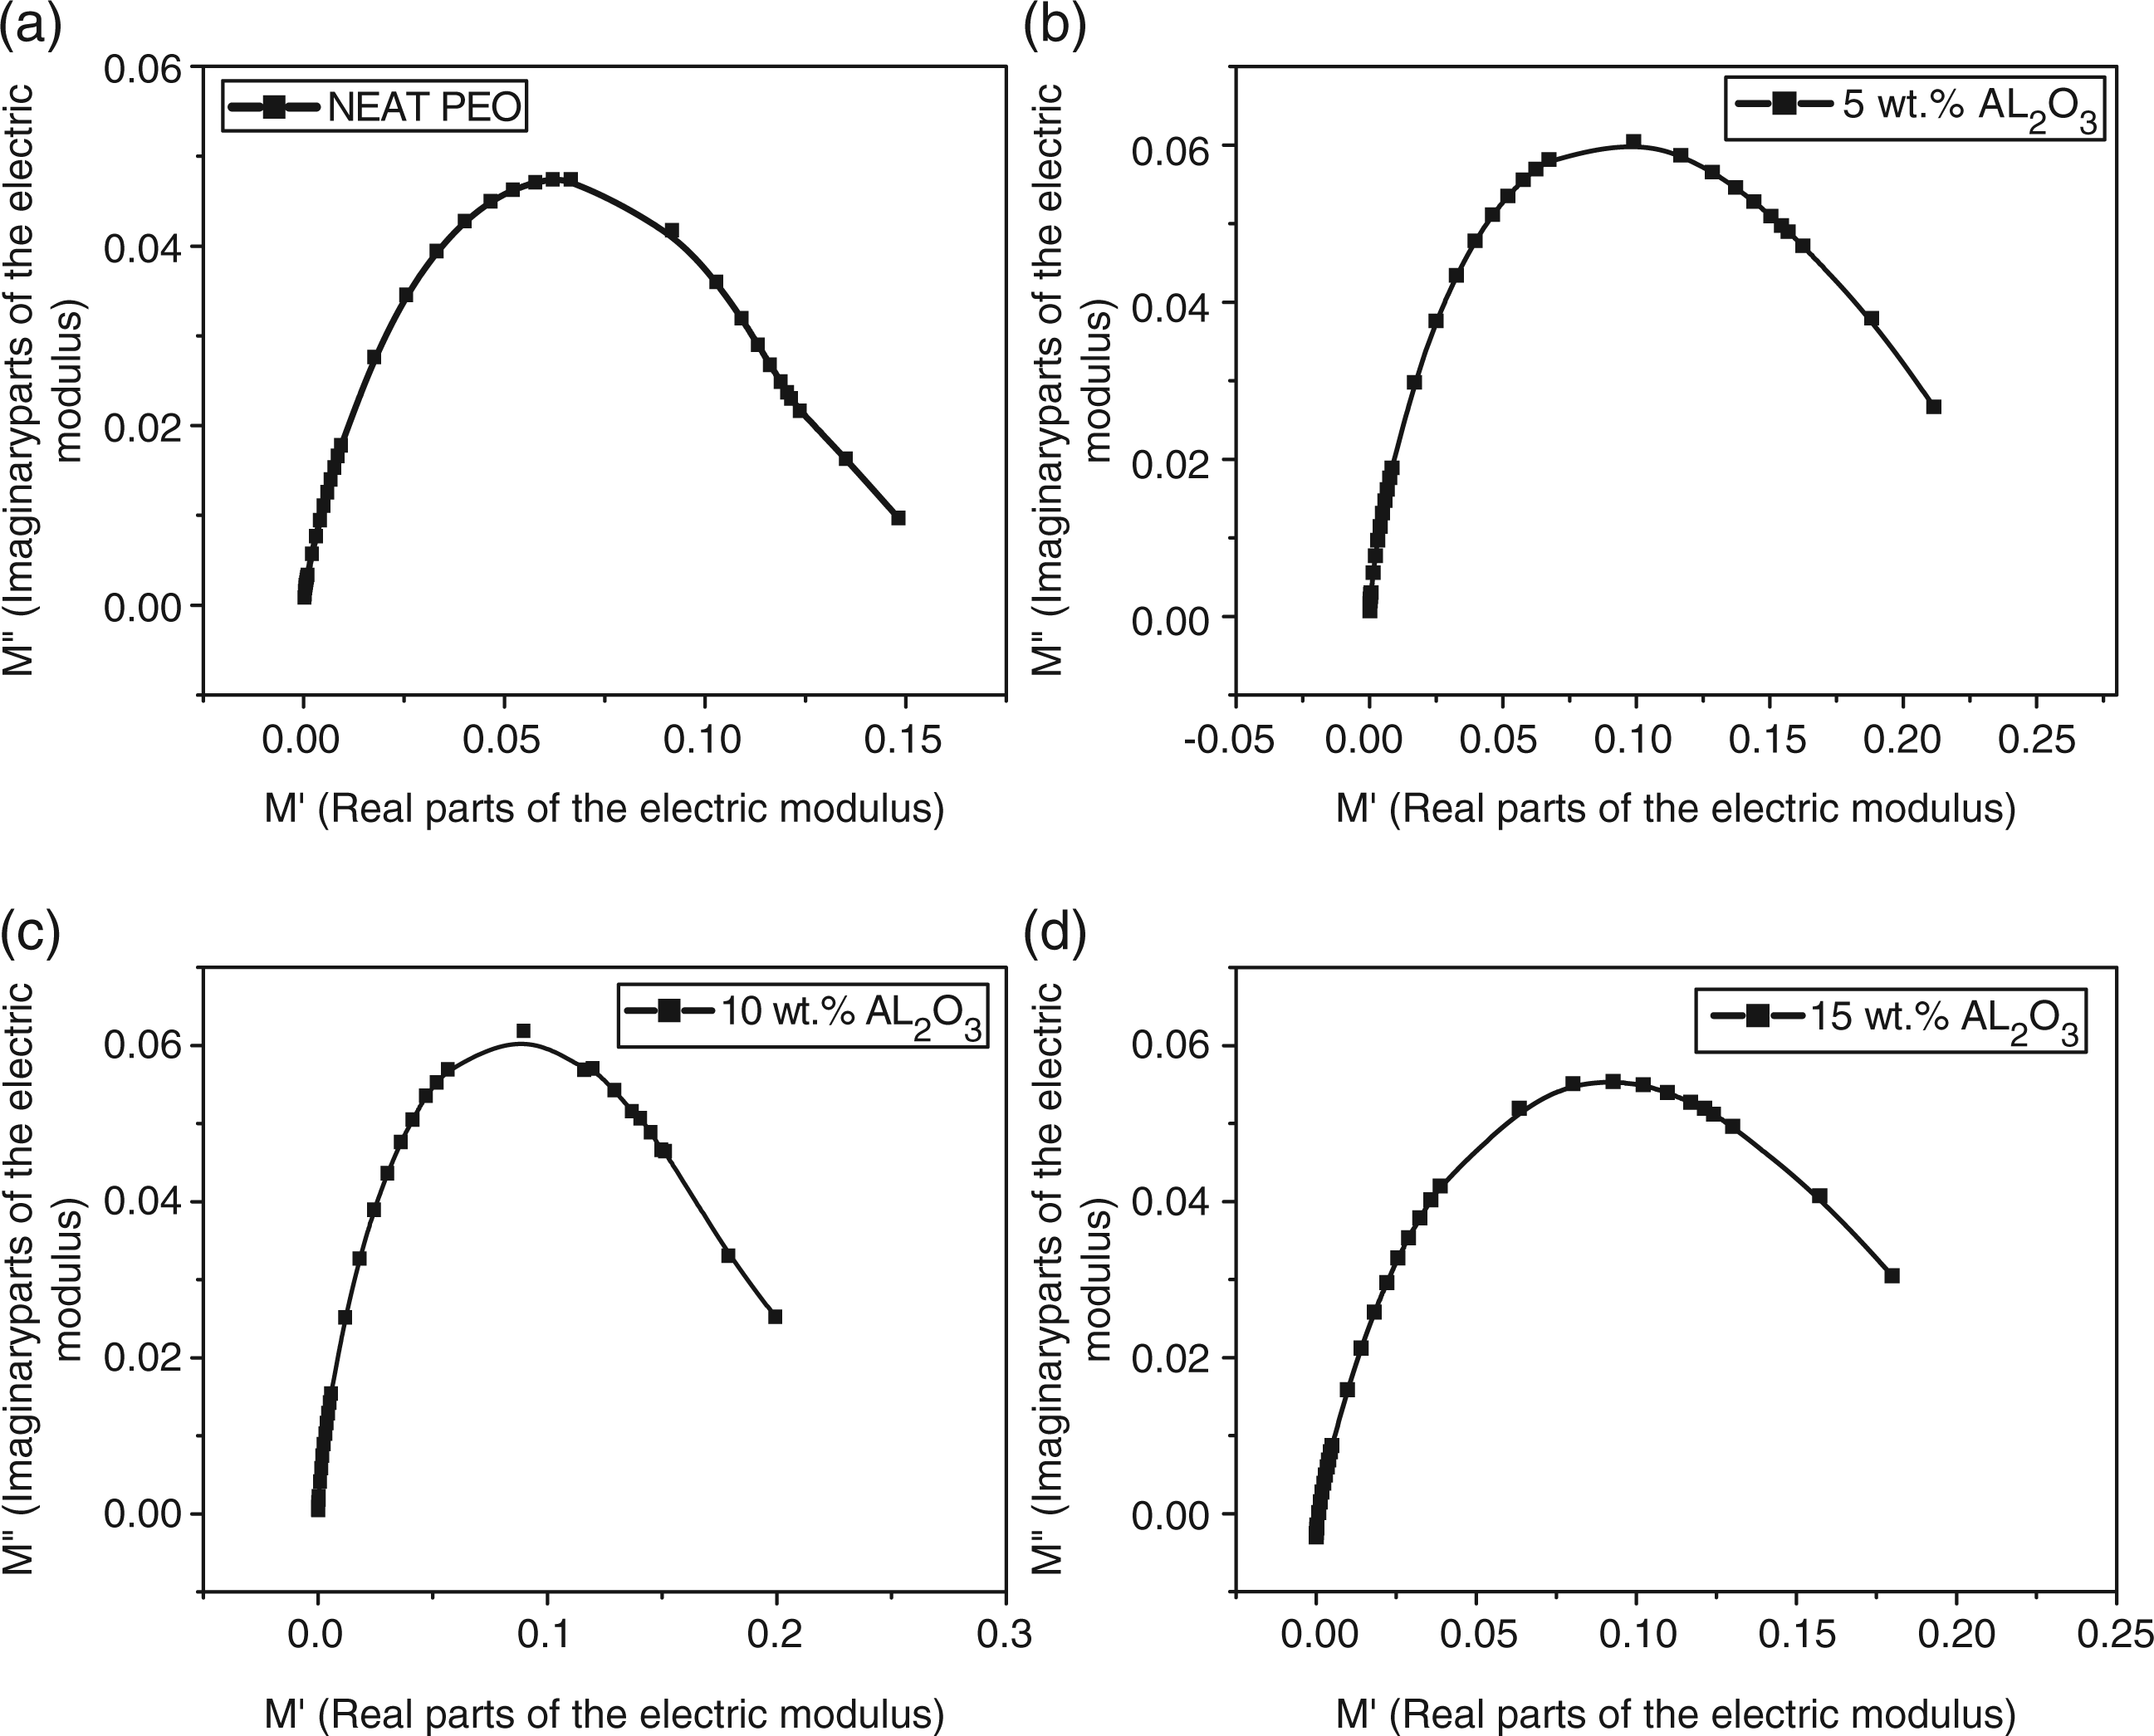
The peak shown in the Nyquists diagram can be assumed to be related with the translational ion dynamics and mirrors the conductivity relaxation of the mobile ions. The maxima in these spectra occur at ωm = 1/τ, where τ is the relaxation time; this is the time for reaching a new equilibrium after changing the excitation.6,40 Therelaxation time τ, calculated from the peak frequency ωm, is shown in Figure 9. It may be necessary to define relaxation time as the time that occurs as a result of the ionic charge carriers within the polymer material obeying the change in the direction of the applied field.
34
We see that relaxation time decreases with increasing wt.% of Al2O3 of the composite. Since relaxation is related to charge transport by hopping mechanism, an decrease in relaxation time indicates the decrease in hopping length due to stretching effect of the Al2O3 particles added to PEO, with a consequent increase in conductivity due to the increased mobility of the ionic charge carriers.
31
Relaxation time behavior with frequency for polyethylene oxide (PEO)/alumina (Al2O3) composites.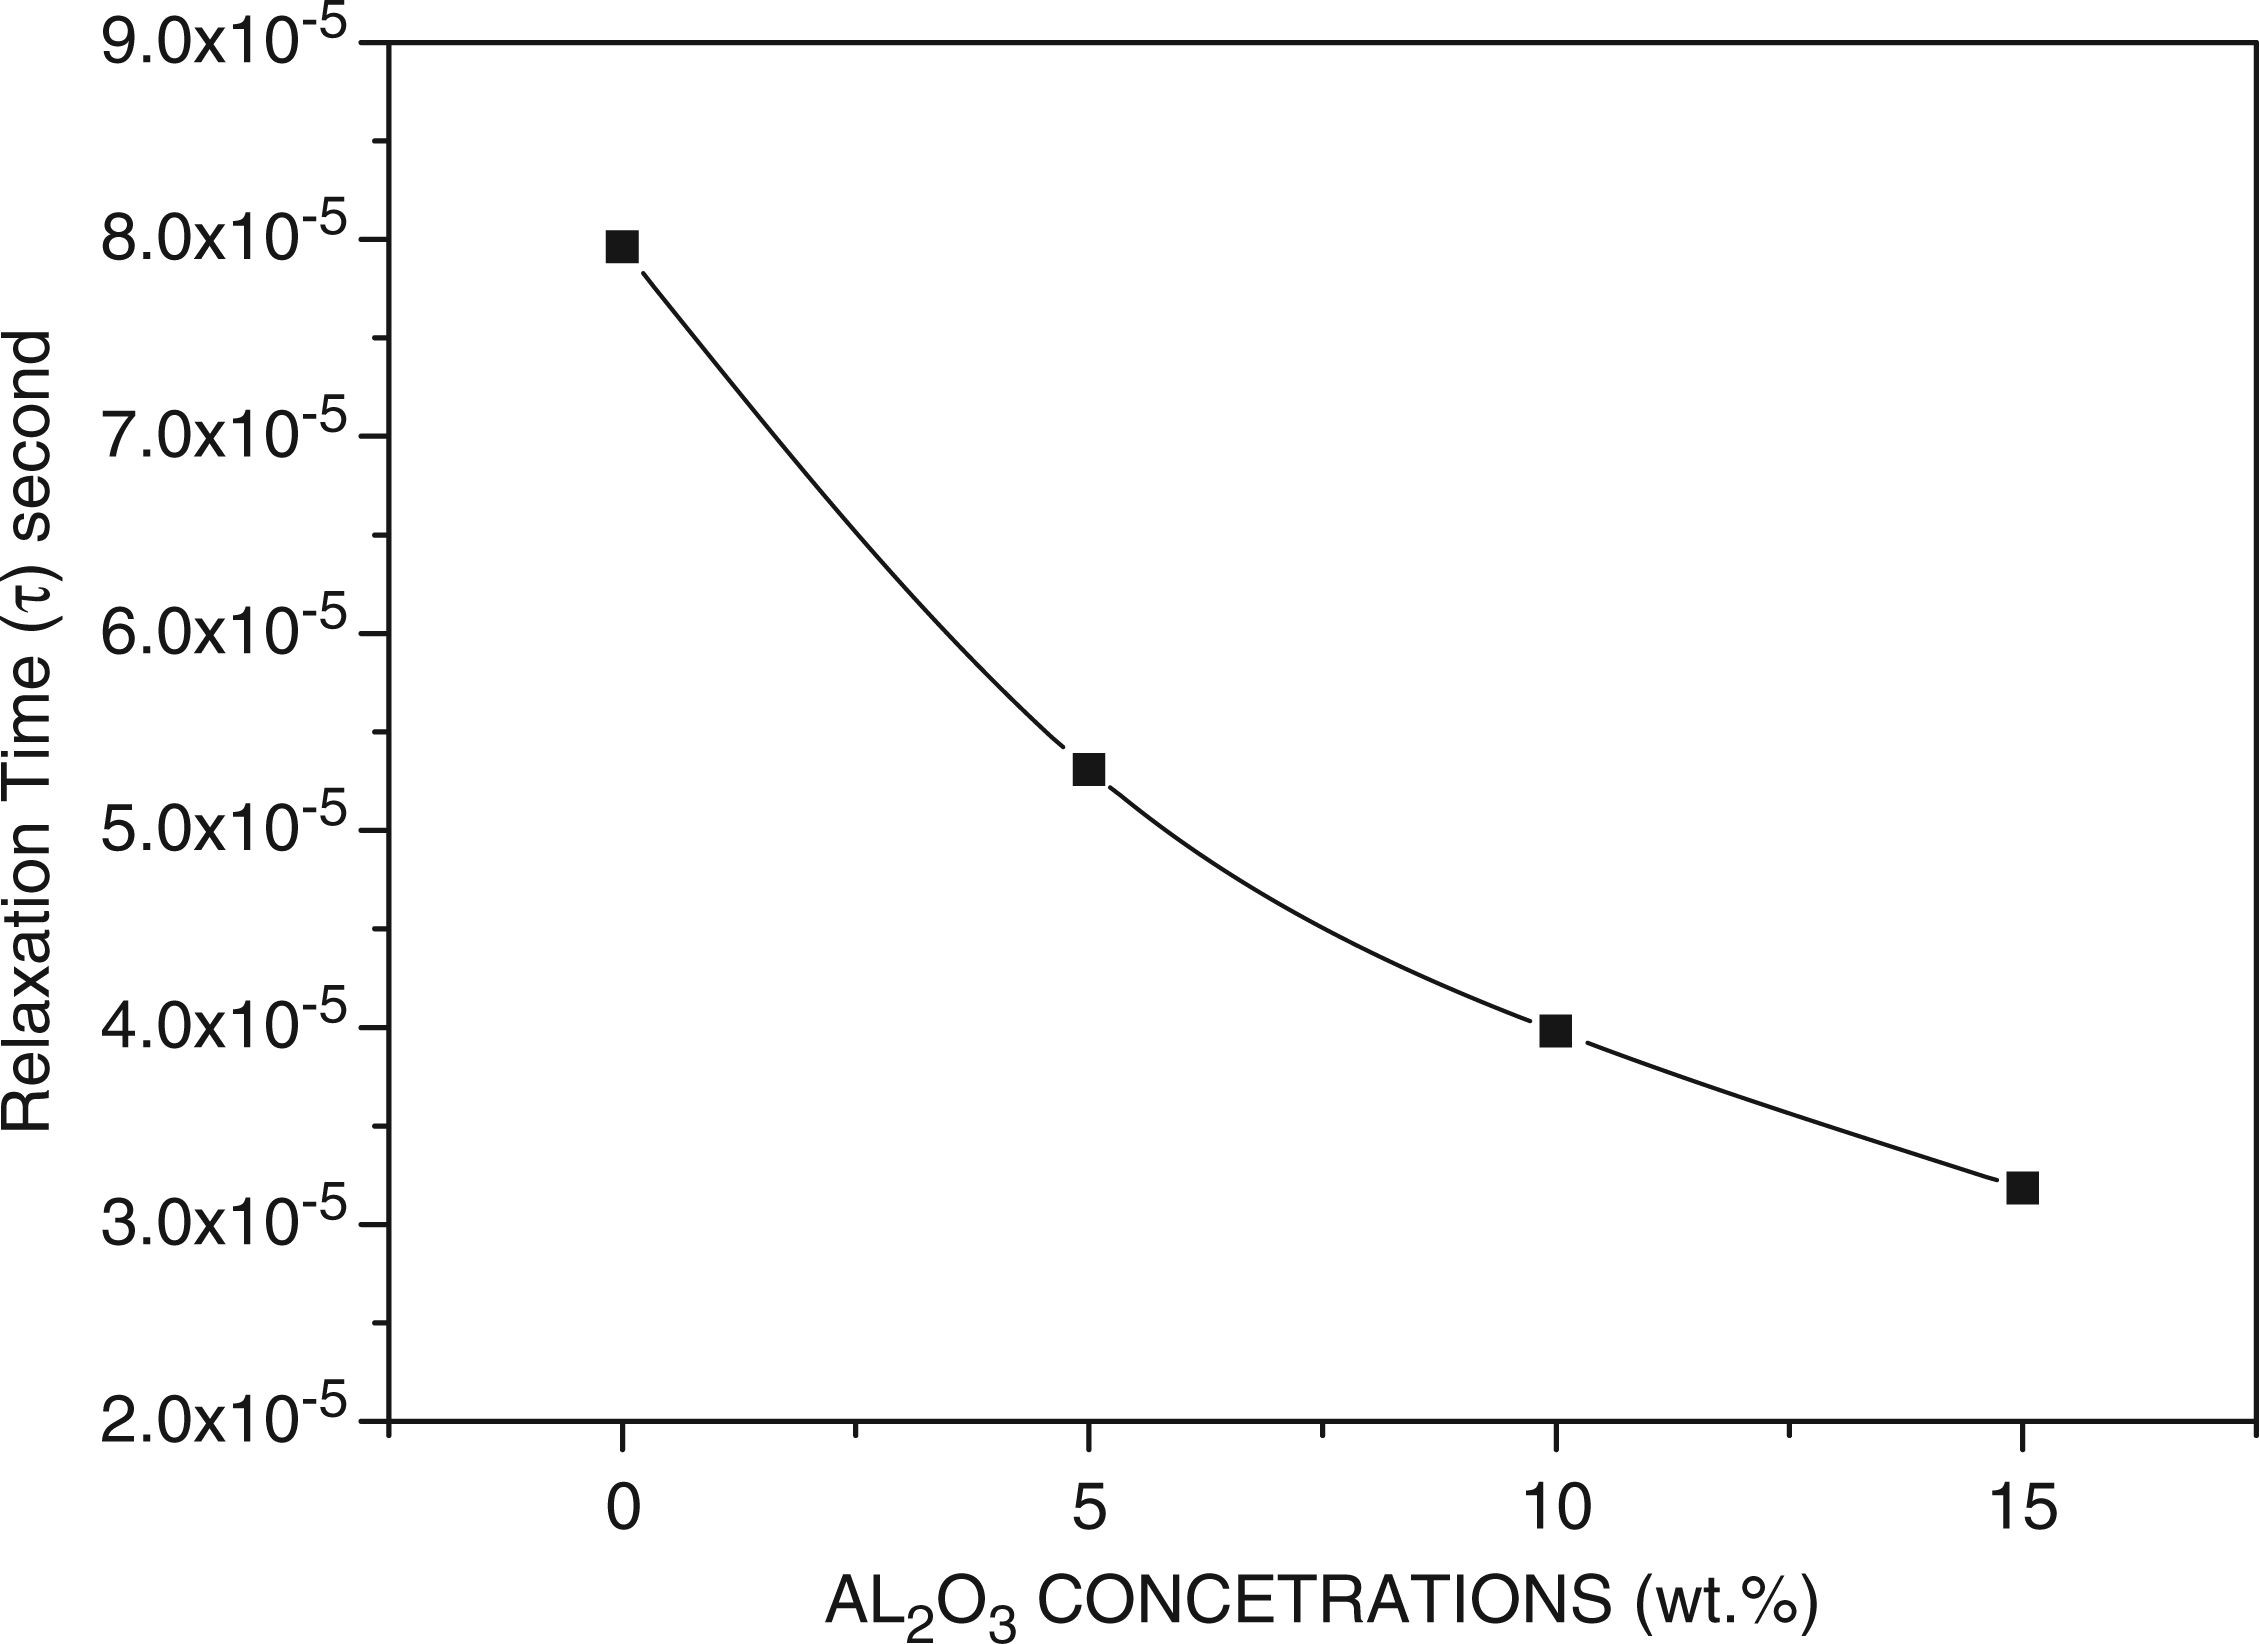
Figure 10 shows the variation of the AC electrical conductivity with the filler concentrations at different frequency. The conductivity for all compositions increases with the applied frequency. This increase means charge carriers are sufficiently free to follow the changing electric field and, therefore, the conductivity is frequency-dependent. At higher frequencies, the conductivity increases rapidly indicating a breakdown of the dielectric.41,42 Also, the figure shows that the AC electrical conductivity increases as Al2O3 concentrations increase. When the concentration of Al2O3 is high enough, a continuous conducting particles’ network is formed in the solid polymer matrix. As we know, the electrical conductance depends on the distance between neighboring conducting particles. Hence, the composites can be regarded as the system composed of random arrays of closely spaced conductors, dispersed in an insulating polymer matrix. The degree of the contacts of the conducting particles may be varied according to the dispersion mode of the conducting particles and the morphology of the polymer matrix. Atlow frequencies, we observed that the conductivity depended little on frequency.This phenomenon could be attributed to resistive conduction through the bulk composite including tunneling between conducting particles. On the other hand, at high frequencies, conductivity was proportional to frequency due to the capacitance of the matrix between the conducting particles or clusters.38,43 Byoung-Koo Choi et al. Reported, concerning the conductivity enhancement due to the ceramic additives, that the inert fillers enhance the formation of the amorphous phase and the high conductivity path would extend along polymer ceramic grain boundaries.
1
Variation of the AC electrical conductivity with the filler concentrations at different frequency.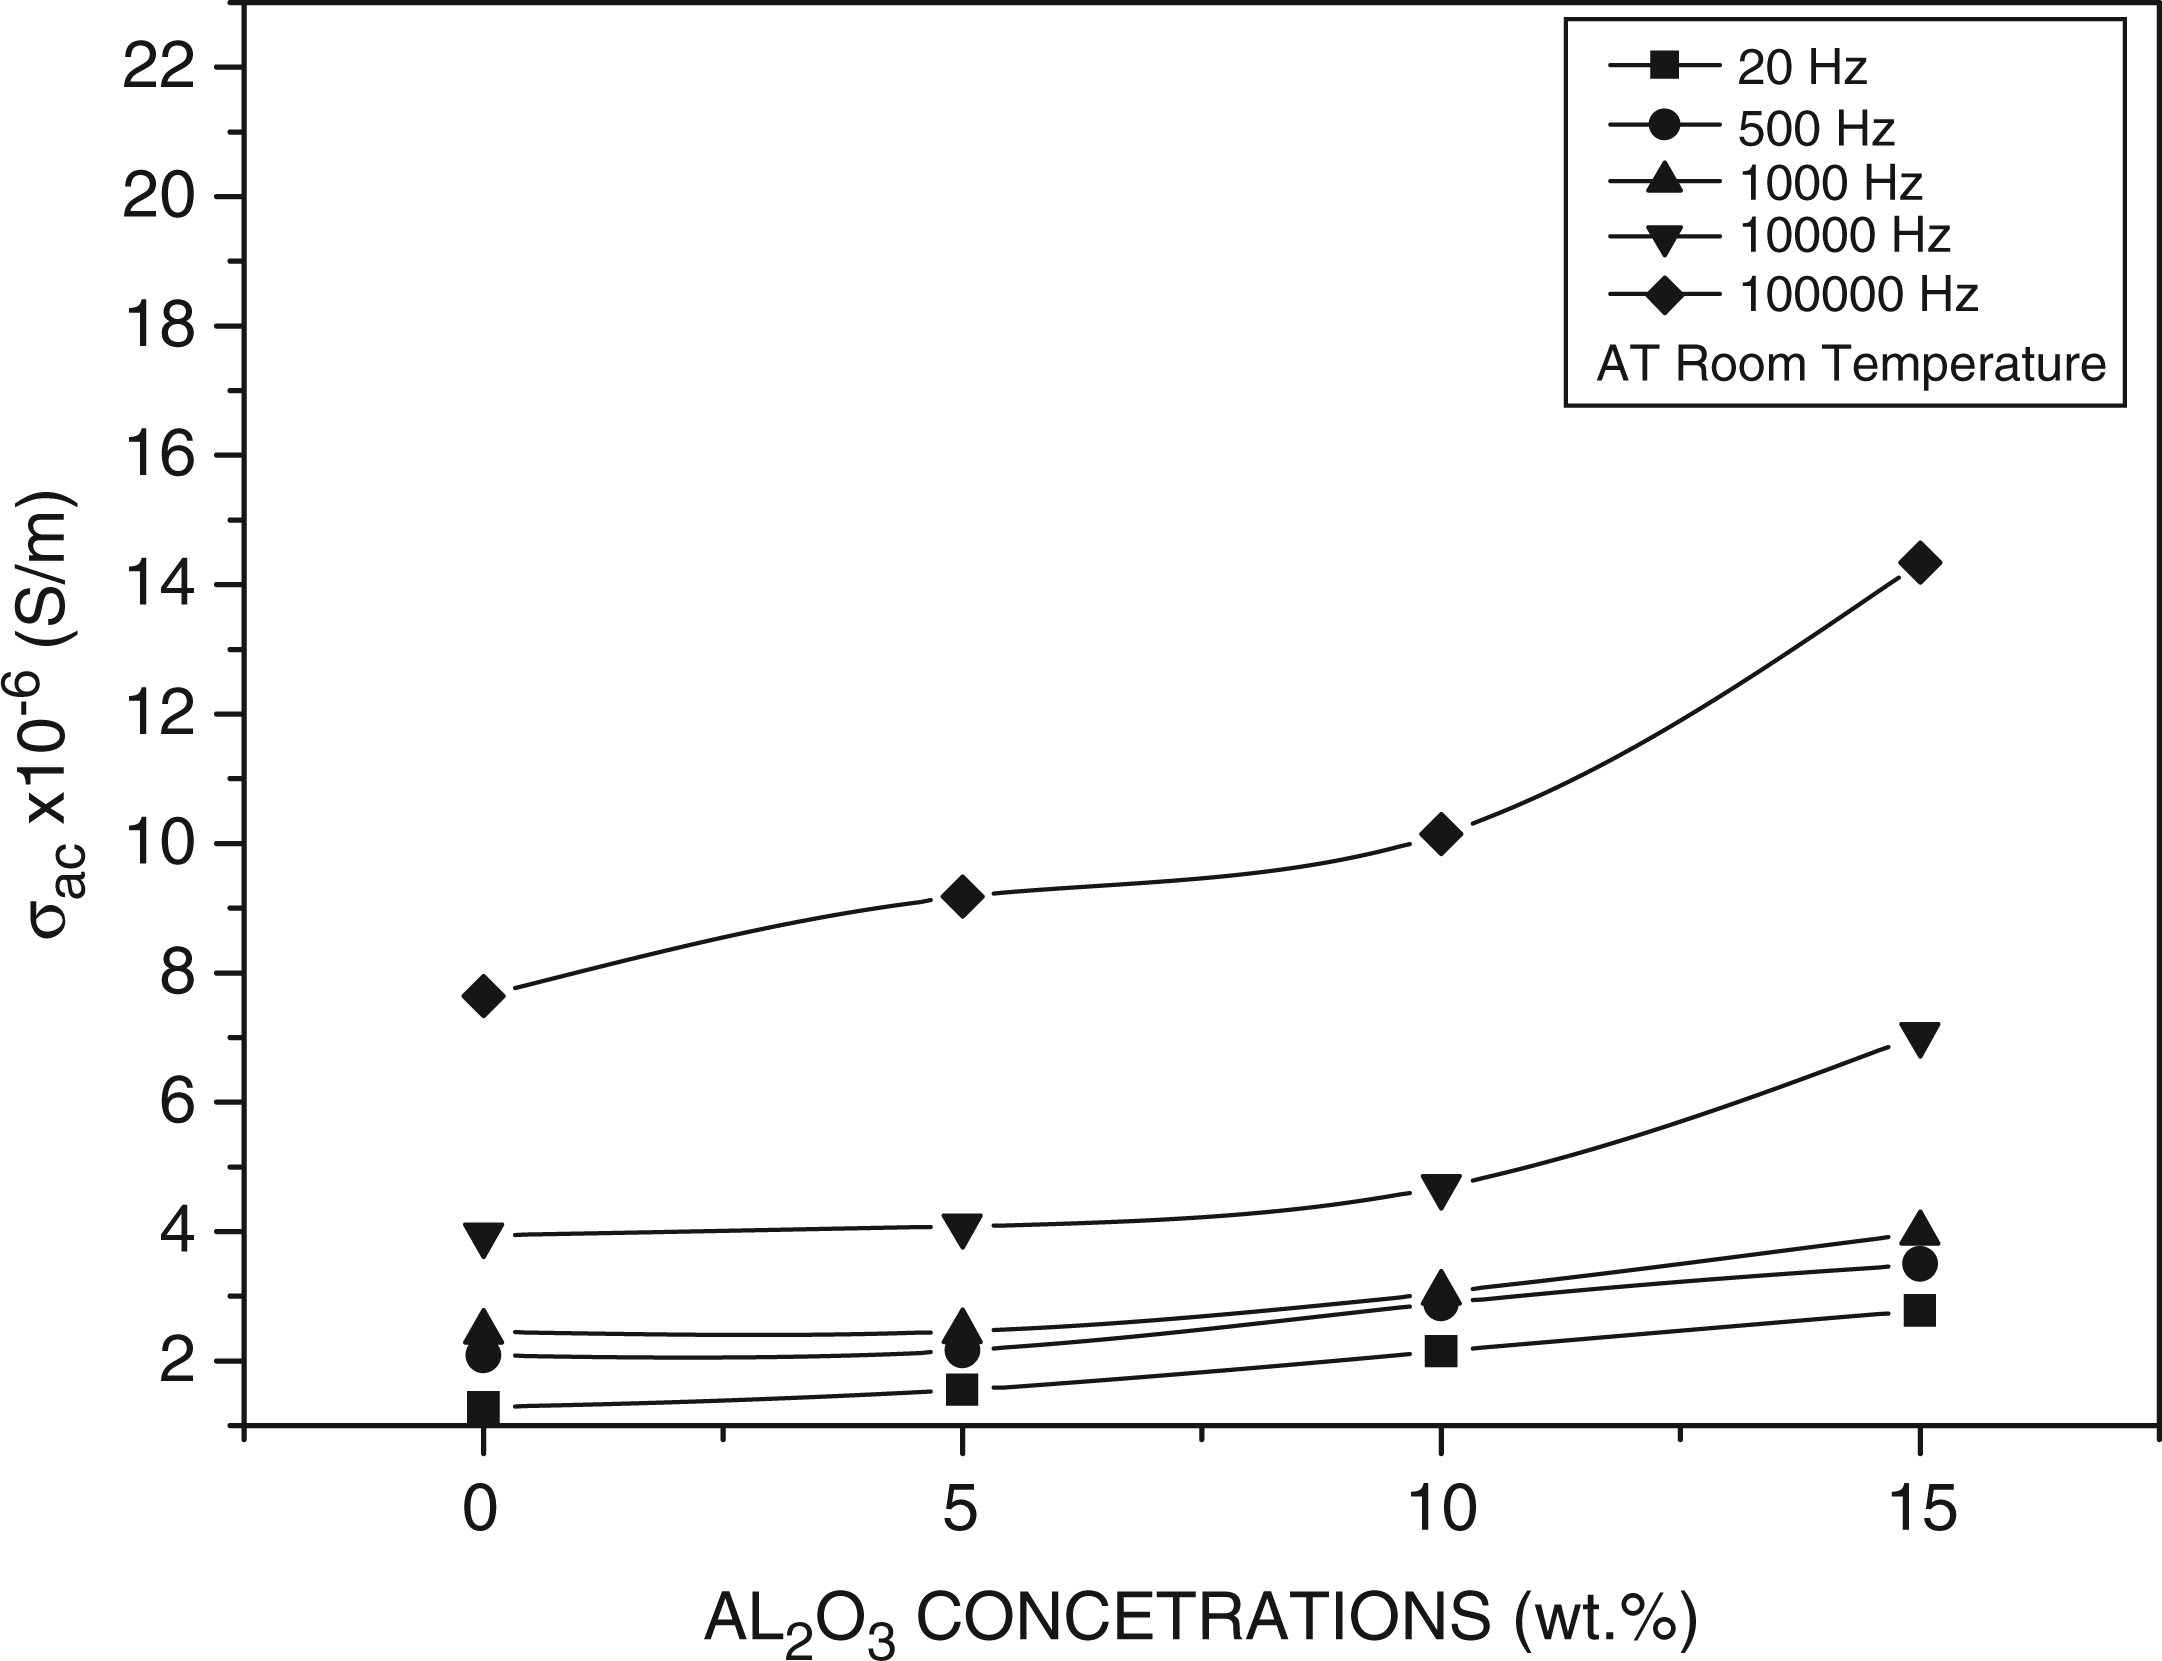


The A and n values.
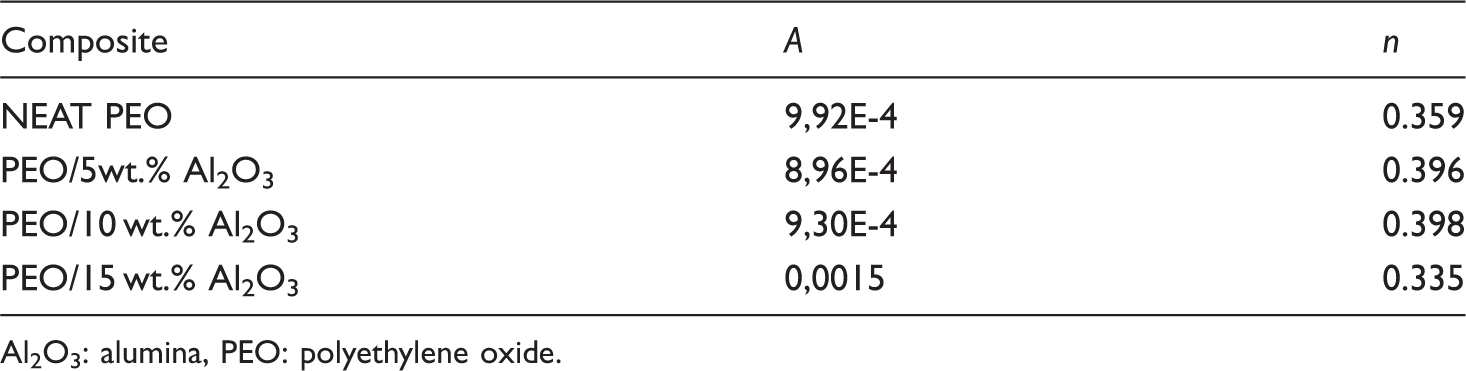
Al2O3: alumina, PEO: polyethylene oxide.
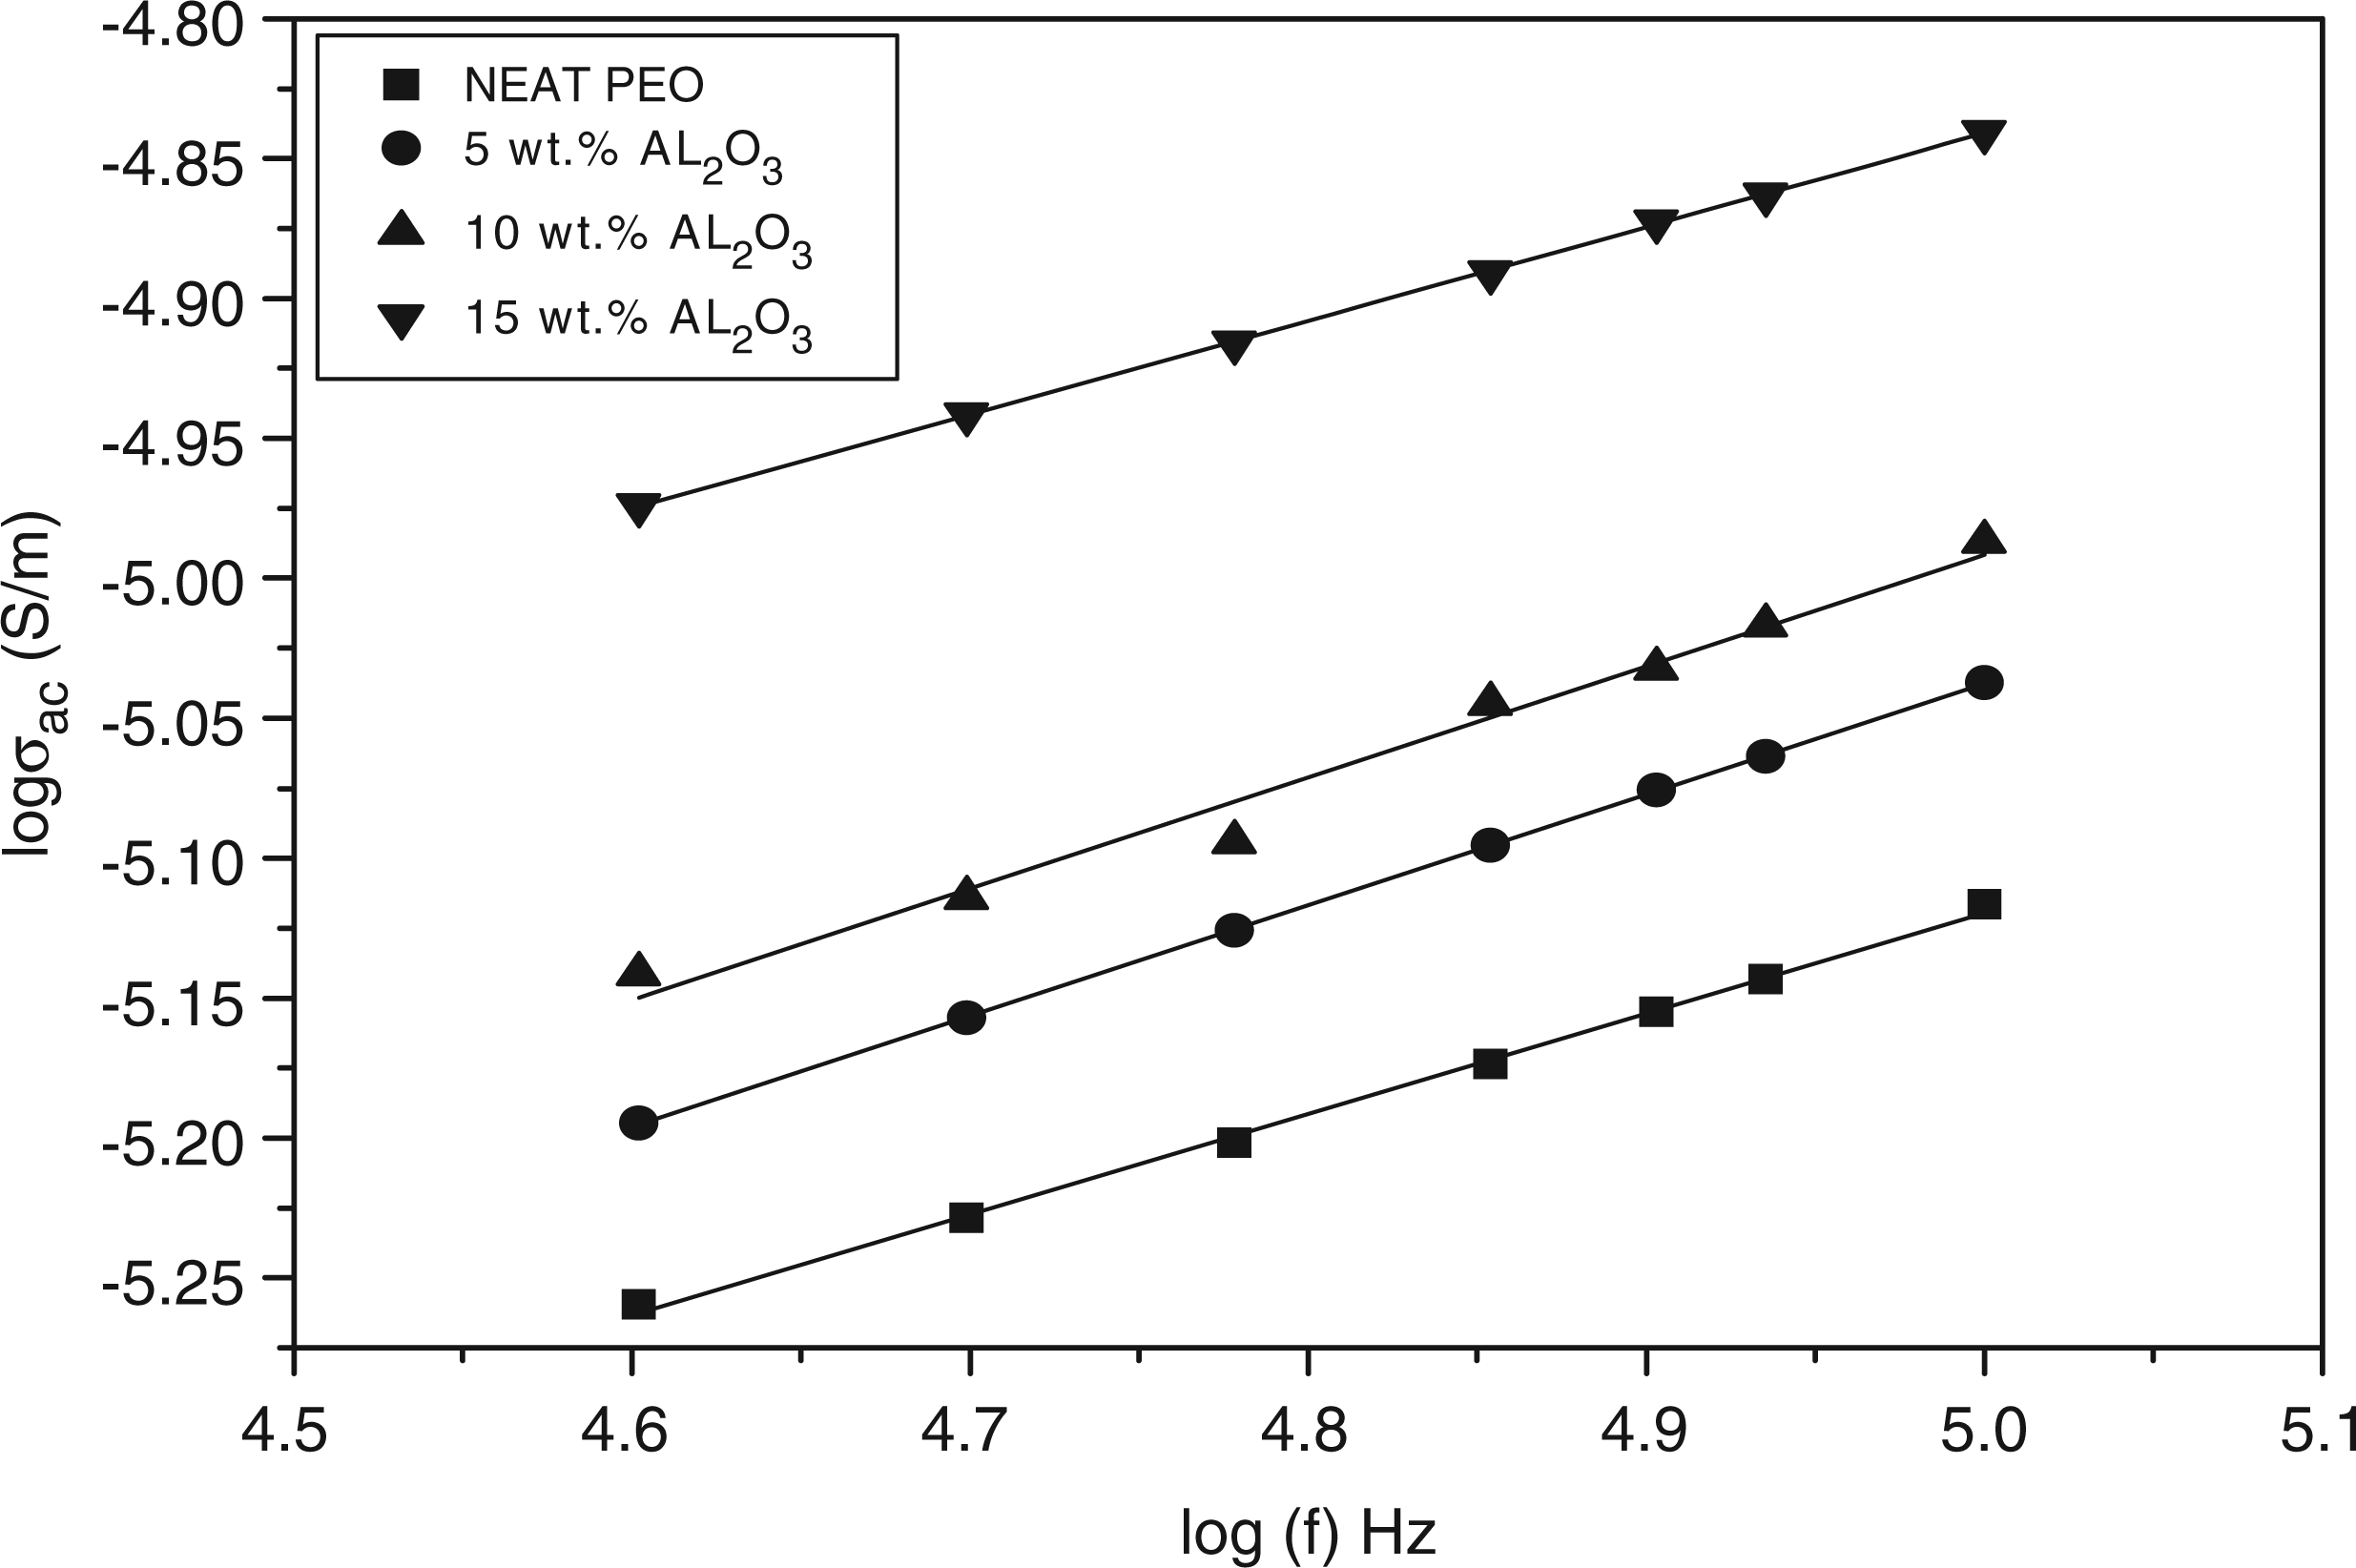
Log (σAC) vs log (f) for polyethylene oxide (PEO)/alumina (Al2O3) composites.
It was found that the power exponents (n) were less than one. We suggest that in the present case, Equation (11) is a good approximation considering the selected frequency range (20 Hz–1 MHz).
Conclusions
Electrical characterizations of polymer-ceramic composites were investigated as a function of frequency and Al2O3 filler content; the following conclusions can be obtained:
The dispersed Al2O3 particles were randomly distributed within the PEO matrix with some surface contacts between them and dispersed with random particles shape and size. The ceramic particles were tightly held by the host matrix material The heat of fusion was changed with filler addition, the melting temperature Tm, and was determined for the composites. Impedance was found to decrease with increasing frequency, high impedance values at low frequencies were attributed to interfacial polarization in the matrix. The geometrical shapes of the complex impedance plane plots indicate that the composite materials were electrically equivalent to (RC) networks. The dielectric constant decreased with increasing frequency; a feature we attributed to electrical relaxation or to inability of dipoles to rotate rapidly leading to a lag between the frequency of oscillating dipoles and that of the applied field. The complex plane plots of the electric modulus (Nyquists diagram) for the PEO/Al2O3 composite were studied. The peak shown in the Nyquists diagram can be assumed to be related with the translational ion dynamics and mirrors the conductivity relaxation of the mobile ions. The relaxation time was calculated, decreasing with increasing Al2O3 filler content. The conductivity in all compositions increase with the applied frequency. This increase means the charge carriers were sufficiently free to follow the changing electric field and therefore the conductivity was frequency-dependent. At higher frequencies, the conductivity increases as a power of frequency with power exponent n less than one.
Footnotes
Acknowledgement
The authors would like to thank the DFG (German Research Foundation) for financial support and the Institute of Polymers and Composites group in the Technical University Hamburg-Harburg for their cooperation and technical support.