
Abstract
Textile glass fiber reinforced particle-filled polymer composite beams which have different weight fractions of glass fibers were produced with varying notch-to-depth ratios. The mechanical properties of specimens were found. The specimens were investigated in Mode I and Mode III fracture behavior using three-point bending (TPB) tests. Textile glass fiber contents used were 1, 2 and 3%, and polyester content was 16.5% of the total weight of the polymer composite system. The critical stress intensity factor was determined by using a compliance technique, the initial notch depth method and the J-integral method. Effects of crack angles on fracture behavior were also studied. The specimens, which have an inclined crack at an angle θ to the axis of the specimens, were used to carry out the tests. The specimens were tested with inclination angles 30°, 45°, 60° and 75°. The results are compared with the values of KIC obtained using conventional (θ = 90°) specimens. In addition, J-integrals were also determined.
Introduction
Nowadays polymer concrete based upon polymers and mineral aggregates is an attractive approach due its good properties, such as rapid setting, high strength, corrosion and water resistance for applications. For this reason, polymer concrete is being used in various constructions, rehabilitation and repair applications of pipelines, bridges and roads.1–7
In order to obtain good properties of the polymer concrete, it is necessary to know the types and sizes of fillers and the percentages of the components, which have an important role in the composition. 1 Polymer concrete is fabricated generally by combining the polymers and the fillers. The enormous potential of high performance fibers that is so successfully exploited in the conventional polymer composites has not been widely used in polymer concretes. Nevertheless the fiber reinforcement of polymer concrete is not a new concept; chopped strand glass fiber has been applied to polymer composites for improving the strength and controlling the cracking.8,9 To characterize the failure behavior of the polymer composites in terms of the constituents some attempts have been made for efficient use.10,11
Mode I fracture type according to loading conditions is taken into consideration in most of the studies performed in fracture mechanics. However, random cracks occur in general loading conditions.
This type of crack must be explained with Mode I, Mode II and Mode III fracture types. There are a very limited number of studies where Mode I and Mode II type fractures are taken together. In addition to Mode I loading, there is no tendency towards the explanation of the effect of Mode III. Kamat et al. 12 have shown that addition of Mode III has little effect on Mode I for aluminum alloy metal–matrix composites. Manoharan and Lewandowski 13 have investigated experimentally the fracture toughness in Mode I and Mode III loading conditions together in particulate metal–matrix composites and they have demonstrated that Mode I loading conditions are very effective. Moreover, the addition of Mode III to the system does not affect the critical fracture criterion.
Under shear forces cracks tend to propagate in Mode I, Mode II and Mode III configurations. Attempts to apply fracture mechanics concepts to study mixed mode failure and crack propagation of concrete have been made.14–18 Avcı et al. have studied fracture properties according to mixed modes. 19
In this study, Mode I and Mode III fracture behaviors of the textile glass fibers reinforced polymer concrete were investigated using single edge notched beam loaded three-point bending. The effects of the crack angles on the fracture behaviors of the polymer concrete system were analyzed. The fracture toughness values of the combined Modes KIC and KIIIC and the JC integrals (JIC and JIIIC) were determined for the same materials. In addition, the flexural strengths and flexural moduli of the specimens were determined.
Experimental
Specimen Preparation
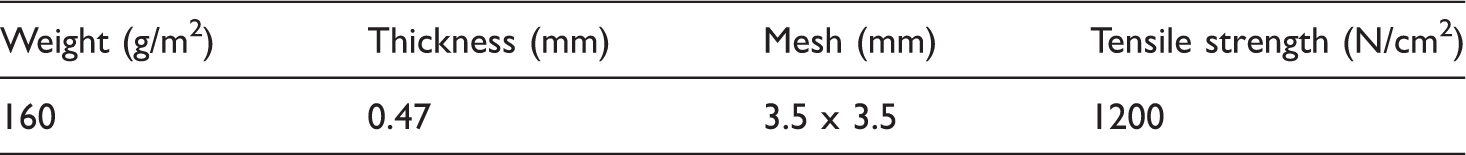
The properties of the textile fiber.
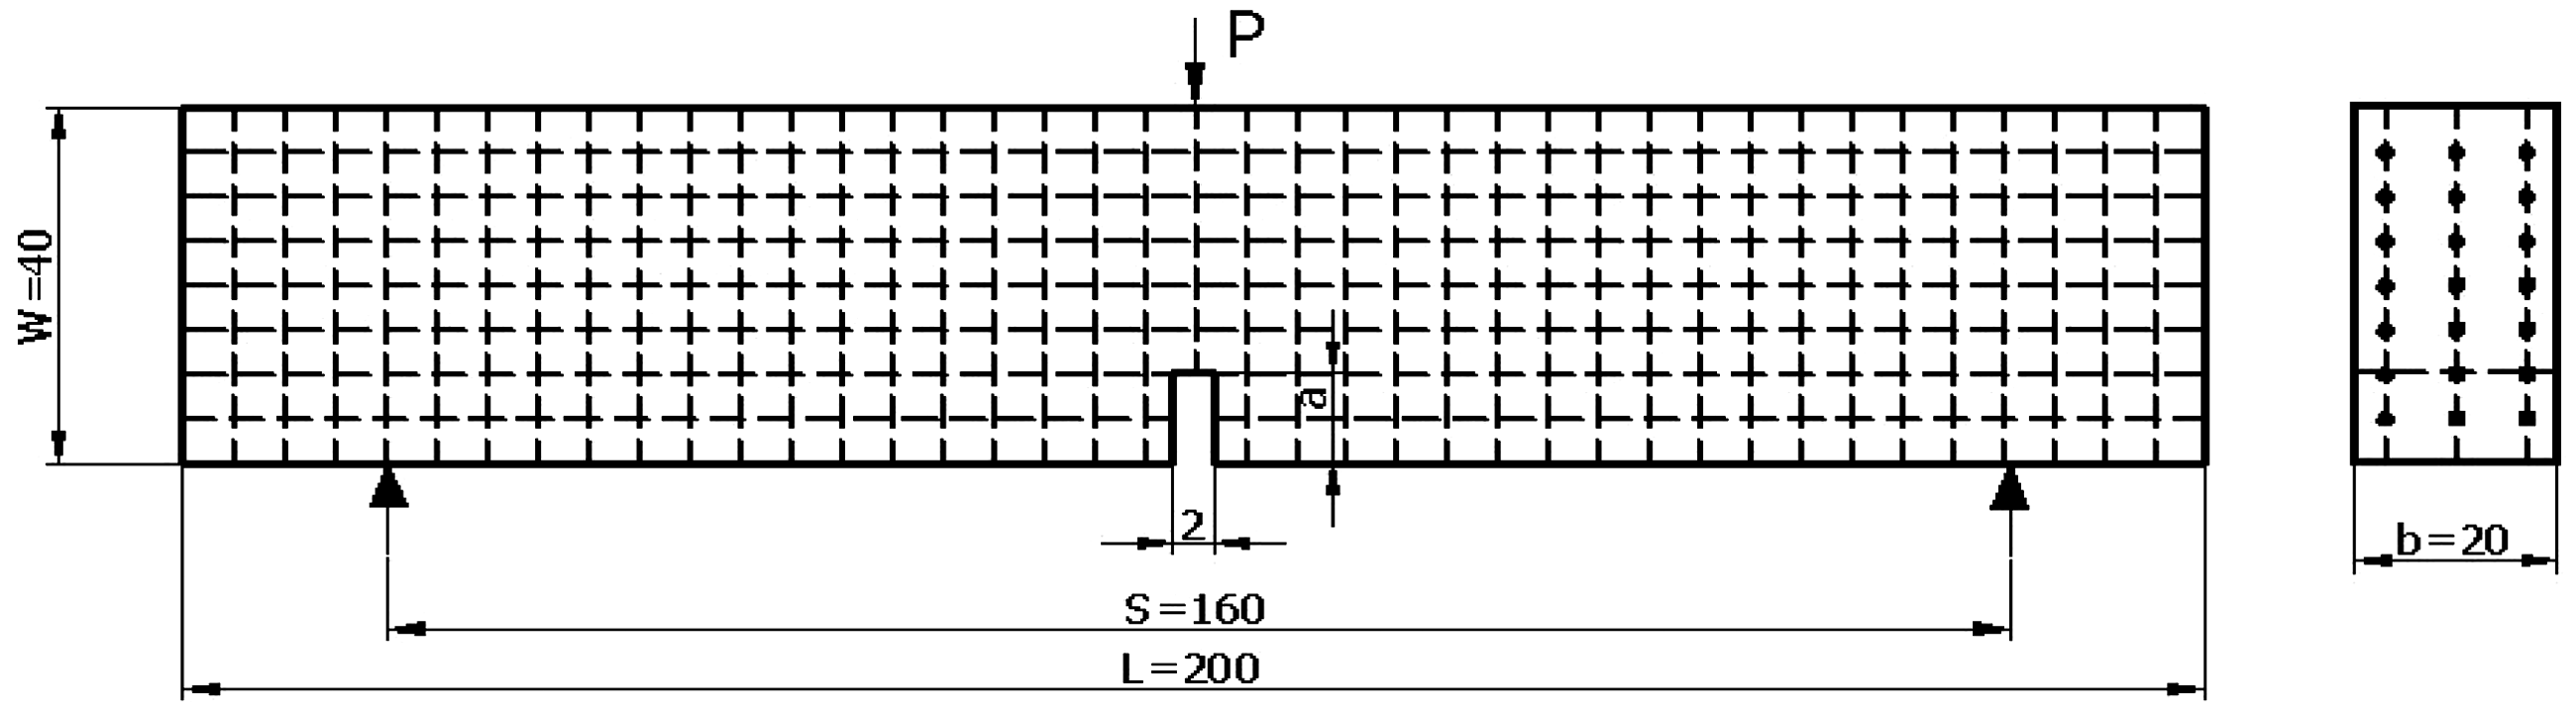
Geometrical configurations of the TPB specimen according to the mixed mode.
The sand fillers and polyester resin in the indicated ratio were poured into a disposable container and mixed together until the mixture became homogeneous. The polymer composite mixture was cast in aluminum trays, 200 mm × 40 mm × 20 mm, with polyvinyl alcohol film coated to facilitate demolding. The polymer composite in the trays was compressed and cured at room temperature for two days. Post curing was done at 80°C for 24 hours. The specimens ware cut by using a 2-mm-thick diamond saw to create notches 12 mm deep with the inclination angle θ to the beam axis as shown in Figure 2. The notch tips of the specimens were sharpened with a surgery blade. Since the polymer composite specimens were brittle, there was no need to open a starter fatigue crack. Geometrical configurations of the TPB specimen can be seen in Figures 2 and 3. An illustration of the textile glass fibers is shown in Figure 3.
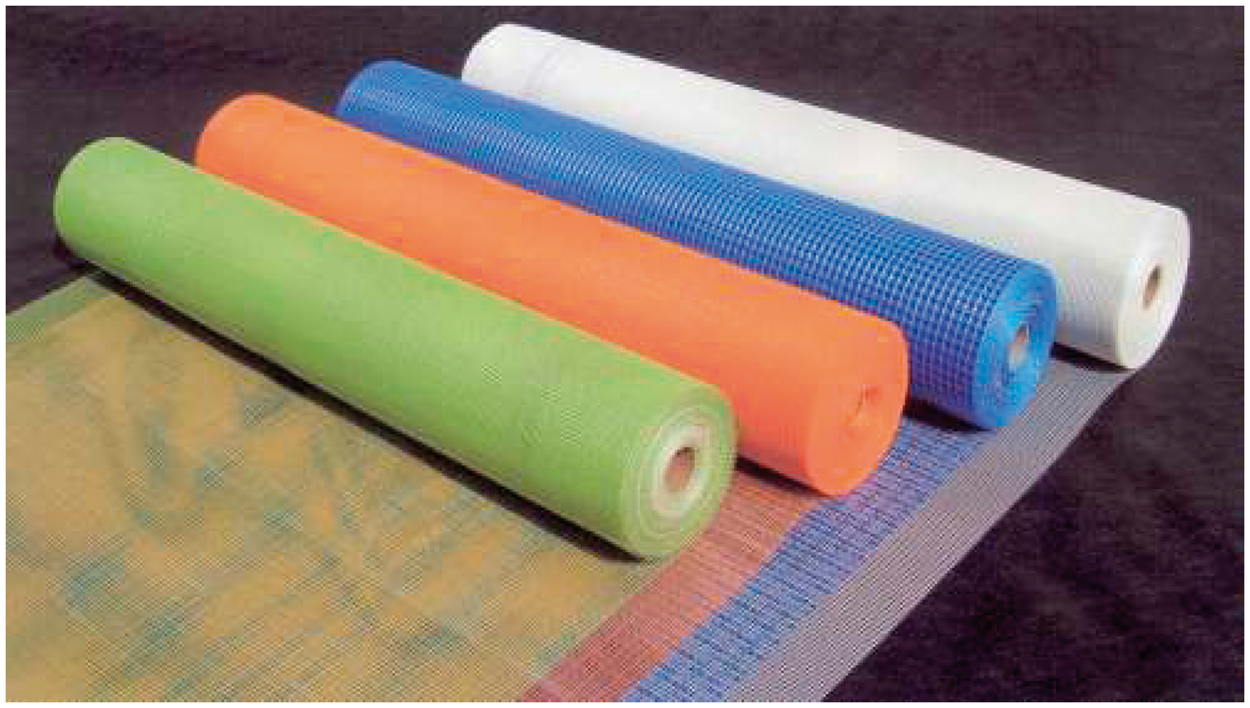
Geometrical configurations of the TPB specimen. The textile glass fibres.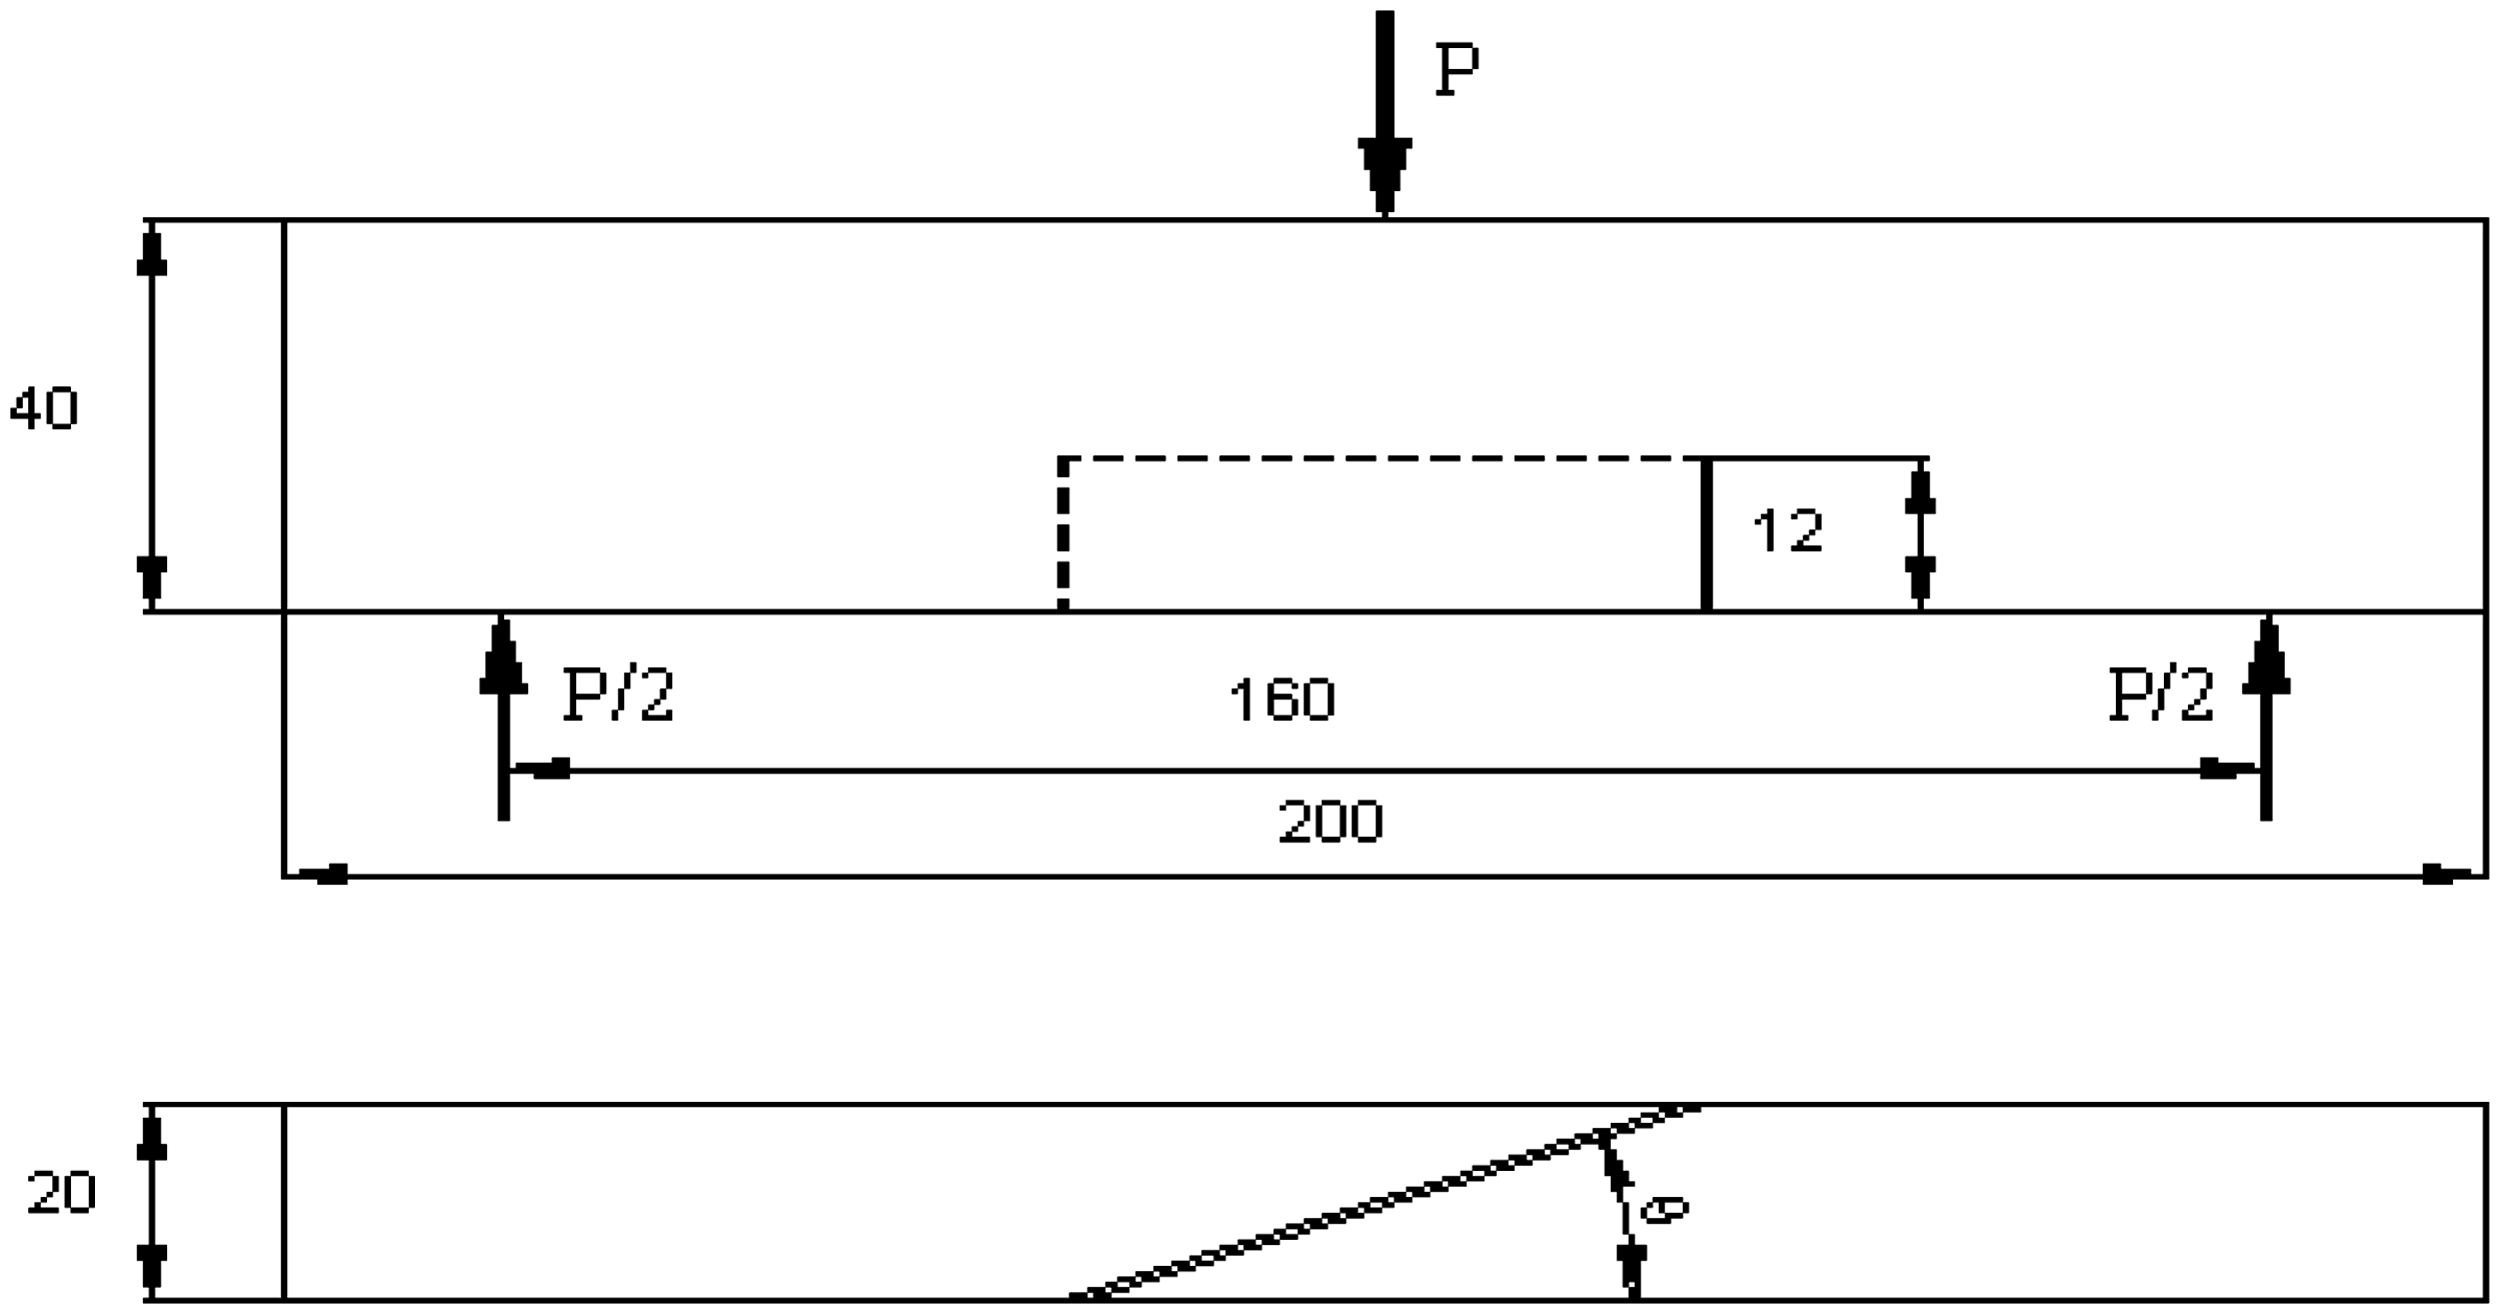
TPB Tests
Linear elastic fracture mechanics tests were carried out according to ASTM E 399. TPB tests were performed on five different a/W ratios (0.10, 0.20, 0.30 and 0.40) of cracks, which were opened perpendicular to the beam axes as shown in Figure 2. The crosshead speed was 1 mm/min of the test machine (LLOYD T50 K). All beams were tested to maintain a constant rate of increase of crack mouth opening displacement (CMOD), which was measured by a clip gage, attached to the bottom of the beam. During the test, deflections of the beam (δ) were measured by a linear variable differential transformer (LVDT) located 5 mm from the notch under the centerline of the beam. In order to determine the mechanical properties of the polymer composite with and without textile glass fiber content, TPB tests were also performed for unnotched beams. Maximum bending load (Pmax), maximum deflection (δmax), Young modulus in bending (Eb) and flexural strength (σb) were determined.
Polymer composite materials are brittle in nature but show an increase in both ductility and strength with addition of fibers. The unique mechanical properties of the interface between a fiber and matrix influence the strength and toughness of composite materials. Due to the interfacial failure, fibers are pulled out from the matrix and bridging forces are developed on the crack surface. The toughening component considered in the present work is due to the fiber bridging in the wake region. The bridging forces shield the crack and hence reduce the stress intensity factor at the crack tip. Interfacial shear strength plays a dominant role since the bridging pressure from fiber pull-out is governed mainly by shear stress resistance between fibers and the matrix. High levels of interfacial shear strength may prevent fibers from complete debonding and result in fiber fracture.
Load–displacement curves for by the weight 3 : 2 : 1% fiber ratio are shown in Figure 4. After the load arrived at the peak point, it decreases suddenly because of matrix cracking completely. Two important factors affect the fracture toughness in steel fiber reinforced polymer composite. One of them is fiber pull-out and the other is the bridging effect. The load is stable and displacement increases during fiber pull-out and fiber elongation which are seen in Figure 4. The loads fall because of fiber breakage from the bottom to the top.
Load-displacement curves for different reinforcement content.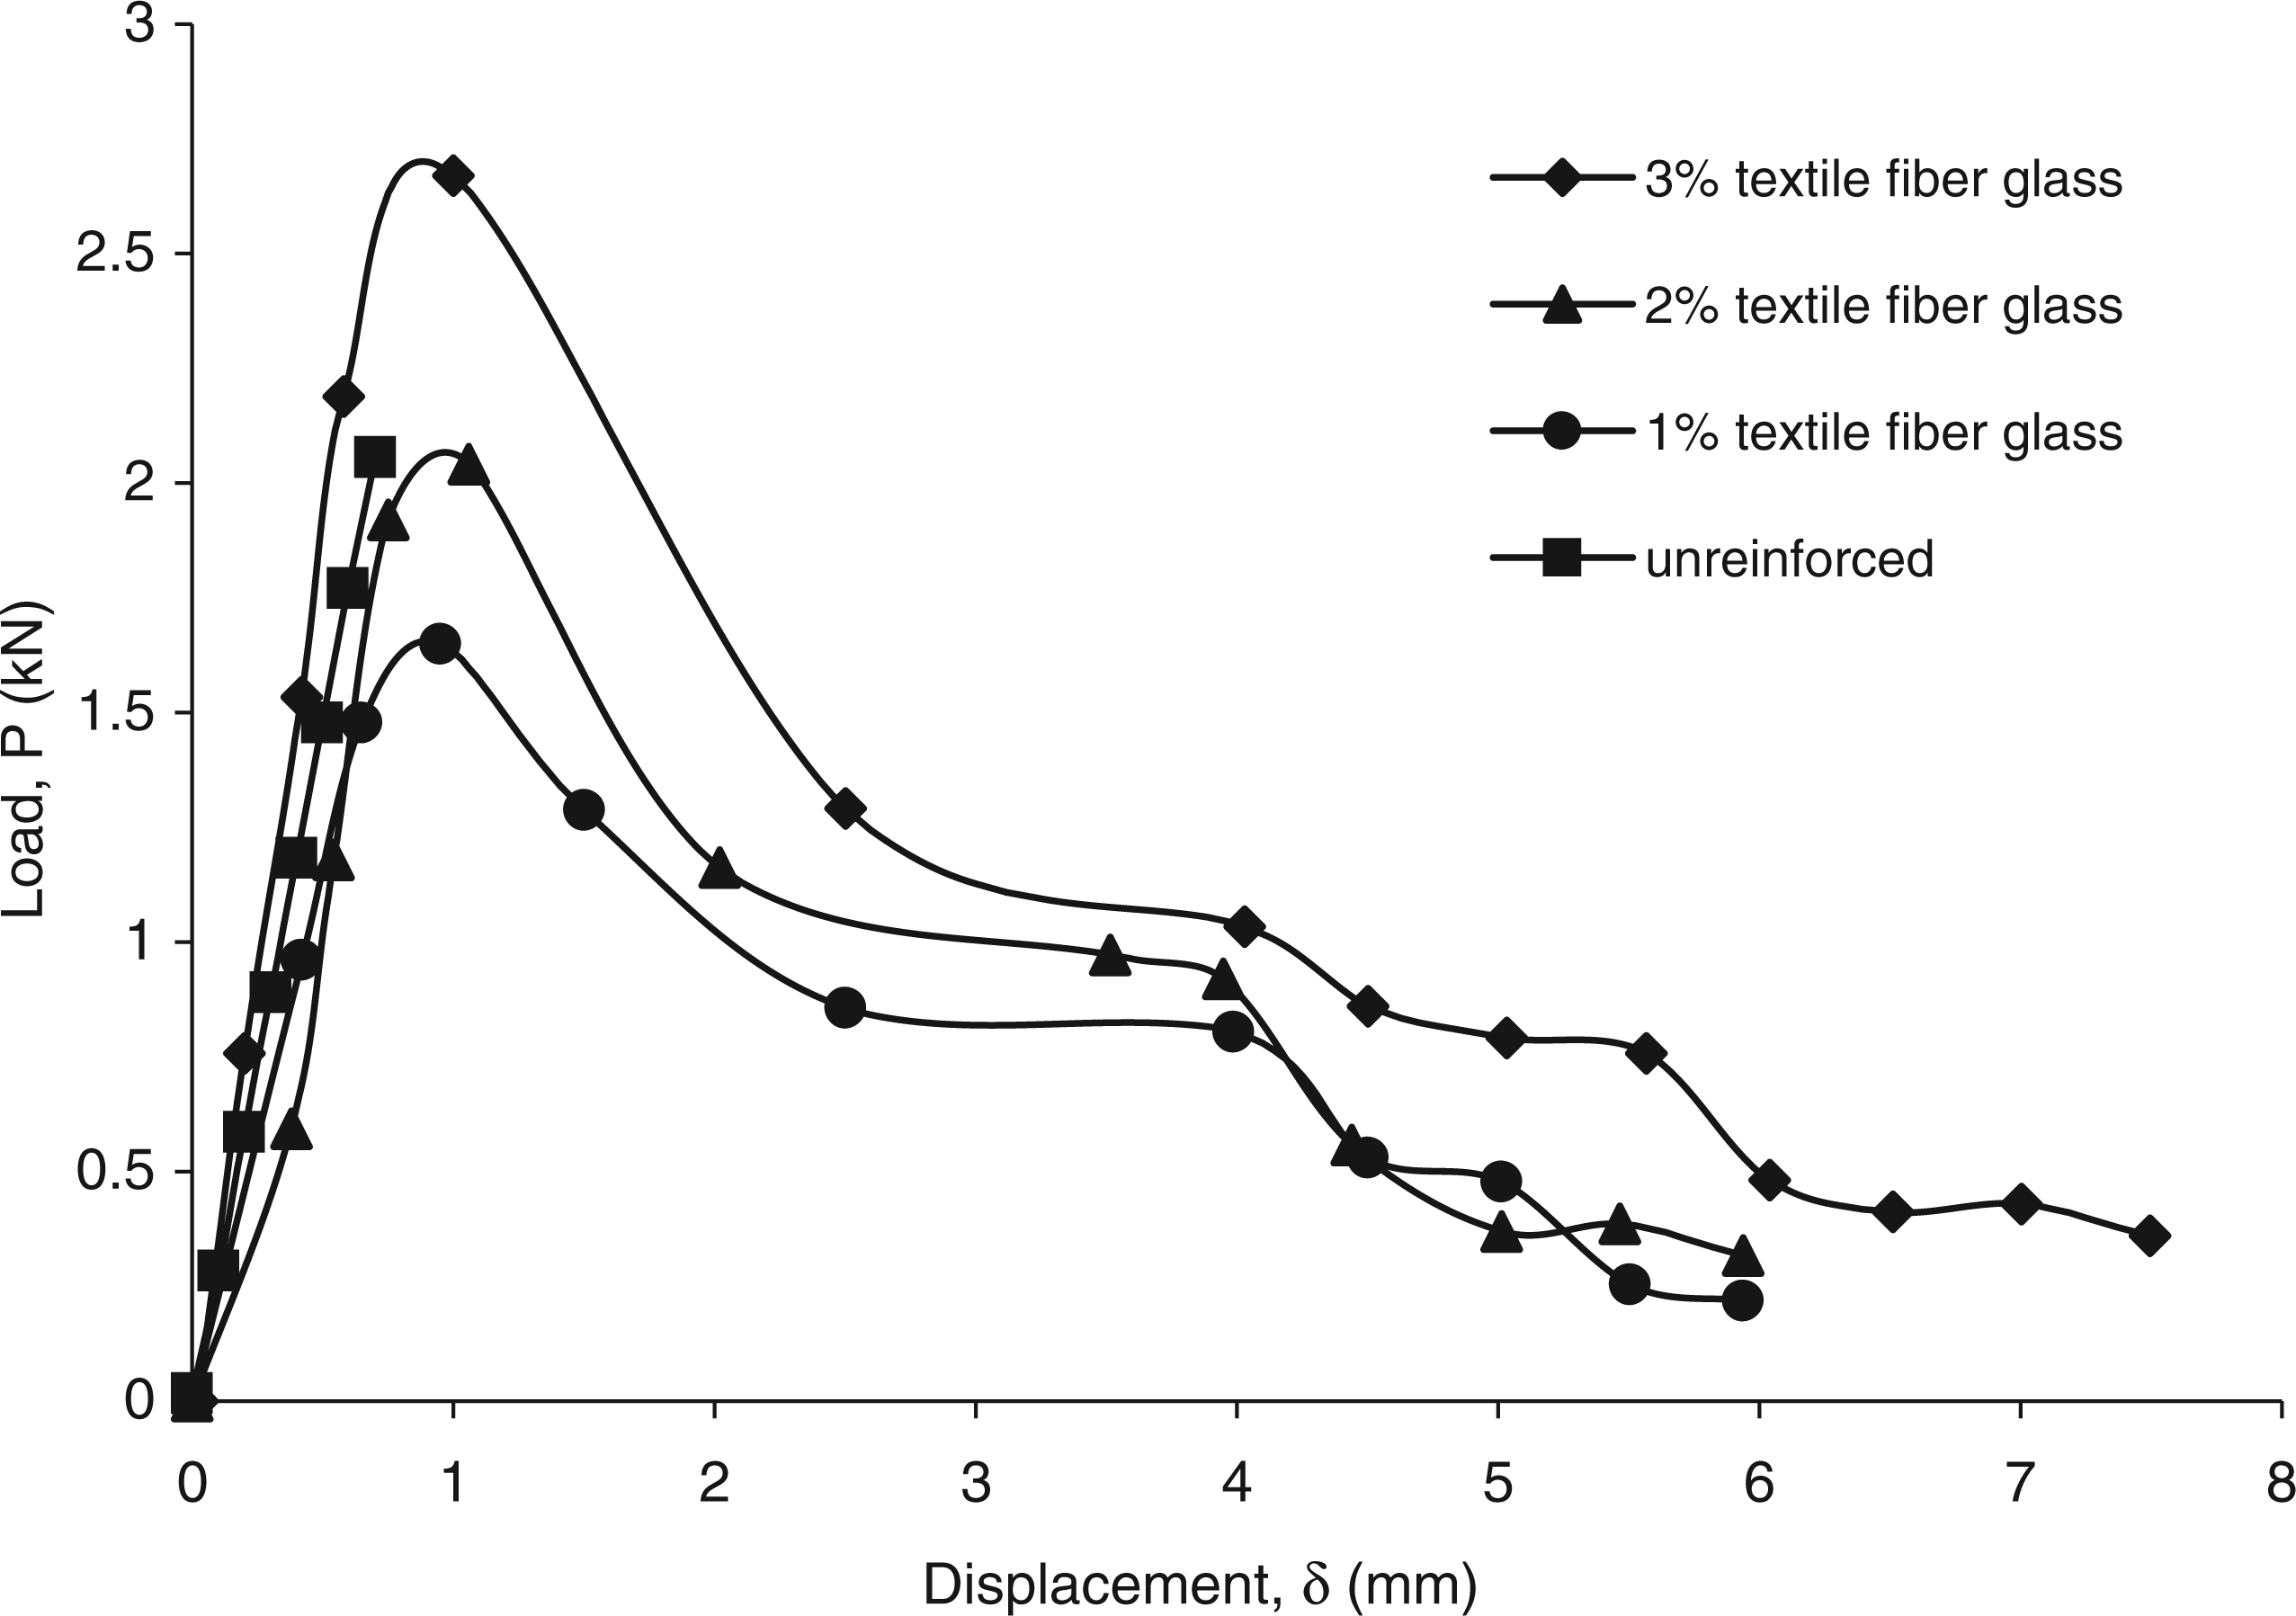
Fracture Mechanics Tests
Mode I fracture toughness tests of the polymer composite system were conducted on TPB specimens with the applicable ASTM standard E-399 for evaluation of KIC. 8 All mixed mode fracture toughness tests were carried out using a modified TPB specimen.8–20 The modification of the specimen is the slanted starting notch as shown in Figure 1. The crack inclination angle θ from the specimen axis is measured. The conventional TPB specimen is obtained at the inclined crack angle of 90°. When the crack reduces from 90° and bending loads are applied, Mode I and Mode III crack surface displacements are present. Therefore, the Mode I and Mode III fracture behavior can be investigated. In the mixed mode situations, the crack growth direction can deviate from the original crack plane.
In order to obtain KIC and KIIIC the linear elastic fracture mechanics tests on inclined cracks on the modified TPB specimens for θ = 30°, 45°, 60°, 75° and 90° according to ASTM E 399 and the ratio a/w = 0.30 were carried out. The crosshead speed of the test machine was 0.05 mm/min. All beams were tested to maintain a constant rate of increase of the CMOD which was measured by a clip gage mounted on the knife edge. During the test, the deflections of the beam were measured by a LVDT located 5 mm under the centerline of the beam from the notch. Under the mixed mode conditions, the crack plane may change due to the crack rotation. Manoharan et al. 21 stated that this event was a particular problem for Mode III components. By arranging the loading line parallel to the crack front, the crack can be grown in Mode I and then resolved into the values of KI and KIII for the original case.
TPB tests were conducted for each type of specimen at room temperature. Three replicate tests were performed for each type of specimen, and the average of the test results was used in the evaluation.
Numerical Results and Discussion
Flexural Strength and Flexural Modulus
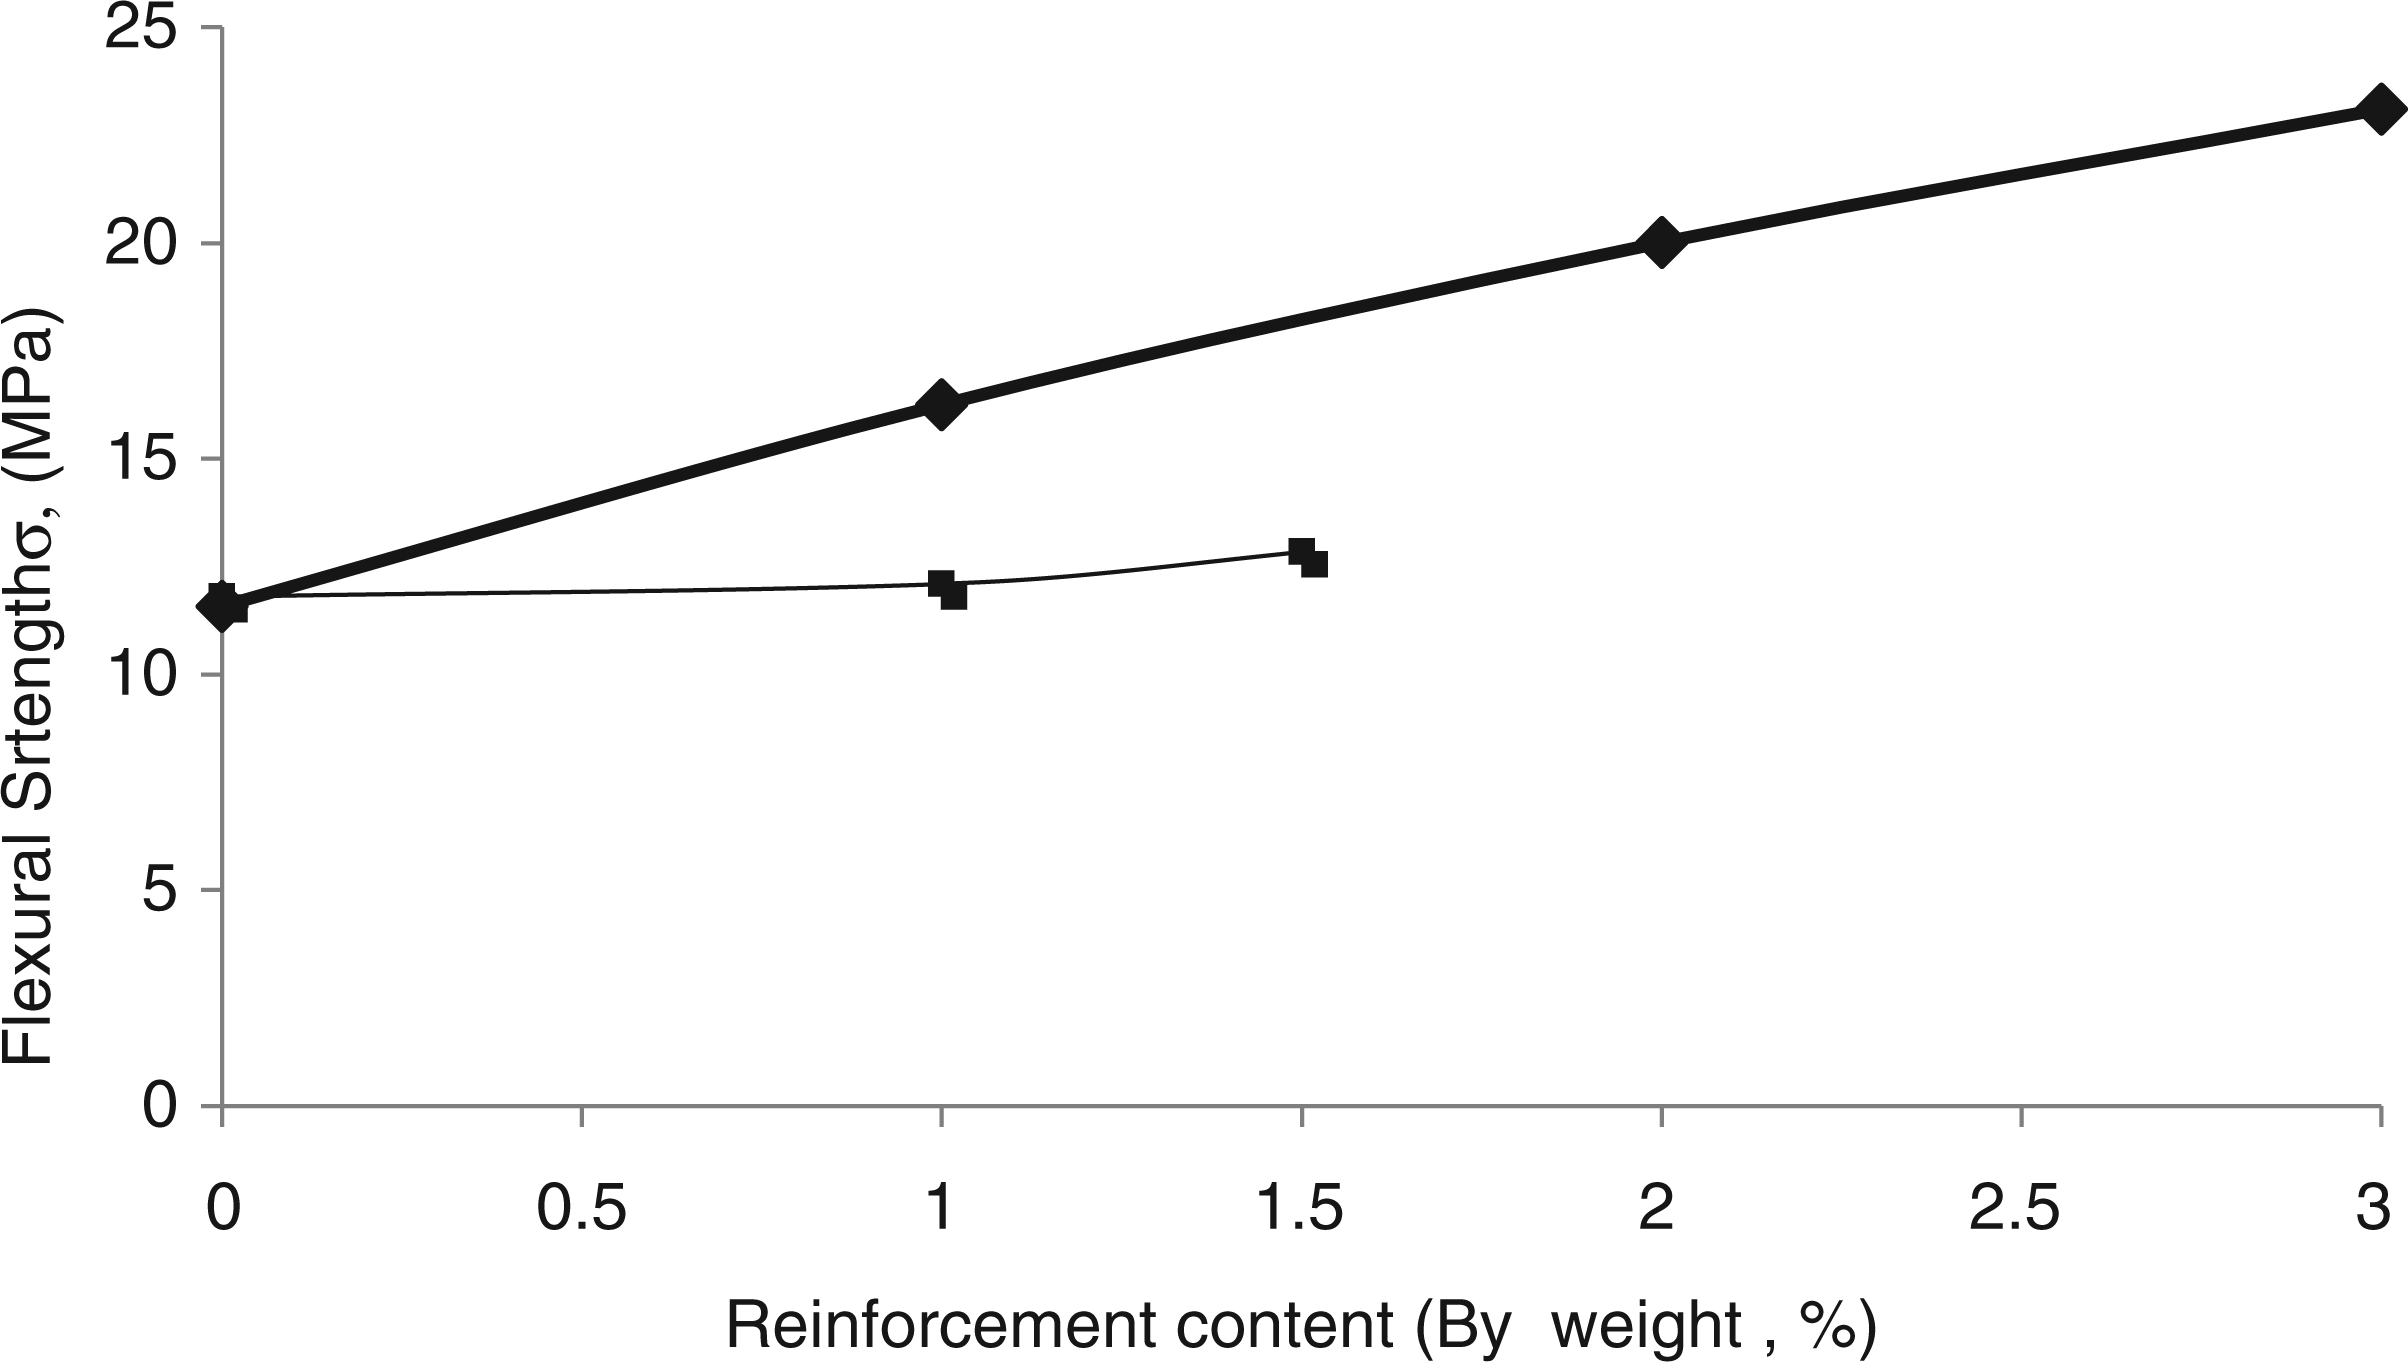
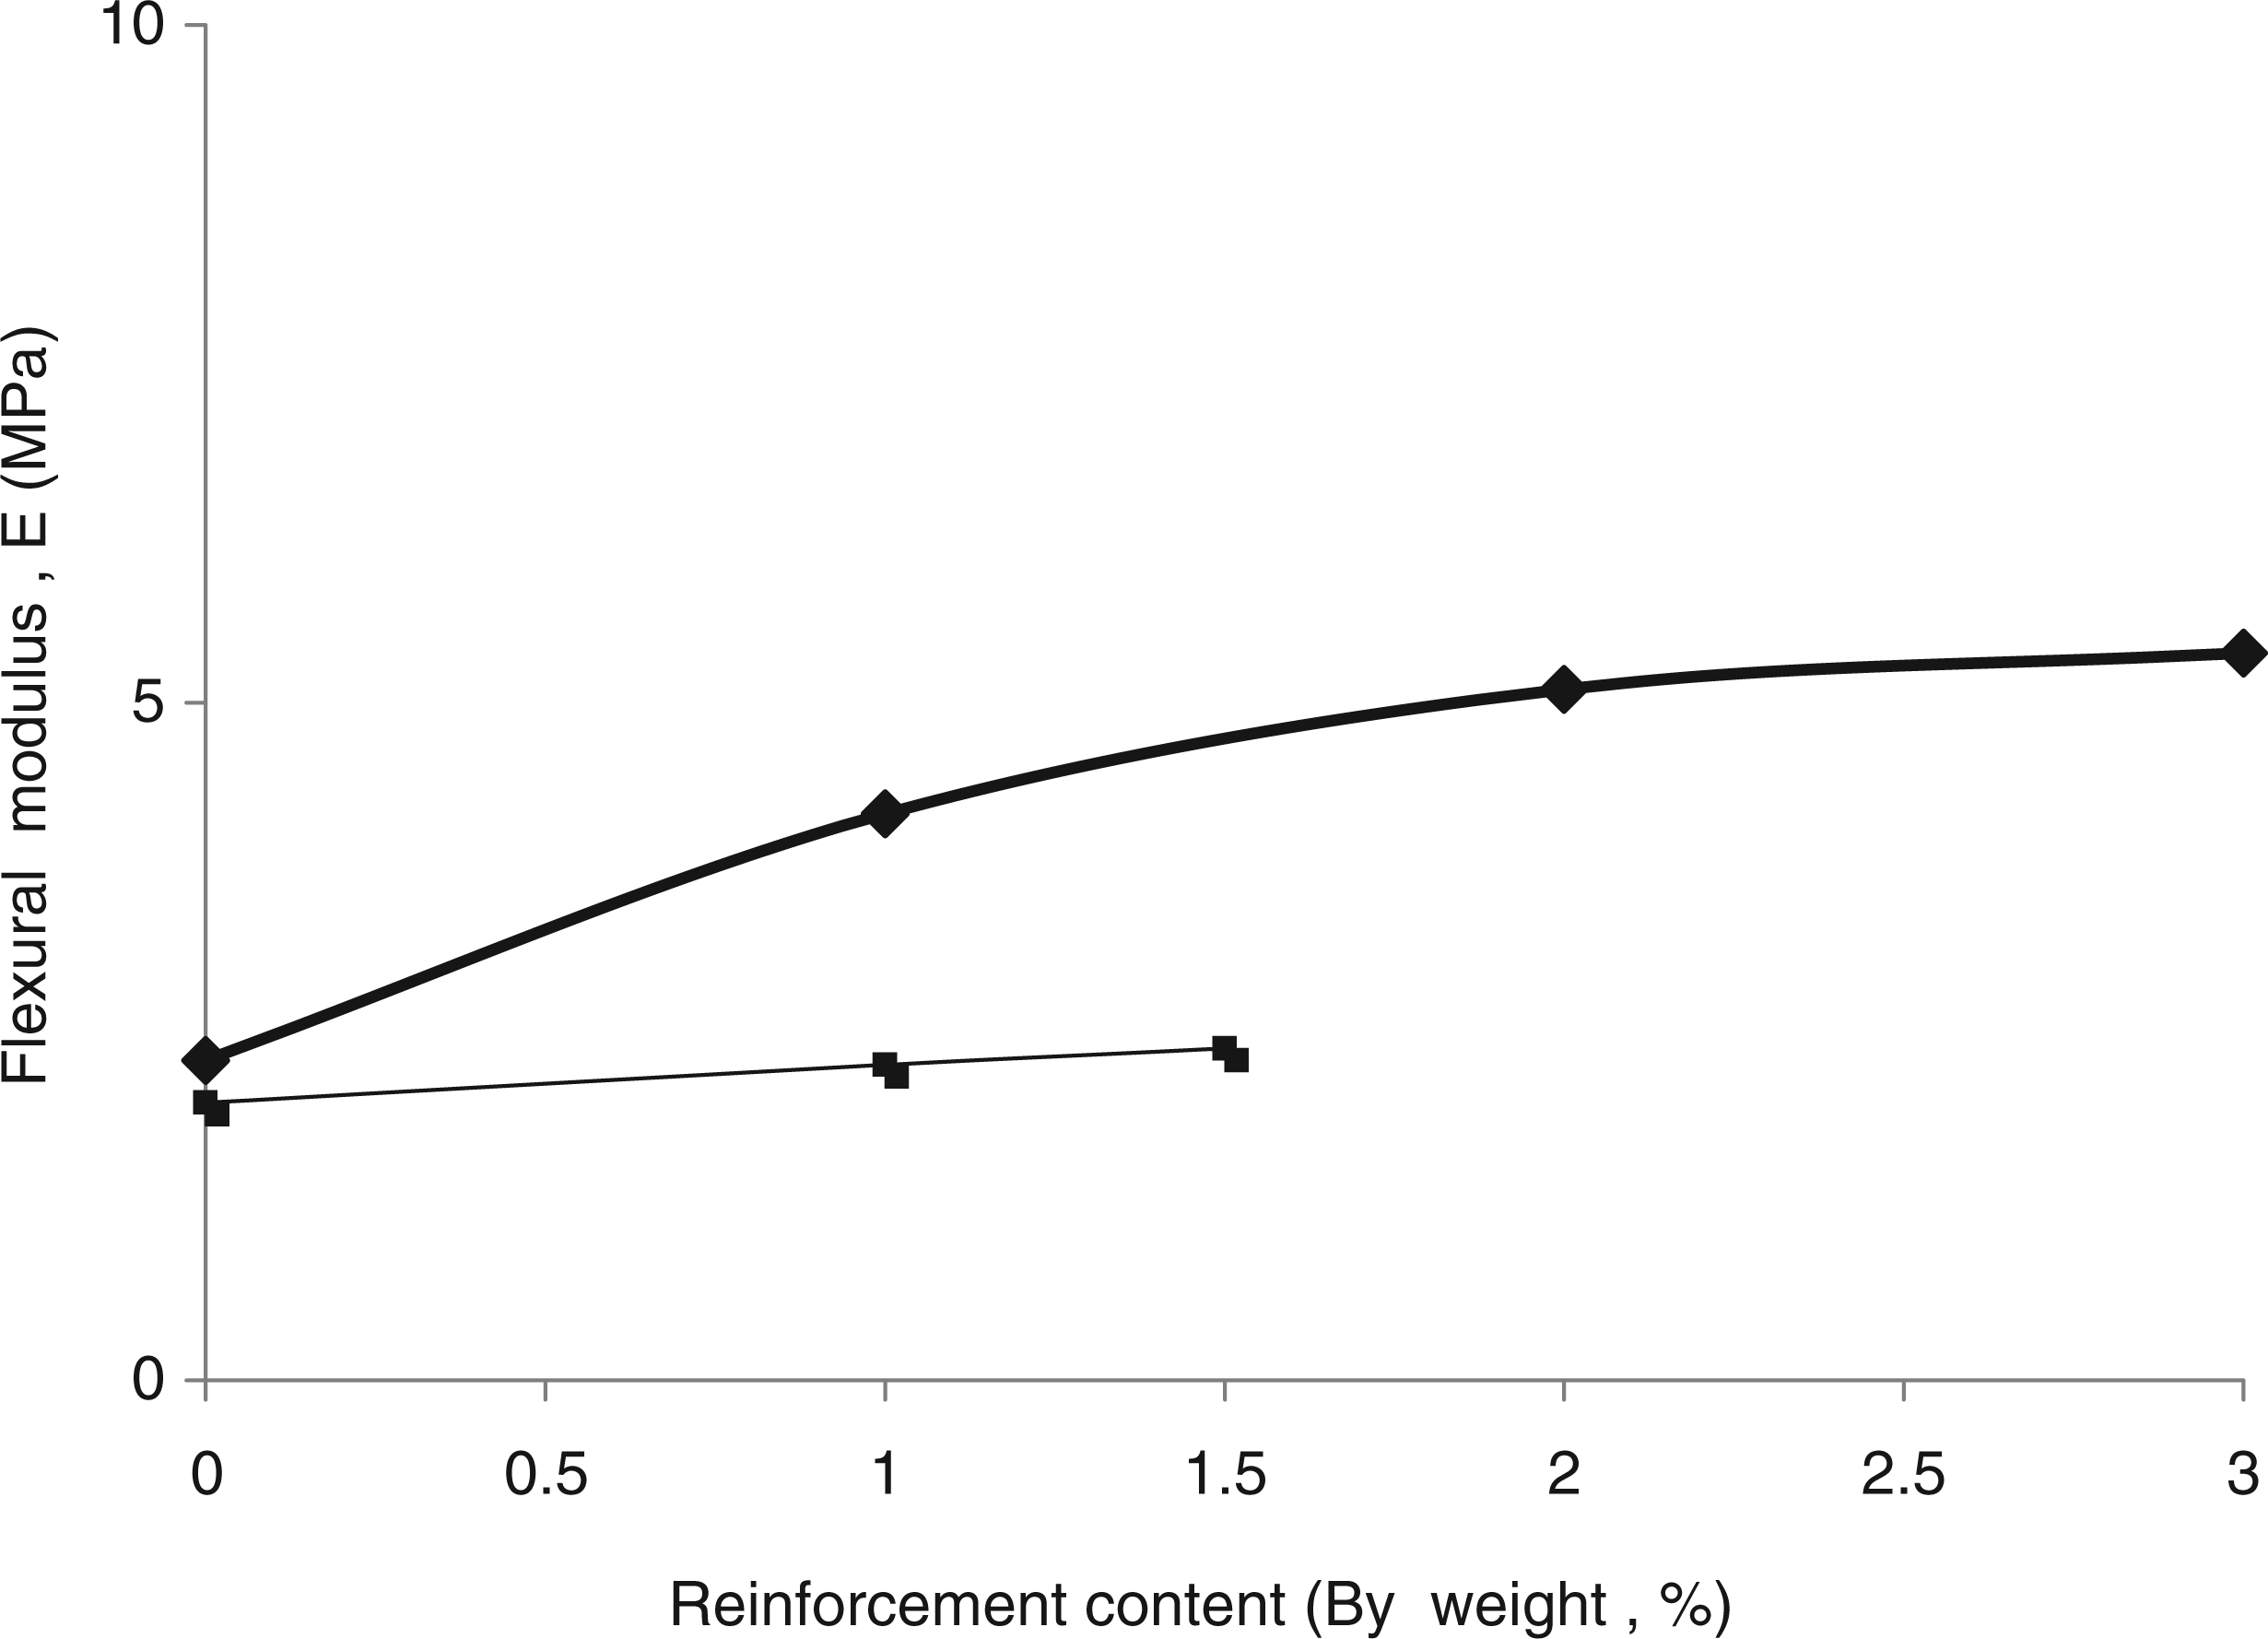
The polyester resin content was 16.50% and the ratios of textile fiber contents were 1, 2 and 3% by weight of the polymer composite system. TPB tests were conducted for every type of specimen at room temperature. Three replicate tests were performed for each type of specimen, and the average of the test results was used in the evaluation. The failure of the textile fibre glass reinforced composite system is shown in Figure 5. At room temperature the flexural strength of the polymer composite system with and without steel fiber content increased with increasing ratio of the content as shown in Figure 6. The maximum flexural strength was obtained for the 3% steel fiber ratio. The 16.5% polyester and 1% steel fiber reinforced composite system had a 48.1 higher strength than the corresponding polymer system without fibers. The flexural modulus increased with increasing steel fiber content as shown in Figure 7. The maximum flexural modulus was obtained for the 3% textile fiber ratio. The 16.5% polyester and 1% steel fiber reinforced composite system had 96.5% higher modulus than the corresponding polymer system without fibers. In addition, the 16.5% polyester and 2 and 3% steel fiber reinforced composite systems had 146% and 173% higher modulus respectively than the corresponding polymer system without steel fiber content. The flexural modulus was obtained from the linear portion of the stress–strain curve.
The failure figure of the textile fiber glass reinforced composite system of 3% by weight and a/W = 0.10. Variation of the flexural strength with reinforcement content for the polymer composite. Variation of modulus with reinforcement content for the polymer composite.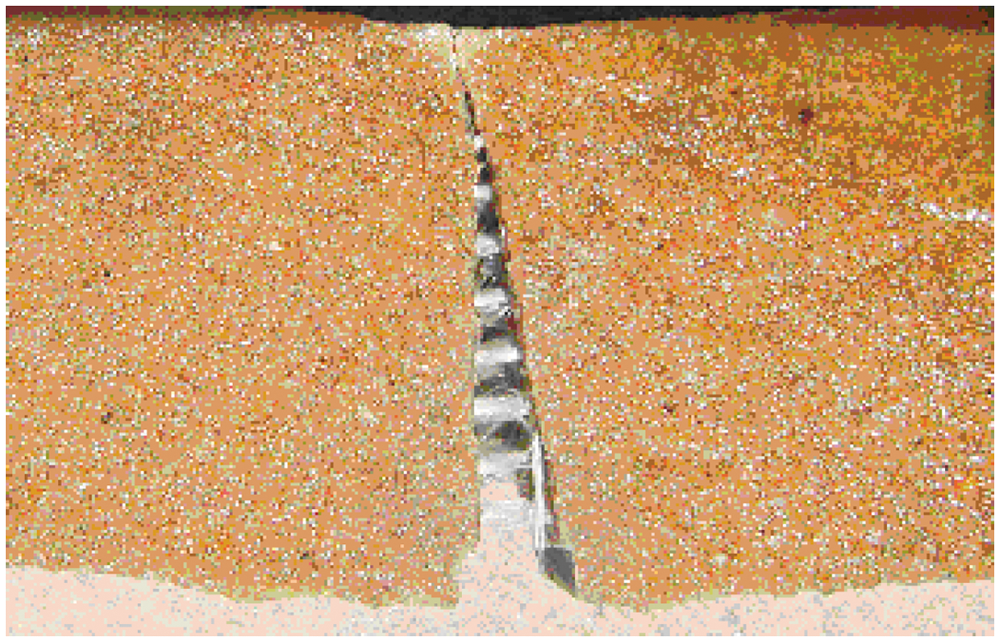
Determination of Critical Stress Intensity Factors According to Mode I Using Different Methods
There are several methods that have been developed to determine the critical stress intensity factor KIC: the initial compliance technique, the notch depth method, the J-integral method, etc. For this study, linear elastic fracture mechanics tests were evaluated for KIC according to the ASTM E 399. The graph of 3% textile glass fiber composite system was given as an example for these methods.
Compliance Method
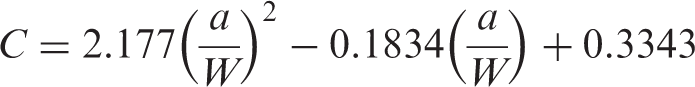
The compliance method is an effective method for determining the fracture characteristics of brittle materials. Compliance can be calculated from a load–displacement curve or from a load–crack mouth-opening displacement curve. In the present study the load–crack mouth-opening displacement curve was preferred. Then, a second-degree polynomial was obtained from the compliance (C) versus a/W graph for textile glass fiber reinforced composite systems (see Figure 8). The compliance equation for the a/W ratio between 0.10 and 0.40 was found as follows:
Load-displacement curves for the 3% textile glass fiber reinforced composite system.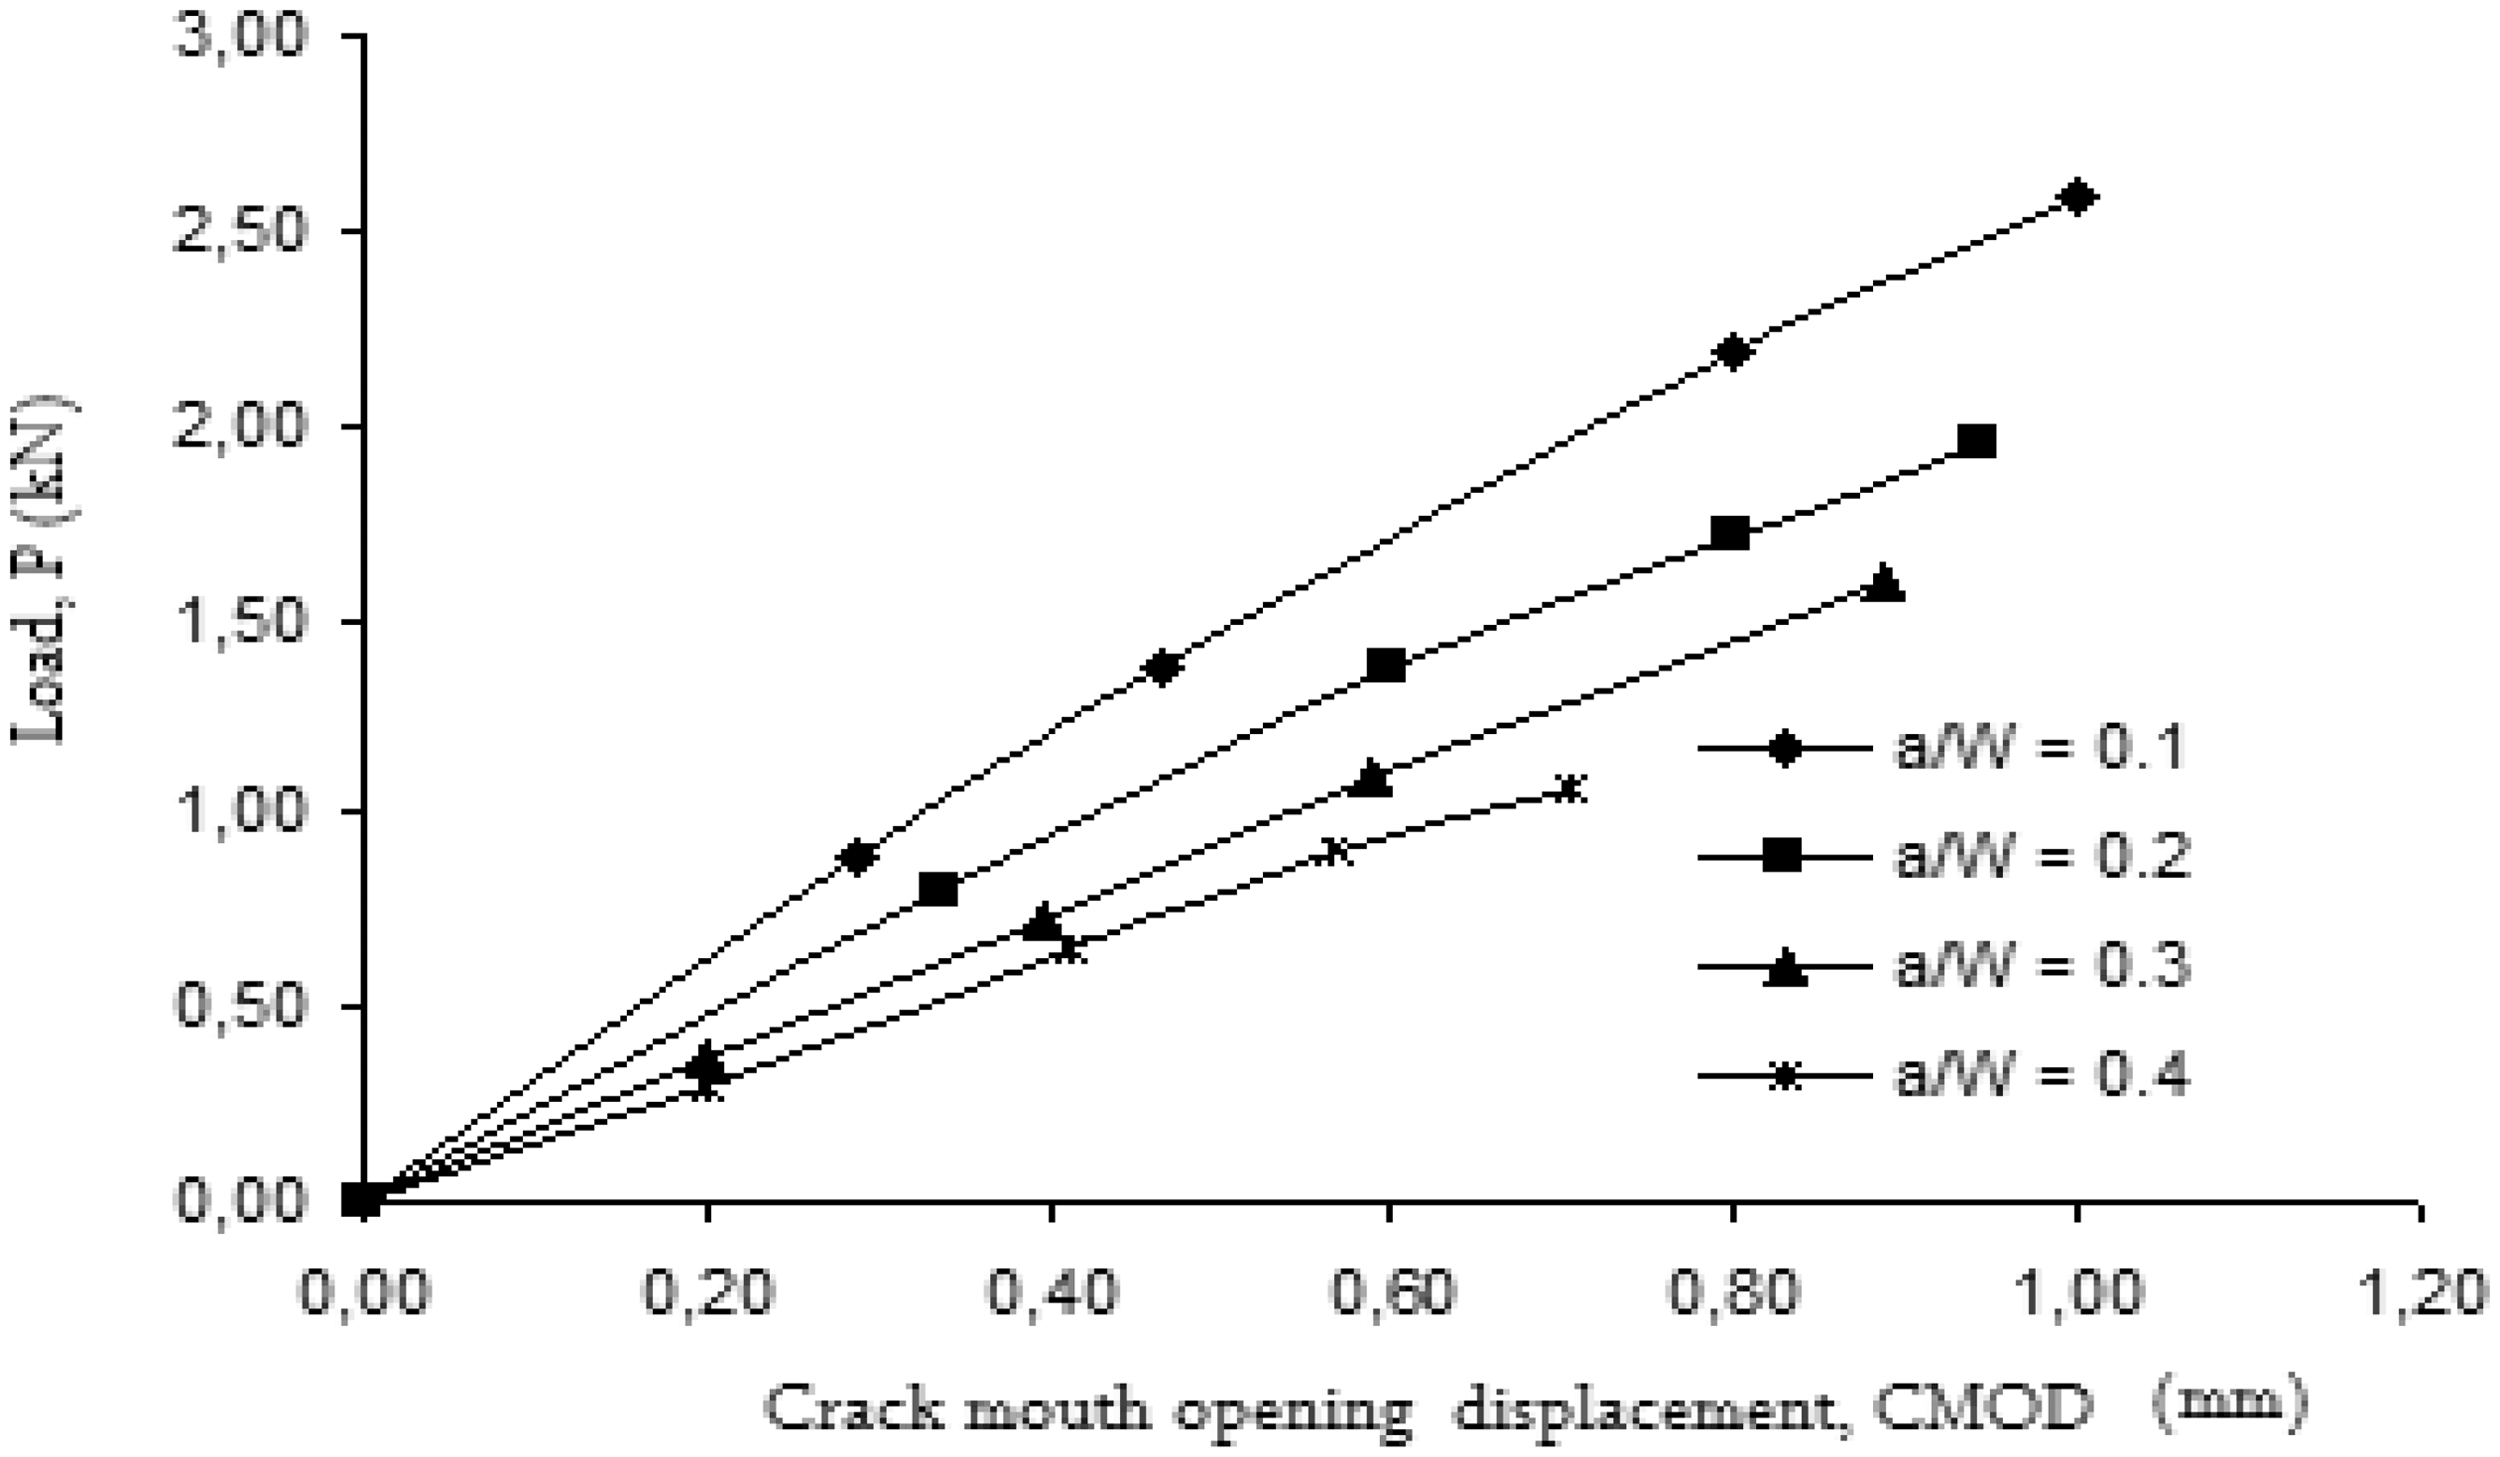
Critical stress intensity factors were obtained from the following equation for the plane strain case:
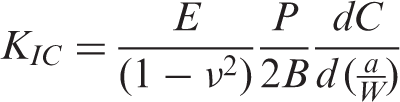
where P is the peak load, which was determined from the load–deflection curves (Figure 9) and (1 - ν²)/E is valid for the plane strain case. E is the flexural modulus and ν is the Poisson ratio.
Variation compliance to the notch-to-depth ratio a/W of the 3% textile glass fiber reinforced composite system.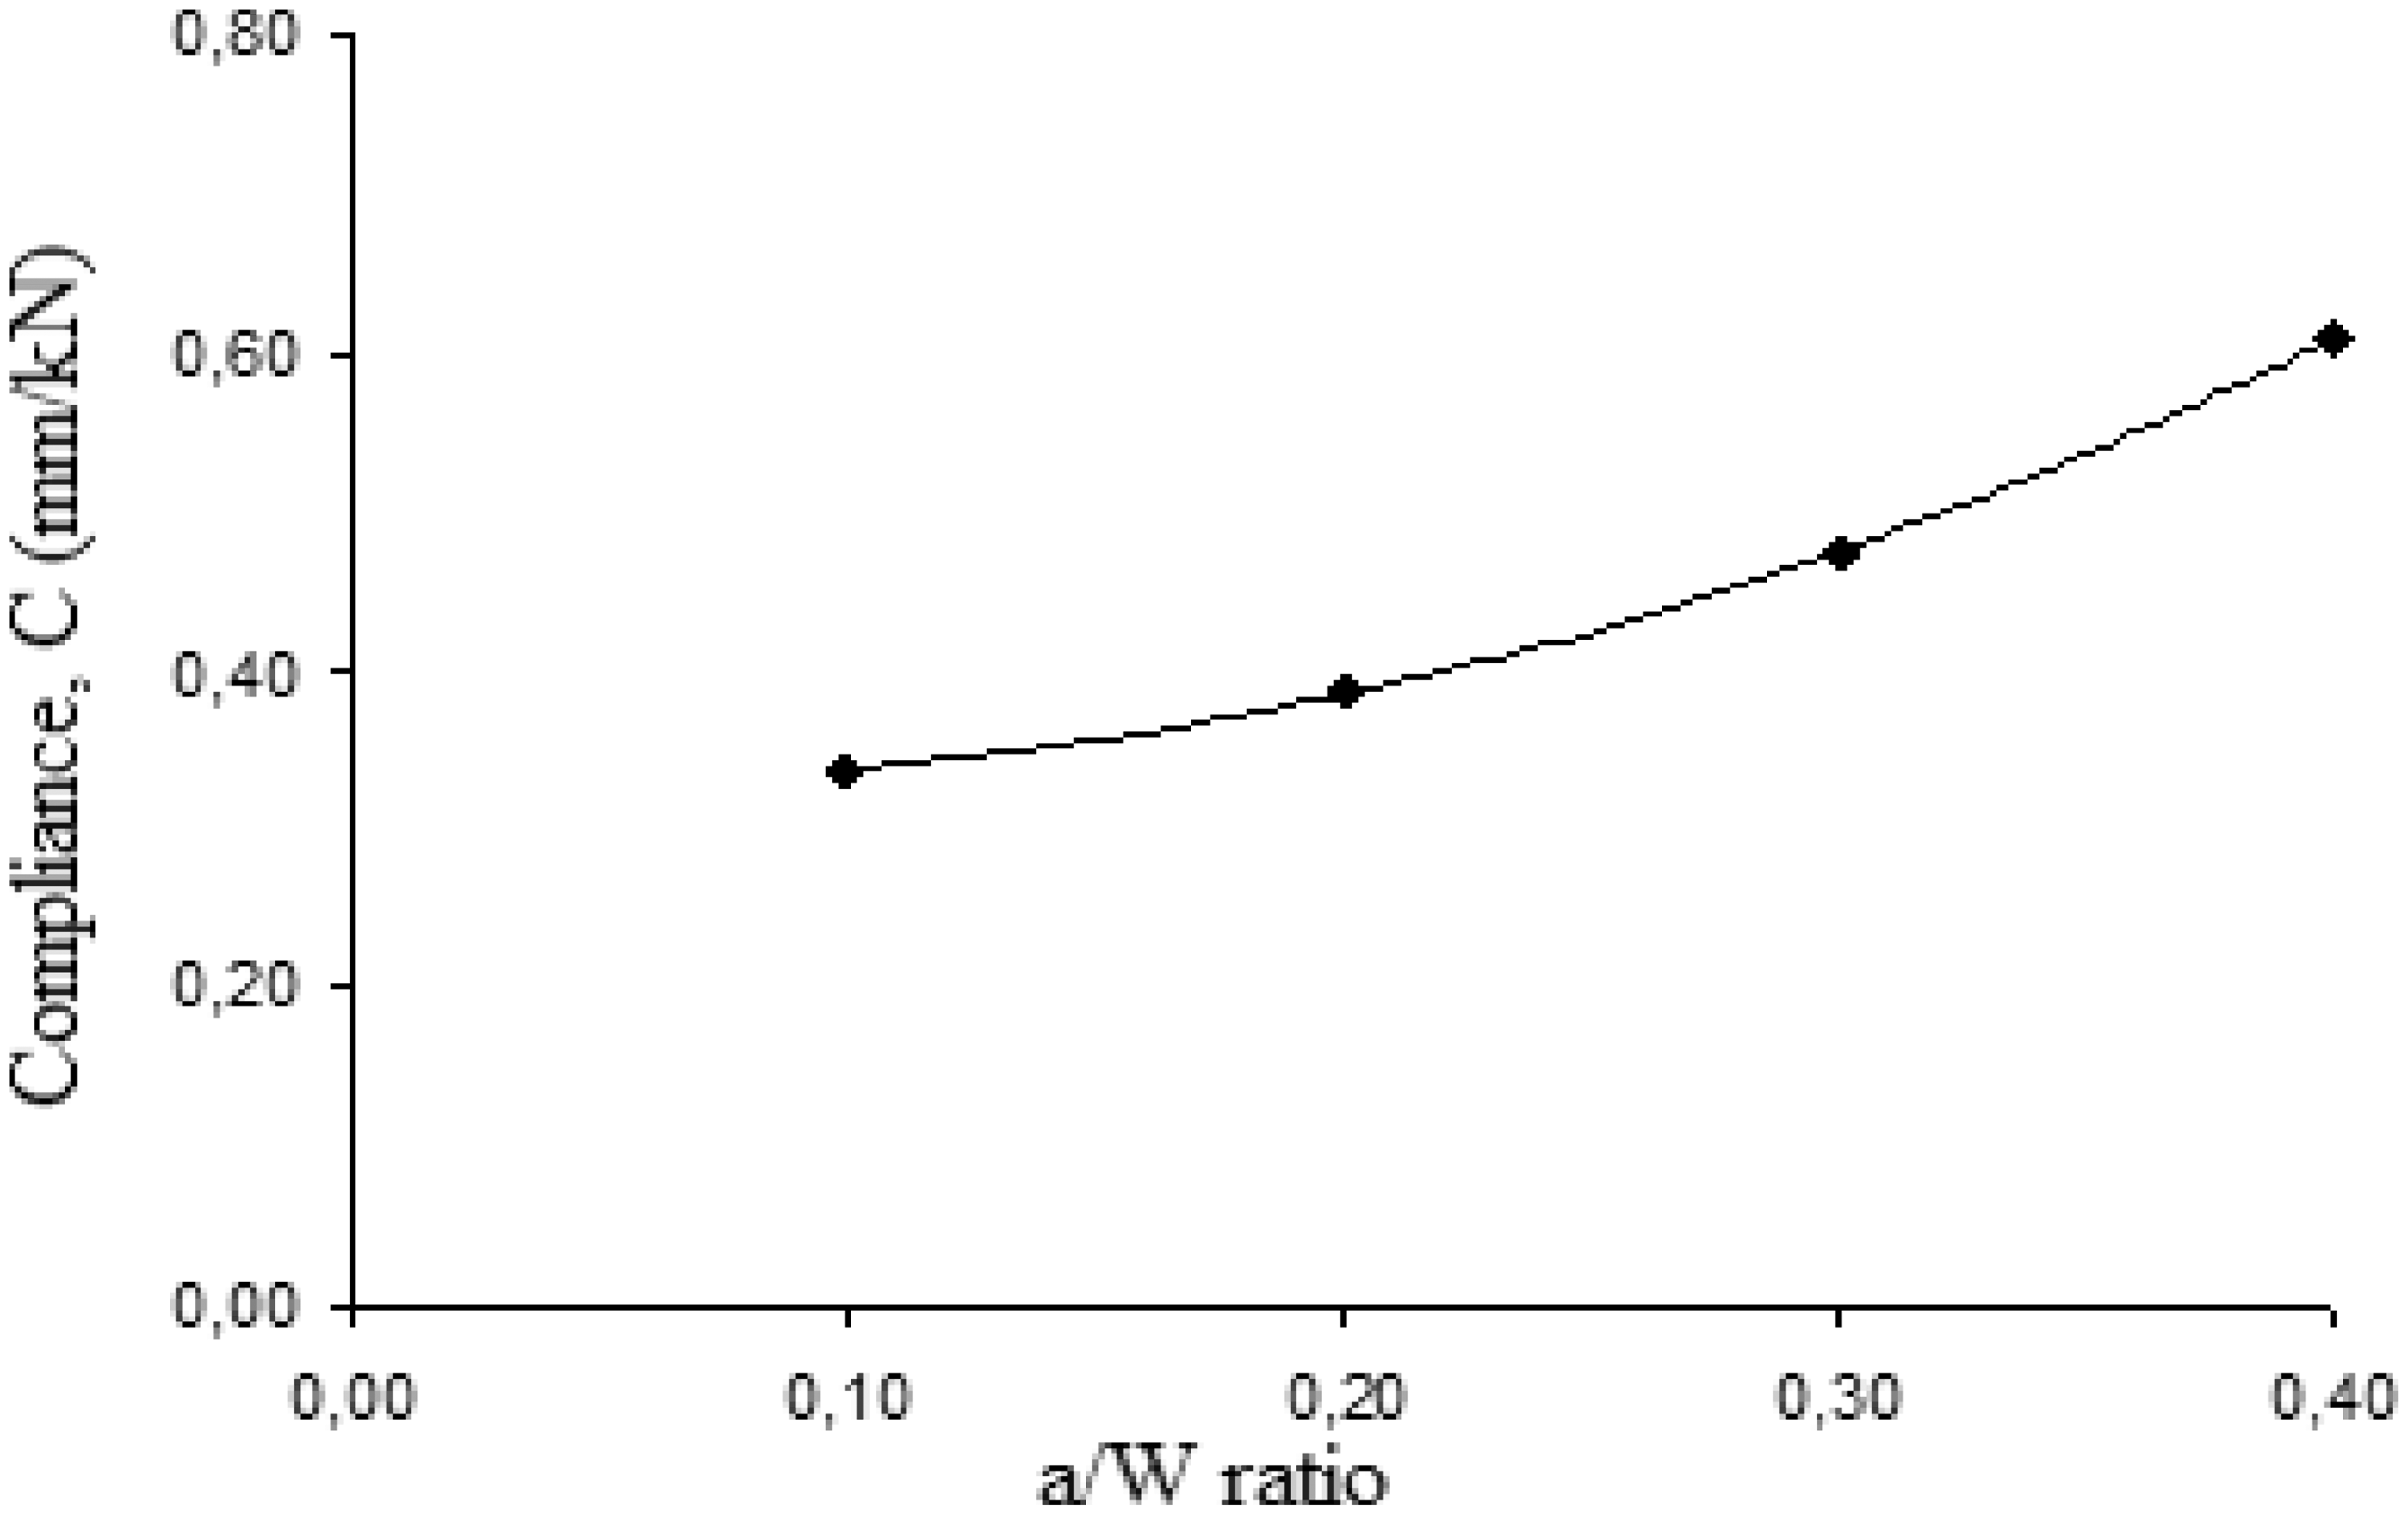
Initial Notch-Depth Method
The linear elastic fracture mechanics stress intensity factor for a beam under TPB was developed by Tada et al. 22 This method is based on the calculation of the critical stress intensity factor by using an initial notch-depth method. According to this method the equation of the Mode I stress intensity factor is
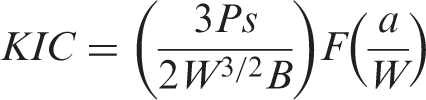
where P is the required peak load for propagation of the crack, s is the support length of the beam, (W×B) is the cross-sectional area of the beam and a/W is the notch-to-depth ratio as shown in Figure 1. F(a/W) is the correction factor, which depends on the finite size of the specimen:
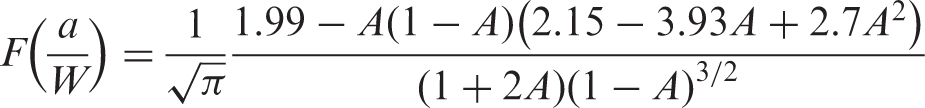
where
The Mode I critical stress intensity factors of the 16.50% polyester resin and 1, 2 and 3% textile glass fiber polymer composite systems were calculated from Equation (1). The empirical Equation (6) is applicable to any a/W ratio with 0.5% sensitivity. The results are given in Figure 10.
Load-displacement graphs with notched and unnotched specimens of the 3% textile glass fiber reinforced composite system.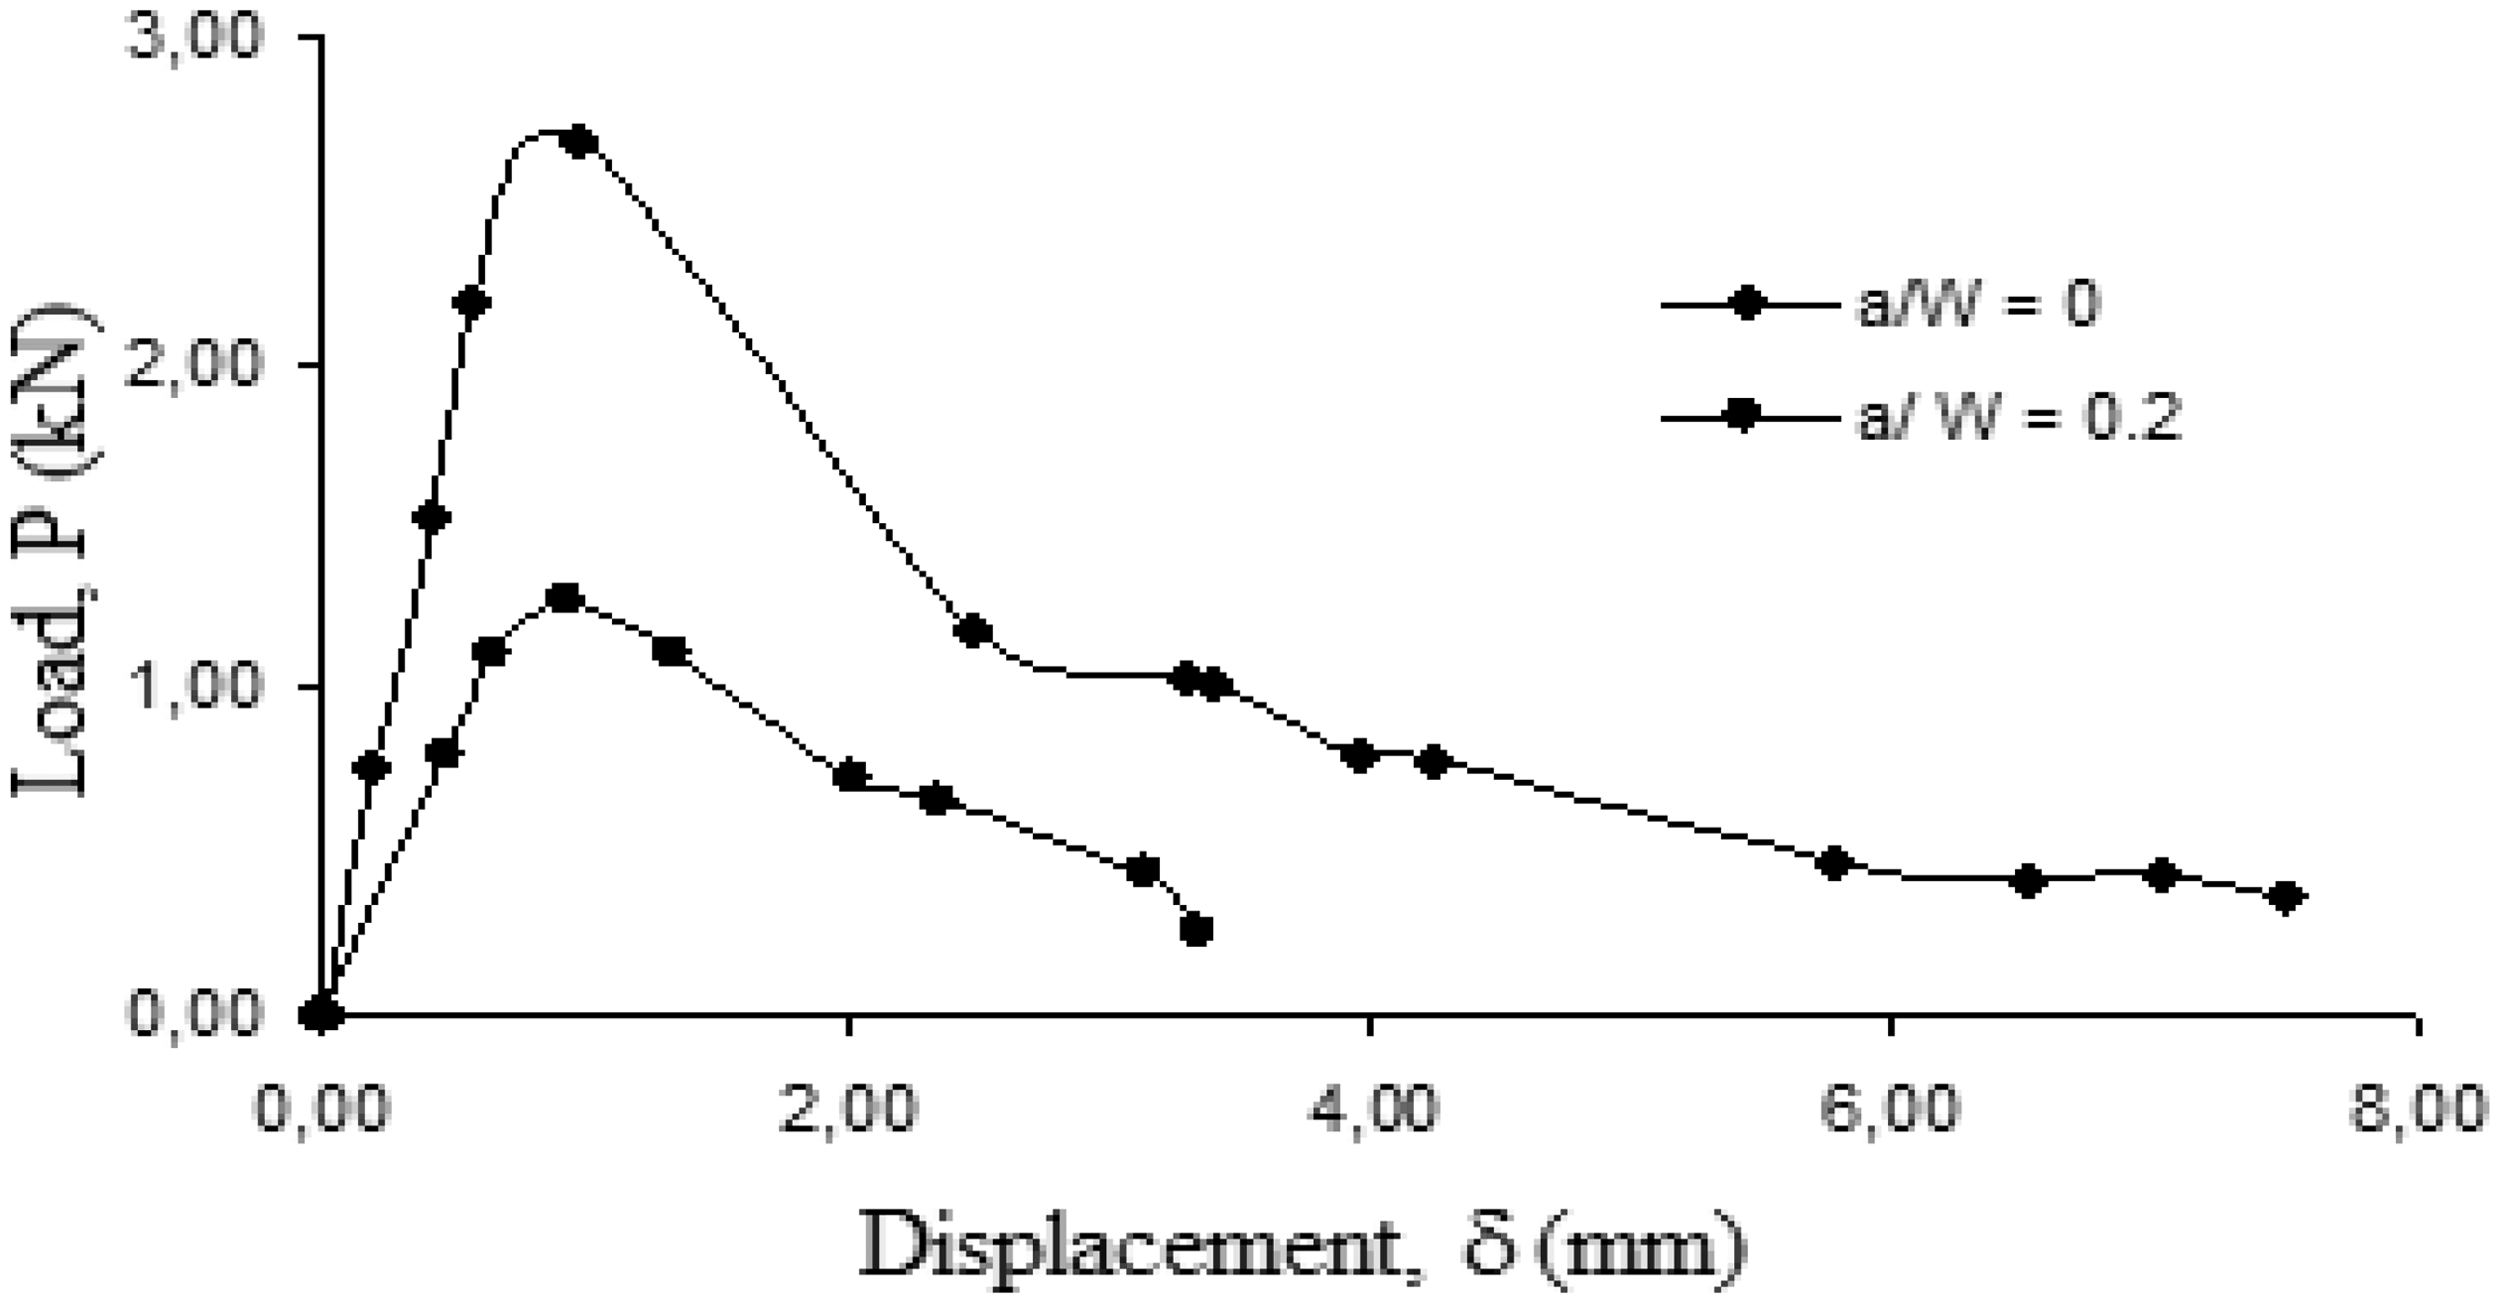
J-integral Method
The J-integral method can be applied to find the fracture toughness of a nonlinear elastic material. 23 This method is based on the determination of an energy, which expresses the change in potential energy when a crack extends. That is,

where B is the width of the specimen, U is the potential energy and a is the length of the crack.
There are several methods which have been developed to determine the J-integral such as the initial notch depth sample method, 24 the deep crack sample technique 25 and the notched versus unnotched sample technique. 26 Since the notched versus unnotched sample technique gives better results for fiber-reinforced composite materials, 27 in this study this method was preferred to obtain the J-integral values. According to this method, the J-integral was calculated by subtracting the elastic energy area under the load–displacement curve of the notched sample from the area under the load–displacement curve of the same type of unnotched sample:
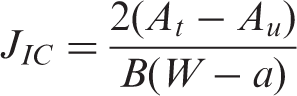
where At and Au are the strain energy of the notched and unnotched sample respectively.
The load–deflection curves of the notched and unnotched specimens with 16.50% polyester resin and 3% textile glass fiber polymer composite system are shown in Figure 11. With a planimeter, the areas under curves were measured and the critical J-integral values were calculated from Equation (7).
Plot of critical stress intensity factor-crack inclination angles (degrees) for Mode I and Mode III.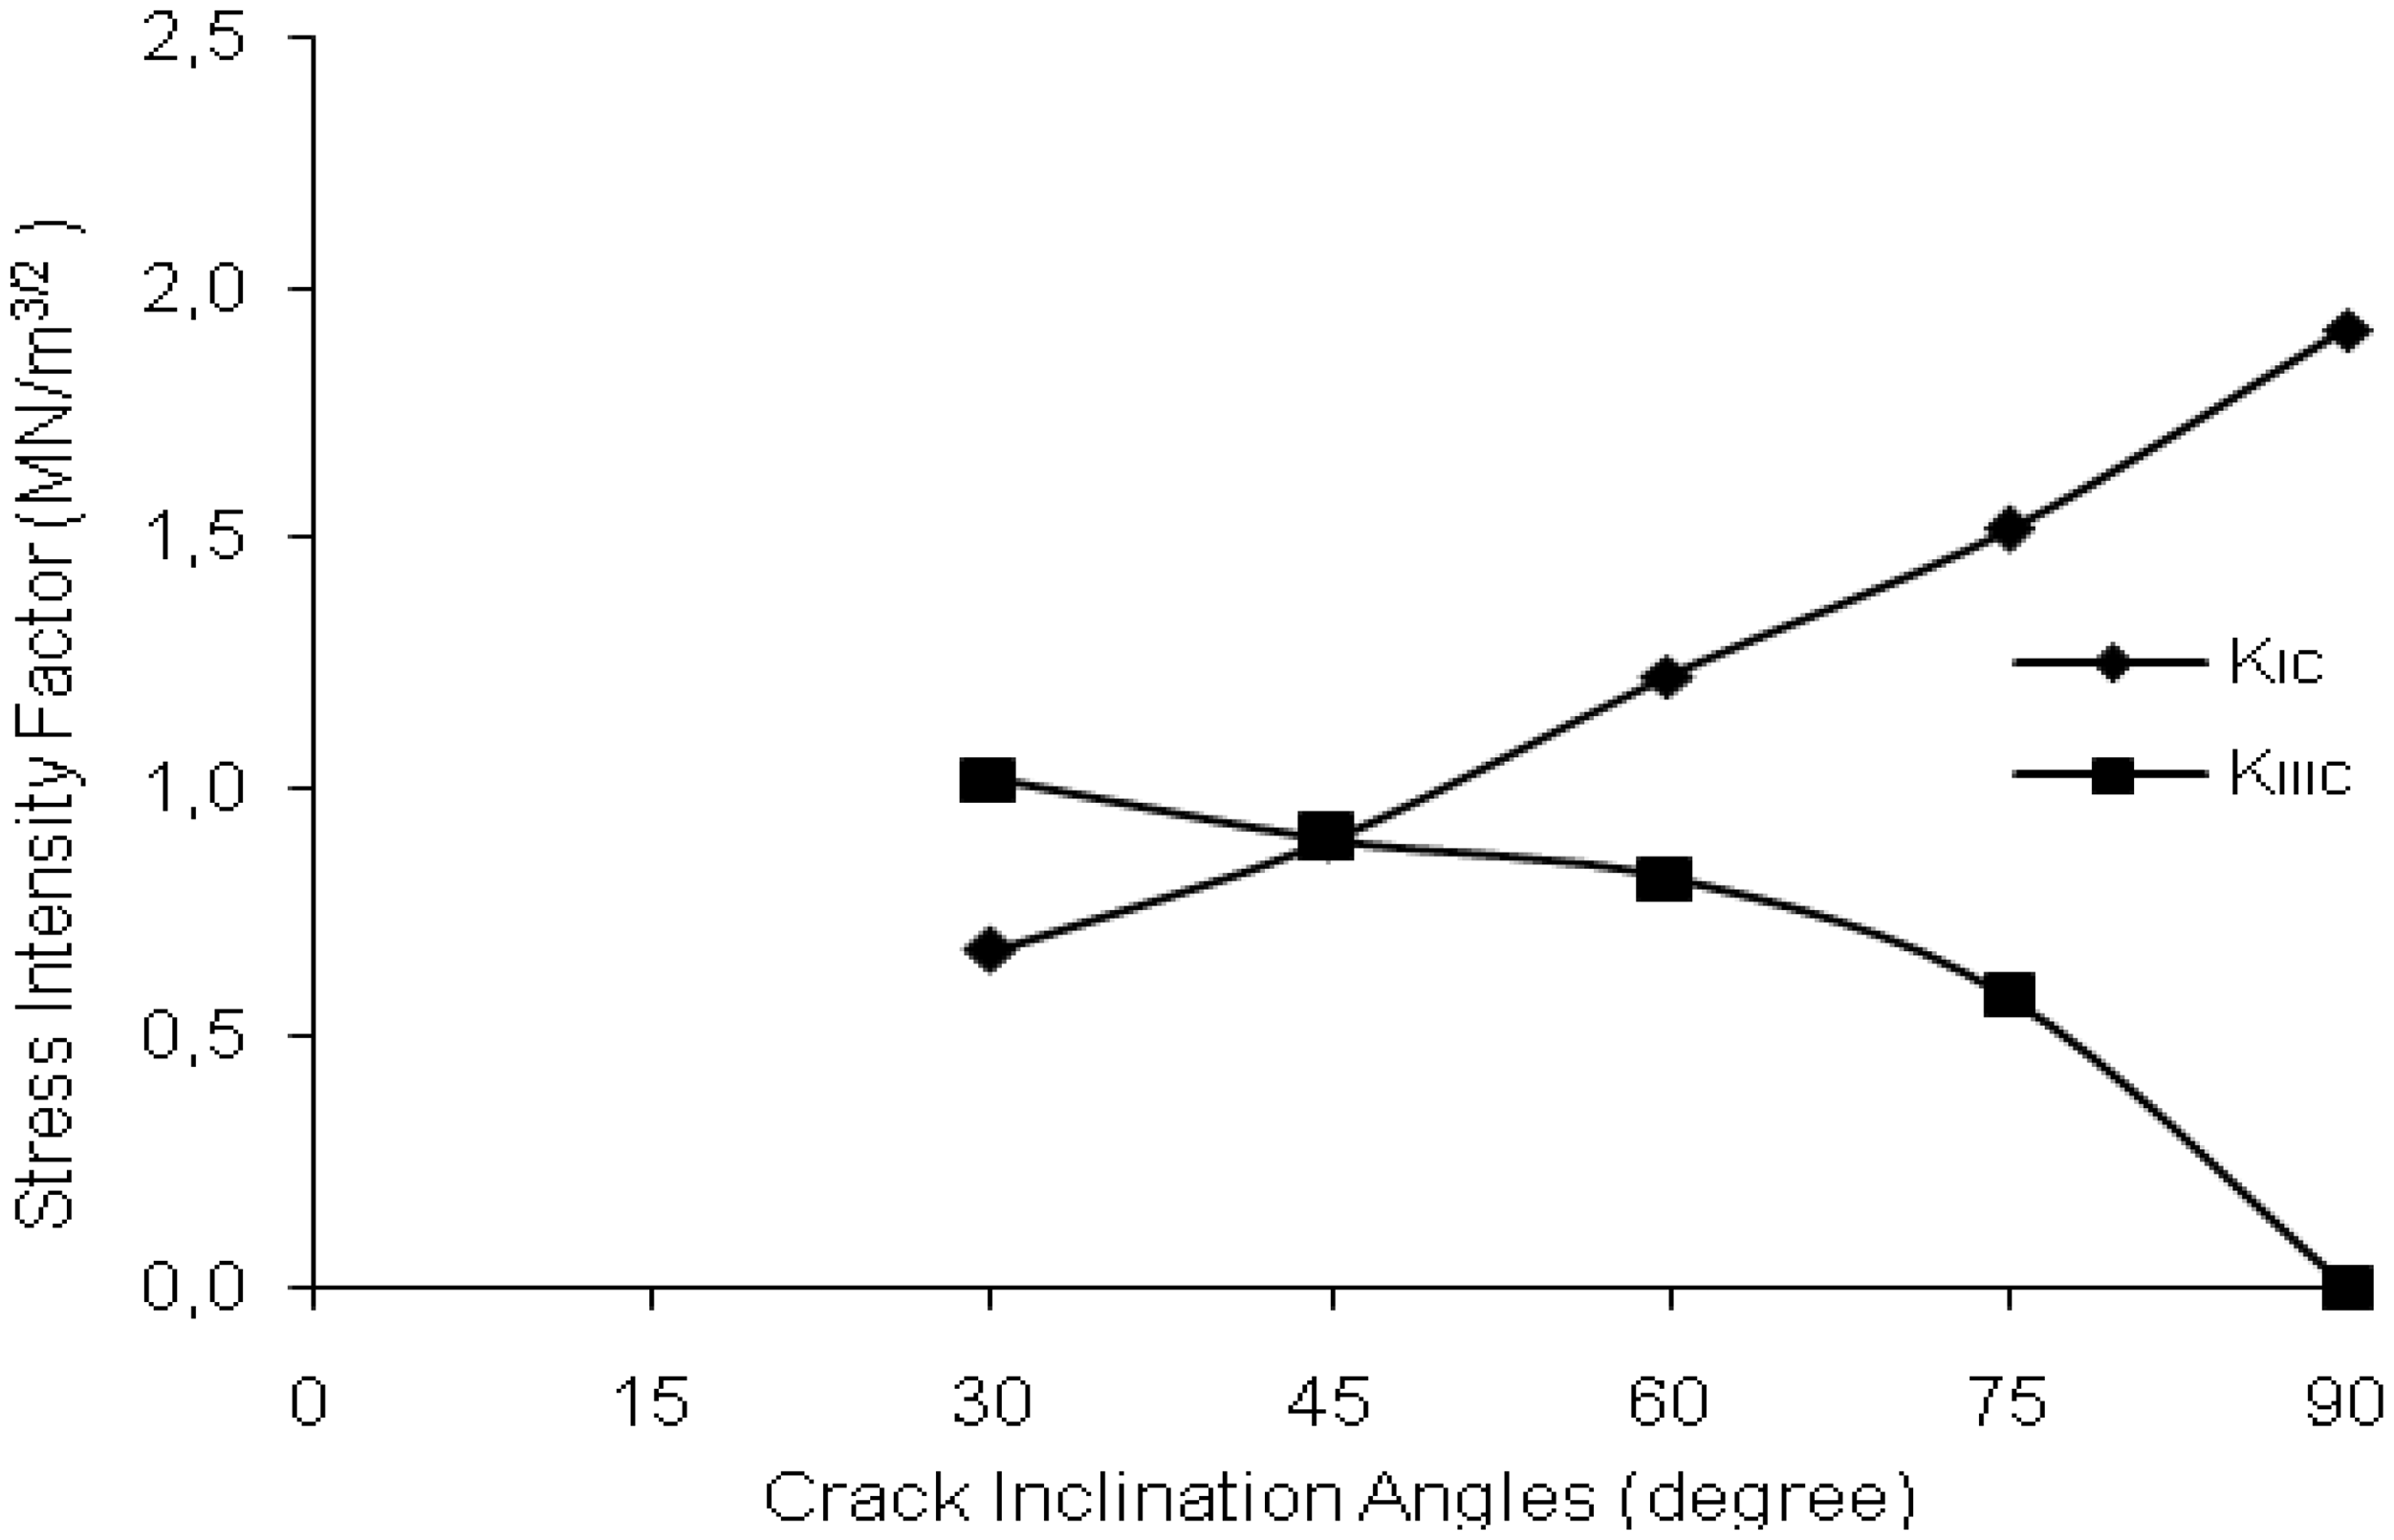
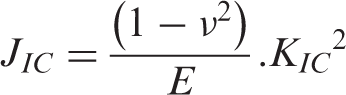
To estimate the fracture toughness of a nonlinear elastic body, JIC has been proposed when the linear elastic behavior predominates. Here the J-integral is directly related to KIC through the following equation:
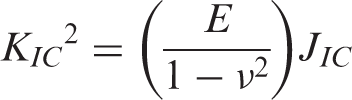
The Kıc values were obtained from Equation (11).
Determination of KIC and KIIIC
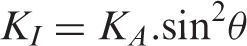
There is no standard method to calculate the mixed mode stress intensity factors. However, Pook 28 and Manoharan and Lewandowski 13 for an inclined crack pointed out that the apparent stress intensity factor KA can be calculated by using Equation (6) for the conventional crack case. KA can be resolved into KI and KIII with the following expressions:
and

From Equations (6), (12) and (13) the critical stress intensity factors KIC and KIIIC can be evaluated as
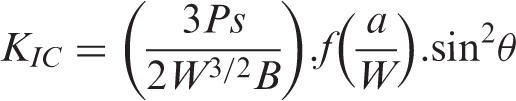
and
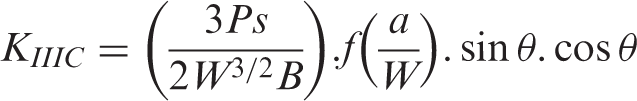
The values of the Mode I and Mode III stress intensity factors were calculated from Equations (14) and (15). The variation of the stress intensity factor with the crack inclination angle θ is displayed in Figure 2. KIC increases with an increase in inclination angle from 30°to 90° and reaches the highest value of 1912 MN/m3/2 at θ = 90°. On the other hand, KIIIC has its highest value at θ = 30° and decreases continuously as the Mode I component is added to the loading system. As expected at θ = 90°, KIIIC reaches zero. At θ = 45° the loading conditions are equal for the Mode I and Mode III components so the values of KIC and KIIIC are equal.
The form of the mixed-mode envelopes of the 3% textile glass fiber composite system can be seen in Figure 11 where the Mode III stress intensity factor KIIIC is plotted as a function of the corresponding Mode I stress intensity factor KIC. As seen in the figure, the value of KIC is reduced with increasing KIIIC.
Critical J-crack inclination angles (degrees) for Mode I and Mode III.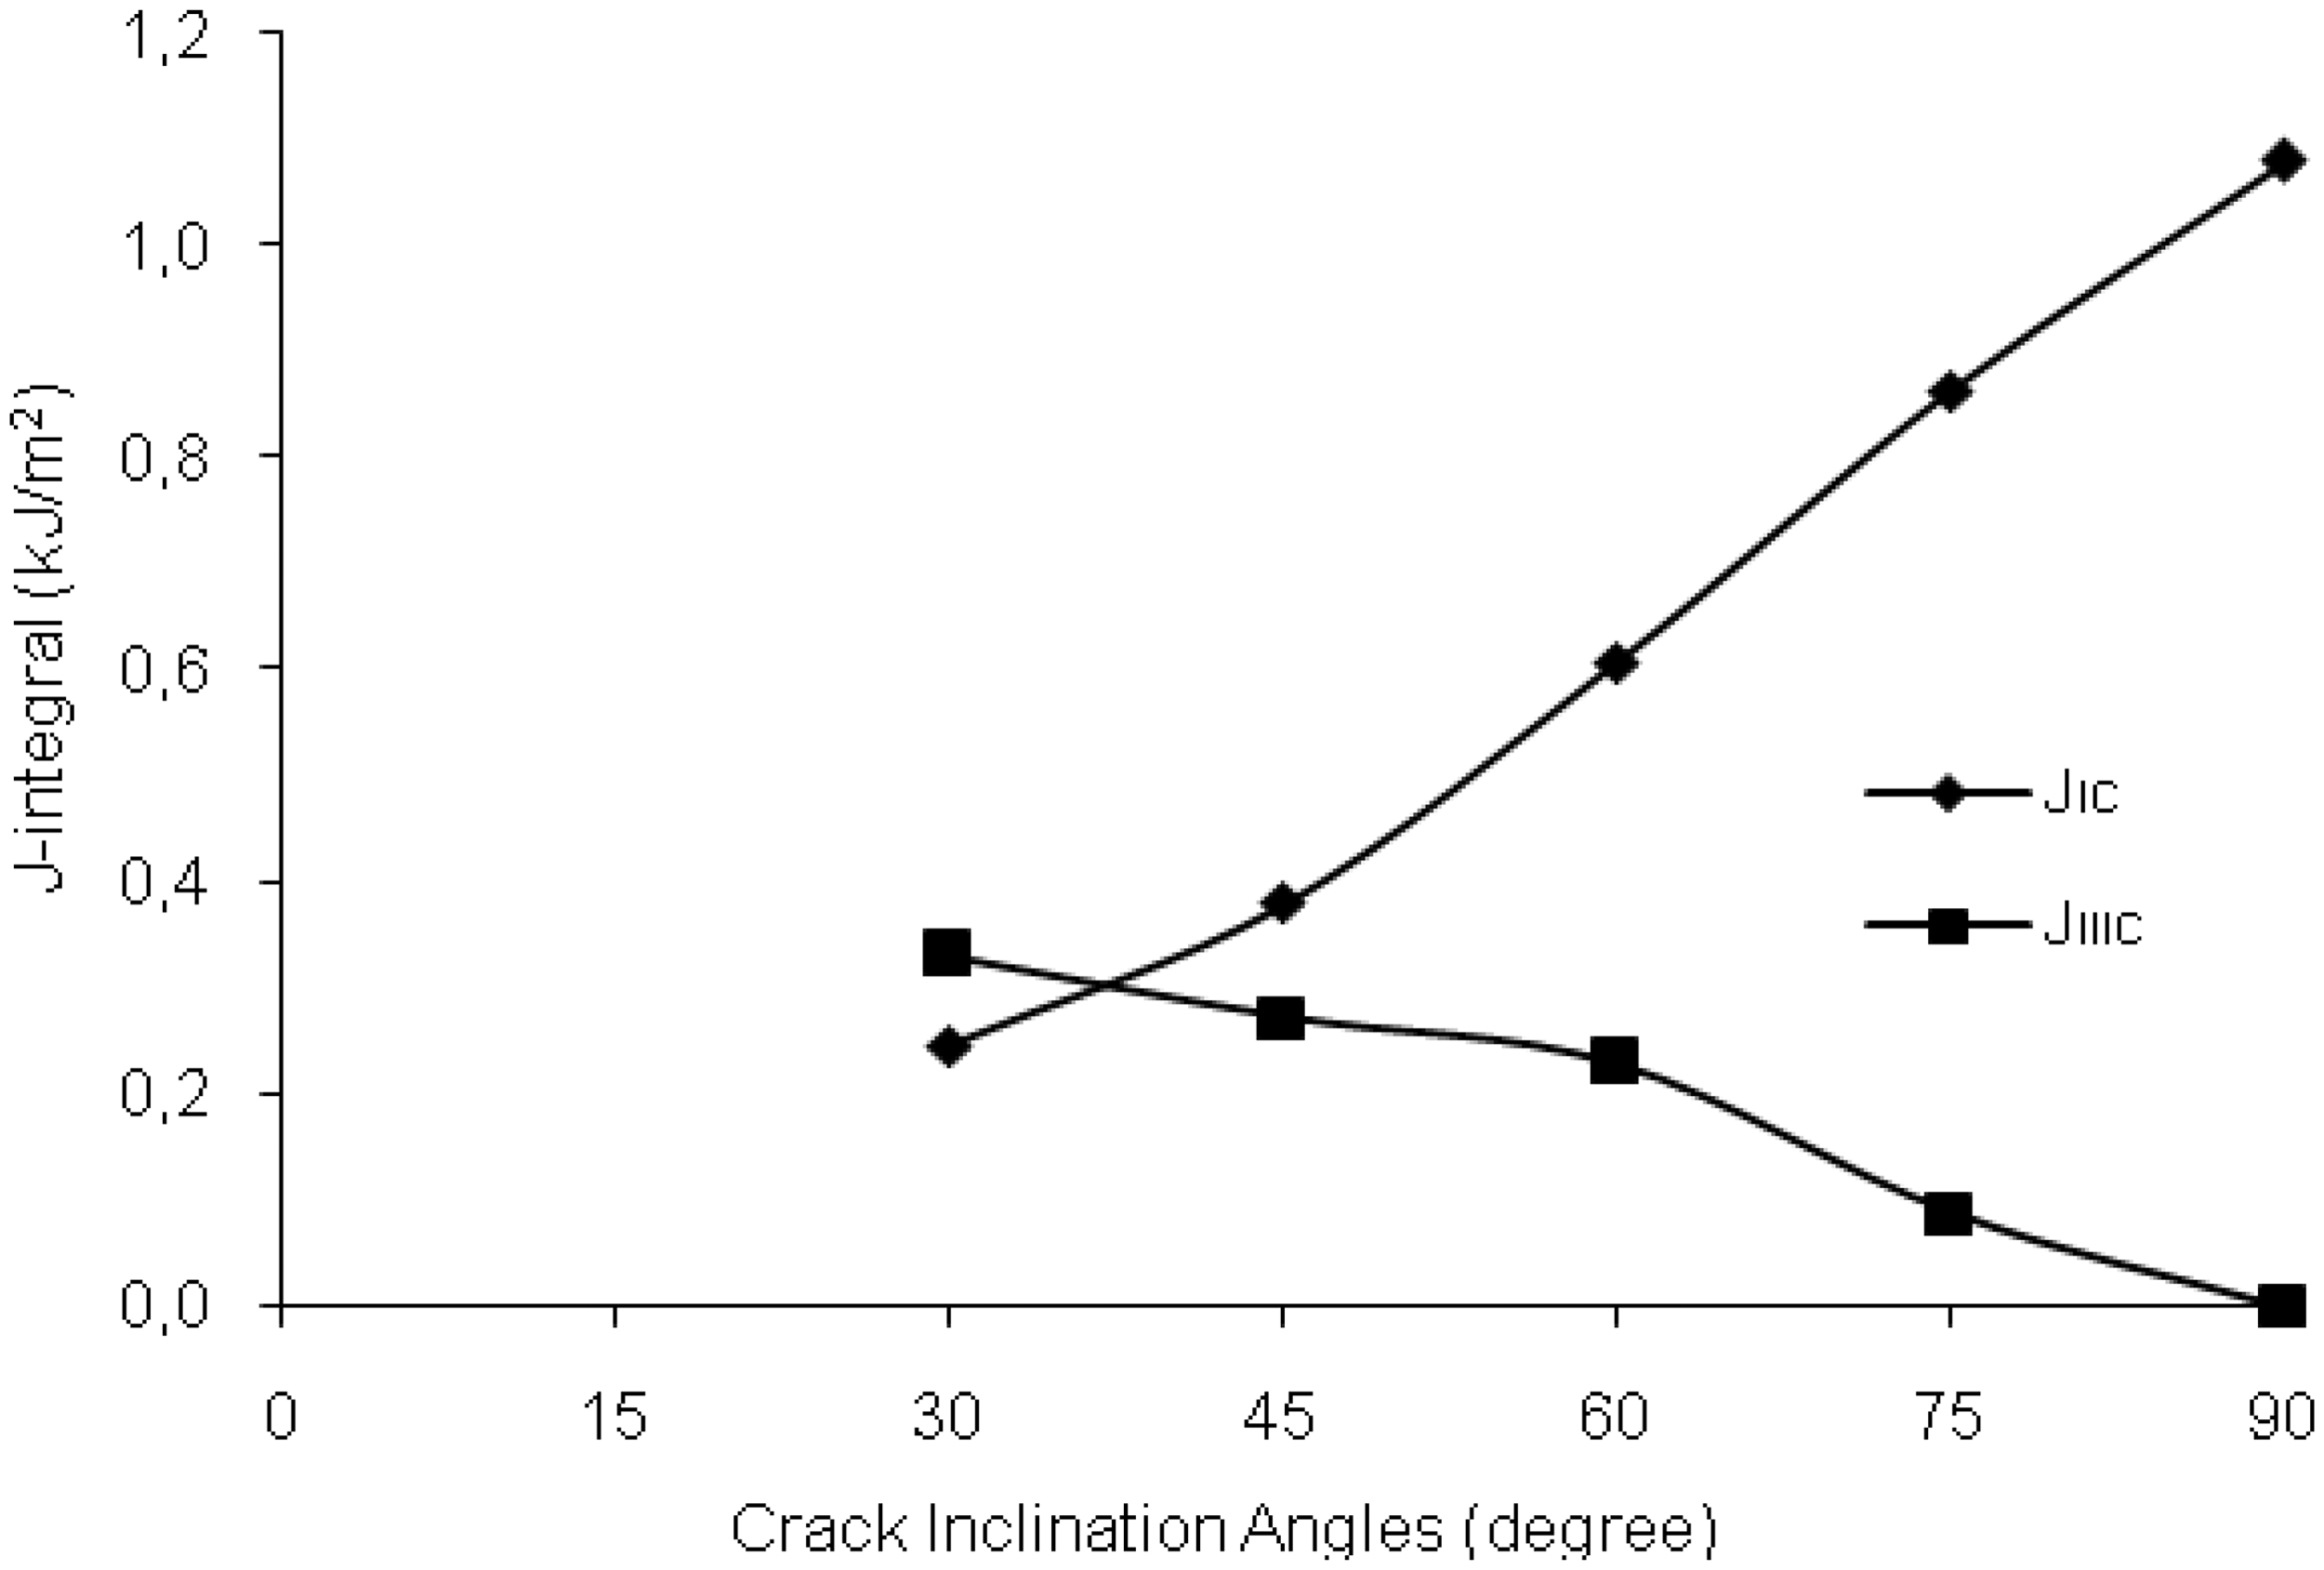
Determination of JIC and JIIIC
If the polymer system is assumed to be a linear elastic material the stress intensity factors can be converted into the strain energy release rate. For linear elastic materials the strain energy release rate is equal to the J-integral, which can be resolved approximately into JI and JIII as follows:

where ν is the Poisson ratio and E is the flexural modulus of the material. The resolved J-integral values were calculated using the above equations and the obtained results of the 3% textile glass fiber composite system are graphically shown in Figure 10.
Figure 12 illustrates the variation of JIC and JIIIC with the crack inclination angle θ for the 16.5% polyester and 3% glass fiber composite system. JIC increases continuously with the increase in crack angle from θ = 30° to θ = 90°. In contrast, JIIIC decreases with the increase in crack inclination angle θ from 30° to 90°. The highest value of JIIIC is 0.330 kJ/m2 at θ = 30° and it reduces to zero at θ = 90°.
Conclusion
In this study, the effects of textile glass fiber content and crack inclination angle on fracture behavior of polymer composites were investigated and the following conclusions were drawn:
The critical stress intensity factors KIC increased with increasing glass fiber ratio for all methods, that is, the initial notch depth method, the compliance technique and the J-integral method. The critical stress intensity factors did not also change by increasing the notch-to-depth ratio. This shows that KIC is not depend on the a/b ratio. JIC is also not dependent on the a/b ratio.
The fracture behavior of textile fiber reinforced polymer concrete under Mode I and Mode III loading conditions was investigated. As a result of the examined cases, minimum energy dissipation of the material occurred at Mode I fracture. From the result of the improved TPB tests, both KIC and JIC increased rapidly and KIIIC and JIIIC decreased as the crack angle changed from 30° to 90°. The values of KIC and KIIIC are the same at θ = 45°.
Footnotes
Acknowledgement
This study was supported by the Scientific Research Project Coordinators of Selçuk University.
Funding
This research received no specific grant from any funding agency in the public, commercial, or not-for-profit sectors.