
Abstract
The low motivations of teachers in Ethiopia reflect the psychological deempowerment of teachers. Thus, developing a scale is required to know exactly the empowerment level of teachers. Therefore, this study aimed at developing and validating a psychological empowerment scale in the Ethiopian context. The data were gathered from two different groups of 720 teachers (300+420) from 83 schools using a questionnaire. The exploratory factor analysis (EFA) results discovered four dimensions with a total variance of 69.685%. To know the fitness of the instrument in this study, the researcher carried out confirmatory factor analysis (CFA) with the LISREL 8.7 program with 420 participants. RMSEA (RootMean Square Error of Approximation) = .065 level, GFI (Goodness of Fit Index) = .93, adjusted goodness of fit index (AGFI) = .90, incremental fit index (IFI) = .98, relative fit index (RFI) = .96, non-normed fit index (NNFI) = .98 and comparative fit index (CFI) = .98. These values depict the good fitness of the model. Regading reliability, Cronbach’s alpha for goal internalization. Meaning, influence, and competence dimensions were 0.87, 0.842, 0.777, and 0.789, respectively. Total Cronbach’s alpha was .904. For this scale, the Average Variance Extracted and Combined Reliability are more than .7. Thus, the findings revealed that the psychological empowerment Scale, consisting of four dimensions and 15 items, was a valid and reliable instrument in Ethiopian school settings.
Keywords
Introduction
Scholars have interested in the empowerment concept due to its significant contribution to service quality and customer satisfaction (Yesuf, 2011). Pada and Wahyudin (2023) found that principals’ leadership practice has a positive effect on teachers’ psychological empowerment. Numerous studies revealed that making teachers to have meaningful work, awakening their self-competence, and giving authority in decision making created a positive impact on their performance (Pada and Wahyudin, 2023), and employee creativity (Nuzul et al., 2020). In many empirical and theoretical studies over the past years, empowerment is limited by delegating power to subordinates (Yesuf, 2011). Later on, as Bindurani (2015) compiled different studies, empowerment has been defined differently by different scholars. Conger and Kanungo (1988) defined it as a process of increasing the outlook of self-efficacy among institutional members. In fact, this description has consistency with the Oxford English Dictionary of the verb empowered as “to enable.”
Researcher of this study has been interested in developing and validating teachers’ psychological empowerment (PE) because of the following reasons. First, when the researcher compared the teaching profession with other professions in Ethiopia, it is more in need of empowerment. Ethiopian teachers often perceive themselves as having less payment and little control over their work because they must obey the orders from woreda (district) and zone (province) education offices unconditionally. This can result in an increased negative work attitude and behavior among teachers. In addition, the low motivations of teachers, according to different studies (Agegnehu, 2014; Tollosa, 2014) in Ethiopia reflect the psychological deempowerment of teachers. Thus, developing a scale is required to know exactly the empowerment level of teachers. Furthermore, PE is a crucial area in school leadership practice because it is a fostering element in altering schools, enhancing patriotic actions, improving self-esteem and self-consciousness, reaching climaxes in a nonviolent society, and increasing the satisfaction of students, teachers, and parents (Sladipo, 2009).
In addition, the quality of education is a crucial requirement for producing superior human resources. However, in reality, the implementation of education has not been able to produce quality students. This condition is caused, among others, by the empowerment of teachers (MoE, 2017; Yunus et al., 2021). There were several studies on psychological empowerment scales worldwide in general (for instance, Thomas and Velthouse, 1990; Zimmerman, 1995; Spreitzer, 1995; Menon, 2001). All the aforementioned scholars have found various dimensions. This difference in results among scholars revealed that further defining the construct of psychological empowerment is necessitated. Moreover, as far as the researcher's knowledge goes, so far, no psychological empowerment scale has been validated in Ethiopia in general or in East Gojjam province in particular. Therefore, it would be convenient for the researcher to validate the scale in the selected place. For these gaps and lines of argument that recommend the need for a study validating the psychological empowerment scale in various contexts, the researcher attempted to develop a questionnaire that will describe different dimensions of teachers’ psychological empowerment in Ethiopian contexts.
Therefore, the basic purpose of the study is to develop and validate a scale that will describe different dimensions of psychological empowerment and could be applied extensively in Ethiopian context. The specific objectives are: (1) identify the main constructs of the psychological empowerment scale using Exploratory Factor Analysis (EFA) and (2) examine the fitness of the psychological empowerment scale using confirmatory factor analysis (CFA).
Theoretical framework
Even if there is a remarkable achievement in access education, the quality of education in Ethiopia has been limited. This has become a source of concern for school stakeholders (Goshu and Woldeamanuel, 2019). The most important thing to enhance quality assurance in secondary education is working with students, teachers, and principals. Input factors included human, materials, finance, learning interactions, instructional leadership, empowerment and commitment of management and teachers, among main factors the study gave attention to. Having the right inputs in the right quantity at the right time enables the quality of education in secondary schools. If these inputs were not properly developed and utilized in a way to enhance quality, then it will endanger the quality of education (Kelkay, 2023). In Ethiopia, in the most recent road map study, it is also broadly revealed that teachers of secondary level education lack the commitment, empowerment, and competencies required of them (MoE, 2017). These results in low student learning outcomes and low quality of education, in fact, in a deteriorating trend (MoE, 2017). Marcenes et al. (2013) also stated that the secret of successful teacher professional development and quality of education is self-empowerment. For teacher professionalism to develop successfully and enhance the quality of education, teachers need to empower themselves psychologically without having to wait for regulations that come down from top leaders and by using empowering and inspiring teachers to empower themselves unceasingly through self-taught and autonomous efforts; encouraging teacher involvement in several educational activities; by offering flexibility for teachers to come up with new ideas (Yunus et al., 2021).
When examining different studies from a variety of organizations, different scholars found various theories, models, and factors of PE (Fourie, 2009; Spreitzer and Quinn, 2001). This study is in line with social cognitive theory. This theory includes triangle reciprocal influences of behavior, cognition, and the environment (Bandura, 1977). There are several models of PE, namely: Thomas and Velthouse's (1990), Zimmerman's (1995), Spreitzer's (1995), and Menon's (2001) models of PE. Zimmerman (1995) proposed three constructs of PE: intrapersonal, interactional, and behavioral factors. Spreitzer (1995) developed PE scale which consisted of four dimensions. These are: (1) Meaning—indicates the value that an employee attaches to the organization, and the relationship between the working environment and the individual's personality types (Thomas and Velthouse, 1990: Uma and Jayabharathi, 2016); (2) Competence refers to people's belief in their skill and knowledge to do a task (Spreitzer, 1995); (3) Self-determination/autonomy refers to personal's in commencing and executing tasks independently (Deci and Ryan, 1985; Kesari et al., 2017; Spreitzer, 1995); and (4) Impact—individual's belief in influencing organizational outcomes (Spreitzer, 1995).
According to Hancer and George (2005), in addition, self-determination and impact were called influence as a single dimension, and meaning and competence, also named as attitude, as one factor. Varoi (2000) discovered strong support for the four-dimension of PE of Spreitzer (1995) and Spreitzer and Quinn (2001). Seigall and Gardner (2000) found a three factor of PE, namely; meaning, competence, and influence by combining self-determination and impact and renamed influence. A three-dimensional was also discovered over nonsupervisory employees (Hancer and George, 2003). However, doing so may preclude extrinsic dimensions of PE, for example, leadership influence. For this study, external factors were captured by a factor of goal internalization (Menon, 2001). The goal internalization factor includes the enabling influence of inspiring organizational goals, missions, and vision by the leader. Thus, Menon (2001) identified three-dimensional PE: perceived control; competence; and goal internalization. There is agreement among theories in the idea that PE is influenced by antecedents that form cognition, in turn, yielding a kind with advantages to individuals and organizations.
This study followed four dimensions of PE (e.g., Spreitzer (1995) and three dimensions of PE (Menon, 2001)). The two-dimension (control and competence) of PE of Menon (2001) is the same with the autonomy and competency dimension in Spreitzer's (1995) model of PE. Thus, just the goal internalization dimension is not included in Spreitzer's (1995) model of PE. In this study, goal internalization was included as a construct of PE. This difference results among scholars revealed that defining further the construct of psychological empowerment is necessitated. These models may not be entirely composite of western work of psychological empowerment, but it contains the dimensions of the most significant aspects of psychological empowerment in Ethiopian context. Based on these models, the researcher proposed the conceptual framework in Figure 1.
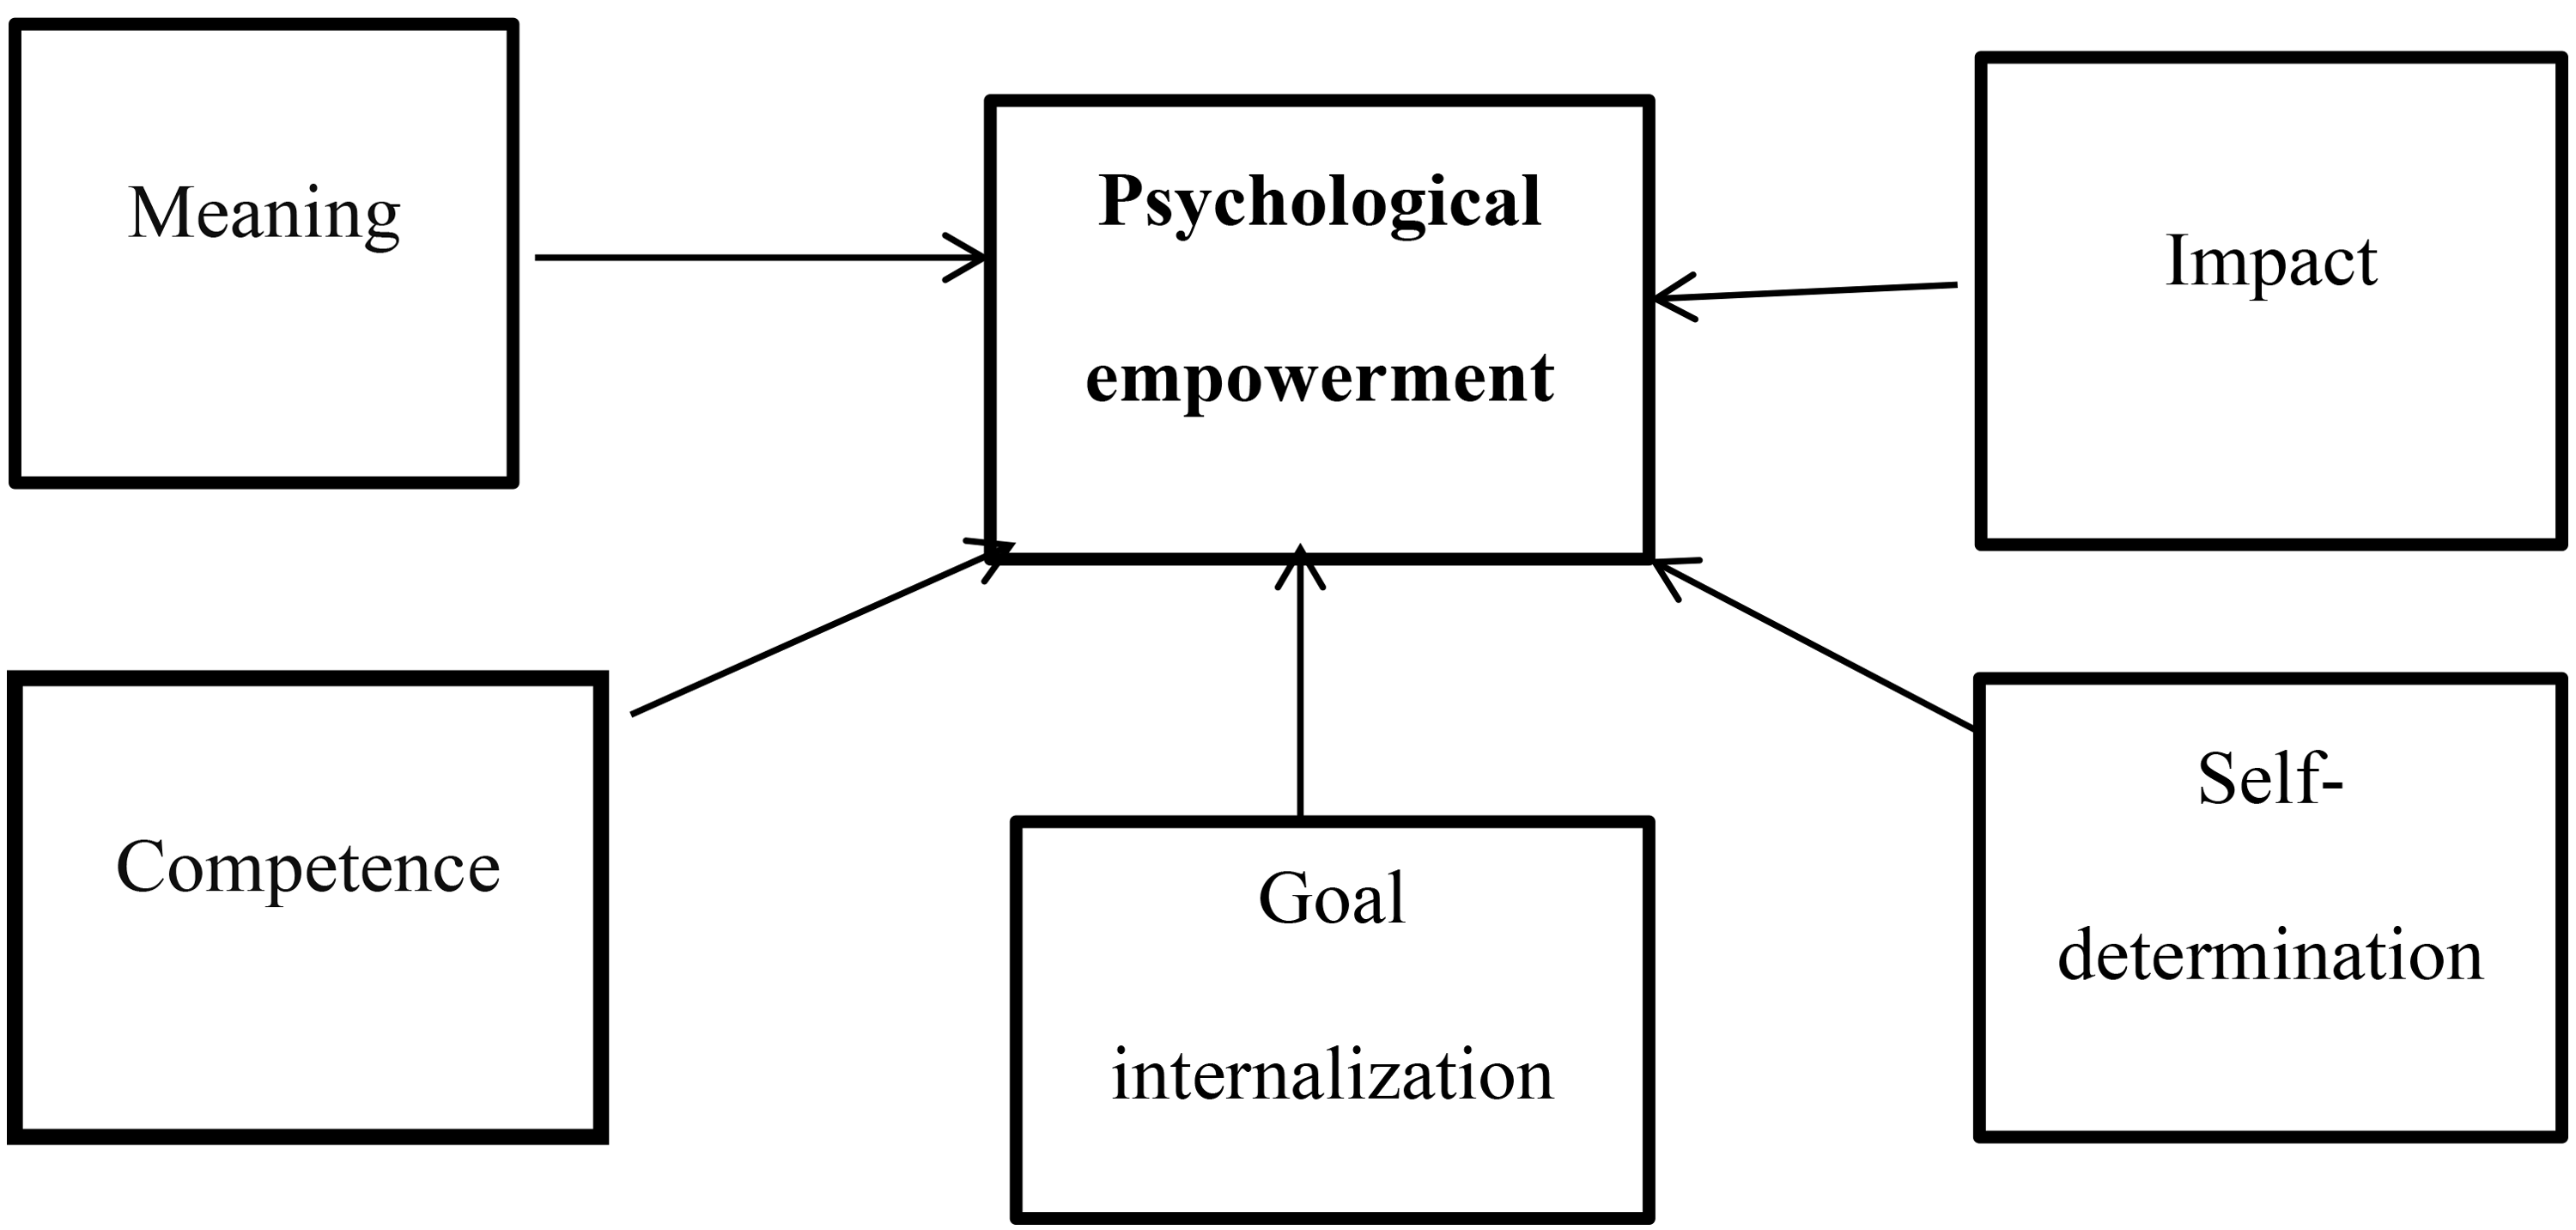
Proposed framework of psychological empowerment scale.
Materials and methods
In this study, a deductive approach was used since researchers followed already formed conceptualization of the constructs of Spreitzer’s (1995) psychological empowerment (Tay and Jebb, 2017). Likert type was used because of the proximity of Ethiopian teachers and administrators to the five-point grade system in schools. Besides, EFA and CFA were carried out to figure out the dimensions of the scale and fitness of the model, respectively (Mihas and Institute, 2019).
Participants
The current study is conducted in East Gojjam province. East Gojjam province is found in Amhara region, in the North part of Ethiopia. Its capital is Debre-Markos. This province has a total population of 2,153,937, with an area of 14,004.47 square kilometers; and a population density of 153.80. East Gojjam province is bordered on the south by the Oromia Region, on the west by West Gojjam, on the north by South Gondar, and on the east by South Wollo. It has 18 districts (CSA, 2012). All elementary school teachers in the East Gojjam province were targets for this article. There are 14,693 teachers (F-6298 and M-8395) in the primary schools of the East Gojjam province, Ethiopia.
For study 1, explanatory factor analysis was performed with 300 valid survey data. It is emphasized that the ratio of respondents to variables (items) for the sample size is 10/1, and it can be reduced to 5/1; preferably, it is recommended to have a sample size of 100 and above (Akgül & Çevik, 2003). In this regard, it can be said that the sample group of 300 people is sufficient to conduct exploratory factor analysis.
For study 2 (CFA), multistage sampling method was used in determining the sample. In the first stage, four districts (weredas) (Gozamen, Debre-Elias, Debre-Markos, and Machakele) were selected from 18 districts using a simple random sampling method. All teachers employed in the four districts were included in the working group. The population of the study includes 2684 teachers (female—1,311 and male—1373). There are 166 primary schools in the four districts. In the second stage, 83 schools were chosen from 4 districts with the simple random sampling. Epi Info program and Krejcie and Morgan (1970) were used to calculate the sample size estimates according to different statistical calculations. They have already showed similar sample size. Epi Info program is statistical software for sample size. Epi Info has been used by various scholars for over 20 years and is currently available for Microsoft Windows, along with a web and cloud version. A web and cloud version of Epi info program has been used in this study. According to Epi info version 7 software and Krejcie and Morgan's (1970) formula, for 14,691 populations, 374 teachers were taken (confidence = 95% or marginal error = 5%). Thus, the researcher anticipated that nonreply of some questionnaires was due to the potential sensitivity of items. Thus, 20% of the recommended teachers ((20/100 × 374)) = 75) were included. Accordingly, the total sample size was 449. These teachers were not included in the first study (EFA). However, the return rate was 420 (93.54%), which is acceptable (Cohen et al., 2018). Printed paper version of the questionnaire was employed since it gives all targeted teachers equal opportunity to respond and the majority of respondents may not have access to an online version due to the scarcity of internet access in the province.
Scale development procedure
Scale development requires many steps (Carpenter, 2018). This study developed PE scale in line with the recommendations of Lamm et al.'s (2020) scale development. First, developing a PE scale was begun by reviewing a list of models and theories found in the literatures to gain more understanding of the constructs (Lamm et al., 2020).
Spreitzer's (1995) and Menon's (2001) dimensions of PE scale gave a general framework of the present study. Required permissions were obtained for Psychological Empowerment Scale to use in the present study through email. Prior to distributing the questionnaire, first, the researcher checked items in English language with the aim in the local context. After that, for ensuring content validity, a questionnaire was given to experts for triangulation of the concept (DeVellis, 2017; Lamm et al., 2020). The questionnaire was then translated into the Amharic version by bilingual experts. Back-forward translation was held to examine the language translation-related problems. Then a pilot study with 10 teachers was conducted to add some extra information to upgrade the questionnaire (Carpenter, 2018). Then EFA was run to identify factors with 300 participants. EFA is a common method for examining an emerging scales (Carpenter, 2018) and for checking construct validity.
For ensuring the reliability of PE scale, Cronbach's alpha and CFA were applied (Cohen et al., 2018). Path diagram coefficient analysis was also employed to examine the impact of PE on the four constructs. Lastly, for divergent and convergent validity in particular, the researcher was also interested in examining Average Variance Extracted (AVE) and Maximum Shared Variance (MSV) coefficients, Pearson correlation, and differentiation among participants by collecting information on possible demographic characteristics differences regarding the PE scale.
Data analysis
EFA was carried out by using SPSS 20 software to identify factors. CFA was run using LISREL 8.3 to examine the fitness of the model; and the correlation analysis and path analysis among the variables to confirm the relationship and cause-effect association between dimensions (Cheng, 2015). To examine the differentiation capacity of the new PE scale, the inferential statistics of t-test and analysis of variance (ANOVA) were utilized.
Findings and discussion
Exploratory factor analysis
To check the adequacy of sample size for factorization of PE, Kaiser-Meyer-Olkin (KMO) and Bartlett Sphericity tests were examined before running EFA. According to Büyüköztürk (2003), KMO > .60 represents that the sample size is acceptable for EFA. In this study, the KMO and Bartlett Sphericity test values were .87 and χ2(105) = 1267.497, p < .01, respectively. The data on factor load values and variance are presented in Table 1.
Exploratory factor analysis of psychological empowerment scale.
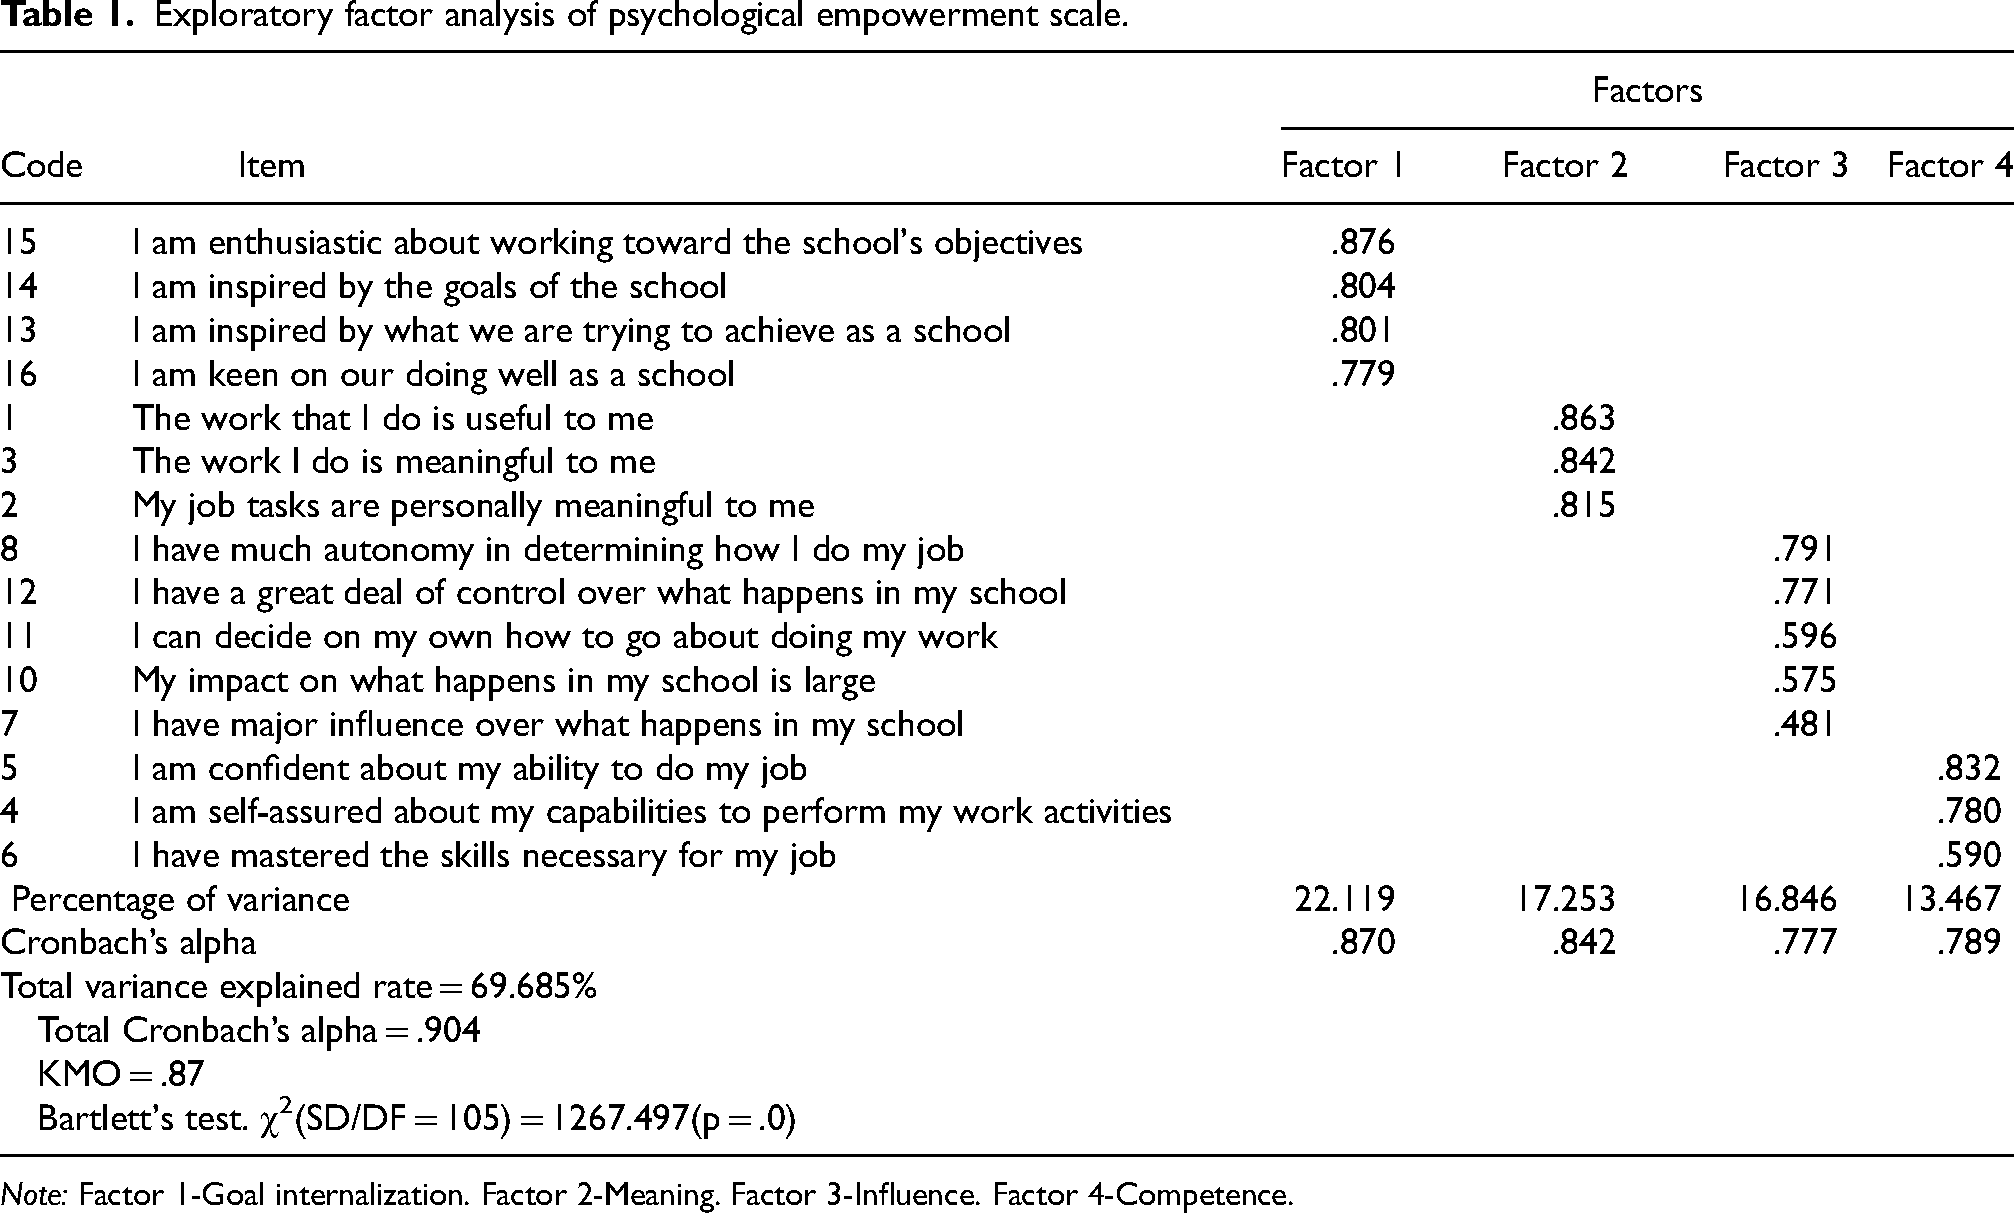
Note: Factor 1-Goal internalization. Factor 2-Meaning. Factor 3-Influence. Factor 4-Competence.
As shown in Table 1, to provide the validity of the main constructs of PE, principal component and Varimax analysis were used. In the first case of the original instrument, 17 items have been included. After the first rotation, it was seen that there were 4 components with eigenvalues above 1. The contribution of these components to the total variance at intial was 66.843%. In factor analysis, items may be excluded from the analysis when they have an overlapping problem or when factor load values are less than .30 and placed in the dimension of the instrument that is not theoretically supported (Field, 2009). Because of the overlapping problem, items 9 and 17 were excluded from the analysis. As a result, an instrument consisting of 15 items was developed based on 4 theoretical dimensions. These are influence, meaning, competence, and goal internalization. Likert type 5 rating scale was used in the original measurement of the instrument. The total variance of the 4 factors was 69.685%. Principal components have been employed by academics to identify inherent factors in their studies (Leech et al., 2015).
As shown in the rotated factor matrix, four factors were unclosed by factor analysis. Factor loading for goal internalization is stronger on the first factor; the meaning is stronger on the second factor. Influence and competence are stronger in the third and four factors, respectively.
Each factor contains a various number of items. The construct goal internalization comprised of 4 items (item 17) as a result of an item being removed due to overlapping with another factor. Meaning comprised 3 items. Self-determination and impact are combined into a single factor and renamed influence and contain 5 items as item (A9) already excluded. This is consistency with Seigall and Gardner (2000), and Hancer and George (2005). Competence comprised of three items.
Each dimension has a different factor load value. The items included in the goal internalization dimension have the factor load value between .779 and .876; those in the dimension of meaning have the factor load value between .815 and .863, those in the influence dimension have between .481 and .791 and those in the competency dimension have between .590 and .832. According to Field (2009), the factor load values can be considered as meaningful, with a sample size of 50 people, it suggested to be larger than .722, sample size of 100 people, larger than .512, sample size of 200 people, larger than .364, sample size of 300 people, larger than .298, the sample size of 600 people, greater than .21, and with a sample size of 1000 people, be greater than .162. In this direction, in the sample size of 153 people, it can be considered that the factor load values of the items are greater than .512 and the difference between the factor load values is at least .1 (Büyüköztürk, 2003; Field, 2009). The factor load value of only one item is low (item 7 = .481) but is not removed because of its closeness to the criteria.
For reliability studies, item total correlation (Cronbach’s alpha) for goal internalization dimension. 87, for meaning .842, for influence .777, and for competence .789 were found. Total Cronbach’s alpha was .904, which revealed the high reliability of the PE scale. All four dimensions had moderate and fair level reliability (Field, 2009). Re-examining the factor structure is required with various participants (Hancer and George, 2005). Thus, this study was also intended to continue the examination of the fitness of PE using CFA.
Confirmatory factor analysis
To know the fitness of the instrument in this study, the researcher conducted CFA with LISREL 8.7 program (Lamm et al., 2020). The p value is the first value to be examined in the confirmatory factor analysis. The p value in this study is significant at .00 level. CFA output revealed the lowest t value was 9.20 (item 10); the highest t value was found to be 23.97 (item 2). All items' t- values were exceeding 1.96 at 05 significant levels since the lowest value was 9.20 (item 10). When the error variances of the observed variables were examined, the lowest error variance was .17 (item 2); the highest error variances were .81 (item 10). In this direction, it can be said that the error variance of item 10 is not even high (Çokluk et al., 2010).
When goodness-of-fit index indices are examined in Table 2, chi square is not statistics sufficient alone. In other words, χ2 = 252, 70 is taken into consideration by the proportion ring with the degree of freedom (DF) = 84. When these values are proportional to each other, the ratio of χ2/DF was 3 (252, 70/84). Since it is a large population and the rate of χ2/DF equals 3, it can be considered as a perfect fit (Çokluk et al., 2010). root mean square error of approximation (RMSEA) indicated a good fit at .065 level. When assessing the goodness of fit continues, it is seen that goodness of fit index (GFI) was .93 and adjusted goodness of fit index (AGFI) was .90. All values obtained are accepted as good in accordance with the criteria determined by Schermelleh-Engel et al. (2003) and Çokluk et al. (2010). root mean Square residual's (RMR's) fit index was .032 and the goodness of fit index of standardized RMR (SRMR) was .044. Here both RMR and SRMR (Standardized Root Mean Square Residual), RMR were corresponded to a perfect fit. Finally, when incremental fit index (IFI), relative fit index (RFI), non-normed fit index (NNFI), and comparative fit index (CFI) fitness indexes are investigated, it is observed that IFI = .98, RFI = .96, NNFI = .98, normed fit index (NFI) = .97 and CFI = .98. The IFI, RFI, NNFI, and CFI indexes of over .95 were corresponded to a perfect fit (Çokluk et al., 2010).
Goodness of fit indices of psychological empowerment scale.
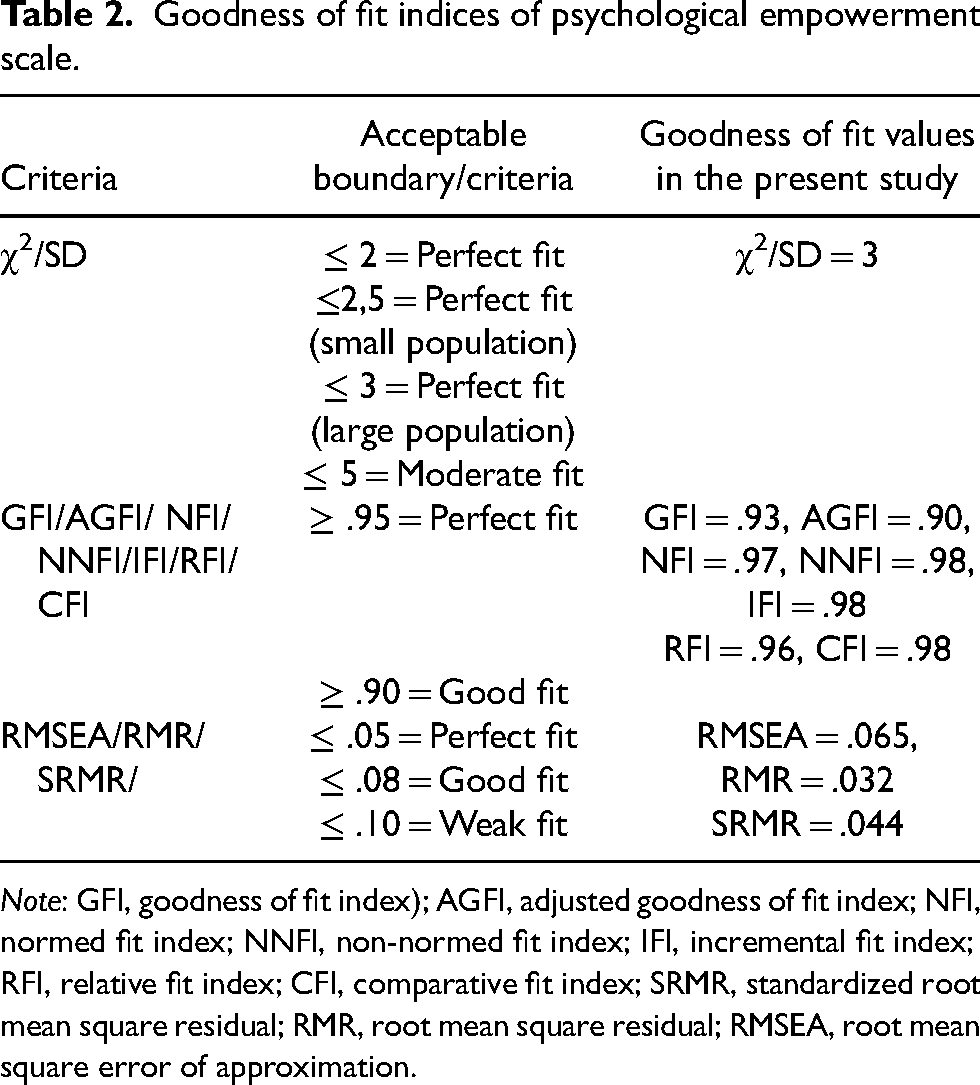
Note: GFI, goodness of fit index); AGFI, adjusted goodness of fit index; NFI, normed fit index; NNFI, non-normed fit index; IFI, incremental fit index; RFI, relative fit index; CFI, comparative fit index; SRMR, standardized root mean square residual; RMR, root mean square residual; RMSEA, root mean square error of approximation.
Correlation path model and comparison analysis
To affirm to what extent the four dimensions were discriminant from each other and remove redundancy, correlation and path model analysis were utilized (Lamm et al., 2020). The results showed that all factors of PE were moderately associated with each other (see Table 3).
Correlation between factors of psychological empowerment.
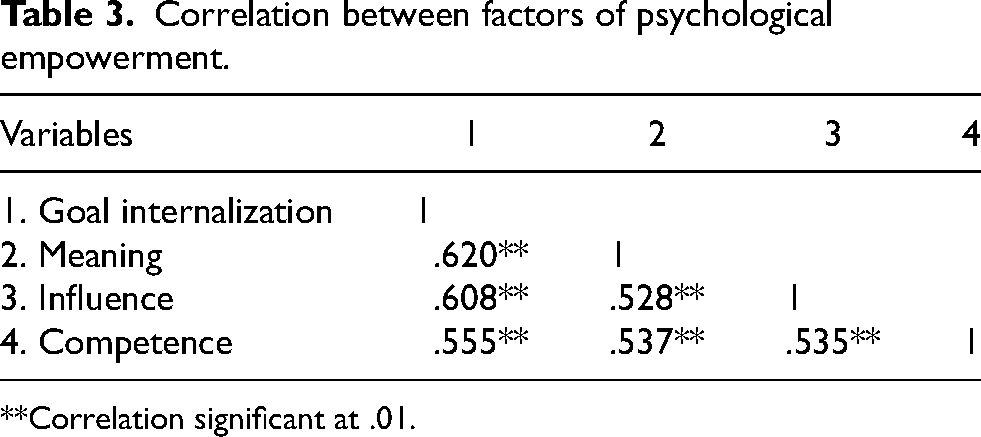
**Correlation significant at .01.
As displayed in Table 3, there is a moderate level, positive and significant relationship between the four factors of PE, for instance, between goal internalization and meaning (r = .62; p < .01); between goal internalization and influence (r = .608; p < .01) and between goal internalization and competence (r = .555; p < .01). In this respect, it can be said that increasing teachers’ perception of goal internalization will increase teachers’ perception of meaning, influence, and competence. There is a moderate level, positive and significant relationship between meaning and influence (r = .528; p < .01) and between meaning and competence (r = .537; p < .01). In this respect, it can be said that increasing teachers’ perception of their work will increase teachers’ perception of their influence and competence. Nearly in the similar way, an increasing teachers’ perception of their influence in school will increase their competence (r = .535; p < .01). Path diagram was also used to see the influence of general PE on each dimension in the following table.
As shown in Table 4, psychological empowerment affected goal internalization [β = .87], meaning [β = .93], influence [β = .88], and competence [β = .88] at p < .01. In addition, the discriminant and convergent validity of the scale were checked with AVE and Combined Reliability by using Excel, which yields a value of more than .7. This value is acceptable (Malhotra, 2011). The values of AVE and MSV were compared and all AVE values exceed MSV coefficients.
Model path coefficients analysis results.
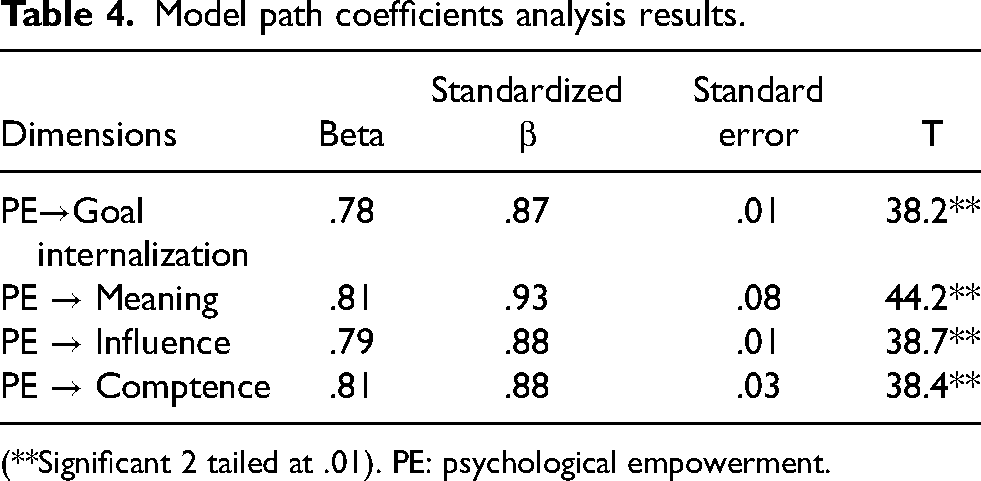
(**Significant 2 tailed at .01). PE: psychological empowerment.
Comparison of psychological empowerment among teachers
To see the differentiation capacity of the new PE scale, differences in teachers’ perceptions about their psychological empowerment due to some demographic characteristics were presented.
For instance, in terms of gender, a t-test showed that there were no statistically significant differences in perception toward goal internalization [t(418) = −1.206, p = .229], mean [t(418) = .13, p = .896], influence [t(418) = −.359, p = .72], competence [t(418) = .002,p = .999] dimensions and general psychological empowerment [t(418) = −.43, p = .667]. In line with the present study, Timothy and Abubakar (2013), Spreitzer (1995), Menon and Kotze (2005), and Ozaralli (2003) found that perceived PE empowerment did not differ in terms of gender. On the contrary, Fourie (2009) and Gecas (1989) revealed that there was a gender difference in PE in that males have a greater sense of PE than females. ANOVA was also used to see the difference in teachers’ perception in terms of length of service.
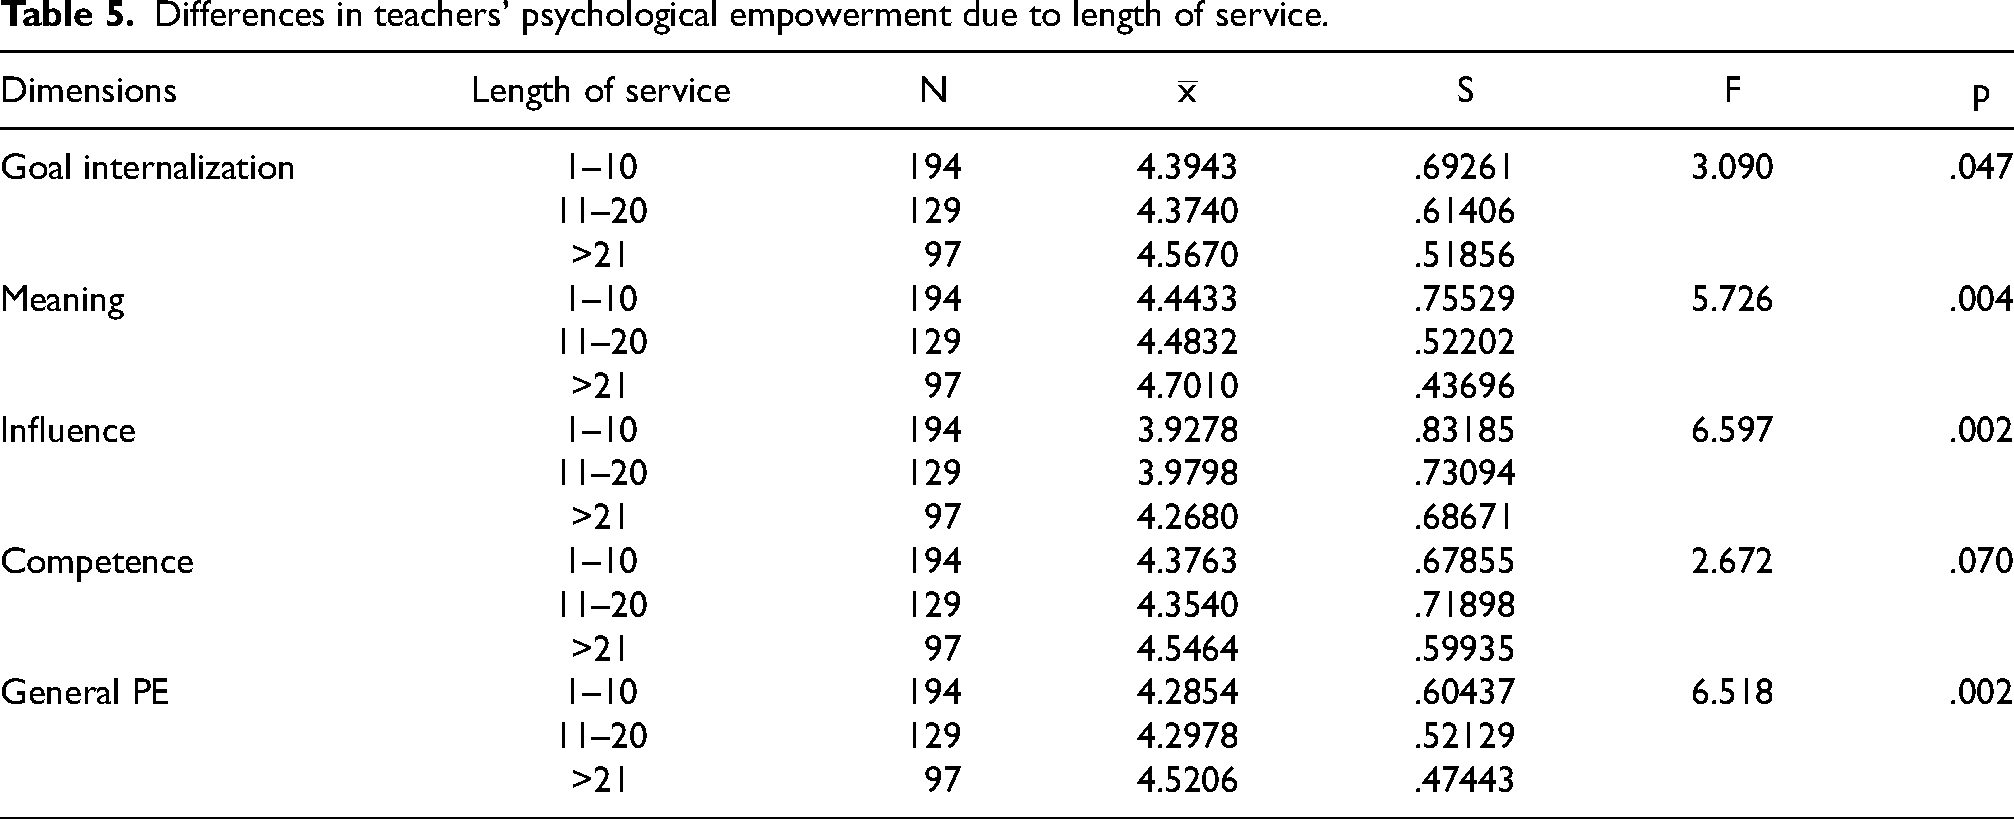
The Table 5 indicated that there were statistically significant differences across different length of services in teachers’ perception score toward goal internalization [F(2417) = 3.09, p = .047], meaning [F(2417) = 5.726, p = .004], influence [F(2417) = 6,597, p = .002] dimensions and general psychological empowerment [F(2417) = 6.518, p = .002]. However, there was no difference across different lengths of service in teachers’ perception scores toward their competence [F (2417) = 2.672, p = .07]. The post hoc revealed that this difference was due to the difference between the opinions of those who have served more than 21 years and those who have served between 11 and 20 years. Teachers with a length of service of more than 21 years have higher-level perception, mean scores toward goals, internalization, and mean dimensions than those with a working time of 11 to 20 years. Moreover, teachers with a length of service of more than 21 years have higher-level perception; mean scores toward the influence dimension and general psychological empowerment scale than those with a working time of 11 to 20 and 1 to 10 years. This finding is in line with Gardenhour (2008), Huang et al. (2006), McDermott et al. (1996), and Ozaralli (2003) who discovered that more experienced employees have greater feelings of empowerment; while on the contrary Sarmiento et al. (2004) did not discover a positive relationship between teaching years’ experience and PE in Canada.
Differences in teachers’ psychological empowerment due to length of service.
Conclusions and recommendations
Generally, according to MoE of Ethiopia, teachers should be psychologically empowered but there was not such an instrument to examine the teachers’ PE demonstrated in a local context. This research is supposed to contribute to fill this limitation. The convergent and discriminant validity results confirm that items in the inventory were valid and fit to measure PE scale in Ethiopian primary schools. After this, by administrating PE scales, teachers would be able to understand if they are psychologically empowered or not.
Regarding the generalizability of the results, the findings obtained from this study were limited to Ethiopian context. District-level, province-level, and regional-level administrators should empower teachers psychologically in the light of the four dimensions of PE. In addition, education officers at every level including schools should provide appropriate structures in the school management strategy in order to empower teachers in particular psychologically by developing their capital. The newly developed psychological empowerment scale for teachers emerged with four well-defined factors or dimensions, and appeared to be a promising measure. It demonstrated validity and reliability within the framework of this study. However, further refinement of this instrument is recommended across diverse cultures. This article was delimited by the study sample. Research on the development and validation of teachers’ psychological empowerment can be extended to include different provinces and regions with a broader range of demographics. Expanding this study to include secondary and/or high school teachers is also suggested.
Footnotes
Declaration of conflicting interests
The author declared no potential conflicts of interest with respect to the research, authorship, and/or publication of this article.
Funding
The author received no financial support for the research, authorship, and/or publication of this article.
Author Biography
Appendıx The Amharıc (Ethiopian) Version of Psychologıcal Empowerment Scale
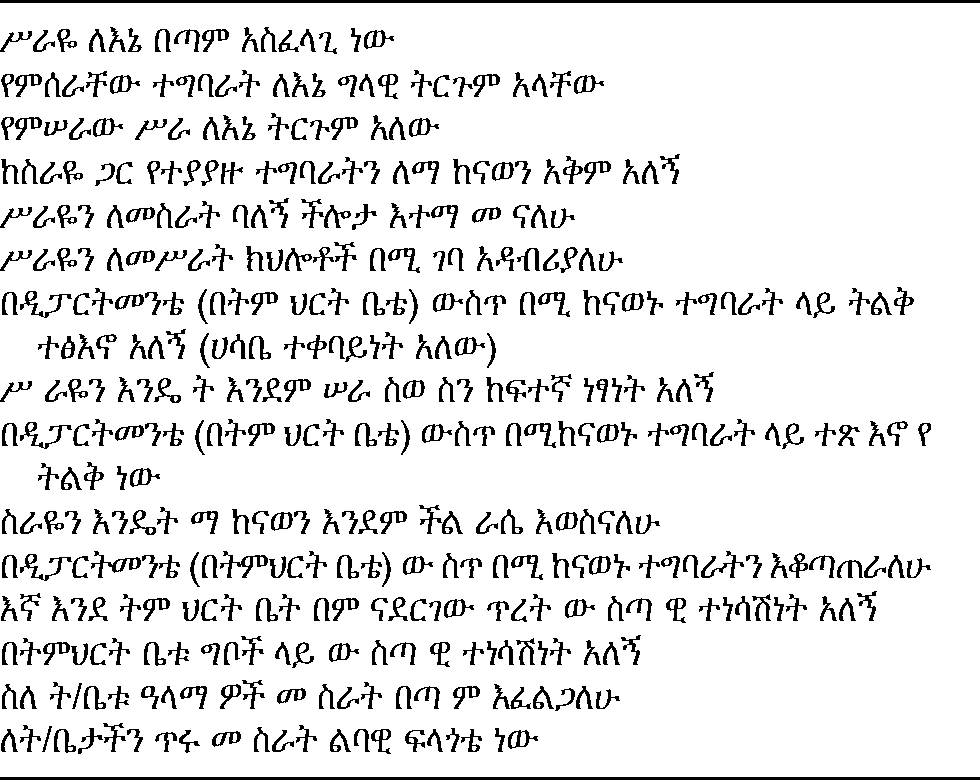
| ሥራዬ ለእኔ በጣም አስፈላጊ ነው |
| የምሰራቸው ተግባራት ለእኔ ግላዊ ትርጉም አላቸው |
| የምሠራው ሥራ ለእኔ ትርጉም አለው |
| ከስራዬ ጋር የተያያዙ ተግባራትን ለማ ከናወን አቅም አለኝ |
| ሥራዬን ለመስራት ባለኝ ችሎታ እተማ መ ናለሁ |
| ሥራዬን ለመሥራት ክህሎቶች በሚ ገባ አዳብሪያለሁ |
| በዲፓርትመንቴ (በትም ህርት ቤቴ) ውስጥ በሚ ከናወኑ ተግባራት ላይ ትልቅ ተፅእኖ አለኝ (ሀሳቤ ተቀባይነት አለው) |
| ሥ ራዬን እንዴ ት እንደም ሠራ ስወ ስን ከፍተኛ ነፃነት አለኝ |
| በዲፓርትመንቴ (በትም ህርት ቤቴ) ውስጥ በሚከናወኑ ተግባራት ላይ ተጽ እኖ የ ትልቅ ነው |
| ስራዬን እንዴት ማ ከናወን እንደም ችል ራሴ እወስናለሁ |
| በዲፓርትመንቴ (በትምህርት ቤቴ) ው ስጥ በሚ ከናወኑ ተግባራትን እቆጣጠራለሁ |
| እኛ እንደ ትም ህርት ቤት በም ናደርገው ጥረት ው ስጣ ዊ ተነሳሽነት አለኝ |
| በትምህርት ቤቱ ግቦች ላይ ው ስጣ ዊ ተነሳሽነት አለኝ |
| ስለ ት/ቤቱ ዓላማ ዎች መ ስራት በጣ ም እፈልጋለሁ |
| ለት/ቤታችን ጥሩ መ ስራት ልባዊ ፍላጎቴ ነው |