
Abstract
Nonprofit hospitals receive scrutiny regarding two interrelated issues: (1) the equity impacts of their tax-exempt status on the communities they serve and (2) the degree to which the community-benefit spending they offer serves local communities. Using economic impact analysis, the authors construct heuristic models that estimate the economic and tax benefits of nonprofit hospitals’ operations in four small and medium-sized metro regions. The estimates find that overall tax revenues disproportionately flow to state and federal levels of government, while the costs of tax exemptions disproportionately fall on local and regional levels of government. Additionally, forms of community benefit spending that are frequently criticized, such as uncompensated means-tested care, are found to be important forms of regional investment. The authors conclude by highlighting workforce development as a pathway to improving nonprofit hospitals’ community relationships.
U.S. nonprofit hospital governance has been criticized by media, think tanks, and academic health policy literature since the passage of the 2010 Affordable Care Act (ACA), which formalized the requirement for nonprofit hospitals to provide community benefits to maintain their nonprofit (501(c)(3)) status (Bai et al., 2021). Major media criticisms of nonprofit hospitals have included medical debt collection practices (Evans & Mathews, 2021), bias toward expanding into wealthy places (Evans et al., 2022), patterns in charity care provision (Mathews et al., 2022), and supposed failure to target community benefit spending toward local communities (Ofri, 2020). Think tanks (Lowen Institute, 2023) and health policy scholars (Bai et al., 2021; Bruch & Bellamy, 2021) have argued that nonprofit hospitals are failing to provide appropriate levels of charity care and community benefit services. However, criticisms of nonprofit hospital tax exemptions and community benefit activities concern multiple moving parts: concerns about which types of nonprofit hospital activity should constitute community benefit activity, the supposed burden of nonprofit hospital tax exemptions for local and regional governments, and the limitations faced by nonprofit hospitals in providing community benefits.
We propose that an economic development perspective can help to enrich this debate by highlighting the dual roles of nonprofit hospitals as economic anchors and providers of community benefit spending. We use eight IMPLAN models of nonprofit hospitals located in small and medium metropolitan statistical areas (MSAs) as a heuristic to explore three research questions:
How does a region's economic structure influence the net tax revenue impacts of nonprofit hospitals? How do these impacts vary by level of government (federal, state, and regional)? How do different definitions of nonprofit hospitals’ community benefit spending affect the quantity and spatial extent of their economic impact?
We believe that our findings can help both public policy makers and institutional policy makers within nonprofit hospital systems to develop new, constructive policies for strengthening nonprofit hospitals’ contributions to local and regional communities.
Findings
To contribute an economic development-oriented response to criticisms of nonprofit hospital tax exemptions and community benefit policies, we created two sets of impact models. Hospitals included are located in four small or medium MSAs ranging in population from 102,180 to 329,128, located in the U.S. West, South, Midwest, and Northeast. The size of metropolitan regions fits well with the requirements and limitations of economic impact analysis, while the selected hospitals offered similar baskets of services. We construct these models using Internal Revenue Service (IRS) Form 990 and IRS Form 990 Schedule H data to demonstrate how tax and economic impacts of nonprofit hospitals can be affected by regional contexts.
From our results, we highlight three insights relevant to the ongoing debate about nonprofit hospital tax exemptions and community benefit activity:
Nonprofit hospital tax revenues and tax exemptions can vary considerably from region to region, primarily due to the economic structure of a given metropolitan region. In our models, regional and local tax revenues ranged between 16.68% and 66.51% above the cost of regional and local tax exemptions (see Tables 1 and 5), suggesting that the spatial and economic structure of metropolitan economies complicate the fulfillment of the IRS's Community Benefit Standard. Tax revenues produced by nonprofit hospitals disproportionately flow to state and federal levels of government, while local and regional scales of government take on a disproportionate amount of tax exemption costs. Shares of tax exemption costs for local and regional governments range between 38.76% and 60.01%. The most economically valuable forms of community benefit spending are the categories of spending most aggressively attacked by critics, particularly uncompensated Medicaid care. Medical education and medical research also sustain important estimated impacts (see Table 8).
Estimated Net Tax Revenues (Estimated Tax Revenues Subtracted by Estimated Cost of Tax Exemptions) Sustained by Four Nonprofit Hospitals, Denominated in 2019 USD, Rounded.
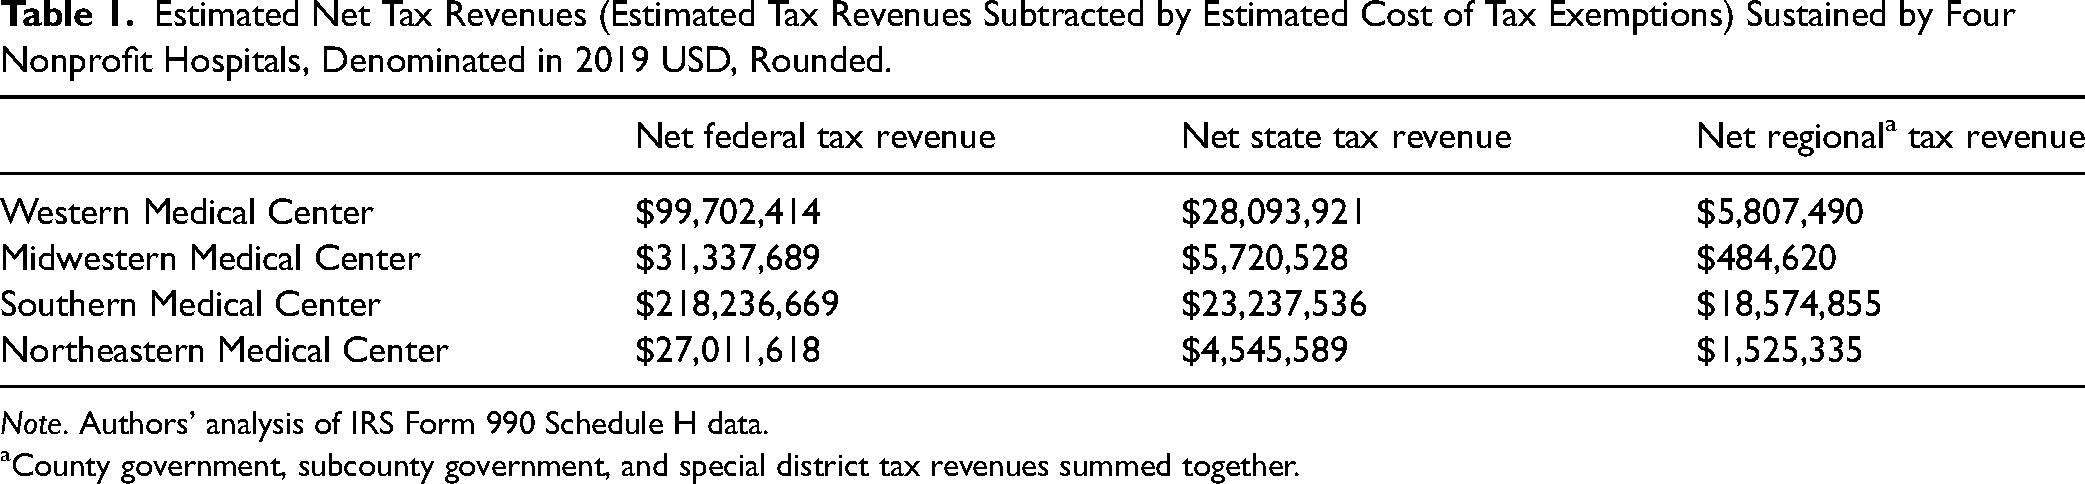
Note. Authors’ analysis of IRS Form 990 Schedule H data.
County government, subcounty government, and special district tax revenues summed together.
Our findings indicate two important policy insights regarding debates around nonprofit hospital tax exemptions and community benefit spending. While nonprofit hospitals do produce significant tax revenues for their host regions, the benefits of their revenues disproportionately flow to federal and state levels of government, when compared to the costs of tax exemptions imposed by hospitals’ nonprofit status. Also, community benefit spending, particularly uncompensated Medicaid services and financial assistance, sustains important economic impacts for their host regions.
Literature Review
In our study, we group U.S. hospitals by their tax status: nonprofit hospitals, for-profit (investor-owned) hospitals, and public (government) hospitals. Nonprofit hospitals, which account for 58% of short-term acute hospitals (Bai et al., 2021), receive a tax exemption from the IRS in exchange for adhering to the IRS's Community Benefit Standard. Community Benefit Standard criteria for nonprofit status includes offering services for all patients capable of paying for services, providing charity care (financial assistance for care and free or discounted services), providing uncompensated Medicaid and means-tested care, maintaining a board of directors representative of the hospital's community, foregoing profit by reinvesting revenues into facility and service improvements, and investing in medical education and research (Internal Revenue Service, 2023). On their tax forms (Form 990 Schedule H), nonprofit hospitals list “Financial Assistance and Certain Other Community Benefits at Cost,” by categories labeled Financial Assistance at Cost; Uncompensated Medicaid (net expenses); Costs of Other Means-Tested Government Programs; Community Health Improvement Services and Community Benefit Operations; Health Professions Education; Research; and Cash and In-Kind Contributions for Community Benefit (Internal Revenue Service, 2022). State governments can also play an important role in regulating Community Benefit Standards by mandating additional standards and requiring detailed reporting, with state-level mandated reporting having an association with higher community benefit expenditures from nonprofit hospitals. Prior research shows that state mandates are associated with higher community benefit spending (as a share of total hospital expenditures) by nonprofit hospitals—9.1% compared to 7.2% in states without these requirements (Zare et al., 2023).
Criticism of nonprofit hospitals’ tax exemption and community benefit practices can be broken down into two categories: (1) criticism of the level of nonprofit hospital spending on community benefit activities and (2) criticism of the activities nonprofit hospitals use to fulfill the Community Benefit Standard, particularly regarding nonprofit hospitals’ provision of benefits for the local and regional communities in which they operate.
Critics have argued that nonprofit hospitals tend to hold weak commitments to community benefit activities. Nonprofit hospitals are legally and normatively expected to provide community benefit and charity care spending, particularly for lower socioeconomic status communities. The expectation that nonprofit hospitals expend a share of their total revenue on community benefit spending was further codified in the 2010 ACA, which emphasized that nonprofit hospitals should produce “benefits to a class of persons that is broad enough to benefit the community” (Internal Revenue Service, 2023). This mandated annual reporting of community benefit spending to the IRS began in 2014. Prior to and after the implementation of the ACA's codification of community benefit spending as a prerequisite for maintaining nonprofit status, the bulk of nonprofit hospitals’ community benefit spending went toward funding clinical care (Young et al., 2013). Post-ACA, between 2012 and 2019, nonprofit hospitals’ overall operating profits and cash reserves rose by an average of $99 million (68%) compared to for-profit hospitals’ rise of $79 million (78%), yet their community benefit spending did not rise (Jenkins & Ho, 2023).
Scholars tracked the impact of the ACA on nonprofit hospital community benefit activities with mixed findings. Post-ACA, nonprofit hospitals’ community benefit spending did not change appreciably and the increases that occurred generally took the form of discounted charity care (Bai et al., 2022). State-level Medicaid expansions were associated with reductions in uncompensated Medicaid and means-tested care, which did not translate into increased community benefit spending (Dranove et al., 2016). Moreover, in states with specified minimum charity care provision requirements, nonprofit hospitals’ community benefit spending remains low overall, but there is evidence that these policies induce greater charity care among hospitals with the lowest levels of charity care provision (Rothbart & Yoon, 2021). In states where the ACA helped reduce uncompensated Medicaid costs, analysts found that other community benefit spending categories did not increase (Stoecker et al., 2020; Young et al., 2018). Another analysis found that smaller nonprofit hospitals are more likely to provide high rates of charity care, while larger nonprofit and for-profit hospitals do not differ significantly from one another in their rates of charity care provision (Bruch & Bellamy, 2021).
Academic and think tank-based critics have argued that charity care deserves more weight when judging community benefit performance than Medicaid expenses and medical education and research, which tend to constitute most of nonprofit hospitals’ community benefit spending. Bai and colleagues found that nonprofit hospitals did not outperform their for-profit and public counterparts in terms of charity care spending. In fact, a key finding was that “in 2018, among Medicare-certified general acute care hospitals, nonprofit hospitals provided the lowest aggregated charity care per dollar of expense and government hospitals had the highest percentage of hospitals with charity-care-to-expense ratios of less than 1 percent” (Bai et al., 2021, p. 633). Based on these findings, the authors advocated for greater transparency and reform of state-level charity care standards for all three types of hospitals. The American Hospital Association (AHA) responded in a press release, arguing that nonprofit hospitals invest considerable time and effort into enrolling patients into Medicaid specifically because continuous Medicaid coverage for patients is more effective for ensuring health care access than charity care. Additionally, the AHA highlights the role played by federal subsidies for hospitals in aiding the affordability of prescription drugs for patients (Hatton, 2023).
A more public-facing round of debate about community benefit spending emerged in the late 2010s in academic, media, and think-tank sources. In a 2018 article, a team of health economists found that 62% of nonprofit hospitals had community benefit spending that exceeded the value of their tax exemptions (Herring et al., 2018). This was corroborated by a 2022 analysis produced by Ernst & Young, which estimated that nonprofit hospitals’ community benefit spending exceeded the value of nonprofit hospitals’ tax exemptions by $86 billion in 2019 (Ernst & Young, 2022). A competing analysis produced by the Lowen Institute, using 2020 data, found that 77% of all U.S. nonprofit hospitals spend less on community benefit spending than the value of their tax exemptions, resulting in an approximate community spending deficit of $14.2 billion (Lowen Institute, 2023). Subsequent debate between the AHA and its critics has concerned which types of community benefit spending should be counted in analyses (Pollack, 2022), with uncompensated Medicaid and means-tested spending being a major target of nonprofit hospital critics.
Many of the criticisms put forth by academic and think-tank sources became circulated through media coverage in The Wall Street Journal and The New York Times. UCLA law scholar Jill Horwitz argued against many of the more aggressive criticisms, claiming that nonprofit hospitals are being unfairly targeted as responsible for system-wide flaws in the U.S. health care system: “Unfortunately, nonprofit hospitals cannot fix this vast, national problem. On average, nonprofit urban hospitals have long experienced annual operating losses. Increases in supply and labor costs have made things worse even as government subsidies during the pandemic helped keep hospital doors open. Imposing these free-care requirements on the average community hospital could be financially devastating, even more so for rural hospitals. Indeed, even profitable nonprofit hospitals do not have the resources to fill this gap” (Horwitz, 2024).
This touches on an important aspect of nonprofit hospitals’ relationship with their local and regional communities, which we argue deserves greater attention in debates about tax exemptions and community benefit spending: their dual role as providers of community benefits and their role as important economic actors (Fleming, 2023). An economic development perspective on nonprofit hospitals can highlight the tax and economic windfalls of nonprofit hospital operations, while accounting for the structural limitations faced by these institutions.
In this study, we use economic impact analysis to demonstrate crucial relationships between nonprofit hospitals and their host regions, particularly regarding tax revenue that nonprofit hospitals produce despite their tax exemptions and the economic importance of community benefit activities. This can fill a gap in the literature by bringing an important economic development perspective to the scholarly debate about the role of nonprofit hospitals in the communities and regions that host them. Also, this paper offers a novel application of economic impact analysis. Studies of nonprofit hospitals that use economic impact analysis have usually been produced as grey literature reports by consultants and think tanks. Often, these studies are a full accounting of all economic impacts generated by a specific hospital or hospital system (Silverlode Consulting, 2021) or the economic impacts of all hospital activity across a broader geographic region, such as an entire state (Oliver et al., 2017). However, research question- or hypothesis-driven studies using these methods have been less common.
Data
We derive employment, employee compensation, and total expenses data for four nonprofit hospitals from 2019 IRS Form 990 and IRS Form 990 Schedule H forms (Internal Revenue Service, 2022) located in four small-to-medium MSAs. Each institutional model is generated using 2019 nonprofit hospital employment, employee compensation, and total expenses data as inputs, which are modeled within the broader regional economy of each hospital. IMPLAN's models of regional economies use U.S. Census Bureau, U.S. Bureau of Economic Analysis (BEA), U.S. Bureau of Labor Statistics (BLS), and U.S. Department of Agriculture (USDA) data sources (IMPLAN Group LLC, n.d.) (Table 1).
Data on hospital behavior are derived from IMPLAN's Social Account Matrix, which uses federal industrial, commercial, and household economic data to model a typical hospital's service and commodity spending (Clouse, 2021a), drawing from 290 types of services and commodities. The spending patterns of specific industries shift year over year. Per 2019 data, the largest recipients of hospital spending were insurance (12.16%), real estate services (9.37%), employment services (7.26%), management and consulting services (4.6%), and legal services (4.01%). Most other services and commodities, including health care equipment, labor, and facilities costs, were spread out among the other types of commodities, services, and capital spending. We judged IMPLAN's spending pattern assumptions to be realistic, with the large shares of spending on professional and employment services representing the influence of the Baumol Effect on health care spending patterns. We deemed IMPLAN's spending patterns to be workable for both nonprofit and for-profit hospitals. While differences in service mix have been found between nonprofit and for-profit hospitals, they have usually concerned the relative profitability of services provided by hospitals, with capital and labor spending having similar patterns at both types of institutions (Horwitz, 2005). The four hospitals selected for analysis do not specialize in specific forms of care and offer a typical basket of services, such as primary care, trauma and emergency care, and common types of specialist physician services.
Modeling Four Nonprofit Hospitals in Four Different Small-to-Medium MSAs
We present four case studies of economic impact analyses of nonprofit hospitals’ tax exemptions, tax revenues, and community benefit spending within small and medium-sized metros in the United States (see Table 2). Small and medium-sized MSAs are a better fit for economic impact analysis than larger MSAs. Also, literature on anchor institutions and community benefit often favor studies located in larger MSAs, despite hospitals serving as important anchor institutions for small and medium MSAs as well.
Hospitals and Community Characteristics, 2019.
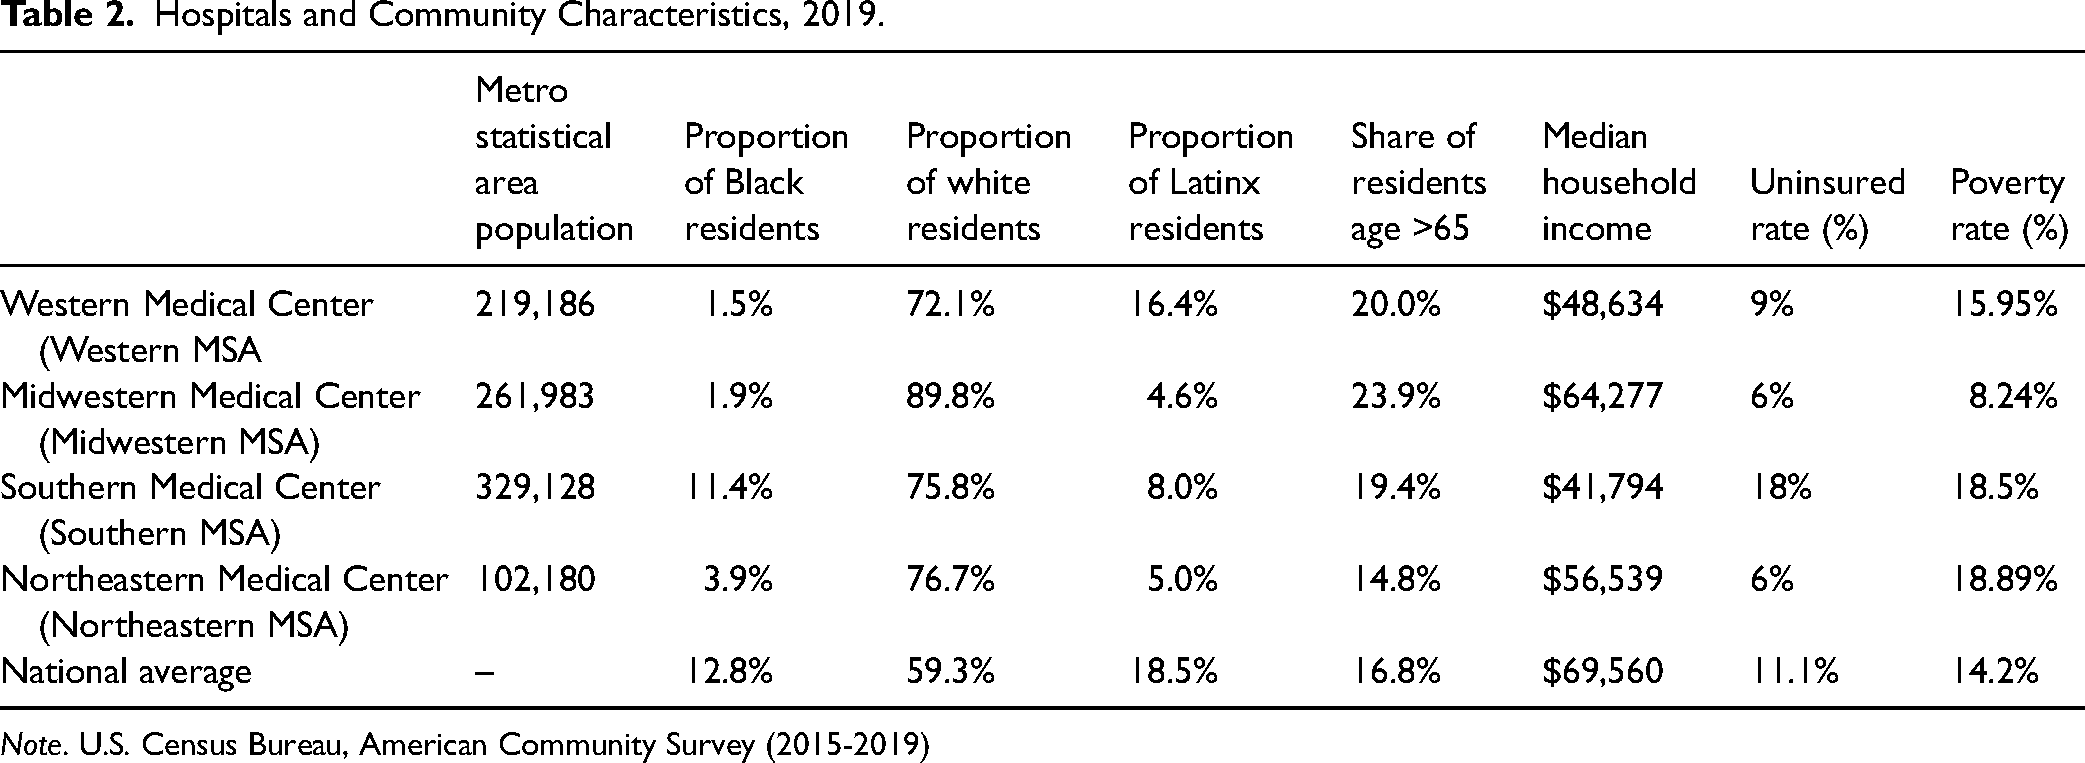
Note. U.S. Census Bureau, American Community Survey (2015-2019)
The case study hospitals are pulled from four census regions in four states. Within these states, nonprofit hospitals comprise between 37.4% and 73.1% of all hospitals, compared to the national scale, where nonprofit hospitals constitute 58% of non-federal, short-term acute hospitals (Bai et al., 2021). The metropolitan regions ranged in population from 102,180 to 329,128 residents in year 2019. Three of the four regions had populations older than the national average. All regions had populations with lower Hispanic and Black populations than the national average, although the Southern MSA's Black population was close to the national average, as was the Western MSA's Hispanic population. The Southern MSA has a substantially higher uninsured rate than the other metros, likely due to it being in a non-Medicaid expansion state with an above-average poverty rate. Because prior research has shown that nonprofit hospitals in service areas with higher uninsured rates have higher community benefit spending, we also provide the adult uninsured rate.
The four modeled nonprofit hospitals vary in operational size, number of employees, and ratio of labor expenses to nonlabor operating expenses. There is notable variation in the ratio of employee compensation to total expenditures and revenue, which is discussed in the results section. For all four hospitals, total revenues are above total expenses by thin margins.
Methods
Introducing Economic Impact Analysis
Economic impact modeling is an application of input-output (I-O) economics. Economic impact analysis uses a broader model of a region's economy, composed of industries, institutions, and households, to model the specific impact of an institution or firm within a regional economy. For example, a hospital may spend $10 million a year as part of its operating expenses, which represents the direct impact of the hospital's operations. The hospital's spending will also have an indirect impact, because each dollar it spends sustains commercial interactions with other firms and institutions through the hospital's business-to-business purchasing. In turn, the hospital's spending will produce induced impacts, because of how the direct and indirect impacts affect the economic behavior of households within the region (Quinterno, 2014, p.45). I-O models, such as IMPLAN, also account for leakage, economic, and tax impact that “leaves” the analysis region when a firm purchases commodities or services from outside the analysis region (Clouse et al., 2023).
IMPLAN is a major vendor for economic impact analysis. IMPLAN deploys input-output (I-O) analysis, in tandem with a Social Accounting Matrix (SAM), to track interdependencies between producing and consuming industries of a specific economy, including spending of households. It models the relationship between an “event” (a specific quantity of demand for goods and services), and measures which final goods and services are required to satisfy the event. IMPLAN offers the ability to model the direct, indirect, and induced tax impacts of modeled economic activity, using data of federal, state, county, subcounty general (local government), and subcounty special-district tax receipts from the Census of Governments, Annual Survey of State and Local Government Finances, and Annual Survey of State Government Tax Collections (Lucas, 2021), which are synthesized with tax data from national income and product accounts produced by the BEA (IMPLAN Group, LLC, 2017).
Exploring the Intersection of Community Benefit Spending and Economic Development Through Economic Impact Analysis
Using economic impact analysis, we investigate three major questions regarding the role of nonprofit hospitals as anchor institutions:
How does a region's economic structure influence the net tax revenue impacts of nonprofit hospitals? How do these impacts vary by level of government? How do different definitions of nonprofit hospitals’ community benefit spending affect the quantity and spatial extent of their economic impact?
Economic impact analysis allows analysts to model both the institutional characteristics of specific nonprofit hospitals and the regional economies they occupy. While nonprofit hospitals are exempt from paying many direct sales and property taxes, they sustain additional commercial activity and employment that produce a positive sum amount of local, state, and federal tax revenue. Community benefit spending, which includes medical research, professional medical education, and uncompensated Medicaid costs, also represents a significant investment in a nonprofit hospital's regional economy. In fact, we find that more controversial categories of community benefit spending tend to have the greatest economic impact for local and regional economies, although this can vary based on the institutional arrangements of specific nonprofit hospitals, such as their teaching status.
We present eight models of nonprofit hospitals using IMPLAN's economic impact modeling software, two for each of the four nonprofit hospital case studies. The two sets of models contain different inputs and do not overlap. The tax impact models use IRS Form 990 data to estimate the size of the tax exemption that would hypothetically be assigned to each hospital based on its size (total expenses). The second set of models use IRS Form 990 Schedule H data to model the economic impacts of the specific community benefit spending programs of each nonprofit hospital. The hospitals are given aliases named after the region of the United States in which its host MSA is located: Western Medical Center, Midwestern Medical Center, Northeastern Medical Center, and Southern Medical Center. The data year and dollar year are set to 2019 for all models. Also, institutional and industrial spending patterns are set to 2019 patterns because IMPLAN produces spending pattern models for each year.
Modeling Tax Exemptions and Tax Revenues with IMPLAN
As with its estimates of economic impact, IMPLAN's tax impact estimates disaggregate into direct, indirect, and induced impact types, using tax receipt data on subcounty special district taxes, and subcounty, county, state, and federal government taxes to model impacts at each level. We use IMPLAN to model estimates of tax revenue sustained by each hospital. To estimate the value of nonprofit hospital tax exemptions, we run two models for each nonprofit hospital institution: one where the modeled hospital is treated as a for-profit entity and another where it is treated as a nonprofit entity. We then subtract the tax revenues of the nonprofit model from the for-profit model to estimate the nonprofit hospitals’ tax exemptions.
IMPLAN also has limitations for estimating nonprofit hospital tax exemptions. Our models subtract taxes on the nonprofit hospital's operations, adjusting state and local tax rates based on U.S. Census of Governments data. However, many states and localities have specific tax exemptions, such as for certain types of medical equipment or assets held by a nonprofit hospital, which cannot be accounted for from IRS Form 990 data. Our tax exemption estimates likely underestimate the final tax exemptions of nonprofit hospitals, particularly for local levels of government. A thorough estimate of an existing nonprofit hospital's tax exemptions requires data from a range of data sets (Herring et al., 2018).
Modeling Community Benefit Spending with IMPLAN
Community benefit spending data are available from IRS Form 990 Schedule H. However, the formal legal definition of community benefit spending is debated, with media and academic analysts arguing that uncompensated Medicaid and means-tested care, medical research, and professional medical education should not count toward the fulfillment of the Community Benefit Standard (see literature review). To reflect these controversies, we enter community benefit spending as economic impact events according to three different scenarios. In the first scenario, only community health spending, subsidized health services, and cash and in-kind contributions to local institutions are treated as community benefit spending. These are the types of community benefit spending that critics have argued should be prioritized for Community Benefit Standard assessments. The second scenario adds spending on education for health professionals and medical research. The third scenario adds uncompensated Medicaid and other means-tested health care spending and financial assistance. All definitions of community benefit activity are drawn directly from Form 990 Schedule H language. The third scenario includes all activities defined as “community benefit” in Form 990 Schedule H (Internal Revenue Service, 2022).
Using and Interpreting IMPLAN Models
While economic impact analysis serves as a powerful tool for exploring the contributions of anchor institutions, it is important to understand the method's limitations and to carefully frame the results of economic impact modelling. We intentionally use the language of “sustaining” or “sustains” when describing the economic impact of the nonprofit hospitals on each of their host regions. This is because even if an analyst can demonstrate that an institution has a substantial economic impact within its host region, the institution's operations are not the only possible means for causing impacts. Consider the example of a hospital that operates in the central area of a major city: An economic impact model of its operations would demonstrate that the operations produce substantial direct, indirect, and induced economic and tax impacts in a given analysis year. However, if the hospital were to close, other hospital and health care institutions would likely adjust quickly to absorb their health care, thus mitigating or even nullifying the loss of economic impact from the hospital's closure (Ramedani et al., 2022). This limitation has been noted in the academic literature, in cases where analysts model change in supply chains without accounting for economic reflexivity of manufacturers (Rogowsky & Klenk, 2019), or when analysts attempt to model economic impacts during periods of rapid economic transformation within a region (Drucker, 2015).
There are three methods for working around this limitation. One method is to model the entirety of a type of economic activity within a region, rather than that of a specific firm or region, such as all hospitals operating within a state (Oliver et al., 2017). The second method is to take care to select a strong geographic fit. All four geographic regions used in the analysis are small-to-medium MSAs (Khalaf et al., 2022). Hospitals in each of these regions, whether nonprofit, public, or for profit, represent a significant amount of hospital institutional capacity for the region. In fact, Northeastern Medical Center is the sole hospital operating within its region. While a hospital closure in a smaller MSA might be compensated for by increases in hospital service provision by other regional institutions, this shift would likely be more difficult for the region to achieve in the near term and would likely result in declines in service quality.
The third method for working within the limitations of an economic impact analysis is to use caution when discussing a model's results. We describe the modeled hospitals as “sustaining” the estimated economic and tax impacts, rather than serving as the sole possible source of the modeled hospital capacity within each region.
Another oft-noted limitation of IMPLAN is its static coefficients – meaning, when IMPLAN models an event, it does not model the potential impacts of the event on the prices of labor or commodities. For example, if a hospital were to invest in an expanded labor force, this investment would likely increase the price of health care labor in its region, which IMPLAN does not capture in its modeling. However, because we are replicating the activity of nonprofit hospitals at a specific point in the past, IMPLAN's static coefficients are acceptable. If our modeled events did impact the price of labor, equipment, or materials, it would raise the modeled prices above their actual 2019 levels in each region. Finally, we should note that IMPLAN models commercial, property, and labor market activity. There are two important forms of benefit and cost that are not included in these models. For example, a hospital's services improve the health and well-being of a region's residents but the economic value of health-related contributions of hospital activity are not included in our models. Given that exclusion, our models can reasonably be said to underestimate the positive economic impact of hospital activity. We also cannot account for Payments in Lieu of Taxes (PILOT), fees that localities can charge nonprofit organizations, including nonprofit hospitals. Furthermore, some types of costs to municipal governments are not included in our models, such as infrastructure costs imposed by traffic congestion or similar negative externalities. IMPLAN assumes that nonprofit hospitals pay for waste disposal and other municipal services but cannot incorporate more diffuse externalities.
Metropolitan Statistical Areas and IMPLAN
Many anchor institutions, including hospitals, are of multiple scales in nature. Some of their social and economic impacts are national in scale, while some may be hyper-local, at the neighborhood level. Our analysis opts to use the regional (metropolitan) scale. The workforces and service shed of hospitals are regional in nature, especially in smaller MSAs, with most of a hospital's important impacts occurring across an entire metro area.
Two of the modeled nonprofit hospitals are hosted in single-county metro regions: Western and Northeastern Medical Centers. The Southern and Midwestern Medical Centers are located in central counties of multicounty metro regions. IMPLAN's Multi-Regional Input-Output (MRIO) function was applied to these two regions. The resulting models defined the central counties as the location of the modeled nonprofit hospital, while also allowing for examination of economic impacts on outlying counties. This also includes interactions between households in central and outlying counties for indirect and induced impacts (Clouse, 2017). Relative to outlying counties, the central counties of these regions produced most of the in-region economic impact. For example, 99.23% of the Southern Medical Center model's intraregion impact occurred in the central county of its host MSA. Of Midwestern Medical Center's intraregion economic impact, 92.18% occurred in the central county of its MSA.
Estimating Nonprofit Hospital Tax Exemptions and Tax Revenue
The model for each nonprofit hospital uses employee head count, employee compensation, and total expenses data as the model type inputs for Industry Impact Analysis (Detailed), with Hospitals-490 set as the industry. For the Industry Impact Analysis event, employee head count is entered as Wage & Salary Employment, employee compensation is entered as Employee Compensation, and total expenses is entered as Total Output. There are other possible model inputs: Proprietor Income/Employment, Taxes on Production & Imports, Other Property Income, Intermediate Inputs, Total Employment, and Total Labor Income. For both types of models, intermediate inputs are left blank, with IMPLAN filling in intermediate inputs based on its built-in assumptions about 2019 hospital spending patterns. Also, both types of models have Proprietor Employment, Proprietor Income, and Other Property Income set to $0, meaning that they are excluded from the model. The use of Industry Impact Analysis for modeling both for-profit and nonprofit hospital operations aligns with best practices for hospital modeling within IMPLAN, and our selection of inputs follows IMPLAN's guide for nonprofit and for-profit hospital modeling (Clouse, 2021b). Although total revenues are not used as an input, they are included in Table 3 to illustrate institutional differences between the modeled hospitals.
Characteristics of Modeled Nonprofit Hospitals, 2019.
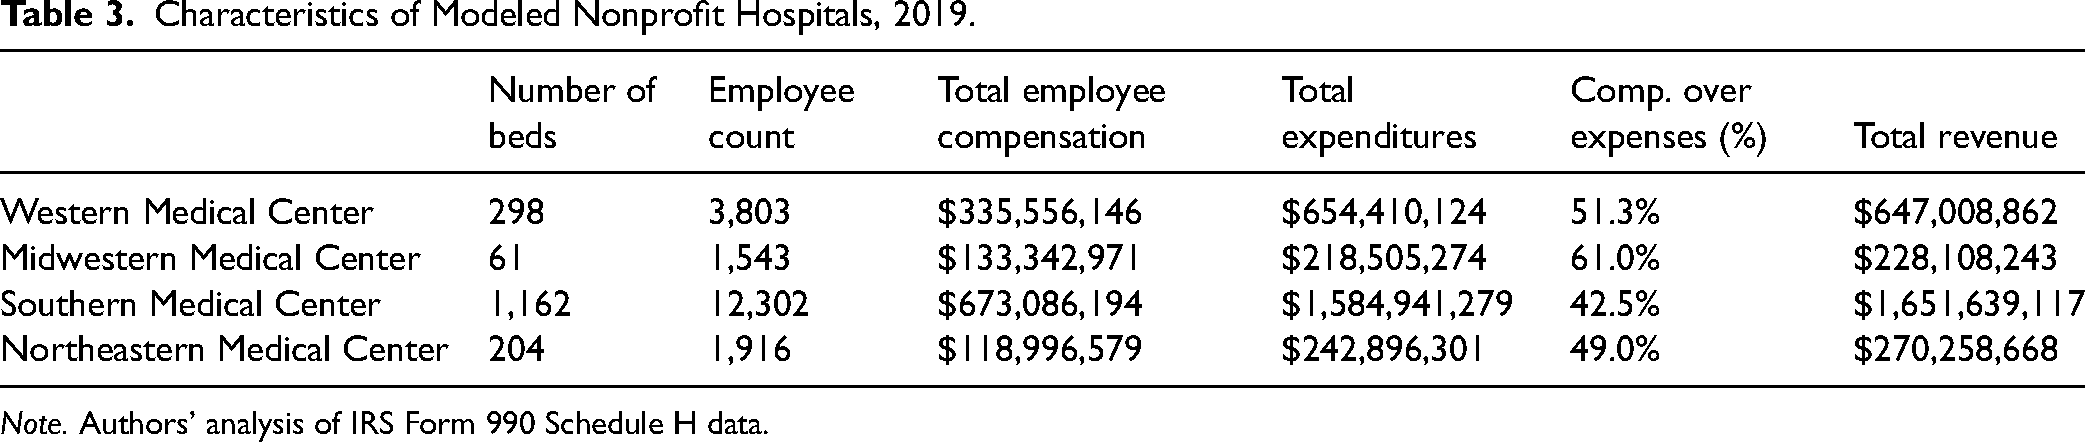
Note. Authors’ analysis of IRS Form 990 Schedule H data.
Northeastern Medical Center's tax impact model is run as an Industry Contribution Analysis, instead of an Industry Impact Analysis, because it is the sole provider of hospital services within its region. This poses the issue of potential excessive industry “buybacks” in the analysis results. In a regular impact analysis, IMPLAN assumes that a given hospital will purchase some hospital services from other hospitals within the study region, hence the term buybacks. Using Industry Contribution Analysis removes the assumed intraregional transactions between hospitals.
Southern Medical Center is also notably different from the other modeled nonprofit hospitals due to its status as a teaching hospital. This affects modeling for this hospital's community benefit spending impacts, rather than its tax impacts. This means that Southern Medical Center offers relatively large amounts of pro bono medical care and spending on medical education and research. Also, Southern Medical Center does not incur uncompensated Medicaid costs, or similar means-tested medical service costs, due to its status as a teaching hospital. Instead, most of its uncompensated care is classified as Financial Assistance.
Estimating the Economic Impacts of Community Benefit Spending
Next, we estimated three economic impact analyses based on community benefit spending for each nonprofit hospital in our sample (see Tables 6 and 7). Each model uses a different definition of “community benefit expenditure,” ranging from the most restrictive definition to the most expansive definition. As such, the first model (Model 1) only includes community health spending, subsidized health services, and cash and in-kind contributions to local institutions in its definition of community benefit expenditures. Community health spending and subsidized health services are modeled as Hospital Services, because these activities are primarily forms of funding for hospital care. Model 2 includes all Model 1 dimensions and adds education for health professionals and medical research (spending for teaching activity). Health education is entered as University Activity and medical research is entered as Scientific Research, the two closest approximations to these activities available in IMPLAN. Model 3 adds uncompensated means-tested health care spending (most notably Medicaid) and financial assistance to the definition of community benefit spending included in Model 2. Uncompensated means-tested health care and financial assistance are entered as Hospital Services.
Results
Tax Exemptions and Tax Revenues of Four Nonprofit Hospitals
In Table 4, tax impacts produced in IMPLAN at the county, subcounty general (city and township), and subcounty special district (police, fire, school, utility, etc.) scales are summed together as Regional Tax Exemption and Regional Tax Revenues. Regional Tax Revenues include direct, indirect, and induced tax revenues.
IMPLAN Estimated Economic Impact Output of Nonprofit Hospitals (Used to Calculate Tax Impacts in IMPLAN), Denominated in 2019 USD, Rounded to Nearest Dollar.
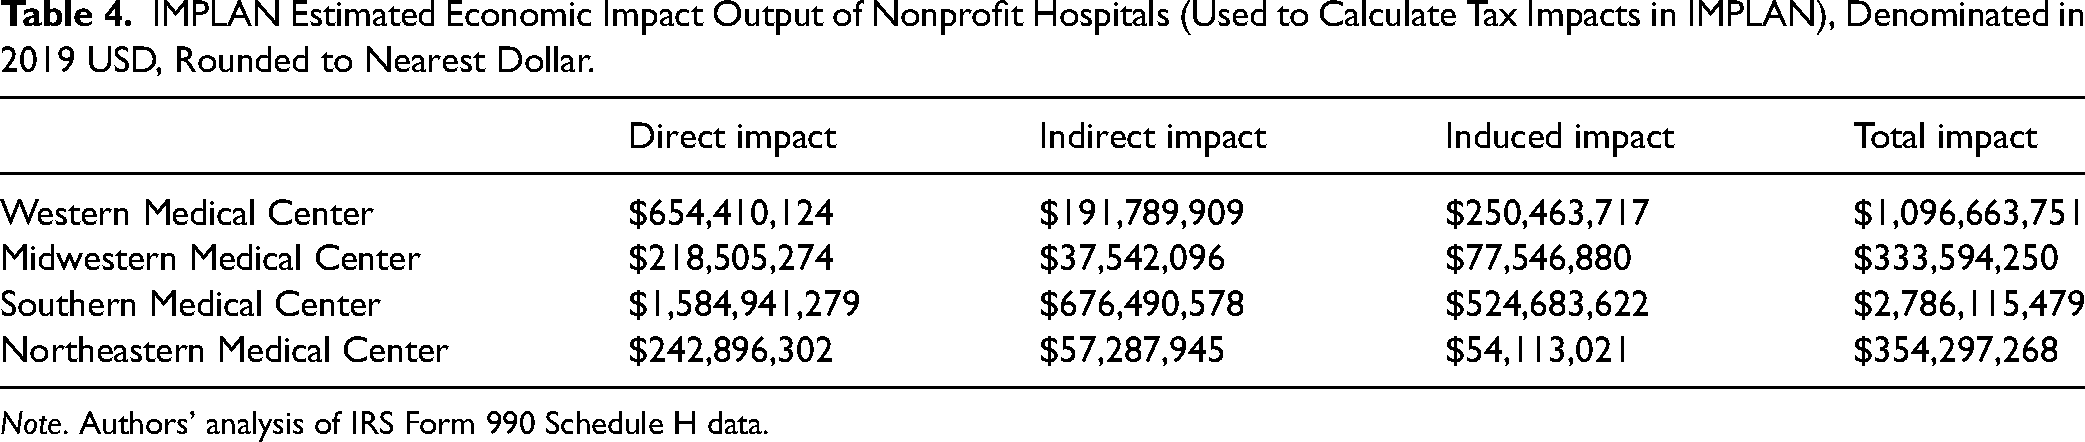
Note. Authors’ analysis of IRS Form 990 Schedule H data.
All four nonprofit hospitals produced tax revenues above the value of their tax exemptions, ranging from 16.68% (Midwestern Medical Center) to 71.85% (Southern Medical Center) above the value of exemptions (see Table 5). Whether modeled as for-profit or nonprofit, most tax revenues were produced by indirect and induced effects. However, when modeled as for-profit institutions, most of the hospitals did produce additional direct tax revenues compared to the nonprofit models, through direct effects. For example, when Western Medical Center is modeled as for profit, it produces estimates of $860,119 in county, $1.3 million in subcounty special district, and $1 million in subcounty general tax revenues through direct tax impacts. Nonprofit status reduces tax revenues for all three levels of government to a total of $163,500 in direct tax impact. Most revenue “lost” in the nonprofit models were direct tax revenue impacts of sales and property taxes at the subcounty special district, subcounty general, and county levels. For each of the three regional levels of government for the four modeled nonprofit hospitals, between 22.65% (Southern Medical Center, county) and 46.09% (Midwestern Medical Center, subcounty general) of tax revenue was reduced compared to the for-profit models. State revenues were impacted as well, ranging from a loss of 11.86% (Western Medical Center) to 26.46% (Midwestern Medical Center).
Estimated Regional Tax Exemption and Tax Revenues of Four Nonprofit Hospitals (Denominated in 2019 USD, Rounded).
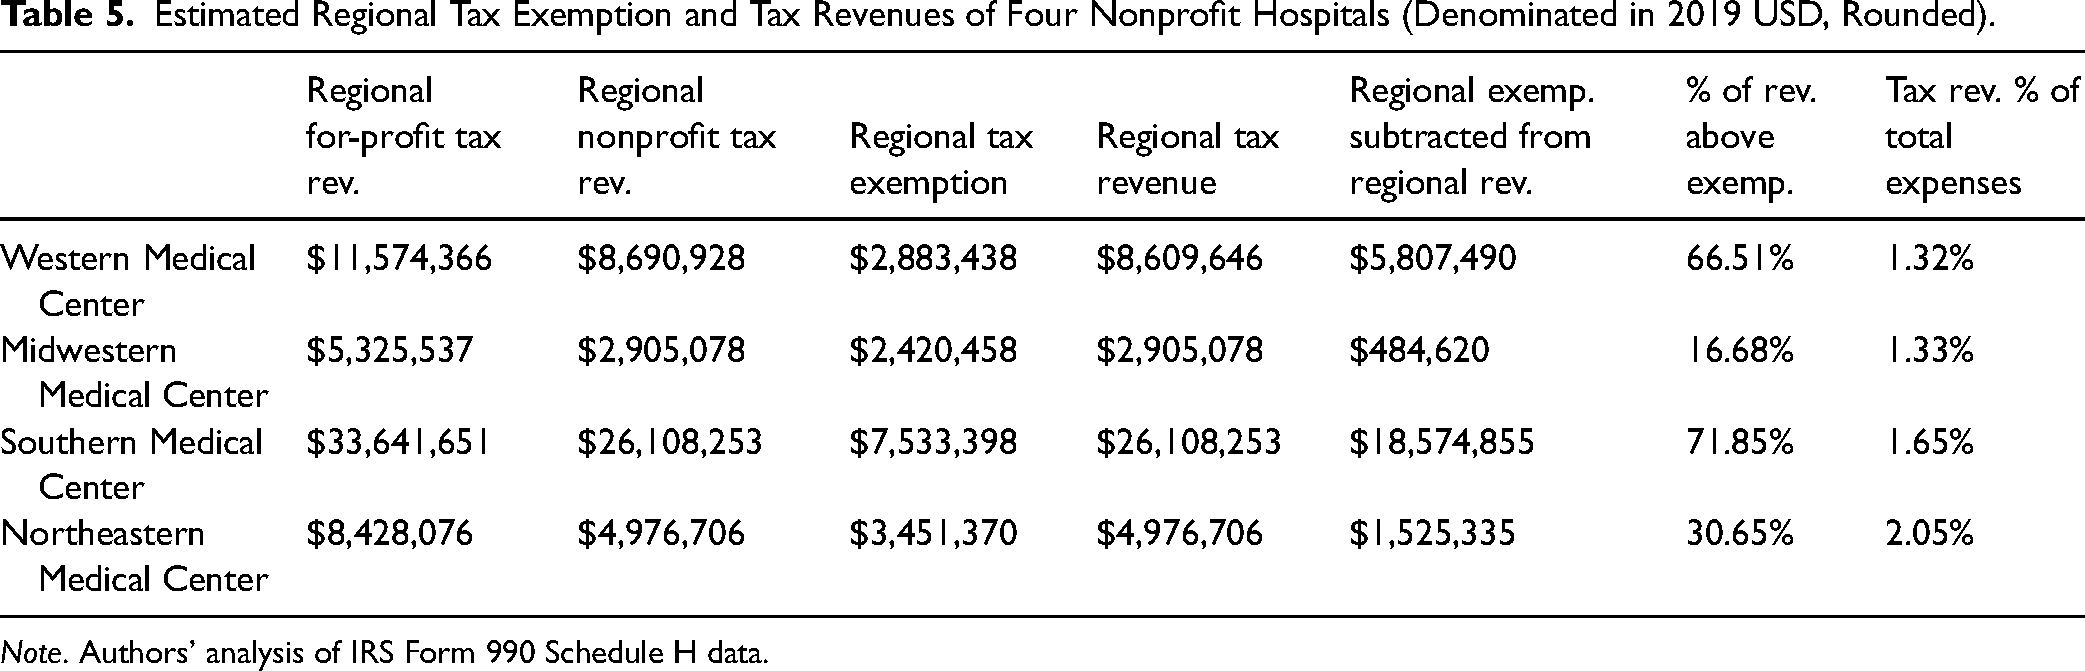
Note. Authors’ analysis of IRS Form 990 Schedule H data.
Federal tax revenues were relatively unaffected by nonprofit tax exemptions. The loss of federal revenue ranged from 0.19% (Western Medical Center) to 0.9% (Northeastern Medical Center), primarily due to the large amount of payroll taxes directly paid to the federal government, which are not exempted for nonprofit hospitals. Nonprofit status shifted the mix of regional, state, and federal tax revenues. In the nonprofit models, the share of federal tax revenues increases because of the loss of direct tax impact revenue, which has a large negative impact on regional tax revenues. Perhaps more importantly, most tax revenue for each of the four hospitals flows to the state and federal levels of government. The regional share of the modeled hospitals’ tax revenue ranges from 6.16% (Western Medical Center) to 13.07% (Northeastern Medical Center), with all other tax revenues flowing to state and federal governments. However, tax exemptions disproportionately burden local and regional levels of government, ranging from 38.76% of the total tax exemption for Western Medical Center, to 69.01% for Northeastern Medical Center.
We conducted a sensitivity test to determine how the economic structure of each region influenced the impact outcomes. For this test, we switched each pair of nonprofit and for-profit hospital models to different analysis regions, The results indicated that the structure of tax exemptions and revenues are heavily influenced by state and regional economies. Northeastern Medical Center's sales tax rates are split almost evenly between state and county, while the other three hospitals reside in states where state sales tax rates are substantially higher than county sales tax rates. This is reflected in the modeled tax impacts, where Northeastern Medical Center's share of state tax revenue is appropriately higher than the other three hospitals. Rates of effective property tax did not correspond to raw or relative amounts of property tax impact produced by the three nonprofit hospitals. This is likely due to the nature of property tax collections, which are heavily influenced by the demographic mix of a region's population.
Another sensitivity test was conducted on rates of employee compensation versus nonemployee compensation spending by the modeled institutions. The two main effects of changing employee compensation were to increase or decrease direct impacts, while indirect and induced impacts only experienced slight, nonsignificant changes. Also, lowering the rate of employee compensation shifts the mix of tax impacts in favor of regional and state revenues, while increasing compensation increases the share of federal tax revenue. This outcome is sensical, because sustained estimates of federal direct tax impacts are driven by payroll taxes. Both labor and operating costs fund wages and the purchasing of intermediate inputs, the majority of which are sustained estimates of indirect and induced tax and economic impacts.
Community Benefit Impacts of Four Nonprofit Hospitals
For the four hospitals in our sample, the total community benefit expenditure ranges from about $29 million to $164 million, representing substantial sums for anchor institutions within small- and medium-sized metros.
Using the most restrictive definition of community benefit (Model 1), the proportion of community benefit spending as a proportion of total expenditures ranges from 0.17% for Western Medical Center to 13.73% for Northeastern Medical Center. Using the most expansive definition of community benefit (Model 3), the proportion ranges from 7.73% for Southern Medical Center to 25.27% for Western Medical Center (see Tables 6 and 7).
Net Community Benefit Expenditures in 2019, Derived from IRS Form 990 Schedule H.
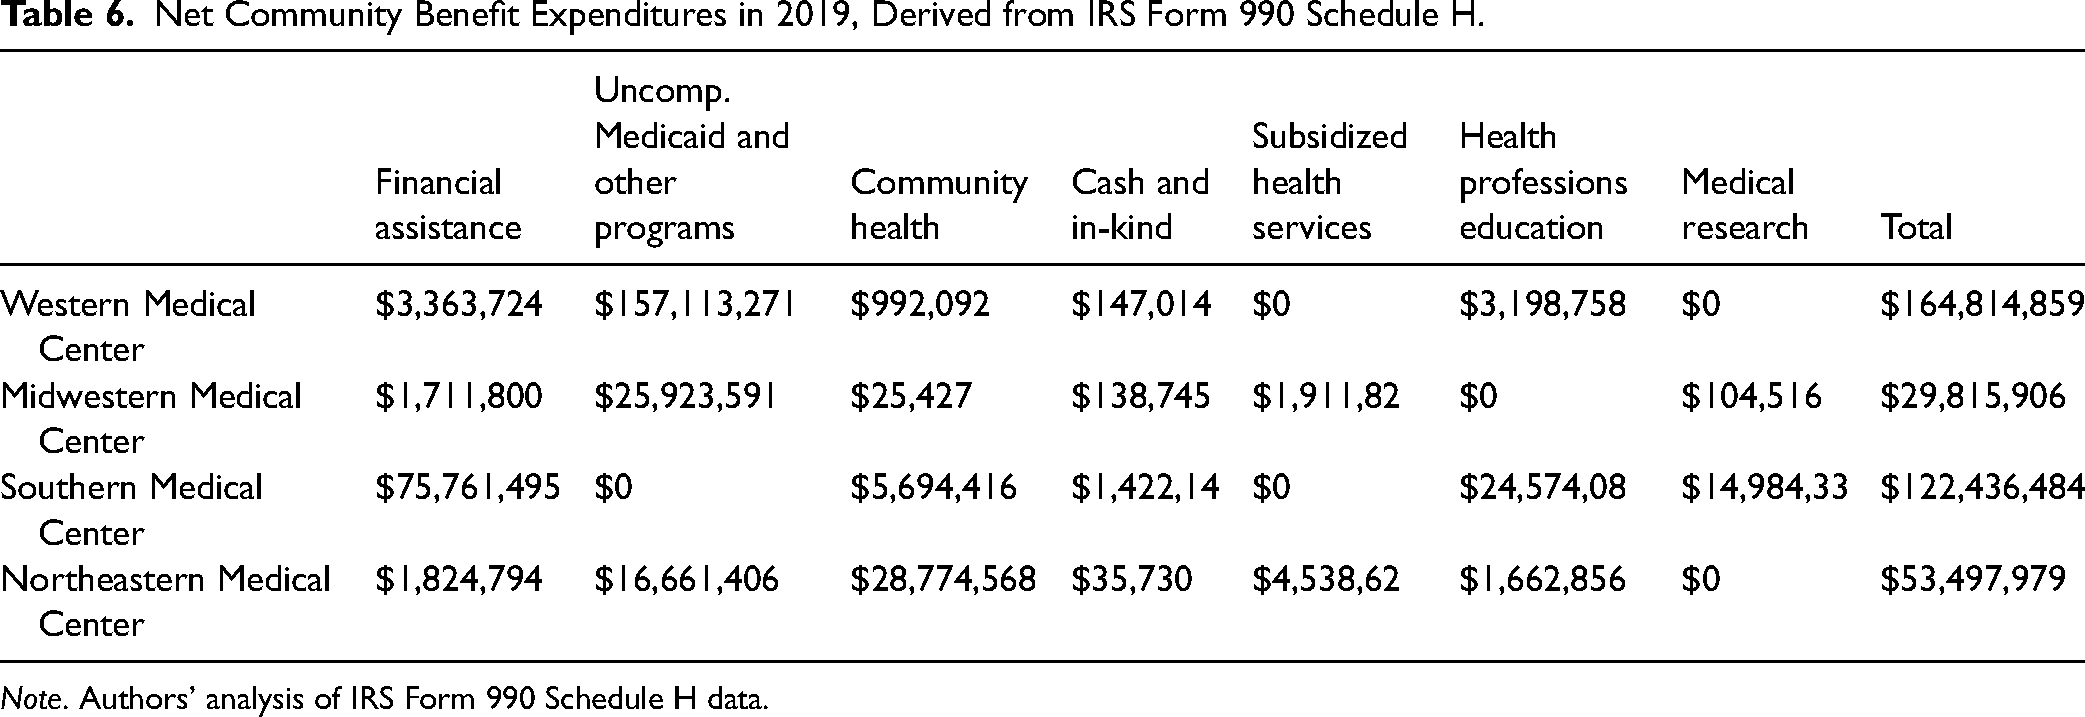
Note. Authors’ analysis of IRS Form 990 Schedule H data.
Total Community Benefit Spending in 2019: Three Scenarios.
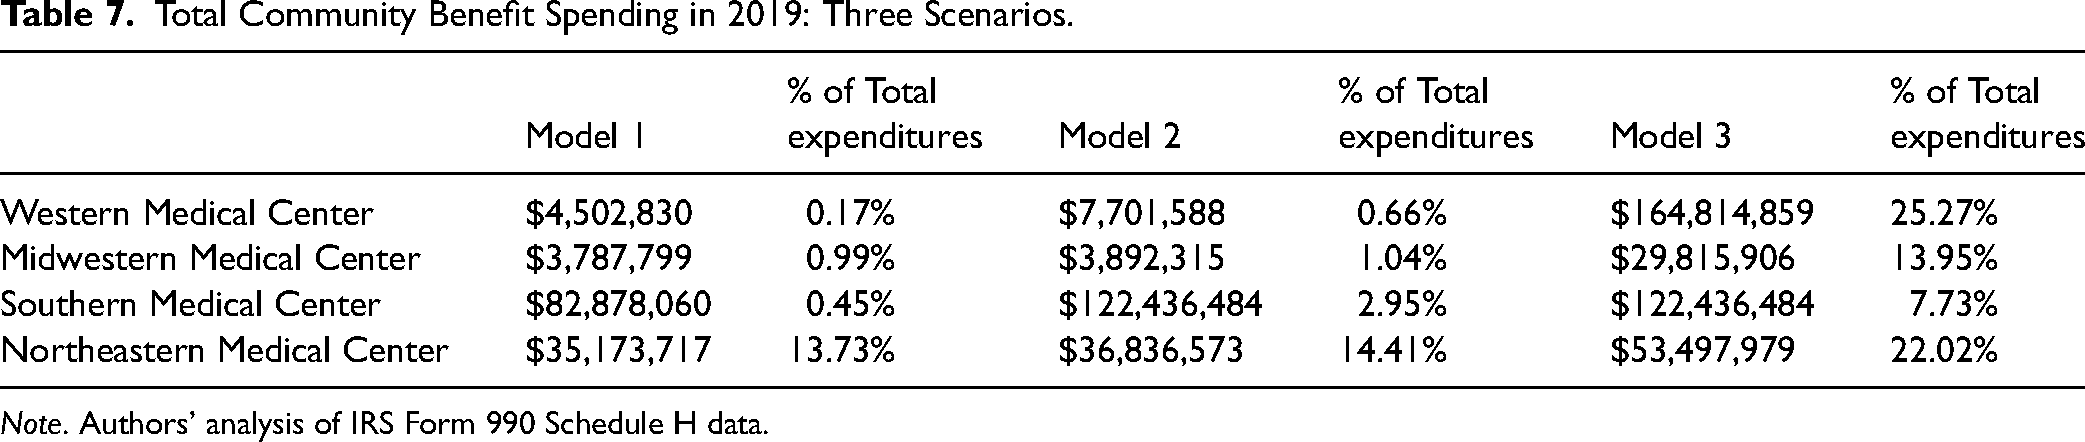
Note. Authors’ analysis of IRS Form 990 Schedule H data.
The results of the models show that the total economic impact increases dramatically, depending on the hospital's definition of community benefit spending. With the most restrictive definition of community benefit spending—excluding education for health professionals and medical research and the estimated value of uncompensated Medicaid and similar means-tested health care—we find that the estimated economic impact of community benefit spending is significantly lower. For example, Western Medical Center's economic impact in the Western MSA would increase by 3600%, from $7.3 million to $267.4 million, if community benefit spending is defined in the most expansive terms possible (Model 3; see Table 8).
Total Economic Impact of Community Benefit Spending: Three Scenarios.
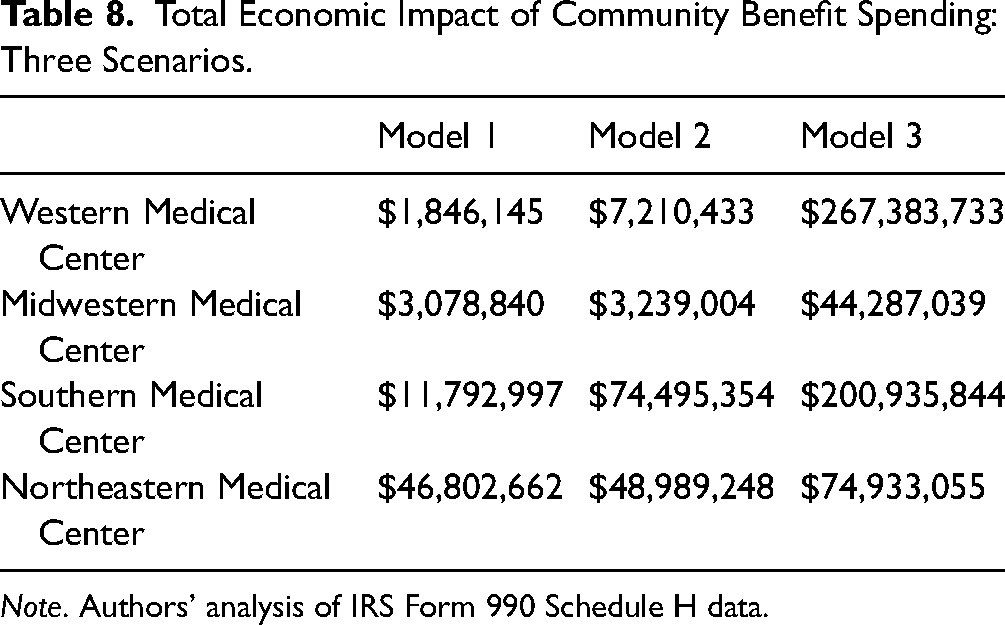
Note. Authors’ analysis of IRS Form 990 Schedule H data.
Discussion
We sought to answer three research questions:
How do nonprofit hospitals produce regional tax revenue for their host MSAs above revenues lost to tax exemptions? How do these impacts vary by level of government (federal, state, and regional)? How do different categories of nonprofit hospital community benefit spending contribute to regional development?
Our findings fill a gap in the literature by addressing the economic impacts of nonprofit hospitals in their capacity as major economic actors within small- and medium-sized MSAs while bringing an economic development perspective to these debates.
There are context-specific reasons for comparing raw community benefit spending and the economic impact of that spending. Comparing the two figures may provide a picture of the economic capacity of a given nonprofit hospital, and the potential outcomes of its community benefit spending if the institution, or a replacement, shifted its resources into different types of community benefit categories.
Both sets of models serve as heuristics for examining these relationships, allowing one to observe key features of how nonprofit hospitals may interact with their regional economies. Across the four case studies, there was significant variation in tax revenue produced, with tax revenue being muted in the case of Northeastern Medical Center, due to its status as the only institutional provider of hospital services in its host region. Despite variation in the rate and amount of tax revenue sustained by the four hospitals, all provided a robust stream of county and subcounty tax revenues. However, the nonprofit status of these hospitals shifted the governmental mix of recipients in favor of federal tax receipts, which were proportionally higher than in the for-profit models. Furthermore, the costs of tax exemptions largely landed on subcounty and county governments, while these levels of government proportionately benefited less from tax revenues sustained by nonprofit hospitals. It should be noted that because we do not conduct a thorough accounting of these hospitals’ tax exemptions, it is reasonable to assume that our numbers suggest a wider margin between the value of tax revenues and tax exemptions than previous studies in the health policy literature. The influence of regional economic structure on a nonprofit hospital's ability to sustain tax revenues is our more significant finding.
The findings of the second set of models indicate that key activities, such as uncompensated Medicaid care, may represent an important economic contribution to nonprofit hospitals’ host regions. Unsurprisingly, the least restrictive definitions of community benefit generate the largest estimated total benefit spending and resulting economic impact. Interestingly, the amount of community benefit and the amount of economic impact sustained by different nonprofit hospitals’ community benefit spending varies substantially from institution to institution. For Southern Medical Center, the $62.7 million difference in its estimated economic impact in Models 1 and 2 is attributable to its status as a teaching institution. Essentially, Southern Medical Center's medical education plays a more central role in its operations than it does in the other three hospitals.
Leakage of economic and tax impacts was present in all four models. Leakage refers to economic impact that flows outside of the analysis region, such as payments to workers or firms who reside in a different place than the regions being analyzed. Leakage reduces the estimated impacts of any event. IMPLAN produces estimates of the amount of leakage for specific industries within a region and automatically subtracts them from its estimates of sustained impact within the analysis region. For hospital industry activity, leakage is 17.79% for the Northeastern MSA, 25.15% for the Southern MSA, 16.52% for the Midwestern MSA, and 20.59% for the Western MSA. Other industrial sectors entered into the community benefit spending models have rates of extraregional leakage that tend to be several percentage points higher than that of hospital activity in each of the four MSAs. Rates of leakage are primarily influenced by an MSA's industry mix and proximity to other MSAs. The low rate of hospital activity leakage for Midwestern MSA likely reflects the area's high amount of export-level health care industry activity.
Limitations
To estimate nonprofit hospitals’ direct tax exemptions, we subtract the tax revenue of the nonprofit model from the economic impact model of a for-profit hospital with the same characteristics. This method is less exact than established methods for estimating tax exemptions in the academic literature, which triangulate IRS Form 990, HCRIS, and AHA data to estimate specific categories of local, state, and federal tax exemptions (Herring et al., 2018). Accordingly, we frame our results as an opportunity to explore the contributions and dynamics of nonprofit hospital operations in a specific class of MSAs, rather than as a fully accurate reconstruction of existing hospitals.
Also, because this analysis uses the regional scale, we do not differentiate between how tax impacts may affect different local governments or service districts within the same region. For our models, we assume that tax impacts for subcounty special districts are evenly distributed across those districts. In a real-life scenario, this would not be the case. Some special districts would be more greatly impacted by nonprofit hospital tax exemptions and revenues than others.
In the methods section of this paper, we noted that IMPLAN's fixed (static) coefficients did not pose a significant problem for our analysis. However, IMPLAN's fixed coefficients also indicates that we cannot produce estimates of how the modeled hospital activity affects supply chains or the prices of commodities and labor in these regions, which is a notable limitation.
Conclusion
Our findings suggest three insights into the ongoing debate about nonprofit hospital tax exemptions:
The spatial and economic structure of a nonprofit hospitals’ host region plays a major role in the amount of net tax revenue produced by its operations. Tax revenues generated by nonprofit hospitals disproportionately flow to state and federal governments, while the costs of tax exemptions disproportionately flow to local and regional governments.
Uncompensated Medicaid services and teaching hospitals’ financial assistance sustain important economic impacts for small and medium MSAs.
Nonprofit hospitals have come under a wave of tough criticism from journalists and scholars over the past decade. Tax exemptions and community benefit practices have been major targets of criticism, but there have been other areas of concern, such as nonprofit hospitals’ trustee compensation practices (Bai et al., 2023), their relative market power within specific regions (Capps et al., 2020), medical debt collection practices (North Carolina State Treasurer, 2022), and their role in gentrification (Tweet & Pardee, 2021). Moreover, prior research shows that hospitals shift the costs of uncompensated care onto private insurers and patients (Frakt, 2011) and, by extension, the inclusion of uncompensated Medicaid and other means-tested program costs in the Community Benefit Standard may shift the incentives and reduce this practice.
In the face of these criticisms, nonprofit hospitals face political challenges and institutional and operational constraints. Specifically, nonprofit hospitals maintain distinctive mixes of medical services (Horwitz & Nichols, 2022) while maintaining narrow revenue margins. As seen with the Southern Medical Center, some nonprofit hospitals may also appear to outperform their peers in community benefit spending, simply because their operational model does not involve uncompensated Medicaid and other means-tested program costs. In fact, analysts should further investigate nonprofit hospitals’ provision of uncompensated means-tested care. Uncompensated Medicaid and other means-tested care function to provide health care services to patients in need while maintaining important streams of economic activity for hospitals’ host regions. Given the dual economic and community importance of nonprofit hospitals’ uncompensated Medicaid and other means-tested care, it may be necessary to inject nuance into criticisms of these categories of community benefit spending in accordance with the Community Benefit Standard (Sherman & Doussard, 2019). Future studies should investigate the role of uncompensated means-tested care in maintaining access to distinctive services offered by nonprofit hospitals.
Local, state, and federal policy makers, when responding to these criticisms, need to account for the limitations faced by nonprofit hospitals. Public policy makers and institutional policy makers within hospital systems should focus on new, constructive policy responses. Policy solutions for improving community and nonprofit hospital relations will likely need to take advantage of the overlap between community and economic development, given these institutions’ constrained resources. One key overlap is workforce development (Horwitz, 2024) because it meets the mutual needs of hospitals and the communities that host them. Health workforce development programs can align with hospitals’ strategies for addressing high and rising labor costs, while increasing opportunities for community members. Health policy scholars have noted the synergy between hospital workforce development and programs guided by Social Determinants of Health perspectives (Fleming, 2023). It also happens to be a policy area where offering community-oriented services and economic development overlap. Moreover, as Fleming and colleagues noted, health systems have already “begun to reconceive their training and employment practices as interventions into the Social Determinants of Health (SDoH)” (Fleming, 2023). The Democracy Collaborative think tank has also outlined strategies for a renewed focus on hospital workforce development, highlighting the possibilities for building trust in underserved communities by connecting health care to community development (Democracy Collaborative, 2019).
Footnotes
Declaration of Conflicting Interests
The authors declared no potential conflicts of interest with respect to the research, authorship, and/or publication of this article.
Funding
The authors disclosed receipt of the following financial support for the research, authorship, and/or publication of this article: This work was supported by the Robert Wood Johnson Foundation (grant number 79801).