
Abstract
Because of large acreages, sparse populations, and distinct sociopolitical dynamics, many rural communities are beginning to assemble their own sets of economic indicators to fit unique policy agendas. This review summarizes over 30 years of practical efforts from six regions that created economic development reports. Reports cover 60% of the nonmetro counties in the United States. Over half the reports were issued in the last 5 years. To understand distinctions between scholarly efforts and how communities leverage publicly available data sets toward policy objectives, the authors compare the rural, regional economic development reports assembled through community partnerships with indicators recommended in rural wealth creation literature. The authors identify a gap in scholarship and practice with implications for how practitioners and researchers conceptualize the creation of wealth in rural areas and conclude with best-practice approaches to co-creating rural economic indicator reports, especially where data can be tailored precisely to rural areas.
America's rural areas contain important and unique historic, economic, cultural, and agricultural resources that benefit residents, visitors, and broader communities. While urban areas occupy only 4% of the U.S. land area, rural areas cover the remaining 96% (U.S. Census Bureau, 2017). Less than one-fifth of the population lives in these large natural and managed landscapes of forests, wildlands, rangelands, and farms (Bigelow & Borchers, 2017; Han et al., 2012; U.S. Census Bureau, 2017; USDA, 2017). Unlike their urban counterparts, rural stakeholders often have markedly different policy objectives. Instead of focusing on population growth, many rural areas prioritize land preservation over development to increase agricultural economic vitality and bolster tourism to natural and scenic areas (Brinkley, 2012). Even where policy objectives are similar to urban areas, challenges faced by rural areas often require different policy approaches. For example, in the Midwest, cooperative energy suppliers are meeting the needs of rural electrification and energy demands as opposed to more traditional municipal or investor-owned utility companies in urban areas (Taylor, 2019). Similarly, over 98% of the communities lacking a supermarket are in rural areas, according to the U.S. Department of Agriculture (USDA), which has given rise to calls to attract investment capital in sparsely populated areas within the context of addressing food access for rural economic development (Brinkley et al., 2017, 2019). Because of larger landscapes, the influence of nearby large cities, and shared objectives across multiple counties, a regional approach to resource management and policy benchmarking is practical in collaborative planning approaches. As a result, this research is focused on rural economic development efforts beyond a single county.
Such economic development initiatives and calls have led to an interest among policy makers and economic development stakeholders in better understanding and tracking the economic health of regions. Yet, gaps between the academic literature and community stakeholders persist in relation to the definitions, measurements, and how to assess and evaluate the impacts from rural investments and policy in relation to a rural region's economic health. This article demonstrates the differences in indicator data used in regional reports and those used by academic researchers seeking to evaluate the impacts from rural investments and policy formation (Arrow et al., 2013; Marré & Pender, 2013; Pender et al., 2012a, 2012b, 2012c; Pender & Ratner, 2014; Rupasingha & Pender, 2018; Schmit et al., 2017, 2021). This research contributes to the scholarship and practice of rural wealth creation (e.g., Chen & Weber, 2012; Pender et al., 2012a, 2012b, 2014) and community capital development (e.g., Flora et al., 2005; Flora & Flora, 2008) by noting where and how rural communities leverage publicly available data sets in comparison to current theoretical and empirical understandings of how various indicators relate to one another and overall economic development.
In the following section we introduce contextual and theoretical frameworks that have underscored the development of rural economic development indicators over the last 20 years, including the rural wealth literature and the notion of rural capitals. We also provide a synthesis of the context of the larger academic and practitioner-based literatures that require understanding to make sense of the dynamics surrounding the creation and use of economic indicators in the policy literature. We then discuss our research strategy and study design before reviewing our findings drawn from a content analysis of regional economic development indicator reports undertaken on rural areas in the United States. The article closes by reflecting on the findings of our study and provides a discussion within the context of future policy development.
The Dynamics of Measuring Rural Economic Development
To assess the scope of resources that can contribute to the economic vitality of rural areas, The Comprehensive Rural Wealth Framework, a brief by the Rural Policy Research Institute (2017), identified seven distinct rural capitals: physical (built environment), financial, human, political, natural, social, and cultural. The balance of capitals and interplay across them needed to create rural wealth is a developing area of study (Schmit et al., 2020, 2021). Because of their abundance in natural capital, rural areas are often more dependent than urban areas on a single goods-producing industry, such as mining, farming, or manufacturing. As a result, rural economies are relatively fragile and subject to the vagaries of cyclical global markets for food, tourism, and housing construction. When such economic downturns occur, the temptation to convert idled farmland to urban development in these regions has been great.
In addition, a study by the American Farmland Trust estimated that two acres of U.S. farmland are lost every minute, much of it converted to low density housing (Sorensen et al., 2002). The result of farmland conversion can have long-lasting economic impacts. As the housing market recovered from the subprime mortgage crisis that led to the Great Recession from 2007 to 2009, small towns and rural communities continued to show vacancy rates that were roughly double that of metropolitan areas (Mallach, 2018). Such realities made poverty a perennial topic in the literature surrounding rural communities (Cromartie, 2017), while also highlighting how economic development strategies to address poverty can also develop a community out of its rurality.
Existing rural wealth literature seeks to understand how the change in wealth over time can contribute to the well-being of an individual or group. Pender et al. (2012a, 2012b, 2012c) explained that rural wealth is defined by the cumulative effects of income and expenditures (flows) in addition to the appreciation and growth of assets (stocks). Stocks, also described as “capital,” consist of “all assets [and the] net of liabilities that can contribute to the well-being of an individual or group” (Pender et al., 2014, p. 4) Stocks are different from the flows of goods and services into and from the community that may result from capital. Thus, stocks may be renewable (e.g., landscape views where flows result from agritourism) or nonrenewable (e.g., mineral deposits that can be depleted). In addition, not all stocks are directly marketable, although the flows of services from capital stocks may be marketable even if the capital itself is not (e.g., human capital). The differentiation between stocks and flows allows researchers to ask whether the flows into rural stocks of wealth are new wealth (e.g., building a cultural center) or a transfer from the sale or depletion of a stock (e.g., housing built over farmland that was generating agritourism for the area). The distinction between stocks and flows also allows researchers to interrogate who controls the stocks (e.g., land) and thus the flow of returns generated by the stock.
While related to the rural wealth literature, efforts to understand the dynamics of poverty and wealth creation, regional economic development efforts are generally different in their focus on politically feasible objectives and the extent to which input from community stakeholders is integrated. Constructing socioeconomic indicator sets has been adopted as a primary tool for tracking some of the complexities in economic development while benchmarking policy efficacy (Krieger et al., 1997). Primarily deployed in urban settings (Kitchin et al., 2015; Shen et al., 2011), these specific sets of indicators can help communities and regions monitor conditions by providing baseline data against which policy interventions and socioeconomic change can be measured. Trends in monitoring these indicators can help provide guidance in answering some basic questions such as: What are the primary challenges facing the region? How well is the economy functioning? Where are its key areas of growth? What is the quality of life in the region? Is it improving? What are the implications of current land use and resource policies on the future of the region? For example, the lack of high-paying job opportunities has often spurred youth out-migration (Carr & Kefalas, 2009). Could investments in high-speed Internet access generate education and white-collar work opportunities in rural communities (LaRose et al., 2007; Salemink et al., 2017)? While indicator series and reports do not definitively answer such questions, they help guide policy in a timely and informed manner. To distinguish between data needs and availability, the Rural Policy Research Institute (2017) used the telling headline in its landmark The Comprehensive Rural Wealth Framework to suggest that “we need to measure what we value, not value what we measure” (p. 1).
Historically, rural communities have been aided in these efforts by recent federal and state-level efforts to collect and make publicly available new data sets pertaining to the economy, populations, agriculture, and the environment. While the United States has conducted the federal population census since 1790 and the U.S. Department of Agriculture (USDA) has collected the agricultural census since the 1840s, both data sets are only available at the county level, except population information, which is available at the census-block level. Starting in 2012, the National Agricultural Statistics Service satellite imagery data of land-cover change has allowed analysis at 30-meter resolution. This scale allows urban and rural land uses to be disambiguated below the county level. The American Community Survey (ACS) is designed to provide communities with reliable and timely demographic, social, economic, and housing data each year. In 2005, it began providing data at the census-tract level, with some population information available at the census-block level (MacDonald, 2006).
Our research tracks the economic development conversation among rural economic development policy makers across the country and compares the measurement tools used by scholars with those used in the creation of regional rural economic development reports, generated in collaboration with policy makers and intended for public use.
Methods
We utilized a content analysis approach to examine available national and regional initiatives in rural wealth creation to address the central research questions of our study. Content analysis is a commonly used qualitative method that is employed to analyze a body of text. Through content analysis, elements of a body of texts are assessed empirically to establish and document specific characteristics and the relations among them. Based on a sequence of steps, content analysis allow researchers to meaningfully interpret content and make inferences about patterns within specific elements of a given text (D’Agostino & Visser, 2010).
First, we review national and regional initiatives in rural wealth creation, which generated a purposive data set of 17 regional reports aimed at setting and benchmarking policy. We then compare the variables and data sets used as indicators, the make-up of teams conducting the research, and policy outcomes. We outline the challenges faced by each rural community, the scope of each report in topic and geography, its timing, and how the report was commissioned, conducted, and leveraged. To compare community-based participatory research (CBPR) rural economic indicator series with recent scholarship assessing rural economic development, we note where each report series emphasized the capitals, revealing characteristics particular to the place, as well as social characteristics particular to the communities in each place.
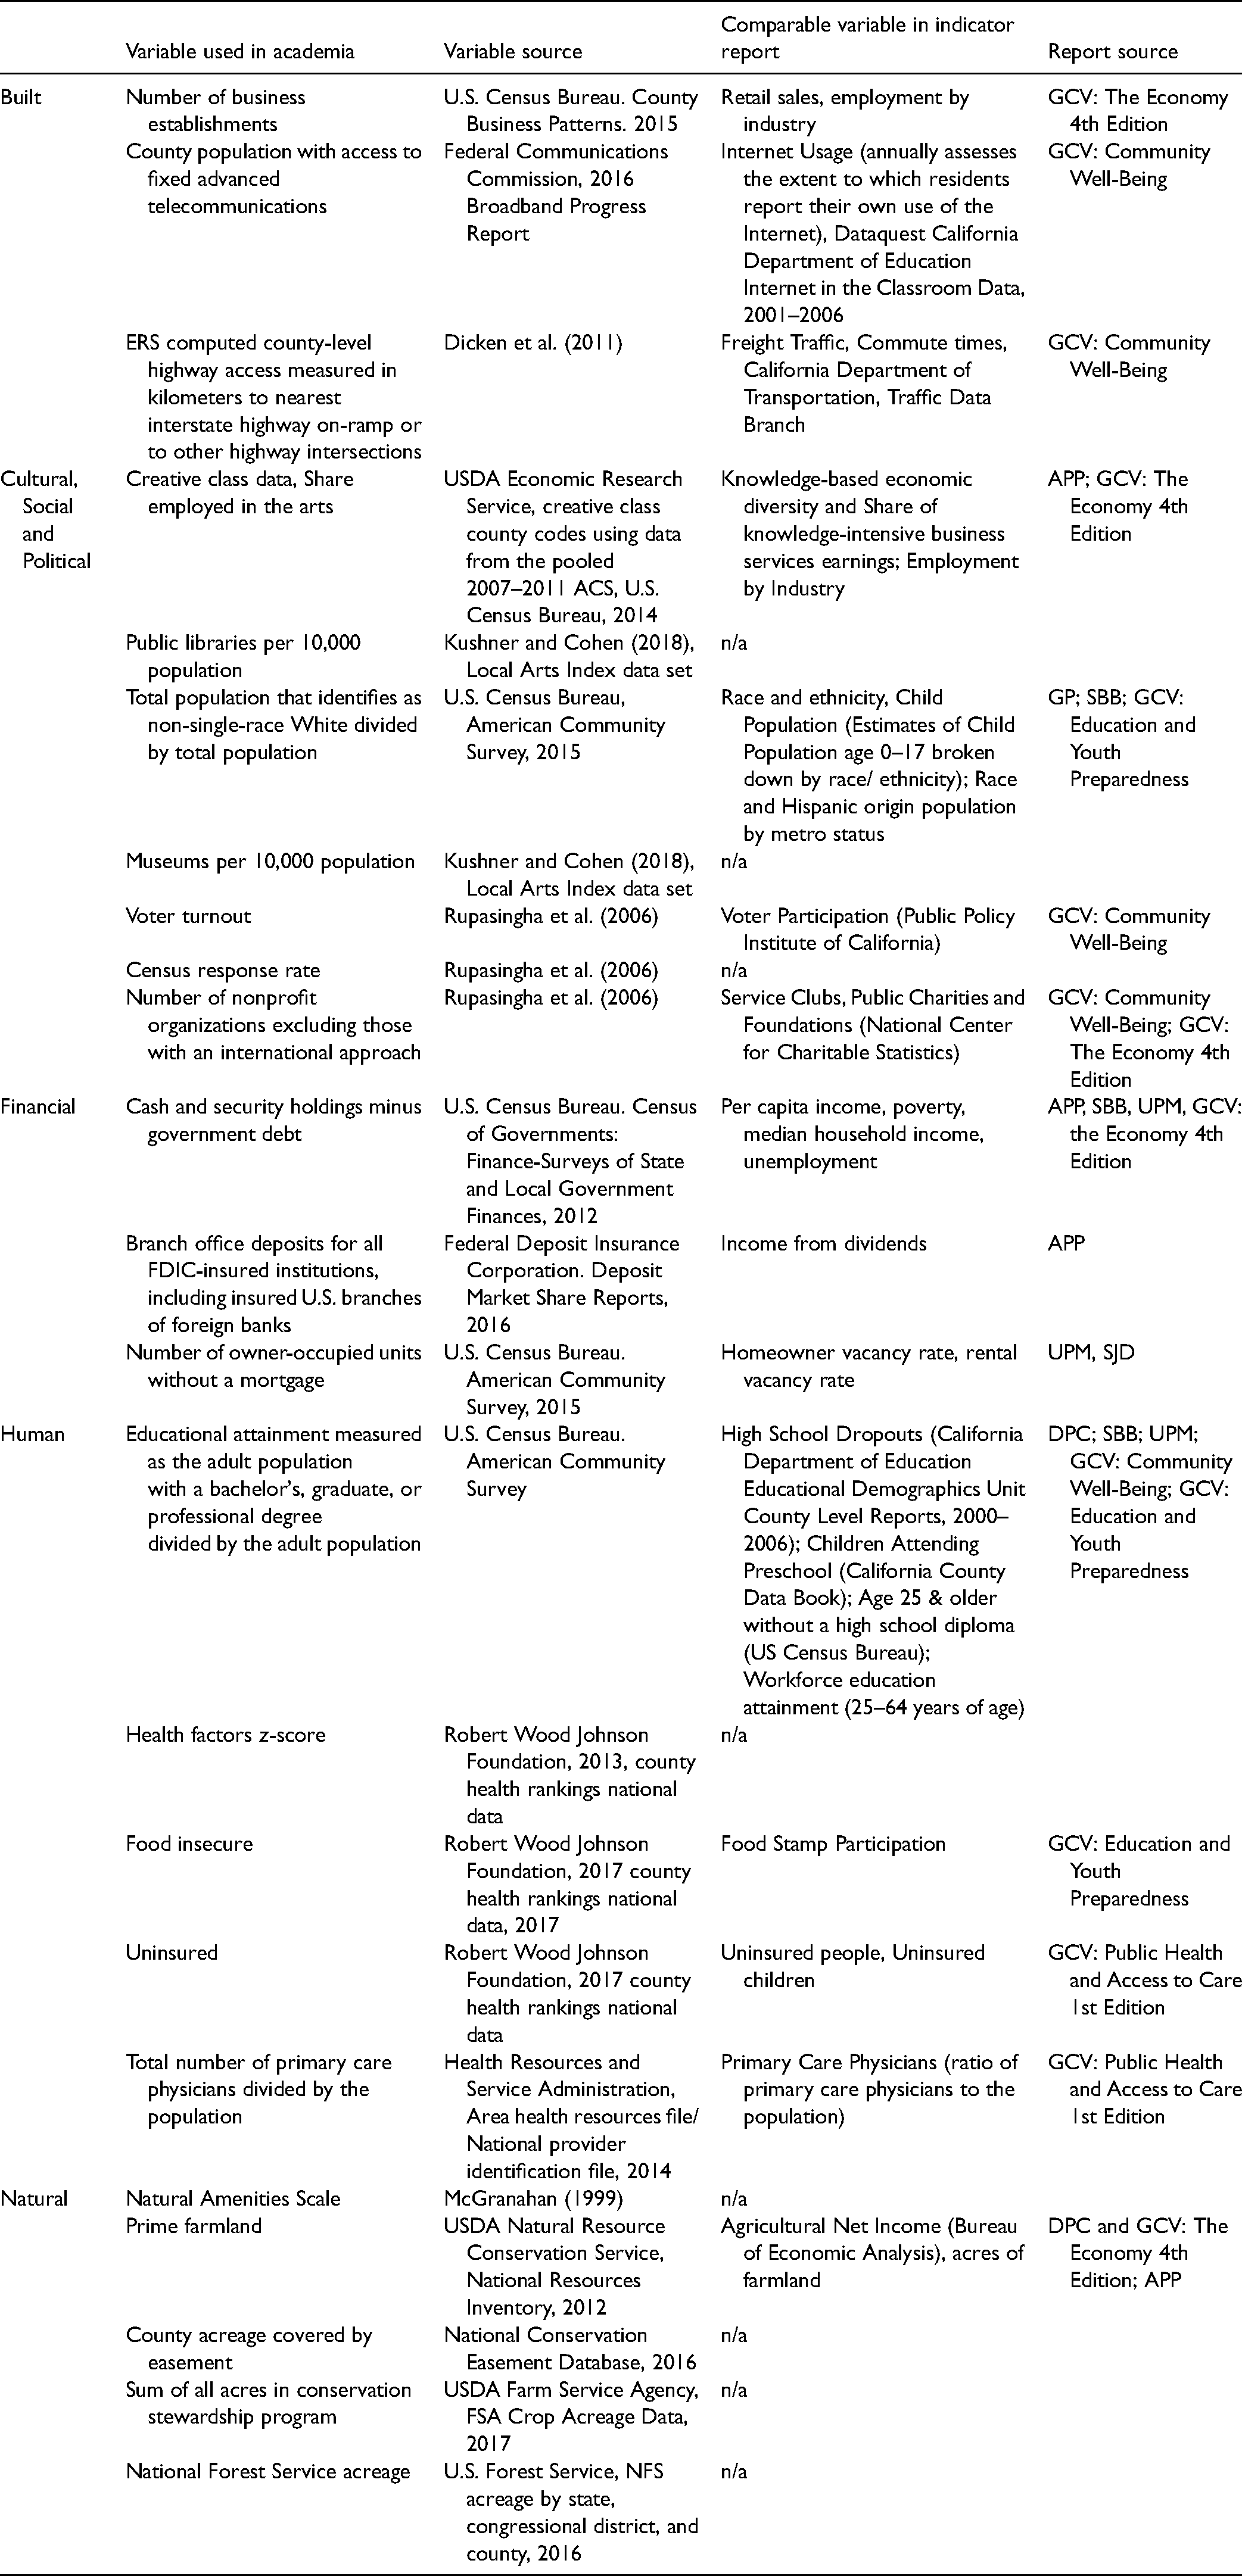
We compare the variables used in reports with an interdisciplinary literature review of county-level data on rural economic development produced by Schmit et al. (2020) with a variable list first appearing as presented in 2018 by Jablonski. We worked from the Jablonski (2018) preliminary list of variables as both of our research agendas and publications developed in tandem. Schmidt et al.'s review aimed to reinforce the inclusion of the seven capitals in assessing rural wealth, instead of focusing primarily on financial capital. The review is helpful in allowing us to cross-check where scholarly literature and policy-oriented report indictors expanded stocks beyond the financial capital to benchmark other capitals (e.g., human and built environment). In addition, Schmidt et al.'s review of the literature emphasized both flows and stocks of wealth across capitals and drew from the field to generate a national county-level database on rural wealth.
We use the inclusion or omission of data across both scholarly and regional report series to explore the gap in research and practice while acknowledging that the rural wealth literature is relatively new and rapidly evolving in its theory and empirical evidence. We note where novel data, particular to a region, are useful for a report but not available nationwide at the county level for replication. This information can help inform rural wealth scholars of the values and indicators that may be omitted in national assessment efforts. We also note where reports do not make use of data that are available, potentially indicating a lack of political interest in benchmarking policy change in that arena. In comparing indictors, we note where variables may differ, as well as where indicators are aimed at the same goal of assessing and/or measuring stocks or flows.
Review of Rural Indicator Series
Many rural indicator reports have traditionally dovetailed with federal initiatives to boost rural economic development. Congress established the Appalachian Regional Commission (ARC) in 1965 as a regional economic development agency tasked with responding to the high unemployment rate in the 13 states that make up Appalachia. Per capita incomes in the region were 20% below the national average, and one-third of Appalachians lived in chronic poverty. In 1975, Congress amended the ARC to require representation from the governor of each member state in addition to federal and local government representatives. The ARC has five goals, but the first is to “invest in entrepreneurial and business development strategies that strengthen Appalachia's economy” (Appalachian Regional Commission, n.d.). In 2002, the president of the National Association of Development Organizations, John L. Bruner, wrote in favor of ARC's progress to the U.S. House of Representatives, noting that in the 30 years since ARC was established, Appalachia had cut the poverty rate in half, doubled the percentage of adults with a high school education, and developed water, sanitation, and health facilities. A follow-up study noted that between 1969 and 1991, counties within the ARC grew 48% in income and 5% in population compared to control counties outside the ARC policy focus area (Isserman & Rephann, 1995). It is difficult to attribute these changes to the ARC alone, although the ability to form political coalitions across multiple states through the ARC did help lobby for federal funds and policy attention (Glaeser & Gottlieb, 2008).
The success of the ARC spurred the development of six other regional development commissions. The Denali Commission in Alaska formed in 1998 (Denali Commission, 2020). The Mississippi Delta Regional Authority (DRA) was established in 2000 to help economically distressed communities “leverage other federal and state programs which are focused on basic infrastructure development and transportation improvements, business development, and job training services” (Hayes, 2003). Pender and Reeder (2011, p. 1) found that every dollar spent through the DRA was associated with “an increase of $15 in the growth of annual personal income from 2002 to 2007, including an increase of $8 in annual earnings (primarily in the health care and social services sector) and an additional $5 in annual transfer (Government) payments (mainly due to increased medical transfer payments such as Medicare and Medicaid).” A follow-up study confirmed DRA-associated income gains and also noted decreases in unemployment, but with little impact on poverty or migration (Morin & Partridge, 2020). Building on these demonstrable successes, the Northern Great Plains Commission was formed in 2002. The 2008 Farm Bill established three more regional commissions: The Northern Border, Southeast Crescent, and Southwest Border. Not all federal initiatives have resulted in indicator-based reports.
In addition to these federal efforts, several regional rural communities across the nation formed their own nonprofit and regional government commissions. For example, private and corporate foundations funded the creation of the nonprofit Great Valley Center (GVC) in 1997 to advise economic development across 19 counties and 100 cities in California (Porter et al., 2005; Whiteside, 2007). The first report (GVC, 1999) to come from the center was conducted by the Public Policy Institute of California and reviewed by the Congressional Research Service (CRS) who noted that the poverty rate in the San Joaquin Valley in 2000 was higher than Appalachia, surpassing the benchmark for poverty in the United States (Cowan, 2005; see all GVC reports: 1999, 2000, 2002, 2003, 2004, 2005a, 2005b, 2006, 2008a, 2008b, 2009, 2011, 2014).
Rural Indicator Reports
In this next section, we review 17 reports from the six publicly available regional, rural economic indicator report series (Figure 1). The challenges faced by each rural community, the scope of the report, timing, and how the report was commissioned, conducted, and leveraged are outlined. As Figure 1 notes, there are many rural communities that have not yet formulated economic development indicators.
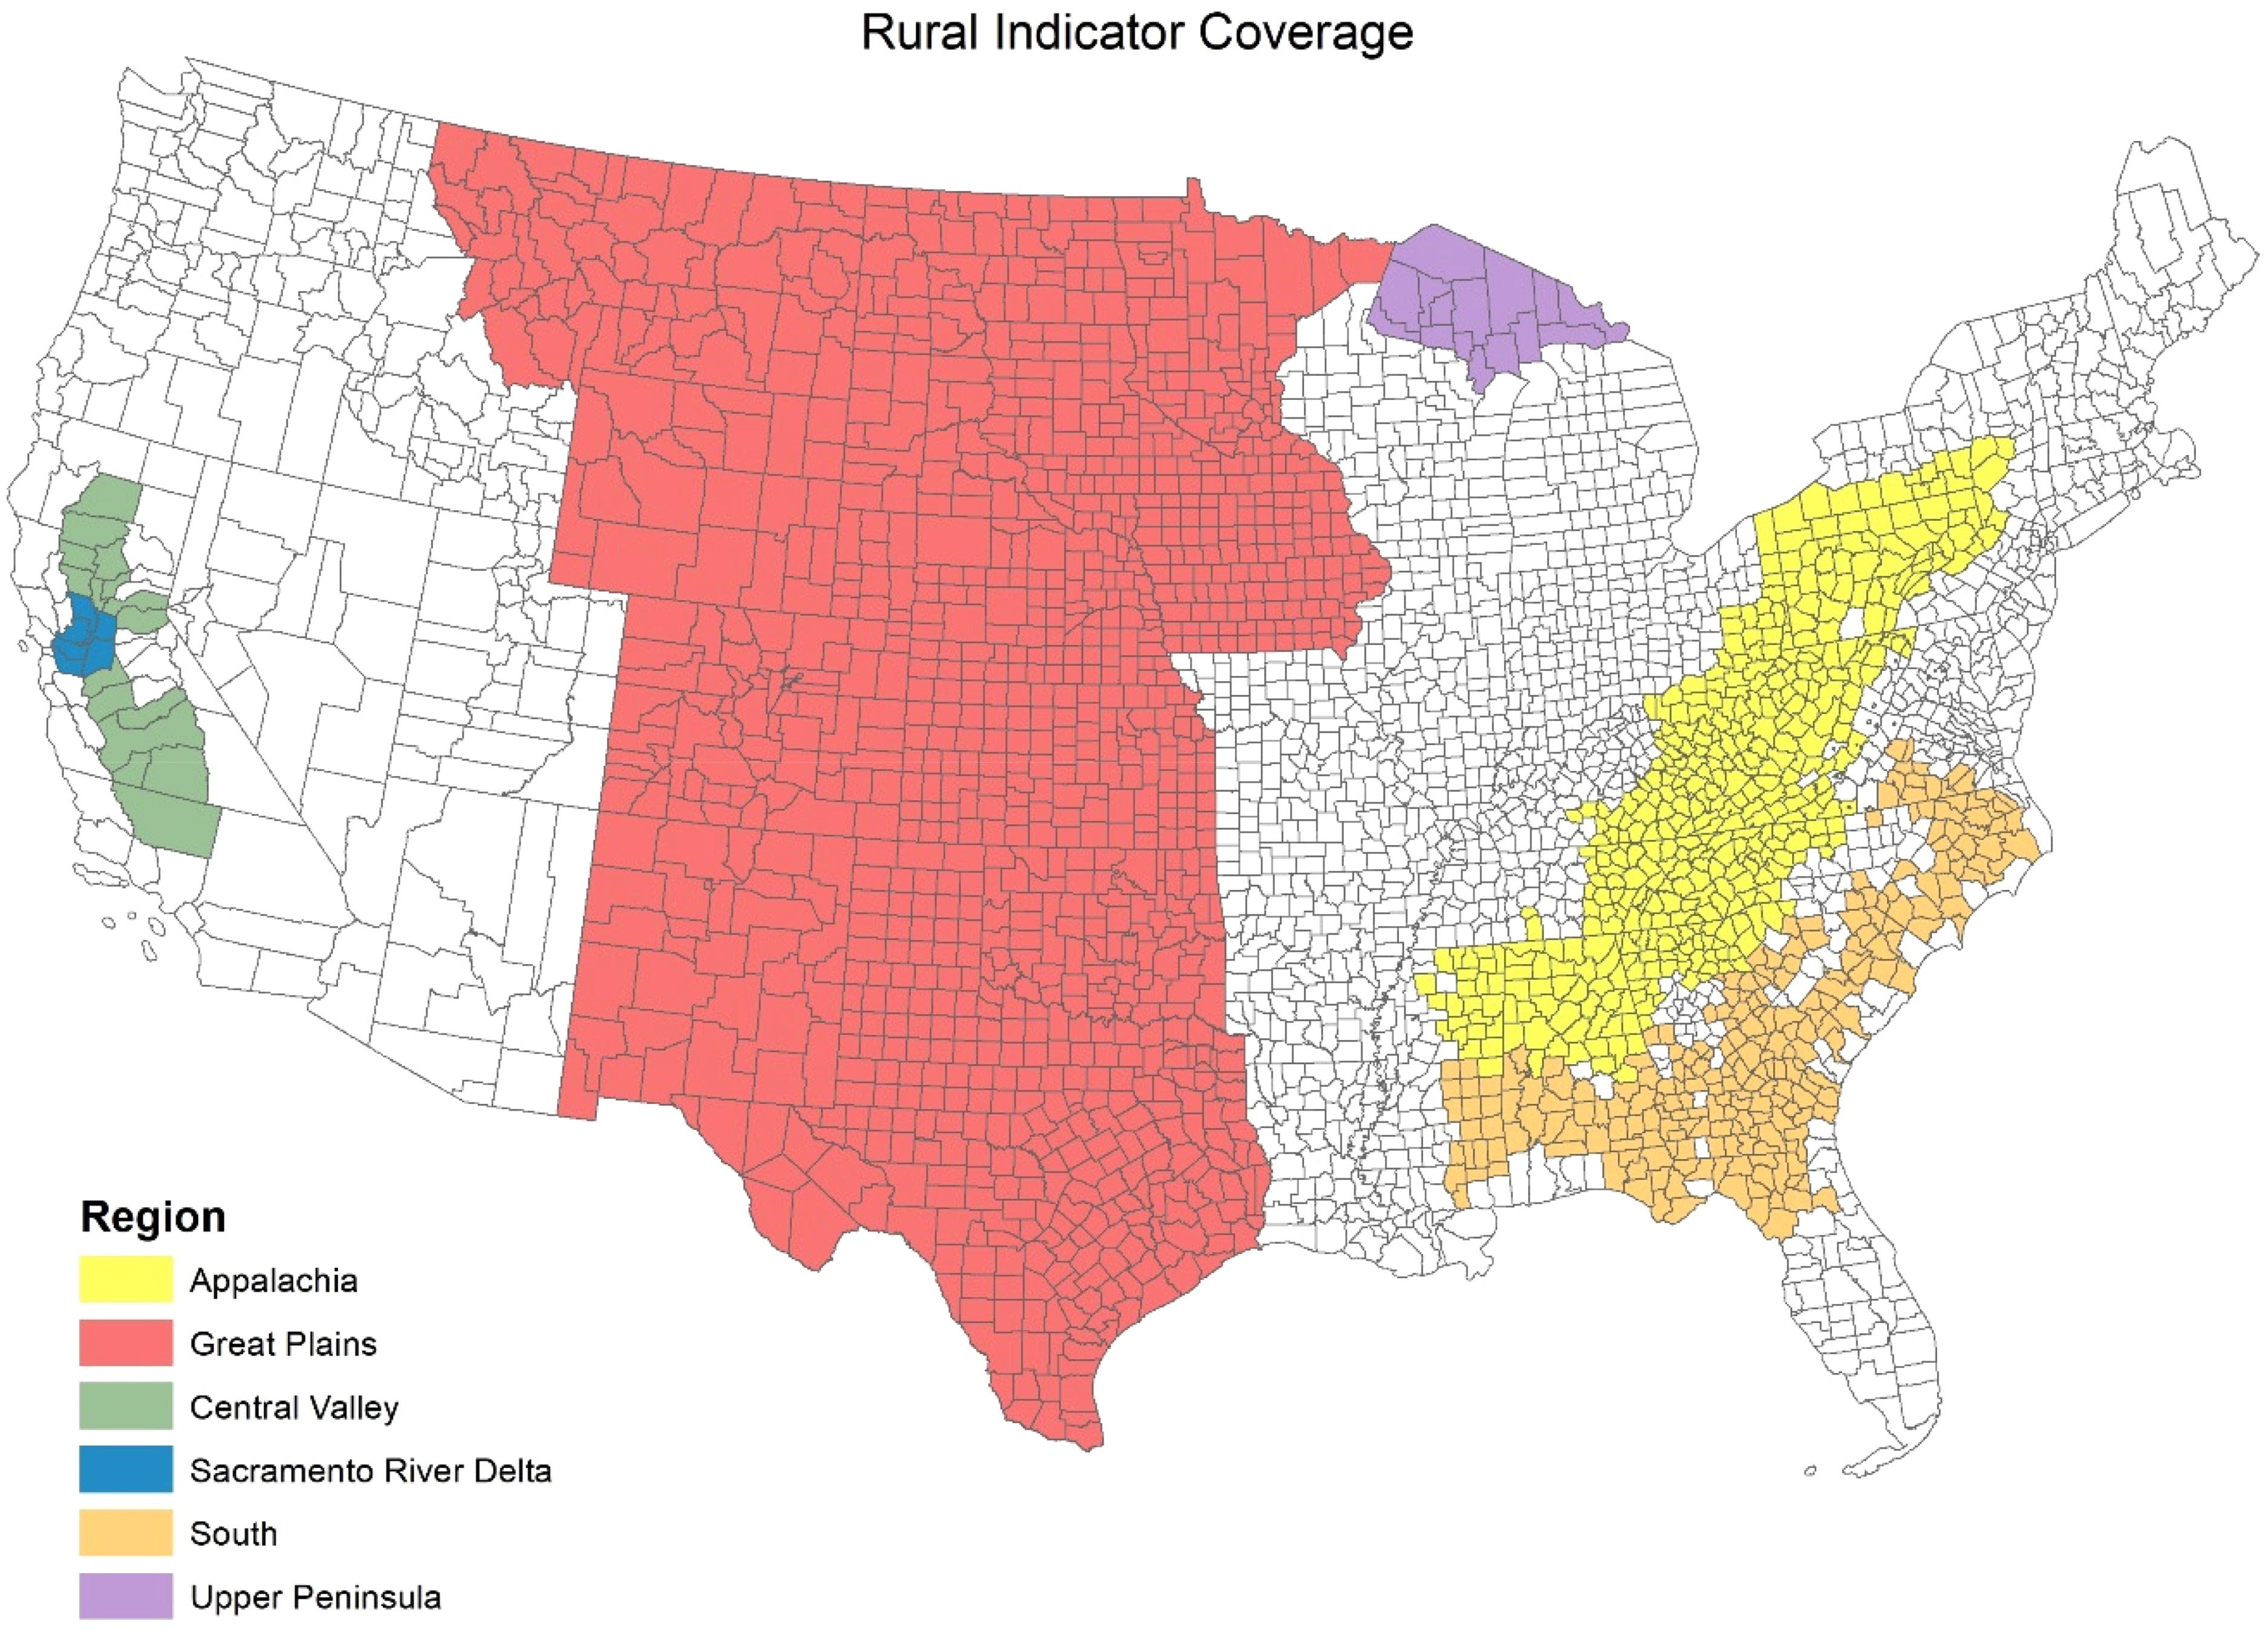
Coverage of rural indicator reports.
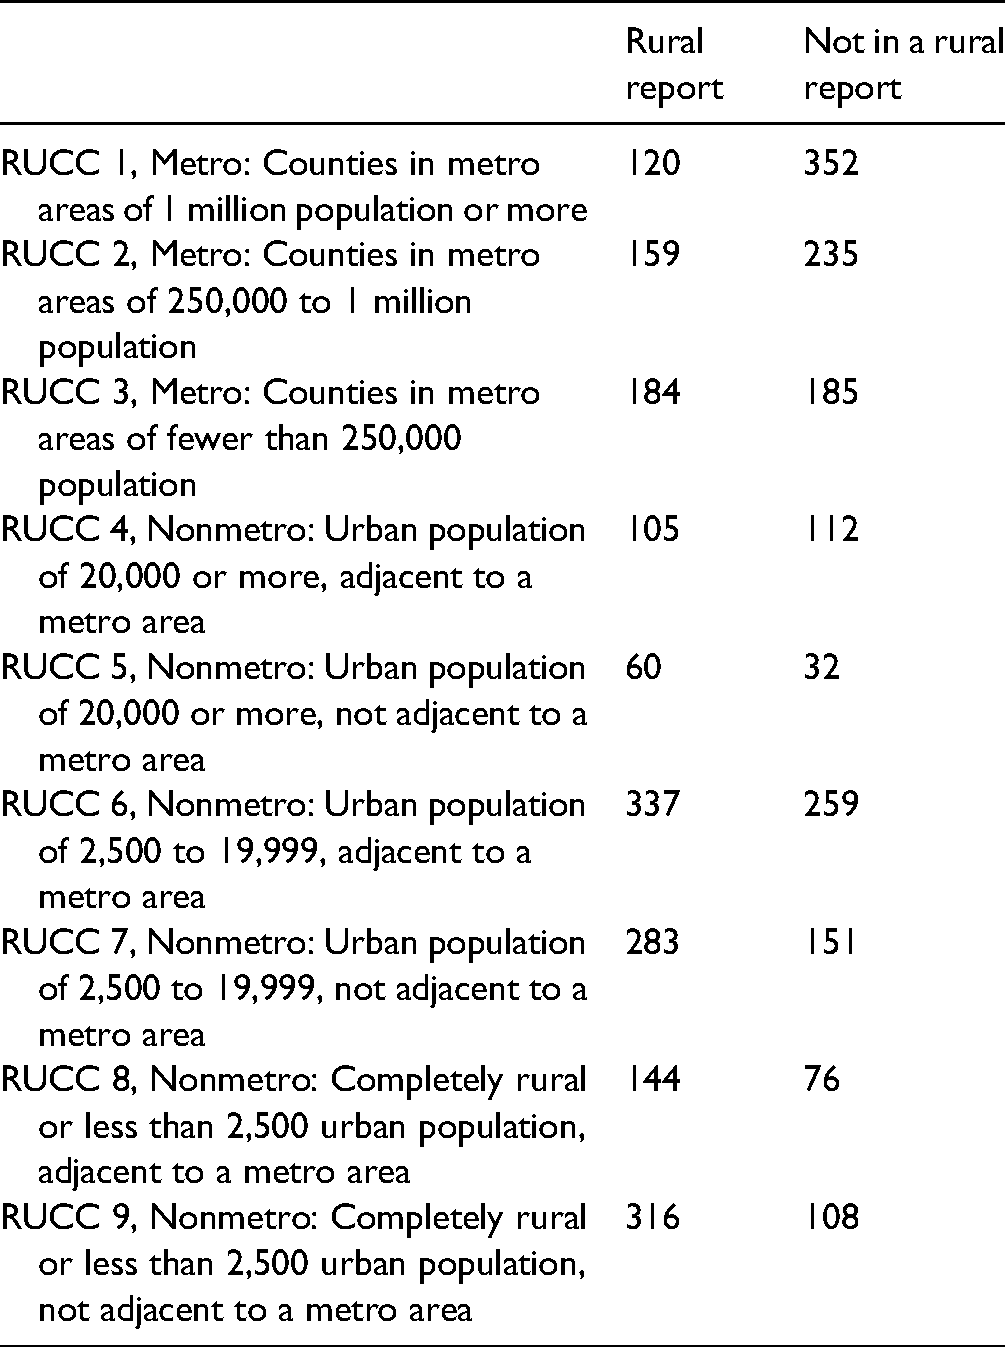
Nearly 40% of the counties that classify as nonurban (nonmetro) are not covered by a rural indicator series report, which means that nearly half of the rural communities and landscapes in the United States are not served by an indicator report series. Conversely, rural report series cover over 30% of the counties considered to be urban (metropolitan; Figure 1, Table 1). The spatiality shows that rural economic report series do not disambiguate between rural and nonrural areas or communities and that there is room to expand report coverage. The reports vary in scope, replicability, and time as discussed below.
Counties covered by rural report series. The Rural Urban Continuum Code (RUCC) is a federal measure of rurality in a county.
Central Valley of California (CVC)
While the CVC is not a target area for any specific federal program, it joins the other rural report areas in encompassing a large portion of America's persistently impoverished population (Johnson & Hayes, 2004). Some of the first and longest-running rural economic development indicator reports originated in the CVC under the nonprofit Great Valley Center's Indicator Report Series. Focused on one of the nation's, and the world's, most substantial agricultural economy, the report drew attention to the region's overlooked status in federal policy. The first report to come from the Great Valley Center noted a poverty rate that was higher than Appalachia, making the argument for targeted federal, state, and philanthropic efforts (Cowan, 2005), with corporate advisorship from Citibank, AT&T, and Comcast. The first report was issued in 1999, has been updated four times, and augmented by several affiliated reports on the environment, community well-being, public health, and education. Later reports targeted policy efforts and fundraising initiatives centered on youth, air quality, access to health care, and renewable energy, with broad references in state and federal policy planning documents. In 2010, the Great Valley Center became a subchapter of a regional nonprofit, the American Leadership Forum, and created a branch within the University of California, Merced. The last report was issued in 2014.
Southern Black Belt (SBB)
The earliest regional rural economic development reports originated in the SBB. In partnership with the Southern Rural Development Center at Mississippi State University and supported by funding from the USDA Extension Service, the first SBB analysis covered 623 counties across 11 states (Wimberley & Morris, 1996, 1997; Wimberley et al., 2014). The focus of this report was racial disparity, building from W.E.B Dubois and Booker T. Washington's framing of the region and compared SBB counties with a population of 30% or more identifying as Black with nonmetro SBB counties.
As a follow up, scholars at the Tuskegee University and the University of Georgia-Athens (UGA) founded the Black Belt Initiative, a coalition of community-based organizations, land-based organizations, local government agencies, and businesses who wanted to address chronic poverty and its consequences within the SBB (Harris & Hyden, 2017). The Black Belt report from 2002 (Carl Vinson Institute of Government, 2002) was commissioned as part of a federal initiative to expand the success of the ARC program to the Southeast with the political support of then Senator Zell Miller of Georgia. He stipulated that “poverty – not race be the guiding principle…” (Harris, 2013, p. 11).
Both studies covered 242 counties across seven states. The UGA report did not focus on agriculture but noted that each state covered in the report had respectively achieved “successes” in reducing rural poverty “based largely on the strengths and assets of certain individuals and families” (Carl Vinson Institute of Government, 2002, p. 1). The Tuskegee report centered on community voices and food systems and urged a regional framework for asset management and redirection of flows toward building rural wealth (SOFSEC, 2003).
Recommendations from the research carried out by the University of Georgia were translated into legislation by Senator Zell Miller (S.527 - 108th Congress [2003–2004]) and Congressman Mike McIntyre of North Carolina (H.R.3618 - 107th Congress (2001–2002]) who called for the establishment of a regional commission very similar to the ARC, where Governors, representatives from the business community, academia, and others are the major decision makers and the majority of funding is allocated to infrastructure development. On the other hand, recommendations from the Tuskegee-led research prompted legislation by Congressman Artur Davis, 7th District, Alabama (H.R.678 - 108th Congress [2003–2004]) for the 2003 Southern Empowerment and Economic Development Bill (SEED) to create the Delta Black Belt Regional Authority (DBRA) with coverage for persistently poor counties in the Black Belt and Delta. SEED contained provisions to create a Community Constituency Board, made up of residents of distressed communities and authorized with discretionary power to allocate 20% of DBRA funds. In addition, funding for infrastructure development was capped at 25%. As a result of the reports, the Southeast Crescent Regional Commission was ultimately founded in 2008, but federal funding has not yet been appropriated.
Appalachia
Though the Appalachia region has been the focus of federal regional governance efforts the longest, it has only recently begun to publicly report rural economic development trends. The Appalachia region 2014 report (Feser et al., 2014), Economic Diversity in Appalachia, included 2010 through 2014 ACS and census data covering 420 counties (Feser et al., 2014). The report was compiled under a contract with researchers at the Population Reference Bureau and University of Illinois at Urbana-Champaign's Regional Economics Applications Laboratory. The report did not focus on agriculture but urged town and county economic developers to promote economic diversification to help insulate the regional economy from economic shocks (e.g., the loss of tourism during an economic downturn). The report combined census data with qualitative survey information to build case studies on how to diversify from “mines and mills” to a more resilient economy (Feser et al., 2014).
Great Plains (GP)
Initiated and sponsored by North Dakota Senator Byron Dorgan, the GP report was initially university-led (Rathge et al., 2001). The goal of the report was to engage communities, raise national awareness, and foster a corresponding policy debate. The 2001 report used Small Area Income and Poverty Estimates data because the 2000 census was not yet available (Table 1). The report reviewed 12 states stretching from Montana and Minnesota in the north to Texas in the south. This report played a role in establishing the Northern Great Plains Commission a year later, but no further indicator series have resulted from this effort.
Upper Peninsula of Michigan (UPM)
The 2014 UPM report was prepared by Michigan State University with collaborators from the Lake Superior Community Partnership and the Upper Peninsula Collaborative Development Council (James-Mesloh, 2014). Feedback on report findings was gathered from representatives of each of the 15 counties covered in the report. The UPM contains only 3% of the state's population, but one-third of its land. Much of the area covered by the report consisted of publicly owned forest land. Declining steel and mining businesses have given more prominence to tourism and health care facilities. The report was assembled as part of a course project, and students were heavily involved in gathering and presenting data. The goal of the report was to help counties pool resources to develop marketing strategies for “customiz[ing] business attraction marketing collaterals” so that the region could “compete in the global marketplace” by attracting new firms that fit local preference for development and economic diversification (James-Mesloh, 2014, p. 6).
California's Upper San Joaquin Delta (SJD)
The 2019 report for the Delta Protection Commission was generated through an iterative process that involved community and stakeholder meetings to shape which data would be used and how to best interpret policy (Visser et al., 2019). Unlike the above reports, the SJD does not neatly follow county jurisdictional boundaries and includes parts of six counties. Its unique geography and location at the headwaters of most of California's water supply, a proposed megaproject to build water tunnels, and epicenter of the surrounding urban growth from Sacramento and the Bay Area prompted the report series. Census-tract-level data were used along with satellite imagery of land coverage for agricultural and urban development. The goal of the report was to provide trends in development, farmland loss, and educational attainment to inform future policy efforts focused on improving school quality, limiting development in the agricultural zone, and building policy supports for low-income families. The report did not focus on environmental indicators.
In summary, all reports were created by academic researchers with input from policy makers and community stakeholders. University partnerships continue to play a role in report longevity. For example, the Southern Black Belt reports were hosted by the University of Georgia. Most reports covered county-level indicators despite availability of higher resolution data since the advent of the ACS. One report, from the Upper Peninsula of Michigan (James-Mesloh, 2014), broke out township data. The San Joaquin Delta used census-tract and 30-meter resolution land-use data. In all but one case, that of the Central Valley of California, the indicator reports were single- or first-time reports that have not been replicated. In part, this can be attributed to over half of the report series being initiated in the last 5 years.
Findings: Indicator Categories and Uses
Our review of the report series as they relate to rural wealth frameworks seeks to help practitioners make connections between the rationale for indicator use and scholarly knowledge and practice, as well as to identify where gaps between these two elements may exist. We begin the review of our results by providing a description of indicators for each of the capitals identified in the rural wealth literature along with the rationale for their use in policy reports. In every case, the report series used retrospective data to analyze prior trends with the intention of influencing future policies. In addition, none of the reports framed their analysis in terms of stocks and flows of capital.
Human
The comparative table of academic-recommended variables and those used in practice for human variables offer important distinctions. As shown in Table 2, population characteristics by age and race are common in both academic literature on rural wealth and reports. This set of indicators gives a snapshot of population composition, allowing communities to examine what portion of the population is of working age, the size of the aging community, and how many young people are being raised in the region. Population data are reported in all six indicator reports and help to gauge public funding opportunities and qualifications.
Data used in rural economic reports and scholarship on wealth creation across the capitals -- physical (built environment), financial, human, political, natural, social (intellectual), and cultural report series are noted by the following abbreviations: Great Central Valley (GCV), Appalachia (APP), Southeastern Black Belt (SBB), Upper Peninsula of Michigan (UPM), Great Plains (GP), San Joaquin Delta (SJD).
Education
The greatest attention across the universe of reports included in the analysis is given to education and other human capital categories. Four of the six regional reporting efforts focused on education. Education has exerted multigenerational effects on human capital (Cutler & Lleras-Muney, 2006; Egerter et al., 2009). Across multiple studies, the average economic return to an individual for one additional year of education in the United States is 10% (Colclough et al., 2009; Currie & Thomas, 2001; Psacharopoulos & Patrinos, 2004).
Understanding how education variables correlate with creating and sustaining human capital is important, and data trends can also help communities anticipate land-use changes in housing demand as well as argue for increased state and federal financial support for public education. For example, levels of school district poverty are important indicators of socioeconomic opportunity and educational access in a region. School districts with a higher number of low-income students are eligible to receive increased federal funding that provides for added educational and well-being needs of students. Tracking levels of school district poverty over the long term can help inform educational policy planning and initiatives necessary to support changing economic conditions that may affect the education of young people in the region. The cost-adjusted revenues per pupil are a measure of school district funding available in an area, allowing an understanding of how much a school district has available to spend on necessary resources. The revenues per pupil can also shed light on local economic conditions since well-funded, high-quality schools often buttress robust real estate markets as homeowners often value high-quality school districts. The theoretical mechanism behind the school-related capitalization effect is often credited to Tiebout (1956), who suggested that each “consumer-voter” sorts across neighborhoods to satisfy preferences for public goods. In turn, high-quality public schools offer an anchor effect (Vincent, 2006). Locations that have poor amenities struggle to attract high-income residents. An understanding of changing trends helps predict public budgets in relation to school funding, equity in housing markets, and access to high-quality public schools (Visser, 2018a).
Where reports focused on elementary and high school educational attainment, the academic literature was focused on college degree attainment. In effect, the academic literature drew attention to places that had rural wealth or did not, while the reports created with communities often focused on policies to cultivate wealth where it did not already exist in the human capital category. Moreover, the quality of rural schools is seen as a draw for middle- to high-income families and attending housing development, especially when compared to options in nearby urban areas. This education-housing nexus topic points to long-term development pathways.
Health
Both reports and academic literature feature a series of human health variables. The Health Factor z score measures how a county compares to other counties in the state. For example, if a county has a z score of 1.2, that means the county is 1.2 standard deviations above the state average of counties for that measure. This variable does not easily translate without added explanation and perhaps this is why it has not been used in reports.
Similarly, the food insecurity variable provided by the Robert Wood Johnson Foundation is based on spatial proximity to a supermarket, where rural places that are more than 10 miles from a supermarket would be considered a food desert. Over 95% of the food deserts in this country are in rural areas and access to supermarkets does not appear to be a good indicator of diet-related health (Brinkley et al., 2017). Instead, the report series focused on SNAP redemption, a variable which had better correlates with health outcomes (Wolf-Powers, 2017).
The State of the Great Central Valley of California: Public Health and Access to Care report includes variables ranging from childhood immunization rates to mental health and chronic disease. The State of the Great Central Valley of California: Education and Youth Preparedness (2004, 2008a) tracks teen pregnancy and juvenile drug- and alcohol-related incidences. Given the correlates of youth out-migration with rural wealth creation, a focus on youth is predominant throughout all reports, though not as evident in academic literature on rural wealth creation.
Cultural and Sociopolitical
While both the set of indicator reports and academic literature focused on race, the academic literature has also historically emphasized growth through creative class mechanisms (e.g., McGranahan & Wojan, 2007). The term creative class has been criticized as code language for attracting and retaining a middle-class White population (Wilson & Keil, 2008). Wilson and Keil argued that low-income minority populations are more creative and should be the focus of wealth creation in rural and urban settings alike. Indeed, the report series reviewed in our database focus more on low-income and minority populations (e.g., the Great Valley indicator series focuses on Latinx populations while the Black Belt report is explicitly focused on Black communities and poverty).
To this end, the State of the Great Central Valley of California: Community Well-Being (2005) measures ethnic media, noting that it dominates in the South San Joaquin Valley. The same report notes representation in elected office, another important indicator for how culture is translated into social and political capital. Other indicators that could be used are languages spoken in public schools, courts, and hospitals. Enrollment characteristics reveal the student body population, race/ethnic diversity, and languages spoken. This information can help local governments understand how to conduct outreach and build on cultural capital by providing outreach material and services that can be accessed in multiple relevant languages.
In addition, the number and type of community organizations represent the support services for the community as well as cultural capital in the built environment. Academic literature counted physical structures, but the reports did not. One explanation is that for rural communities, civic organizations may not be housed in physical buildings that act as anchor institutions but may gather in parks or private homes and churches.
Nonetheless, anchor institutions are often the hub for public events and provide important services, such as health, fire, education, and free public Wi-Fi (Melendez et al., 2015). Data for community anchor institutions are compiled annually by the Federal Communications Commission and capture all schools, libraries, health institutions, and public safety facilities. The Federal Communications Commission has a statutory obligation to ensure that schools, libraries, and health care providers have access to advanced telecommunications and information services. High-speed Internet broadband and fiber are often laid to libraries and schools before connections can be made to residential and commercial buildings. While broadband is considered infrastructure, this asset is tied to cultural capital. Further, there are often federal and state grants to assist in the building and/or upgrading of broadband infrastructure in areas that are not served or are underserved by existing broadband providers. While the current suite of reports omitted broadband access, we anticipate that future work will consider high-speed Internet a high-priority policy area that can make use of new data sets, such as the Digital Divide Index (2019). Access to high-speed Internet is attractive to many businesses and plays an important role in a competitive and diverse economy. High-speed Internet allows workers to telecommute and enables school-age children to complete homework projects at home.
Built Environment
The built environment is measured by transportation (roads or freight traffic), broadband access and use, and number of businesses. Missing from both reports and academic literature is a focus on energy infrastructure. This omission is curious given the historic struggle in rural electrification (Pellegrini & Tasciotti, 2013) as well as recent efforts to decarbonize and upgrade energy infrastructure to withstand extreme weather events.
Missing from the academic literature, except distance to highway intersections, are measures of how the remoteness or spatiality of infrastructure impacts socioeconomics. One might suppose that remoteness is a given in rural areas. Yet, report series frequently capture such data. For example, The State of the Great Central Valley of California: The Economy focused on travel time to Central Valley locations by air and commuting as important to rural wealth creation. How long it takes individuals to get to work affects workers’ ability to secure employment. Living in more rural counties is often identified as a difficult and contributing factor to higher unemployment rates due to long commute times. Data on commute times combined with road conditions and government spending on infrastructure can help local governments lobby for funding from state and federal agencies to support infrastructure repair.
In another contrast to the academic literature, indicator report series tended to focus more on the diversity of employment options. For example, The State of the Great Central Valley of California: The Economy tracked employment changes by industry. Similarly, the Economic Diversity in Appalachia (Feser et al., 2014) report focused on a variety of metrics intended to capture not only how total values (jobs, number of establishments, unemployment) go up or down, but diversity in job opportunities. Here, scholarly literature could include diversity as an important component of resilience in addition to the framework of capitals, stocks, and flows. Frameworks for thinking about economic sustainability include the amount, diversity, and spatial proximity of jobs as important factors (Bertolini et al., 2005). Empirical evidence on the importance of job diversity in rural economies is only recently emerging with strong evidence to show that diversity positively impacts job opportunity (Cheng & Bertolini, 2013).
Another difference between the rural wealth literature and the policy reports reviewed for this study are that the policy reports focused on future plans for development by exploring permits (in contrast to focusing on already existing built environment features). Residential building permits are featured in The State of the Great Central Valley of California: The Economy and the time for building permit approval is an indicator featured in the Upper Peninsula Economic Development report (James-Mesloh, 2014). Building permits for residential housing offer an accurate predictor of new housing units and how they relate to zoning regulations. Permit data can be further used to understand and identify business cycle patterns and can offer information on wider trends in the economy. Construction can also be a large source of income and jobs.
Most strikingly, the reports focus more on housing than the scholarly literature. Median housing unit value allows for an understanding of housing affordability in a region. Home values are an important factor in influencing household wealth (Graves et al., 2019). Using the median housing unit value may be a better indicator of home prices than using per capita over average figures since it is less influenced by outliers (such as a few very expensive or very inexpensive homes). Knowing how many housing units are occupied by the owner versus by a renter can indicate the health and stability of the housing market and recovery from a recession. It can also provide a means to track the extent to which regional housing markets move from renter to owner-occupied markets. Vacancy rates are important for determining the overall health of a housing market. The average vacancy rate nationwide for rentals is 7% (ACS, 2014-2019). Vacancy rates above this benchmark indicate that potential renters have greater access to a presumably more affordable market; rates below the national average indicate that landlords have greater assurance that properties will rent. Overcrowded housing units can also be a sign of a difficult housing market. Crowded housing is also thought to affect economic and health outcomes for children (Evans, 2004).
Financial
Median household income is an indicator of a region's standard of living. It is less influenced by outliers (like small, very wealthy populations) than per capita income (an average). As such, median household income is a useful measure of regional prosperity. Earnings differ from household income because they do not include income from assets and transfer payments. In addition, earnings do not include dividends and interest, while income does. Importantly, in rural wealth literature, earnings is a flow variable, compared to savings, which would be considered an asset or stock.
Unemployment rates are one of the most common ways to measure the economic health of a region for both scholars and report creators. High unemployment means that there is saturation in the labor market - that there are more workers seeking work than there are jobs available. High unemployment rates can also generate competition for existing jobs and lead to lower overall wages in a region. At the individual level, unemployment can affect household earnings that can have spillover effects into the community and impact the larger economy as a whole. To note, low unemployment rates can also be observed in some of the most economically depressed counties because many working-age individuals have left for more prosperous regions and others have given up looking for work. Labor force participation rate may be a better indicator because it can be triangulated with other measures of poverty (e.g., SNAP redemption).
Measuring the level of inequality in a labor market is important to tracking economic opportunity and inequality in local economies. Higher levels of inequality are associated with poorer socioeconomic outcomes and lower levels of well-being in regional economies (Melendez et al., 2015; Visser, 2018b). Higher levels of wage inequality are also an indicator of wage polarization in the labor market, which has been linked to the decline of middle-wage and middle-skill jobs, and lower job quality in local economies that can hinder economic mobility (Visser & Melendez, 2015; Visser, 2018b). As large racial and ethnic wage gaps remain in the labor market, identifying wage differences between race and ethnicity is important to determine levels of inequality in a region.
While the rural wealth literature emphasizes stocks and government spending (e.g., government debt, Table 2), the report series focus more on the flows as measured and triangulated by median household income and median earnings. In addition, the report series focus on commercial sectors. The Upper Peninsula report (James-Mesloh, 2014) tracked corporate income tax and the Central Valley tracked retail sales taxes (GCV, 2014). These indicators also show inflows for government spending, but relate back to business viability and consumer base, including the inflow of funding from tourism.
Natural
Rural communities face many unique challenges that set them apart from urban communities. For example, farms are implicated in multiple environmental, social, and economic challenges, and funding opportunities. Economically, farms must compete with not only climate and pest risks to crops, but also market fluctuations for product purchasing, and, more importantly, the pressure to convert from farmland to higher-value urban development (Brinkley, 2012; Daniels & Bowers, 1997). Social challenges associated with the agricultural sector include fair-wage and worker safety concerns (Gottlieb & Joshi, 2010).
While the academic literature does focus on natural amenities and landscapes (forest, preserved farmland), it does not delve as deeply as the reports. Reports highlight not only the landscapes, but also the life on them and the quality of environmental factors. For example, air pollution is an environmental indicator in the Upper Peninsula of Michigan report (James-Mesloh, 2014) as well as the Central Valley Report, which used six metrics to measure air quality (2000, 2005b, 2011). The State of the Great Central Valley of California: The Environment reports (2000, 2005b, 2011) also includes three water-quality measures, four land-quality measures, and four species and habitat measures, including waterfowl counts. These variables are further augmented by the inclusion of tourism data such as hunting, fishing licences (e.g., San Joaquin Delta report: Visser et al., 2019) and transient occupancy taxes and travel spending (e.g., Great Central Valley, 2000, 2005a, 2005b, 2011). In comparison, Pender et al. (2012a, 2012b, 2012c) included indicators of land, air, and water quality in addition to recreational facilities.
Tracking the dynamics of specific crops by land coverage can help predict which crop services and supporting industries will be needed in future years based on the existing agricultural base. Such information can help identify necessary areas for environmental protection, water planning, crop insurance, and agricultural economic supports through processing and marketing infrastructure. In addition, loss of farming and ranching and wildlands to development indicates social and economic change that may present significant challenges to the region. While the academic capitals do not specifically track commodities, acreage, or farm income, these are primary concerns for the reports. The Great Central Valley series (2000, 2005b, 2011) focused on the value of agricultural production, output ranking nationally, and farm wages. Similarly, the Appalachia report (Feser et al., 2014) also tracked farm income.
Best Practice Approaches
Scholarly theory building and empirical research on rural wealth draws from similar data sets and has used the notion of high indicator reliability as grounds for generating best practices to guide policy making. To benchmark progress, reports generally selected publicly available data collected yearly or every 5 years, allowing for timely, dependable statistical measurement at regular intervals. Further, though reports compared regions to the state and nation, more spatially specific data can allow comparison to similar regions of interest for added context and policy ideas, just as comparative studies of regional planning efforts have utilized paired county approaches (e.g., Isserman & Rephann, 1995). Reports often made the case for policy focused on their region on the basis of poverty rates and chronicity. As scholars assemble and assess longitudinal data on the interaction of flows, stocks, and capitals, noting regions of persistent or heightened poverty will help motivate policy focus. Both scholarly work and reports use a combination of multiple data points to triangulate and benchmark progress, and there is not a formula for how to combine, include, or omit data, indicating the complexities of policy formation and uniqueness of regional assessment approaches. Despite the lack of a one-size-fits-all approach in which data sets to use, we found broad agreement on the types of data, triangulation of data, and spread across capitals framework.
Noting the differences, similarities, and omissions in both scholarly and practical approaches can also help translate findings between research and practice. Conceptually, the reports profiled here focused more on diversity and flows rather than stocks, an important difference in how rural wealth creation is conceptualized and measured by the research community. This choice to focus on flows rather than stocks in reports could be because the reports help demonstrate indicators that are easy to communicate in concept, value, and importance to the region. Further work will need to tease out why capital flows are preferred over capital stocks and will likely require a consideration of the rationale that informed the design and commissioning of such reports.
Discussion
Our analysis highlights the reality that economic development indicators operate at the intersection of policy and practice. Taken together the findings help provide a framework for how scholars think of building rural wealth (stocks, flows, capitals), a history of practical efforts to address rural economic development and assess wealth, and a suite of data options used in both scholarship and practice. In doing so, we have identified and explored the gaps, overlap, and disagreement across the developing fields of scholarly inquiries into rural wealth creation and the practitioner-led, community-based efforts to assess and address rural wealth. We find that while scholarship on rural wealth seeks to influence practice, it does not appear to be currently couched in the context nor language of practice. Similarly, it should be noted that rural wealth scholarship is evolving, and many of the reports predate studies. For example, the Great Valley Center's 1999 report predated most published academic work. As a result, report series are not explicitly framed around capitals nor distinctions between stocks and flows. CBPR-generated reports do, however, draw some from early rural wealth frameworks, for example, separating place-based characteristics from people-based characteristics.
Given the recent nature of the rural wealth creation framework and reports on rural wealth, as well as the diversity of views on what constitutes rural (Schaeffer et al., 2013) and the multitude of differences across rural communities, it is not surprising that our analysis finds that practice and scholarship are not neatly aligned. Another meaningful rationale for the mismatch in scholarly literature and practitioner-based reports could be the complexities of policy formation as well as conceptualizations of policy levers. For example, indicator report series did not focus on built capital directly, but indirectly. The Appalachia report (Feser et al., 2014) focused on the share of knowledge-intensive business services earnings, but not specifically on the share of employment devoted to the arts or creative class nor the business establishments themselves (Table 2). Scholarly literature and report series use different language and data to contextualize the problem and solution. While the objective of diversifying the economy is a topic in the Upper Peninsula of Michigan (James-Mesloh, 2014) and Appalachia reports (Feser et al., 2014), the framework of diversity was less prevalent in rural wealth literature. Scholars are well aware of the need for translating research into practice; the reverse can also be informative (and necessary) for change-making.
The goal of this research is to help foster a better mutual understanding between scholarship and practice such that they can co-evolve, generating a better dialog between their efforts. Rural wealth scholars engaged in report making can extend knowledge around the distinctions between stocks and flows in both measuring and conceptualizing wealth building. Both practitioners and scholars omitted certain data points or aspects of data based on motivations for the production of such reports. The omission of race/ethnicity as a central focus in rural wealth scholarship and a contentious variable in report making in the case of the Black Belt Initiative highlight the complex politics of rural poverty and its histories. In addition, to better inform rural economic development, it would help if rural indicators could be spatially distinct from nearby urban areas. This would allow regions to isolate rural development policies and trends from those of the urban areas embedded within the regional landscape.
Finally, the availability of data deeper than county level allows rural areas to disambiguate their socioeconomic changes from those of urban areas, enabling rural communities across America to take stock of their resources and quality of life using economic development indicators tailored to their unique policy objectives and concerns. Despite the availability of such data sets, there are few indicator report series that used data deeper than county level. Even census tracts can cover large areas in rural landscapes. In part this may be because the annual sample size of the ACS is much smaller than the sample size of the decennial census long form. Yet, data from 5 years could be combined to provide more reliable estimates for geographic areas with fewer than 20,000, people as this is the population threshold for reporting.
Conclusion
This article sought to help build a bridge between practitioner and researcher understandings of how to measure and influence rural wealth and economic development. Research that comprehensively measures stocks (or flows) of each wealth category is new and limited, and the practical efforts of regional reports offers guidance in helping to better align how the measurement of such indicators can most accurately reflect the realities on the ground. Both capital literature and the reports seek to triangulate multiple data sources to build a more complete picture of the socioeconomic conditions alongside policy objectives. In doing so, report series expand their assessment far beyond financial capital to benchmark the region's other capitals, such as human and cultural. This is useful because communities depend on investment from a broad range of capital assets to generate rural wealth. The full suite of indicators used across regional reports points to unique policy levers and funding supports that can exert impact across multiple indicator categories. In addition, data from multiple sources help verify trends in reports by offering supporting evidence.
Researchers have also stressed the importance of considering the human and social systems as an integrated part of the cultivated and natural landscape systems, acknowledging that building complex systems involves broad human knowledge, experience, and community collaboration (Schmit et al., 2020, 2021). By combining data into indicators sets, the research community seeks less to verify data and identify how the investment in one capital relates to and/or affects the others (eg. Flora et al., 2005; Flora & Flora, 2008). Such a reality underscores the importance of Jablonski’s (2018) effort to broaden the scholarly field of study. Jablonski's push to include stocks and flows is further justified with the acknowledgement that rural regional report series draw from multiple capitals and emphasize flows.
The review and comparison of practical efforts and scholarly innovations provided here offer an opportunity to shape best practices in scholarship and practice. The suite of indicators in Table 2 offers a repository of data options that can be repeated in situ or replicated elsewhere for comparison. Moreover, as Figure 1 notes, there is room for additional report making, national comparisons, and replication of efforts over time. We note that triangulation of data is important, as is the inclusion of important variables that shape and explain wealth, such as spatial proximity and race. Publicly available data sets that are made available yearly or every 5 years, allow for timely, dependable statistical measurement at regular intervals. Both rural wealth scholars and communities are shaping the framework of analysis. As the Great Valley Center (1999–2014) and Tuskegee-led reports (SOFSEC, 2003) demonstrated, centering community voices and stories in report formation is crucial to directing more equitable policy outcomes.
As our findings indicate, there is ample room to expand the discussion surrounding economic development policy objectives in rural communities by creating more rural report series that cover new territory or by updating existing reports to incorporate new and more spatially explicit data tailored to rural landscapes. Report replication is important for tracking policy progress and impact, but such effort is also contingent on additional funding and continuity in regional policy directives. As the long and successful history of the Appalachian Regional Commission shows, increased federal, regional, and local attention can alter rural futures and support growth in planning across both rural communities and the scholars who seek to understand and support planning efforts.
Footnotes
Acknowledgements
We would like to thank Muthia Fahzia for her work in gathering reports, Andrew Leach for assistance in making maps, and anonymous reviewers for pushing us toward a better crafted manuscript.
Declaration of Conflicting Interests
The author(s) declared no potential conflicts of interest with respect to the research, authorship, and/or publication of this article.
Funding
The author(s) received no financial support for the research, authorship, and/or publication of this article.