
Abstract
Little research has analysed the relationship between personality traits and loneliness, considering polygenic risk scores (PGSs), social isolation, socioeconomic, and health factors. We used data from 4,892 older adults 52 years and older from the English Longitudinal Study of Ageing (ELSA). ELSA wave 5 (2010/2011) was our baseline, and wave 6 (2012/2013) to wave 9 (2018/2019) was the loneliness follow-up. Polygenic risk scores for loneliness were derived from genome-wide association studies. We conducted multiple linear regression and multilevel LMMs to analyse the cross-sectional and longitudinal relationship between personality traits and loneliness. Extroversion (Coef. = -.375; 95% CI:−.447 to .302), Neuroticism (Coef. = .557; 95% CI: .485–.629), Agreeableness (Coef. = −.188: 95% CI: −.273 to .103), Conscientiousness (Coef. = −.183; 95% CI: −.271 to .095), and Openness to Experience (Coef. = −.170; 95% CI: −.236 to .103) were associated with loneliness at baseline. Over eight years of follow-up, loneliness levels decreased on average. Only Extroversion was associated with the loneliness rate of decline (Coef. = .012; 95% CI: .002–.022) after potential confounders had been considered. An important task of health and social services is to identify older adults at risk of physical, mental, and cognitive health issues. The success of public health and clinical interventions to reduce loneliness could be informed by a consideration of personality profiles.
Introduction
Loneliness is a subjective experience characterised by a negative feeling produced by the discrepancy between a person’s relationships and those they desire (de Jong Gierveld & Tesch-Römer, 2012). It has become a severe public health problem, and existing interventions are only partly effective (McDaid et al., 2022). In high-income countries, approximately 1 in 4 people over 60 experience some kind of loneliness (National Academies of Sciences & Medicine, 2020). In Western Europe, the average prevalence of loneliness among people 60 years and older was 8.7% (Surkalim et al., 2022). Chronic loneliness, a more intense and long-lasting feeling of loneliness (Hawkley & Capitanio, 2015), is associated with early mortality and increased risk for mental health disorders and cognitive decline among older adults (Holt-Lunstad et al., 2015; Ward et al., 2021). Loneliness and social isolation are often used as synonyms. However, social isolation or changes in social connectedness do not necessarily modify loneliness. In fact, the association between social isolation and loneliness is sometimes weak (Burholt et al., 2020; Lim et al., 2020). However, an analysis of the relationship between loneliness and the quality of the contacts more than their frequency is still needed (Hawkley et al., 2008; Lim et al., 2020).
Risk factors for loneliness
There are individual differences in the experience of loneliness; some people feel a higher level of distress related to a lack of connections or poor quality of relationships, while others feel more comfortable with limited social contact. These individual differences indicate that environmental, social-economic, and genetic factors may drive loneliness (Spithoven et al., 2019). Current models for loneliness highlight loneliness that has triggers, such as changes in marital status, income, or health, that interact with individual risk factors like gender, education, income, wealth, and age (Dahlberg et al., 2022; McDaid et al., 2022; National Academies of Sciences & Medicine, 2020). Women with a lower level of education and income reported loneliness more frequently or at higher levels (Chen et al., 2014; Dahlberg et al., 2015; Lim et al., 2020; Ormstad et al., 2020; Victor & Bowling, 2012; Victor & Pikhartova, 2020). Moreover, marital status has been described as an important protective factor against loneliness, with people in partnerships, marriages, and cohabitation reporting lower levels of loneliness (Cohen-Mansfield et al., 2016; de Jong Gierveld & Tesch-Römer, 2012; Itzick et al., 2020; Victor & Bowling, 2012). However, studies have also described increased loneliness during widowhood, retirement, and chronic diseases (Chen et al., 2014; Guthmuller, 2022; Lim et al., 2020). Both men and women who are socially deprived or living in low socioeconomic conditions have a higher risk of experiencing intense loneliness (Victor & Pikhartova, 2020).
Perceived health, depression, and pain are health factors that have also been linked to loneliness (Dahlberg et al., 2022; Victor & Bowling, 2012). Nevertheless, they can act as risk factors or consequences of loneliness (Lee et al., 2021; Lim et al., 2020).
Loneliness risk, understood as the tendency to experience pain from a lack of social connections, is a heritable trait, and its variance is partially explained by a genetic predisposition (Day et al., 2018; Matthews et al., 2016). A twin study using data from 8387 young adult participants in the Netherlands Twin Register (NTR) reported a heritability of loneliness of 48% (95% CI: .44–.53) with no age or sex differences in the twin heritability (Boomsma et al., 2005). Moreover, in a study with 487,647 participants from the UK Biobank, the SNPs heritability of loneliness was 4.2% (SE = .02), and 15 loci at genome-wide significance (p < 5 Å ∼ 10−8) were identified (Day et al., 2018). A genetic risk score comprised of the 15 lead SNPs predicted loneliness phenotype in an independent set of 7,556 people (p = .025) (Day et al., 2018). Recently, a GWASs study using 511,280 adults from seven Western European and US cohorts reported four new loci associated with loneliness and an SNP heritability of 6.6% (SE = .03) (Abdellaoui, et al., 2019a). The study also found a genetic correlation between loneliness, depressive symptoms, subjective well-being, and four of the big five personality traits (Abdellaoui, et al., 2019b).
Yet, having loneliness as the consequence of the interaction between triggers and risk factors requires people to use their social and emotional expectations to negatively evaluate their current living situation and social or intimate interactions (Cacioppo & Cacioppo, 2012; de Jong Gierveld & Tesch-Römer, 2012; Hawkley et al., 2008; Lim et al., 2020). Those cognitive and emotional processes might be, among other factors, associated with someone’s personality (Buecker et al., 2020).
Personality traits and loneliness
Personality traits are defined as a group of core characteristics that interact to create individual variability in psychological functioning (Kandler et al., 2014). They can be measured using self-report scales on which people describe themselves, their emotions, and their behaviours. The Big Five Personality Model encompasses five core personality traits – Openness (open versus conventional), Conscientiousness (reliable versus unreliable), Extroversion (versus introversion), Agreeableness (versus uncooperative), and Neuroticism (vs. emotionally stable) (Ellis et al., 2009; Kandler et al., 2014). Personality has been considered a static feature in adulthood, but in the last two decades, research has shown that personality traits change through life and might be modified (Caspi et al., 2005; Chapman et al., 2014; Mund et al., 2019).
Individual differences in loneliness have been linked to personality traits. In a meta-analysis that reviewed 113 studies with people from 12 to 100 years old, Extroversion, Agreeableness, Conscientiousness, and Neuroticism were associated with loneliness. The association between Openness to experience and loneliness was weak and entirely explained by the other traits. Moreover, Extroversion and Neuroticism showed the strongest association with loneliness (Buecker et al., 2020). Based on those results, we can expect that extroverted, emotionally stable, responsible, and reliable people who avoid conflict and get along with others remain socially connected and report lower levels of loneliness (Buecker et al., 2020; Caspi et al., 2005). At the same time, the association between Neuroticism and loneliness might be given by the propensity to negative affect and the lack of trust in others. While Neuroticism encompasses the inclination to experience negative affect in general, loneliness is the tendency to experience negative affect in social life (Mund et al., 2019). Consequently, humans studies have described people with a higher tendency to loneliness as more avoidant, anxious and with a negative expectation cycle (Cohen-Mansfield & Parpura-Gill, 2007). And in the same line, studies with animals have shown that across different generations of rats, those with higher sensitivity to separation from the mother exhibited anxious and socially avoidant behaviours from early life (Cacioppo & Cacioppo, 2012, 2018; Cacioppo et al., 2016; Cacioppo & Hawkley, 2009). This link to anxiety may contribute to the association between Neuroticism and loneliness (Anglim & O’Connor, 2019).
In the case of Extroversion, more extrovert people have more extensive networks, perceive more social support, expect positive outcomes from social interactions, enjoy social situations, and actively seek to engage in social activities (Buecker et al., 2020; Cacioppo & Cacioppo, 2012; Caspi et al., 2005).
Finally, genetic studies have shown common hereditability between personality traits and loneliness (Abdellaoui et al., 2018, 2019a, 2019b). Neuroticism and Extroversion also have the strongest genetic association with loneliness (Abdellaoui et al., 2018, 2019a, 2019b).
Personality traits and loneliness rate of change among older people
On average, loneliness (mean level) and the proportion of people considered to be lonely remain relatively stable over time unless specific triggers are in place (McDaid et al., 2022; Mund & Neyer, 2019). For instance, during the COVID-19 pandemic, there was a slight increase in loneliness levels on average (Ernst et al., 2022). However, the lack of change in mean levels may disguise wider within-person variation over time.
The association between personality traits and the loneliness rate of change need to be explored. So far, one study has analysed the relationship between personality traits and the changes in loneliness over time (Ormstad et al., 2020). The authors recruited 516 men and 419 women in The Norwegian Study on Life course, Ageing and Generations (NorLAG). The participants were 60–79 years old and did not report loneliness at baseline. The follow-up was five years later, where 10.5% of the men and 14.1% of the women reported feeling lonely. Associations between personality traits and the risk of loneliness were studied by gender. For women, higher Agreeableness was associated with a higher risk of becoming lonely. For men, higher Agreeableness and Conscientiousness were associated with a lower risk of loneliness, and Neuroticism was associated with a higher risk of loneliness. The associations were adjusted by baseline age, quality of life, depression, anxiety, and living with a partner (Ormstad et al., 2020). On the other hand, a recent study using a coordinated analysis approach with 16 longitudinal samples described specific age-related variations in personality. The authors found a decrease in Extroversion, Agreeableness, and Conscientiousness over time, with a higher decline in Conscientiousness among people 60 years and older. They also reported a U-shaped change in Neuroticism with an increase towards older adulthood and middle adulthood stability in Openness with decrease in older age (Graham et al., 2020).
Analysing the association between personality traits and loneliness using a population-based cohort of older adults might help elucidate the particularities of their link in this group, helping to identify individuals at high risk for greater loneliness in older age (McDaid et al., 2022). A better understanding of the relationship between personality traits and changes in loneliness at an older age might have implications for loneliness interventions and the role of health and social services in supporting those at risk of developing chronic loneliness. Consequently, we aimed to analyse the relationship between personality traits and loneliness in older adults, cross-sectionally and longitudinally, taking into account sociodemographic, economic and health factors, genetic predisposition, and social isolation.
Methods
Study design and participants
The current study is a secondary data analysis from the English Longitudinal Study of Ageing (ELSA).
Participants were part of ELSA, a nationally representative sample of the English population aged 50 years and above that started in 2002 (Wave 1). The core participants for ELSA were drawn from the Health Survey for England (HSE), and refreshments were included in waves 3, 4, 6, 7, and 9 to maintain age group representation (NatCen Social Research, 2020). More details about ELSA Cohorts have been described elsewhere (Steptoe et al., 2013a). Because personality traits were only measured at wave 5 (2010–2011), the baseline for our study was drawn from core members (CM) in this wave. Participants were included if they had information available for personality traits, polygenic risk scores for loneliness (PGSs), and the three items from the Revised UCLA Loneliness Scale (R-UCLA). Loneliness follow-up came from wave 6 (2012–2013) to wave 9 (2018–2019). Blood samples were drawn at waves 2 (2004–2005) and 4 (2008–2009) for DNA assays.
In total, 75 participants had missing data for the R-UCLA scale at baseline and were not included in the analytical sample. Therefore, the final analytic sample at baseline was 4,892 participants (Figure 1). The National Research Ethics Service (London Multicentre Research Ethics Committee) granted ethical approval for each ELSA wave. All participants gave informed consent. Study flowchart.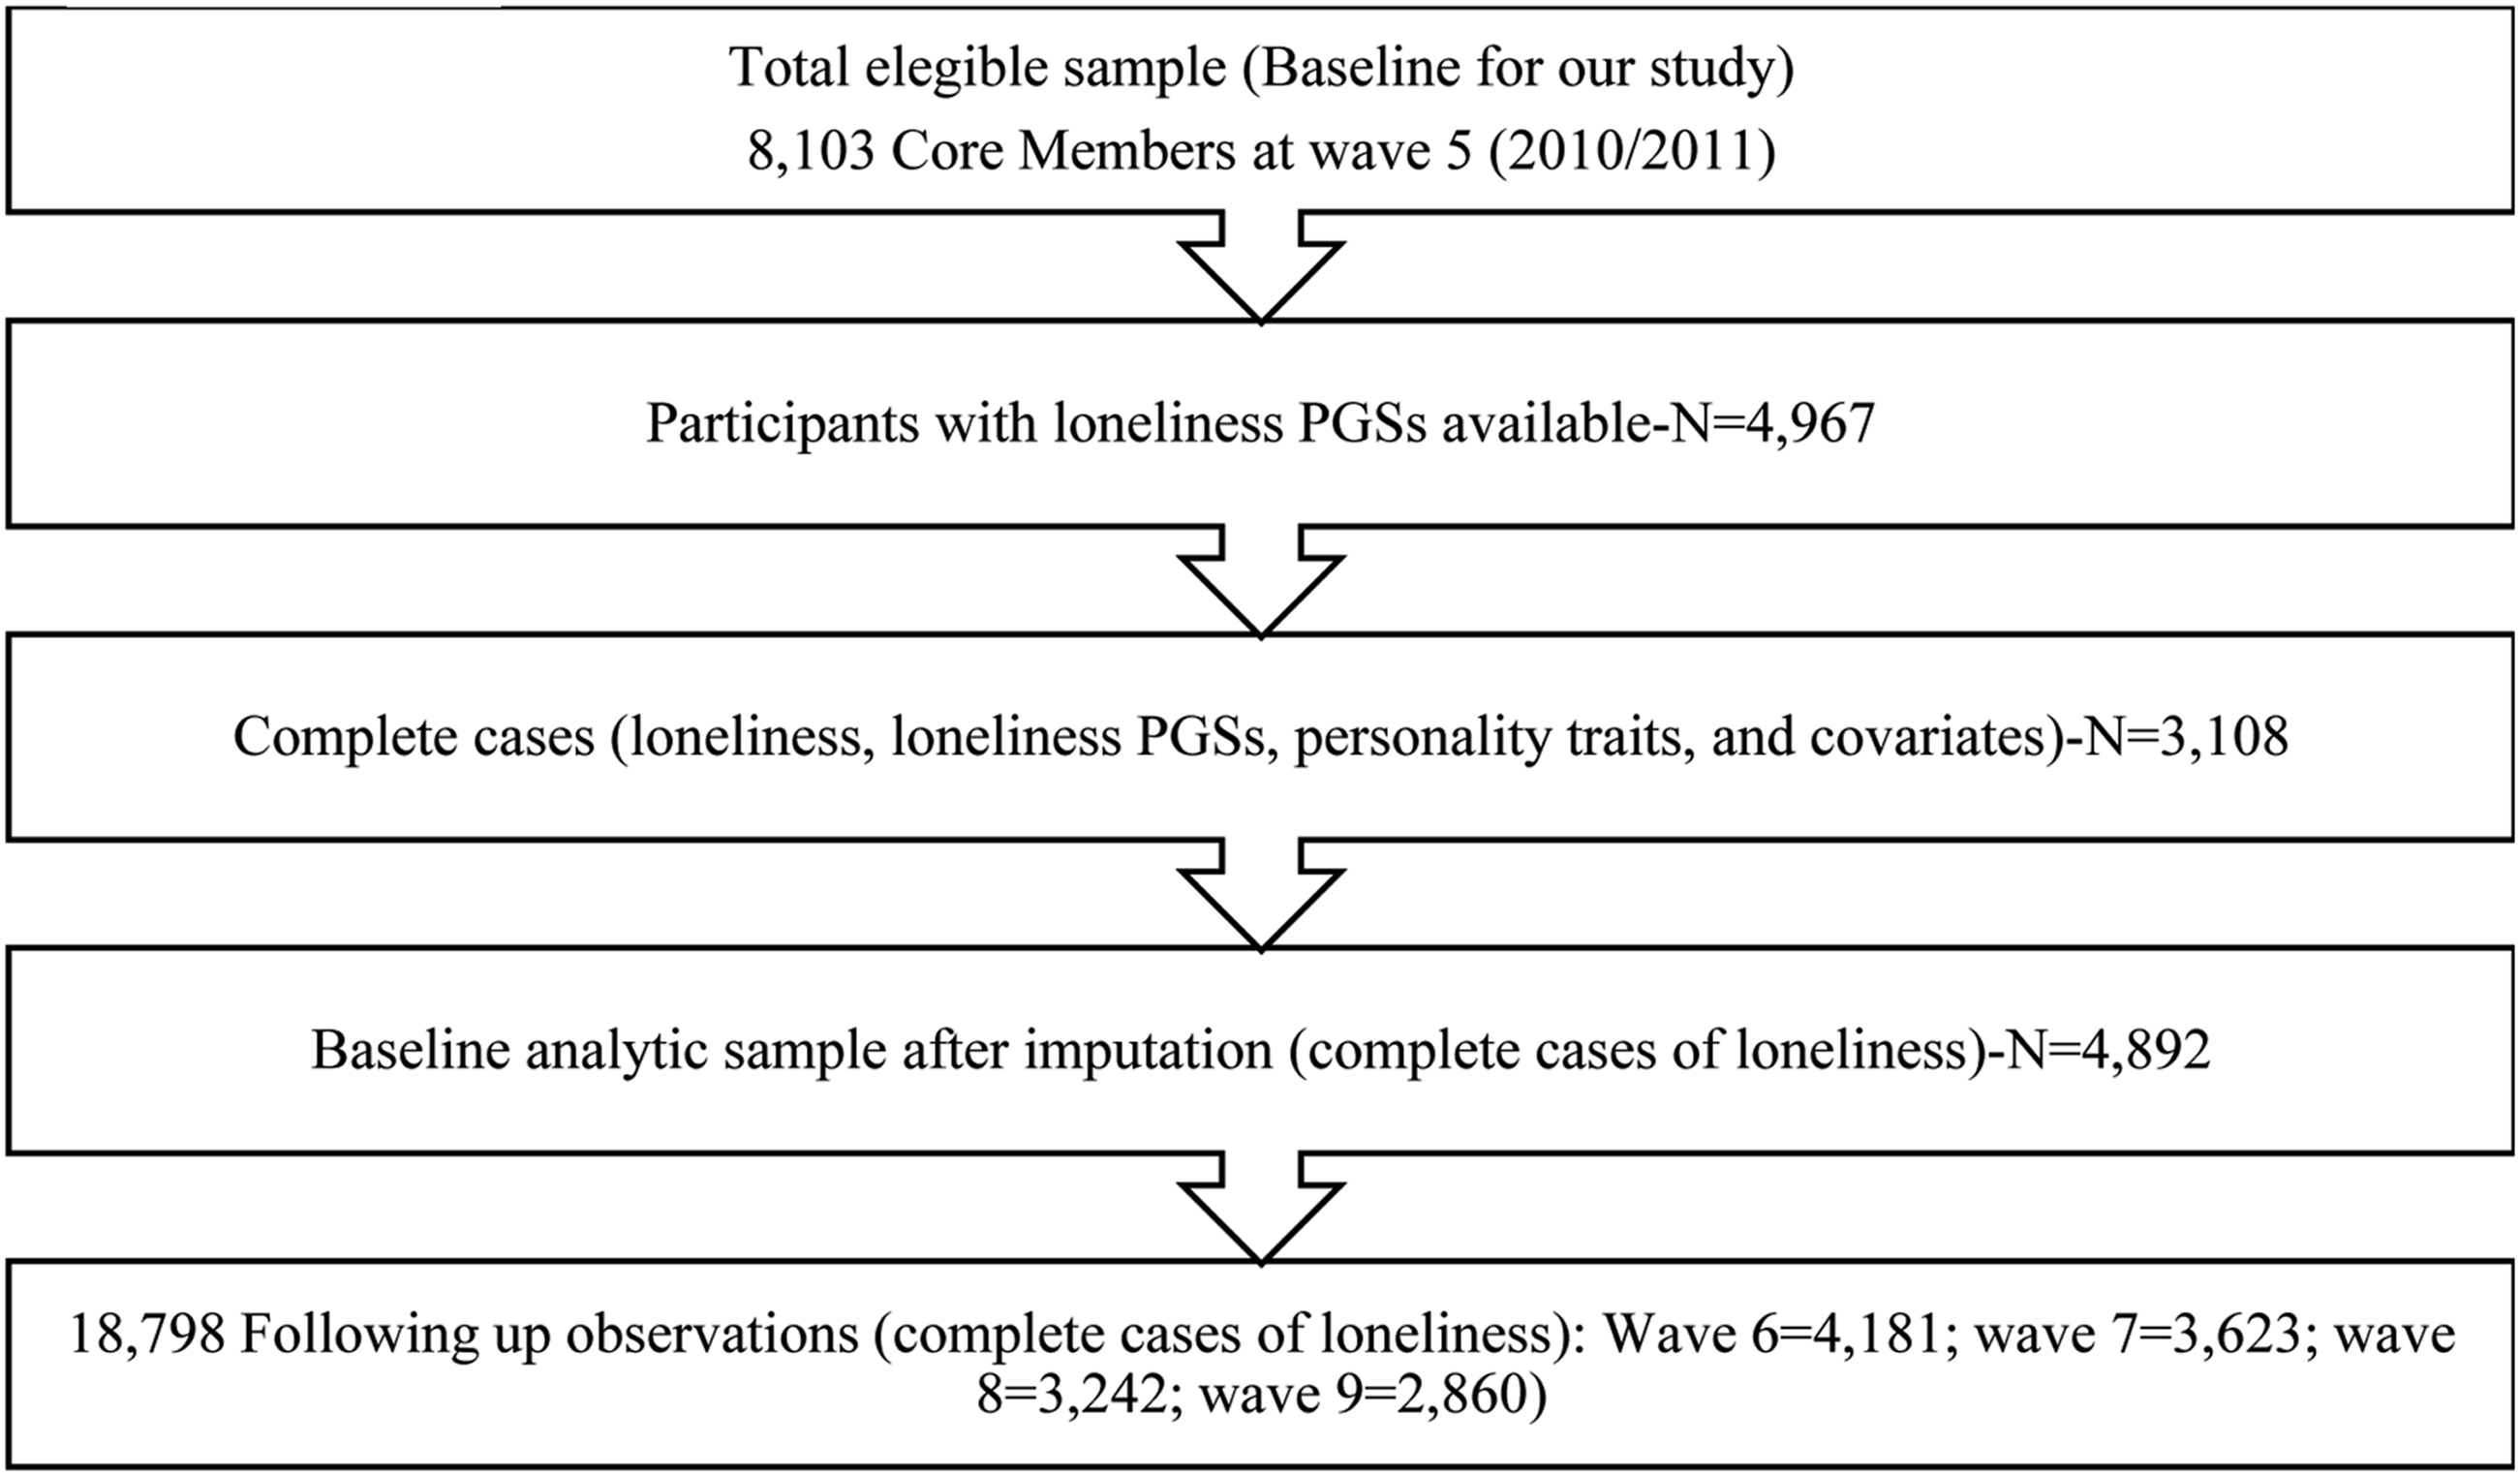
Study variables
Loneliness
The outcome of this study, loneliness, was assessed using the three items of the revised version of the University of California Los Angeles Loneliness Scale (R-UCLA scale) (Russell, 1996). The scale asked, ‘how do you feel about different aspects of your life?’ And the three items are lack of companionship, being left out, and isolated from others. The scale of responses was 1 = hardly ever or never, 2 = sometimes, and 3 = often. The loneliness score is the sum of the three questions, ranging from 3 to 9. Higher scores represent higher intensity in the perception of loneliness. In ELSA wave 5, the reliability of the three items had a Cronbach alpha of .94 (N = 10,274).
Personality traits
The independent variables, personality traits, were measured using the 26 items from the scale developed in the MidLife in the United States (MIDUS) 1 and 2 Studies (Prenda & Lachman, 2001) and adapted for the Health and Retirement Study to assess the Big Five traits personality, Neuroticism, Extroversion, Agreeableness, Conscientiousness, and Openness to Experience. Using a scale from 1 (not at all) to 4 (a lot), participants rated themselves on 26 adjectives, categorised as follows: moody, worrying, nervous, and calm (reverse scored) (Neuroticism); outgoing, friendly, lively, active, and talkative (Extroversion); organised, responsible, hardworking, thorough, and careless (reverse scored) (Conscientiousness); creative, imaginative, intelligent, curious, broad-minded, sophisticated, and adventurous (Openness); and helpful, warm, caring, soft-hearted, and sympathetic (Agreeableness).
Each trait was obtained from the average in the adjectives included per each trait. In ELSA wave 5 (N = 10,274), the internal reliabilities measured with the Cronbach alpha were .94 for Neuroticism, .95 for Extroversion, .95 for Conscientiousness, .97 for Openness to Experience, and .96 for Agreeableness.
Covariates
Based on previous evidence, we selected potential confounders assuming they could be alternative explanations for the relationship between personality traits and loneliness (Chapman et al., 2010; Dahlberg et al., 2022; Graham et al., 2020; Hakulinen et al., 2015; Hawkley & Cacioppo, 2010; Luo et al., 2022). We modelled participants’ age at baseline using the participant’s years at the moment of the survey. Due to the small number of ELSA core members above 90 years old and risk for disclosure of identifiable information, all participants 90 years and older were coded as 90 years old
Others have described the relationship between social isolation and loneliness (Holt-Lunstad et al., 2015; Steptoe et al., 2013b); therefore, we adjusted our analysis by social isolation. Social isolation was measured using the five-item Steptoe Social Isolation Index (Steptoe et al., 2013b). The items were dichotomous (yes = 1/no = 0) and asked about being unmarried or not cohabitating, monthly contact with children, other family members, or friends (face to face, telephone, and email/writing), and group participation. Scores equal to or above two were categorised as social isolation (Steptoe et al., 2013b). Additionally, we adjusted by self-perceived health obtained from the self-rate item about the state of health. The response options were 1 = poor; 2 = fair; 3 = good; 4 = very good; and 5 = excellent. We dichotomised into two groups 1) fair to poor and 2) good to excellent.
The pain presence was obtained from a dichotomous item about being often troubled with pain; and depression, using the sum of the seven items from the Center for Epidemiologic Studies Depression Scale (CES-D) (Radloff, 1977). The CES-D starts with ‘Much of the time during the past week…’ and includes the following items: (1) you felt depressed?, (2) you felt that everything you did was an effort?, (3) was your sleep restless?, (4) were you happy?, (5) you felt lonely? (item omitted), (6) you enjoyed life?, (7) you felt sad?, and (8) could you not get going? Participants answered yes or no to each question.
Finally, we included ELSA PGSs for loneliness calculated with the summary statistics from a genome-wide association study (GWAS). The genome-wide genotyping was performed in 2013–2014 at University College London (UCL) Genomics. The team genotyped 7,597 ELSA participants of European ancestry using the Illumina HumanOmni2.5 BeadChips (HumanOmni2.5-4v1, HumanOmni2.5-8v1.3). Before creating the PGSs an individuals and single-nucleotide polymorphism (SNPs) quality control was carried out using PLINK 1.9 (Ajnakina, 2022). After quality control, the GWAS data were available for a total of 7412 ELSA participants and 2,230,767 SNPs. Based on HRS team recommendations, PGSs were calculated using genotyped SNPs, no LD trimming, and a pT of 1 (Ware et al., 2021).
As was described elsewhere (Tommerup et al., 2021), 65 participants were removed because of their ancestral admixture. Principal components were recalculated, and ten were retained to avoid biasing the results due to any ancestry differences in genetic structures (Price et al., 2006; Wang et al., 2009).
PGSs for loneliness were based on the summary data from the May 2017 release of UK Biobank imputed genetic data (Day et al., 2018). The release included 40 M imputed variants from the HRC panel. After the application of QC criteria, 452,302 individuals were available for analysis with genotype and phenotype data. Loneliness phenotype was obtained from self-reported questions (Ajnakina, 2022). The questions used in UK Biobank were different than the three-item scale UCLA scale used in ELSA; however, similar classifications were obtained.
Out of the 7,745,443 SNPs contained in the GWAS summary statistics, 1,342,866 SNPs overlapped with the ELSA genetic database and were included in the 2018 PGSs for loneliness (Ajnakina, 2022). PGSs for 7,183 ELSA participants were calculated. The predicted power was .70 (R2 = .0008; p-value <0 01), as was measured with the Avengeme package implemented in R. To ease the interpretation, PGSs were standardised.
Statistical analysis
Missing data
There were 63% of complete cases among the participants with PGSs available at wave 5. Loneliness had 75 observations missing (1%), while other covariates had one missing observation to 1,558 (See supplementary materials, section B, Table 1). Using data from participants with the same age, marital status, and gender, we completed the cases with one or two missing observations. We imputed missing variables (social isolation, Agreeableness, Conscientiousness, Extroversion, Neuroticism, Openness to Experience, wealth, work status, depression, and age) with the missForest R package using information from the entire dataset, including gender, marital status, education level, functionality, and self-perceived health that had complete cases. MissForest is a multiple imputation technique adapted from the random forest algorithm that combines mean/mode imputation with random forest to predict the missing data (Misztal, 2019; Stekhoven & Bühlmann, 2011). It is a valuable tool for managing mixed multivariate data (continuous and categorical variables) simultaneously. As a non-parametric method, there is no need for linear associations or tuning parameters. The analysis was carried out in R.
Descriptive statistics
We used the chi-square test and the Kruskal–Wallis test to compare baseline characteristics between men and women. Subsequently, we analysed the relationship between the covariates and loneliness (mean level). None of the covariates had a correlation higher than .7, and the strongest relationship among the personality traits was between Agreeableness and Neuroticism (r = .62) (Supplementary materials, section C, Table 2–4). Figure 2 displays standardised beta coefficients for the conditional association between the personality traits and loneliness obtained through the command ‘beta’. The standardisation was used only to facilitate the graphical analysis of the different models. To plot the changes in loneliness over time, we obtained the mean level with their 95% CI per wave and calculated the percentage of change in the mean level of loneliness between waves by subtracting and dividing the loneliness mean level by the previous wave loneliness mean level and amplifying by 100 (supplementary materials, section D, Figure 3). Unadjusted and adjusted estimations for the relationship between loneliness and personality traits.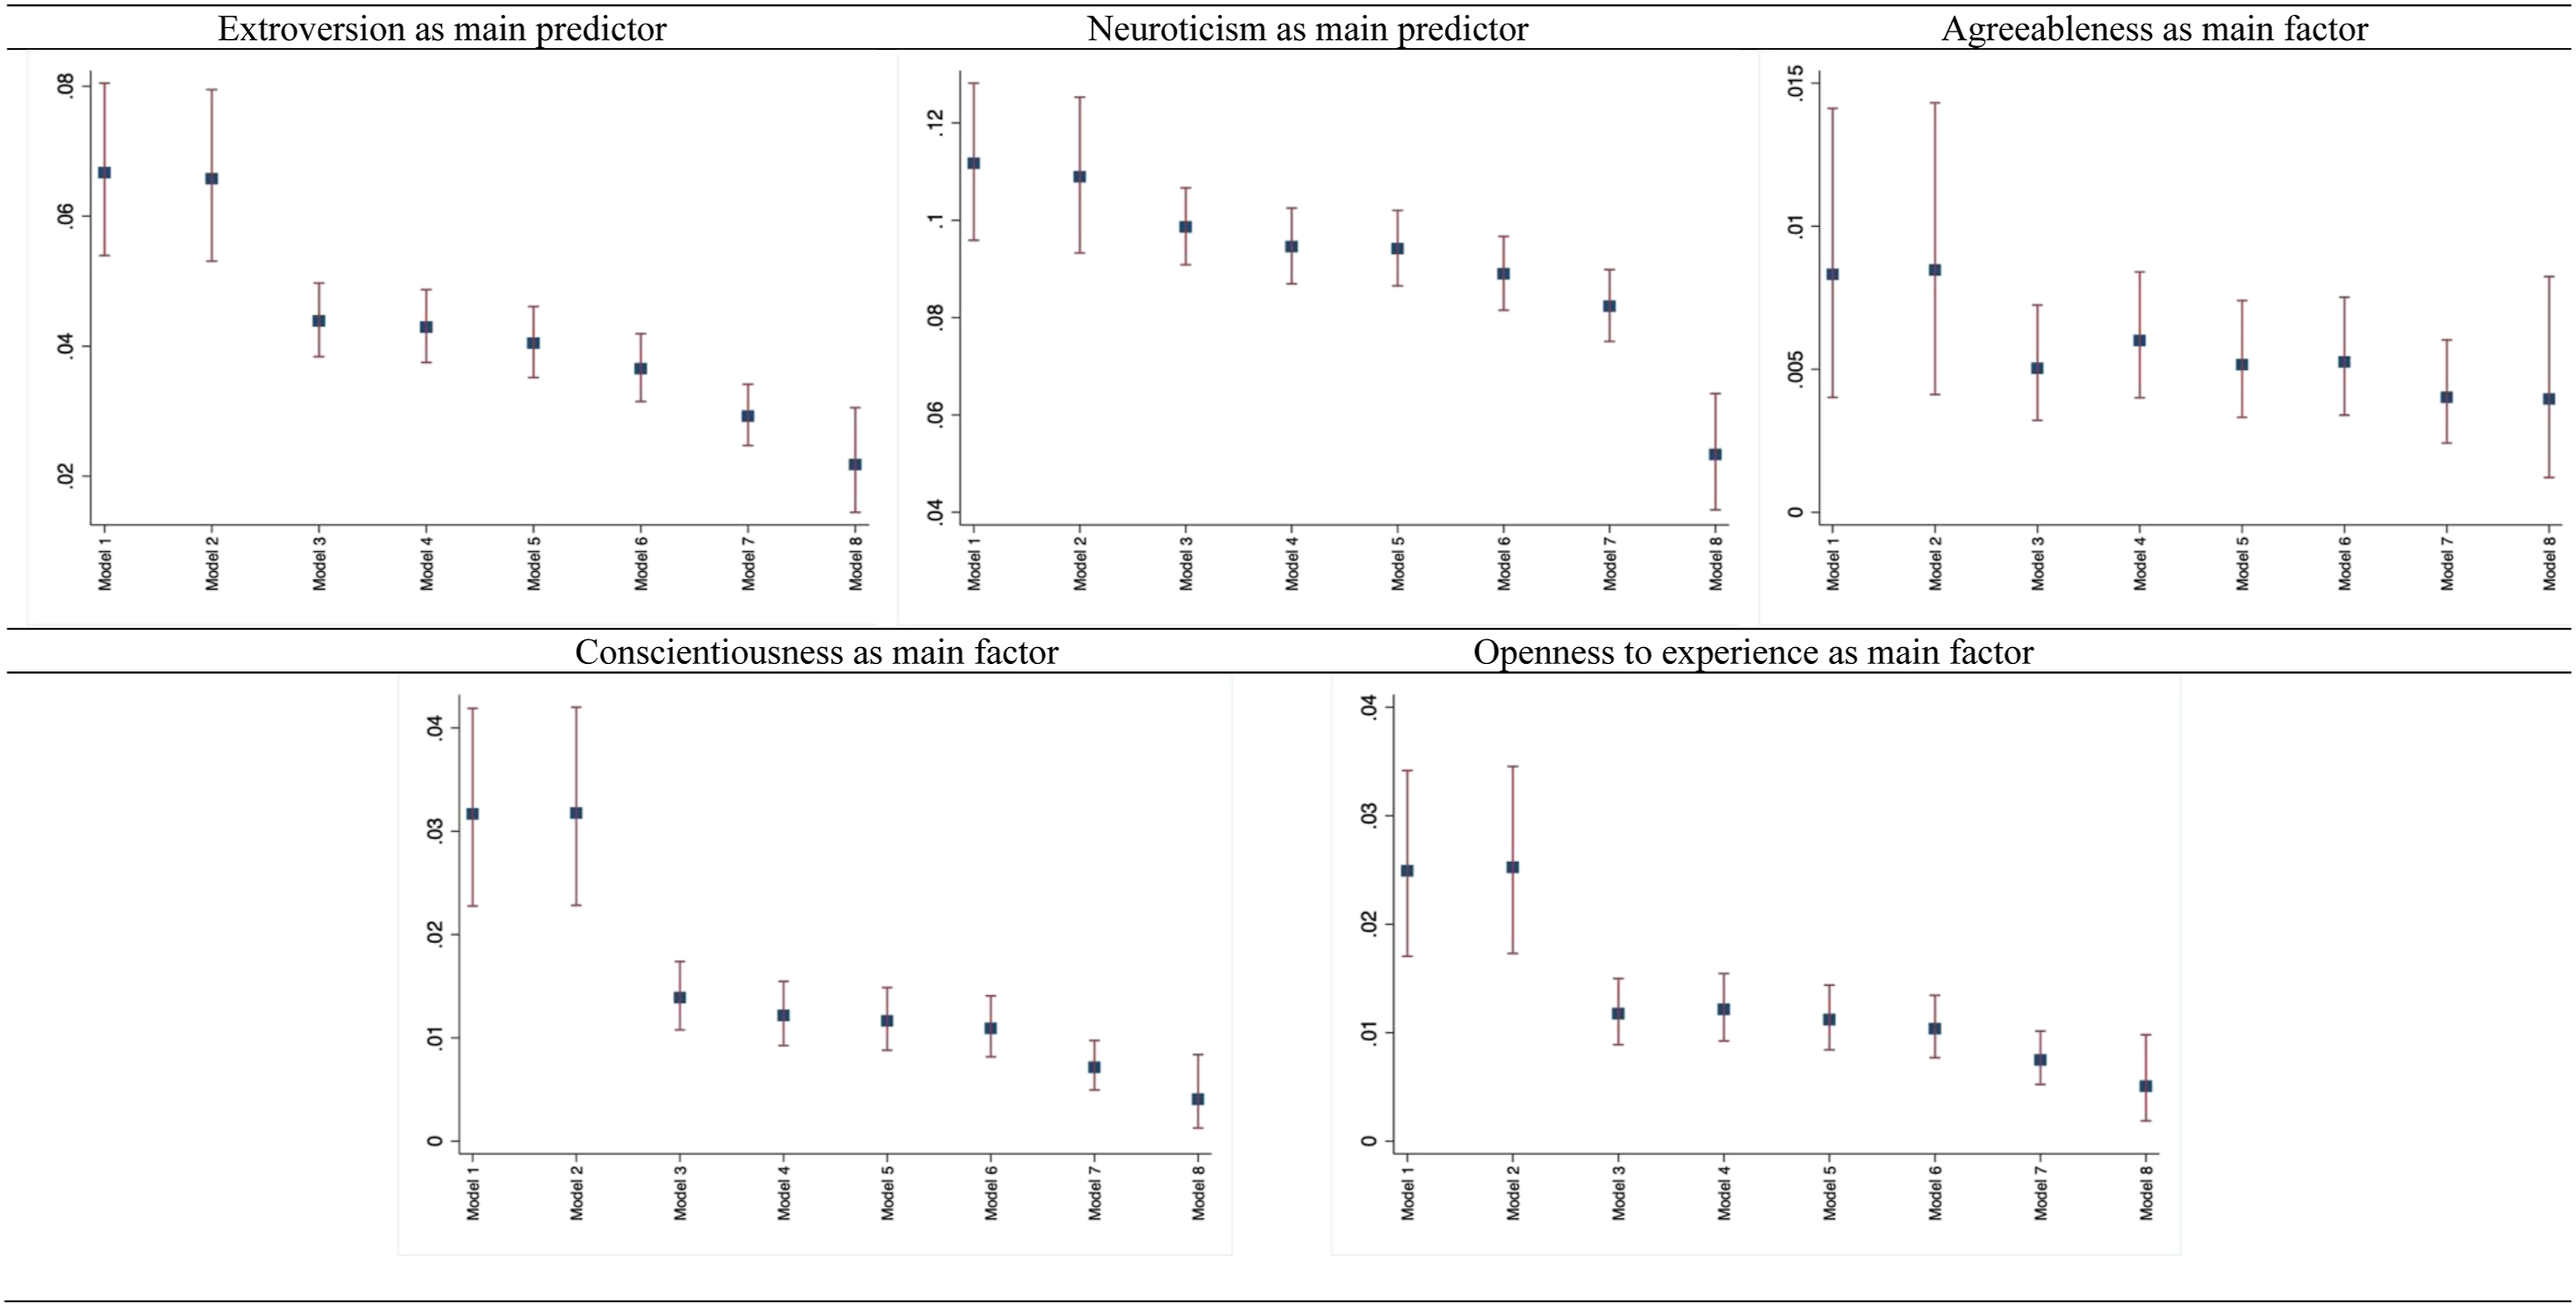
Association analysis
Firstly, we performed bivariate associations for the covariates and loneliness (Supplementary materials, section C, Tables 2–4). Secondly, we used multiple linear regression for cross-sectional analysis of the relationship between personality traits and loneliness at wave 5 and multilevel mixed-effects linear regression for the relationship between personality traits and the loneliness rate of change over eight years.
In the cross-sectional models, we added the covariates in eight blocks: Model 1 was the unadjusted relationship between loneliness and the personality trait (Extroversion, Neuroticism, Agreeableness, Conscientiousness, or Openness to Experience). Model 2 was Model 1 plus the polygenic risk scores (PGSs) for loneliness. Every time we used PGSs to adjust the models, we added four principal components to avoid bias due to ancestry differences in the genetic structures (Ajnakina et al., 2022; Ajnakina & Steptoe, 2022, p. 2022). Model 3 was Model 2 plus sociodemographic characteristics (age, gender, marital status, and level of education). Model 4 added economic factors (work status and wealth) to Model 3. Model 5 added social isolation to Model 4. Finally, Models 6 to 8 considered personality traits, PGSs, sociodemographic factors, economic factors, social isolation, and health factors. We added pain (Model 6), self-perceived health (Model 7), and depression (Model 8) one by one to observe the role of the health outcomes in the relationship between personality traits and loneliness. Loneliness was drawn from wave 5.
In the longitudinal models, we employed linear mixed effect models (LMMs) with maximum likelihood estimation. LMMs are an extension of linear regression models, designed to handle grouped, nested, and hierarchical data (Meteyard & Davies, 2020). LMMs with maximum likelihood estimation models maximise the use of longitudinal data, adjusting for the correlation between repeated measures and increasing statistical power and precision by weighting the estimates for missing data between measurements. We aimed to analyse the relationship between personality traits and loneliness rate of change over a period of eight years. The rate of change of loneliness was the average change in the mean level of loneliness across the four waves of follow-up. To calculate the relationship between independent variables and the rate of change of loneliness, we used the interaction between the baseline characteristics, including personality traits and the variable time that represents the rate of change between waves. We used a random intercept by person and a slope in time, representing person’s specific intercepts and slopes. We also reported the results of the covariance between person and time, representing the association between the different level of loneliness at baseline and the loneliness rate of decline.
We only considered baseline measures for personality traits, loneliness PGSs, sociodemographic, economic and health factors, and social isolation; therefore, they were added as fixed effects in the same eight blocks as in the cross-sectional models. The results for the eight models per personality trait are presented in Table 3. We showed only the association between each trait and loneliness. Baseline coefficients correspond to the conditional main effects, and the rate of change coefficients to the conditional interaction between the trait with time (waves). All the covariates within the different blocks were also interacted with time. The complete models are displayed in the supplementary materials, section D, Tables 6 to 25. Table 4 displays the fully adjusted model (Model 8) with all the personality traits and their interaction with time were added at the same time (mutually adjusted).
Since that loneliness did not follow a normal distribution (see supplementary materials, section A, Figures 1 and 2), we built the cross-sectional and longitudinal models using Bootstrap errors with 1000 iterations. Statistically significant associations were reported at 5% significance using conventional values. Regardless of p-values, a statistically significant association was only reported if 95% confidence intervals did not consider null values.
Sensitivity analysis
We performed two different sensitivity analyses. Firstly, because of the decrease in the magnitude of the association between personality traits and loneliness when depression was added to the models, we excluded potential depression cases (people with +3 points at the CES-D) and conducted Model 8 using the different model specifications (cross-sectional, longitudinal, separate traits, and mutually adjusted). The results are displayed in the result sub-section ‘sensitivity analysis I’, and further information can be found in the supplementary materials, section E, Tables 26–28.
Secondly, we compared the participants included and excluded in the study due to the availability of PGSs. Both groups were different in age, marital status, education, work, wealth, social isolation, self-perceived health, Neuroticism, and loneliness in all waves (see supplementary materials, section F, Table 29). In consequence, we conducted the fully adjusted models without the restriction to PGSs but excluding potential depression cases (baseline sample = 6422). The complete dataset was imputed using the same procedure described above. The cross-sectional and longitudinal models were adjusted by sociodemographic characteristics (gender, age, marital status, and educational level), economic factors (work status and wealth), social isolation, and health factors (self-perceived health and pain). The flowchart for the non-restricted sample can be found in the supplementary materials, section F, Figure 4, and the sample characteristics in the supplementary materials, section F, table 30. The results can be found in the result sub-section ‘sensitivity analysis II’ and in the supplementary materials, section F, Tables 31 to 33.
The descriptive and association analyses were carried out in STATA 17.
Results
Sample characteristics at baseline
Baseline Characteristics (N = 4892).
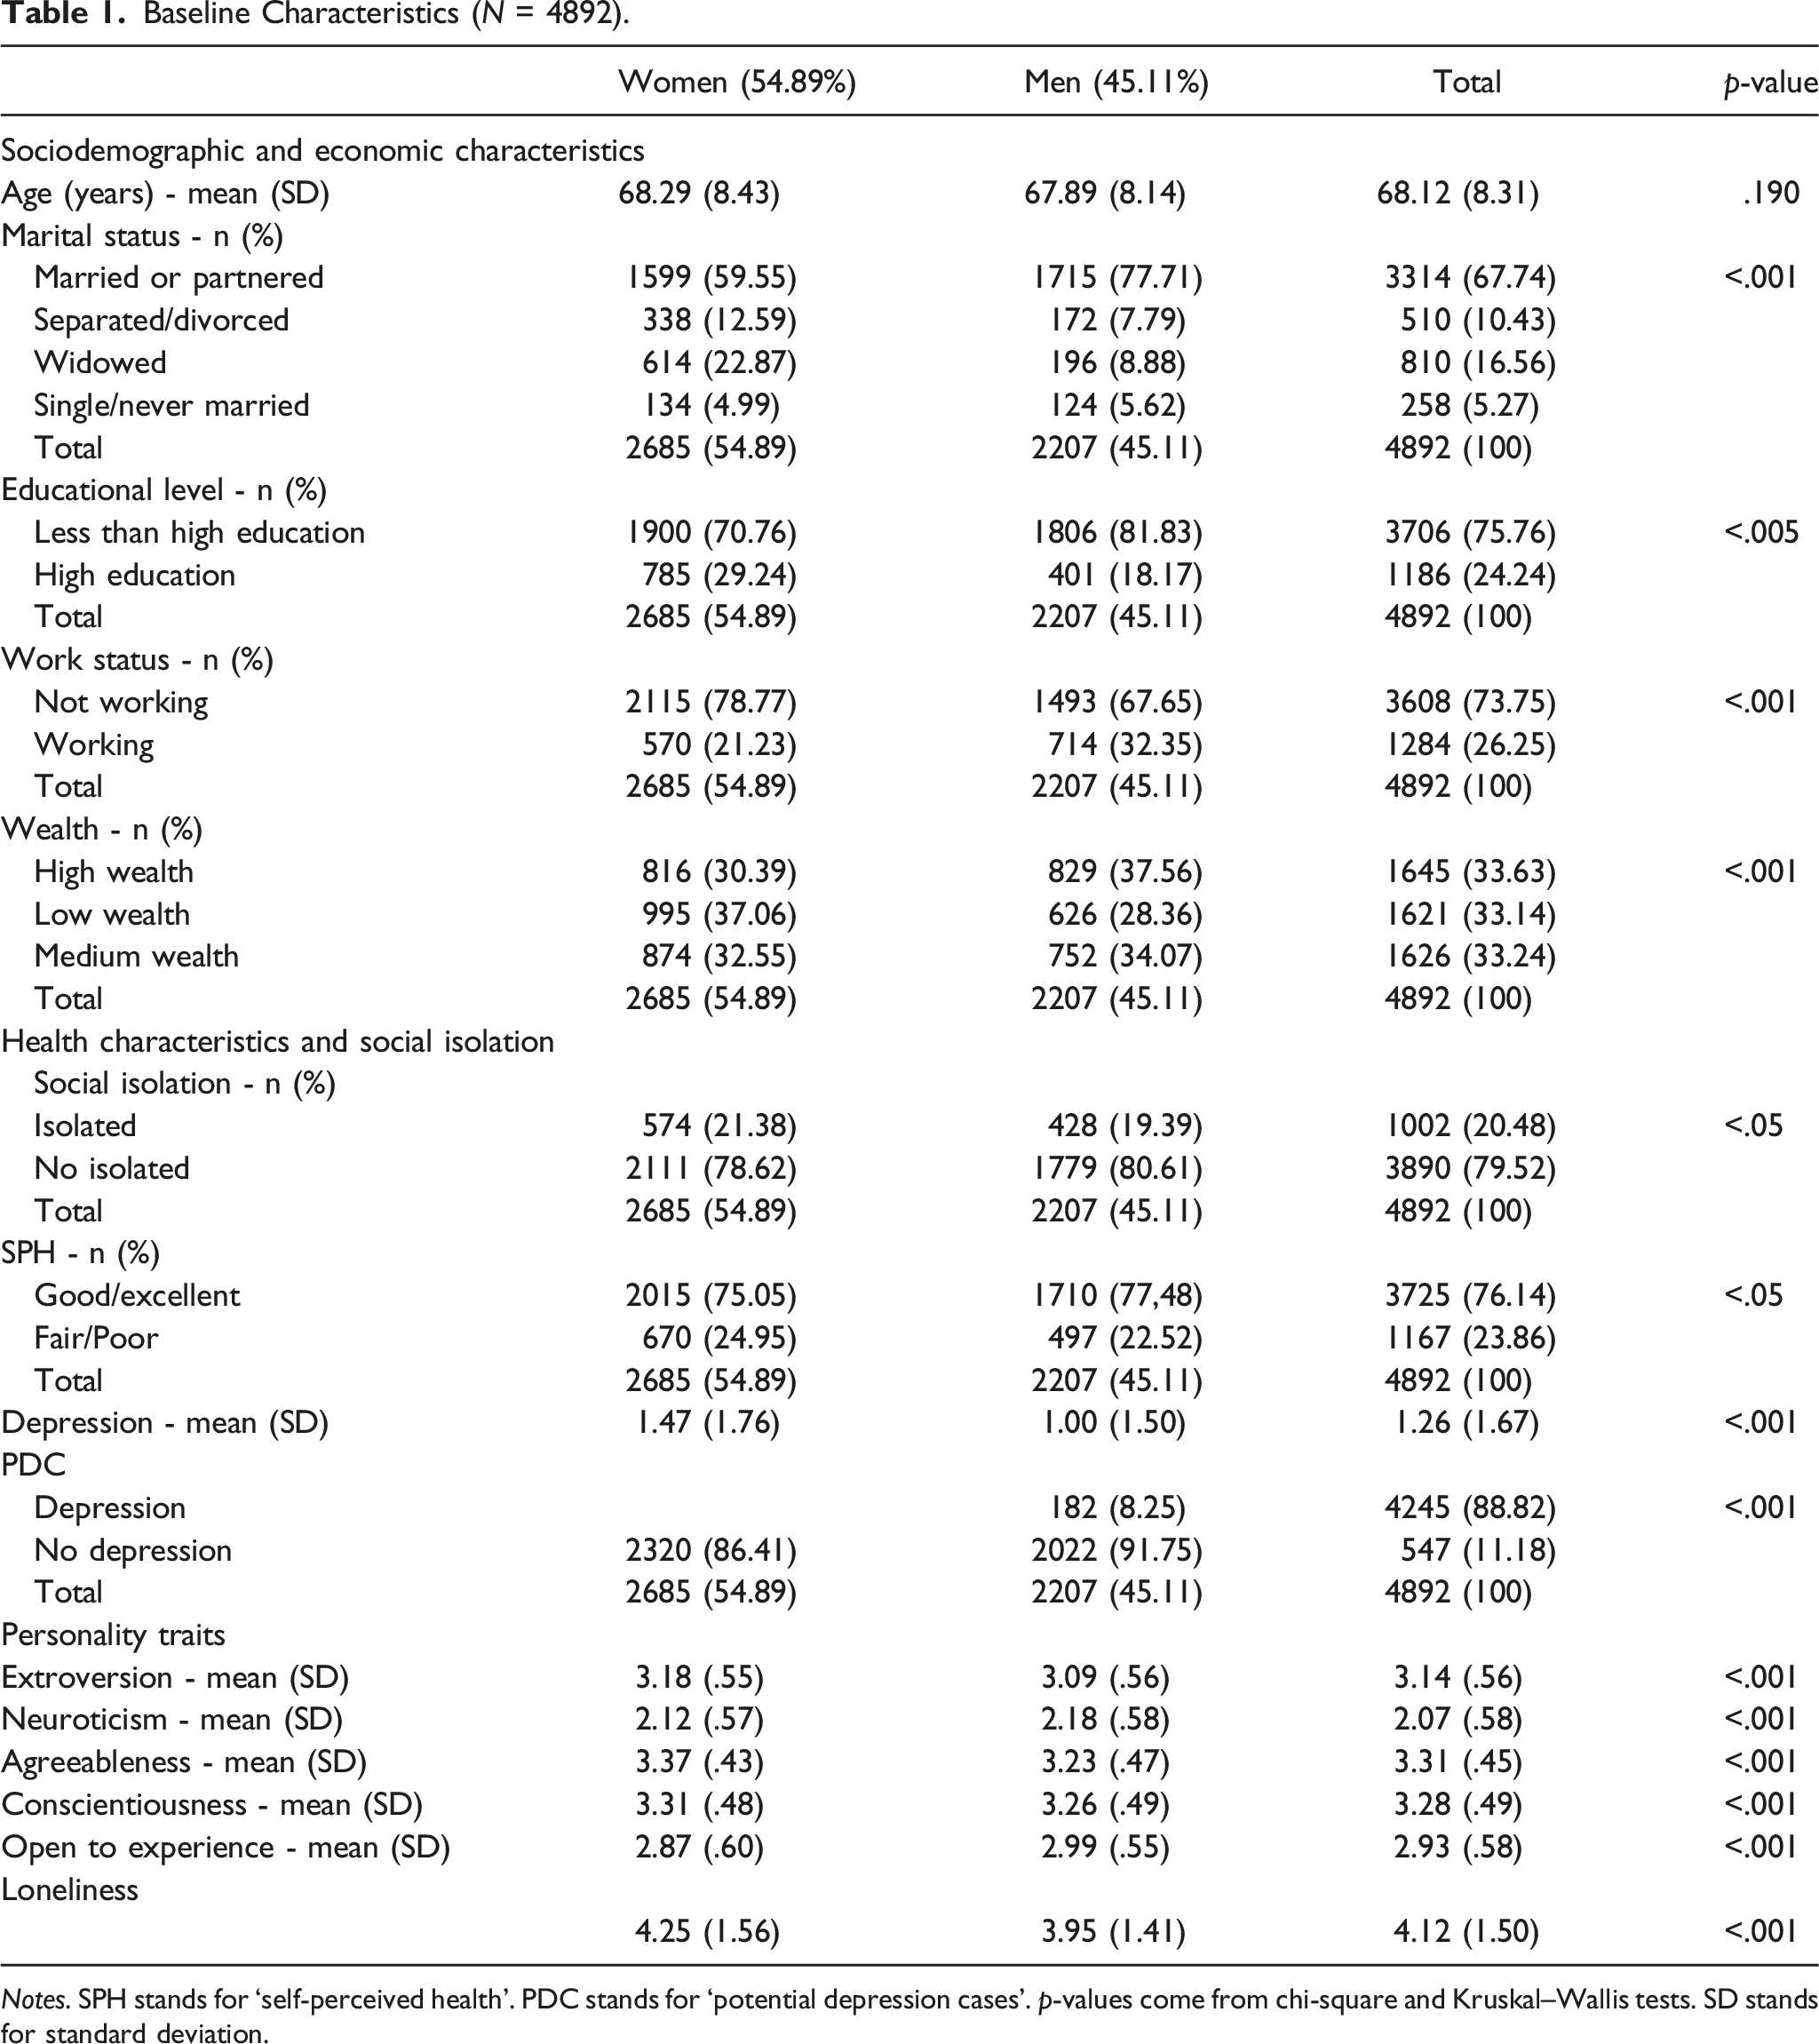
Notes. SPH stands for ‘self-perceived health’. PDC stands for ‘potential depression cases’. p-values come from chi-square and Kruskal–Wallis tests. SD stands for standard deviation.
Cross-sectional relationship between personality traits and loneliness
Figure 2 displays coefficients and 95% confidence intervals for the adjusted relationship between the five personality traits and loneliness. Independently of the covariates, there were statistically significant associations between Extroversion, Neuroticism, Agreeableness, Conscientiousness, and Openness to Experience with loneliness at conventional levels. Higher Neuroticism and lower Extroversion, Agreeableness, Conscientiousness, and Openness to Experience were associated with greater loneliness.
Notably, the strength of the associations was markedly reduced when health factors (pain, self-perceived health, and depression) were added to the models (Models 6–8). Among the health variables, depression had the strongest relationship between personality traits and loneliness. In the fully adjusted models, when depression was added, the magnitude of the relationship with loneliness decreased by 54% for Extroversion, 64% for Neuroticism, 62% for Agreeableness, 33% for Consciousness, and 42% for Openness to Experience. It is worth noticing that the magnitude of the association between Extroversion, Agreeableness, Conscientiousness, and Openness to Experience, with loneliness first decreased when age, gender, educational level, and marital status were included (supplementary materials, section D, Tables 6–15). However, in the case of the models with Neuroticism as the independent variable, only marital status was associated with loneliness, and the magnitude of the association slightly increased in Model 3 compared to Model 2.
Finally, the fully adjusted models (see section D, Tables 6–15 in the supplementary materials) showed higher levels of Neuroticism associated with higher levels of loneliness (Coef. .557 95% CI: .488–.627), while the associations between Extroversion (Coef. = .375, 95% CI: −.448 to .301), Agreeableness (Coef. = −.188, 95% CI: −.273 to .102), Conscientiousness (Coef. = −.183, 95% CI: −.272 to .094), and Openness to Experience (Coef. = −.170, 95% CI: −.237 to .102) with loneliness were negative and somewhat smaller than for Neuroticism.
Multiple Linear Regression Model Results: The Relationship Between Personality Traits and Loneliness Adjusted by All Five Personality Traits.
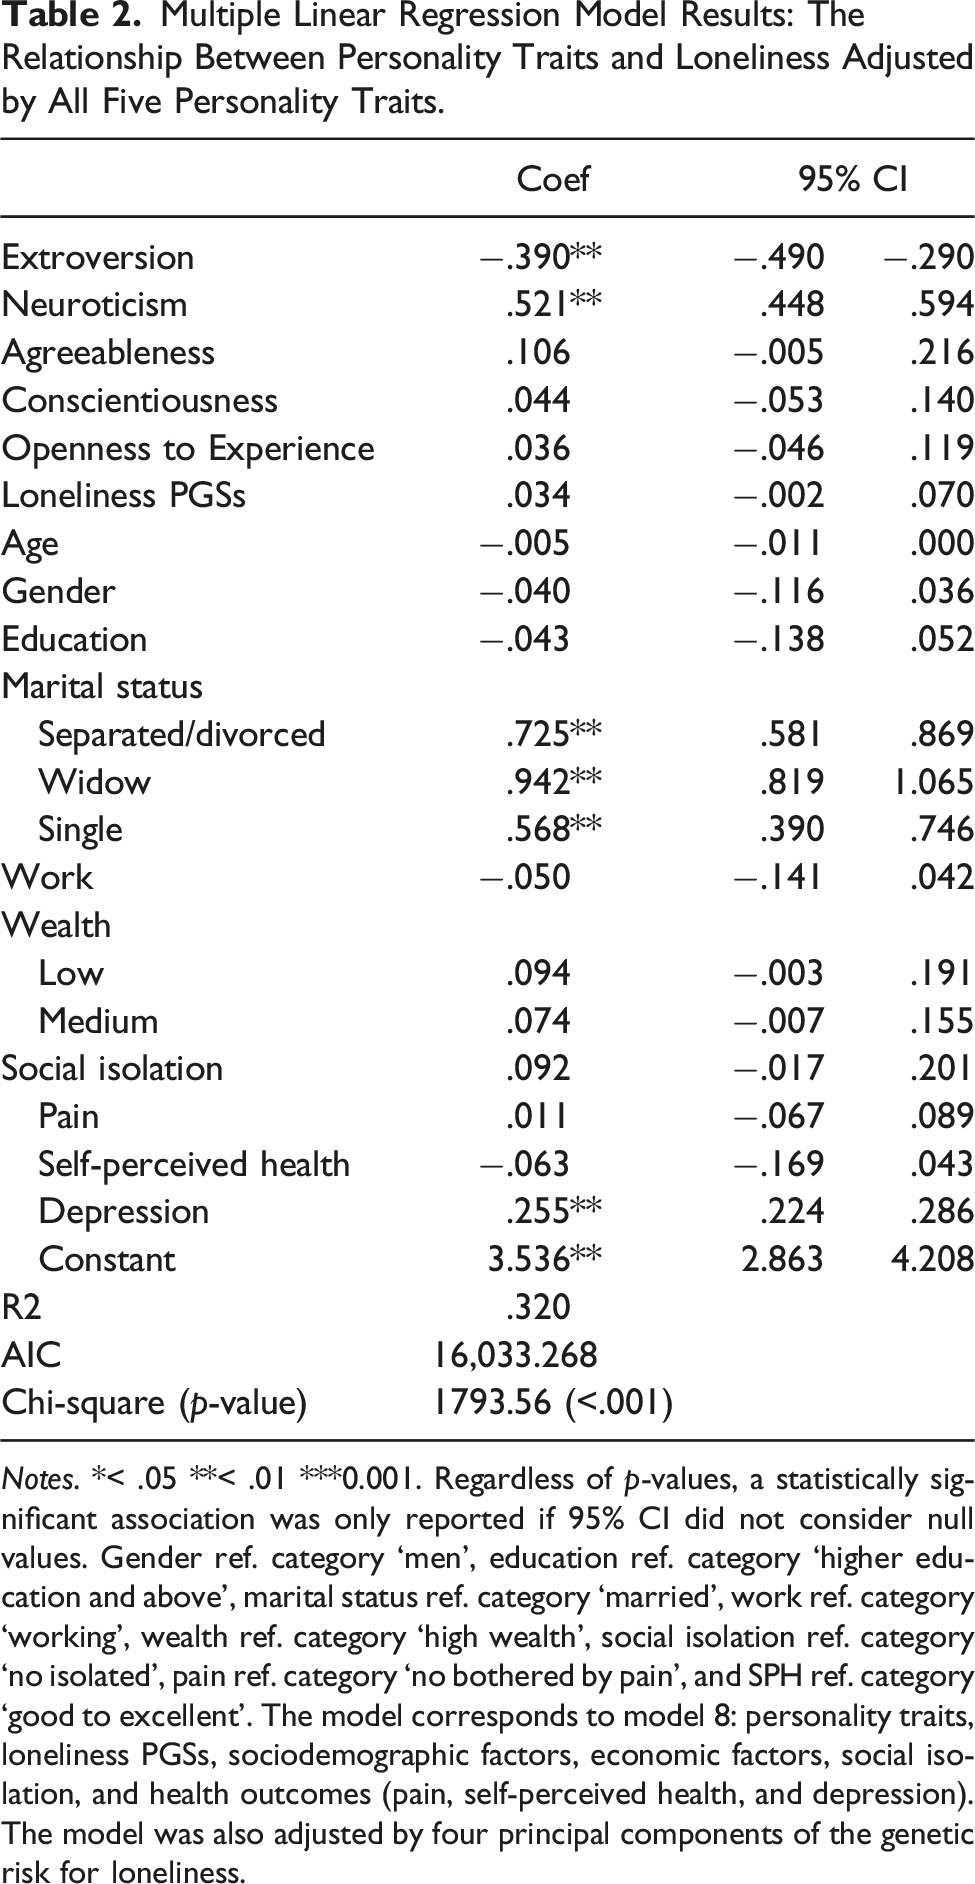
Notes. *< .05 **< .01 ***0.001. Regardless of p-values, a statistically significant association was only reported if 95% CI did not consider null values. Gender ref. category ‘men’, education ref. category ‘higher education and above’, marital status ref. category ‘married’, work ref. category ‘working’, wealth ref. category ‘high wealth’, social isolation ref. category ‘no isolated’, pain ref. category ‘no bothered by pain’, and SPH ref. category ‘good to excellent’. The model corresponds to model 8: personality traits, loneliness PGSs, sociodemographic factors, economic factors, social isolation, and health outcomes (pain, self-perceived health, and depression). The model was also adjusted by four principal components of the genetic risk for loneliness.
The loneliness PGSs were independently associated with loneliness when Extroversion, Agreeableness, Conscientiousness, and Openness to Experience were the main exposures. In the models with Neuroticism as the main exposure and the models with the five traits included simultaneously, the association between loneliness polygenetic scores and loneliness did not remain statistically significant at the conventional levels (supplementary materials, section D, Tables 5–14).
Longitudinal analysis: personality traits and the loneliness rate of change
The average of loneliness decreased from 4.12 at baseline (wave 5; 2010/2011) to 3.98 at wave 9 (2018/2019), having its lowest point at wave 7. The average rate of change (wave 5 to wave 9) was –3.40% which means a decline in loneliness (hereafter ‘rate of decline’). The higher decrease (−3.18%) was between wave 6 (2012/2013) and wave 7 (2014/2015) (supplementary materials, section D, Figure 3).
Relationship Between Personality Traits and the Loneliness Rate of Change.
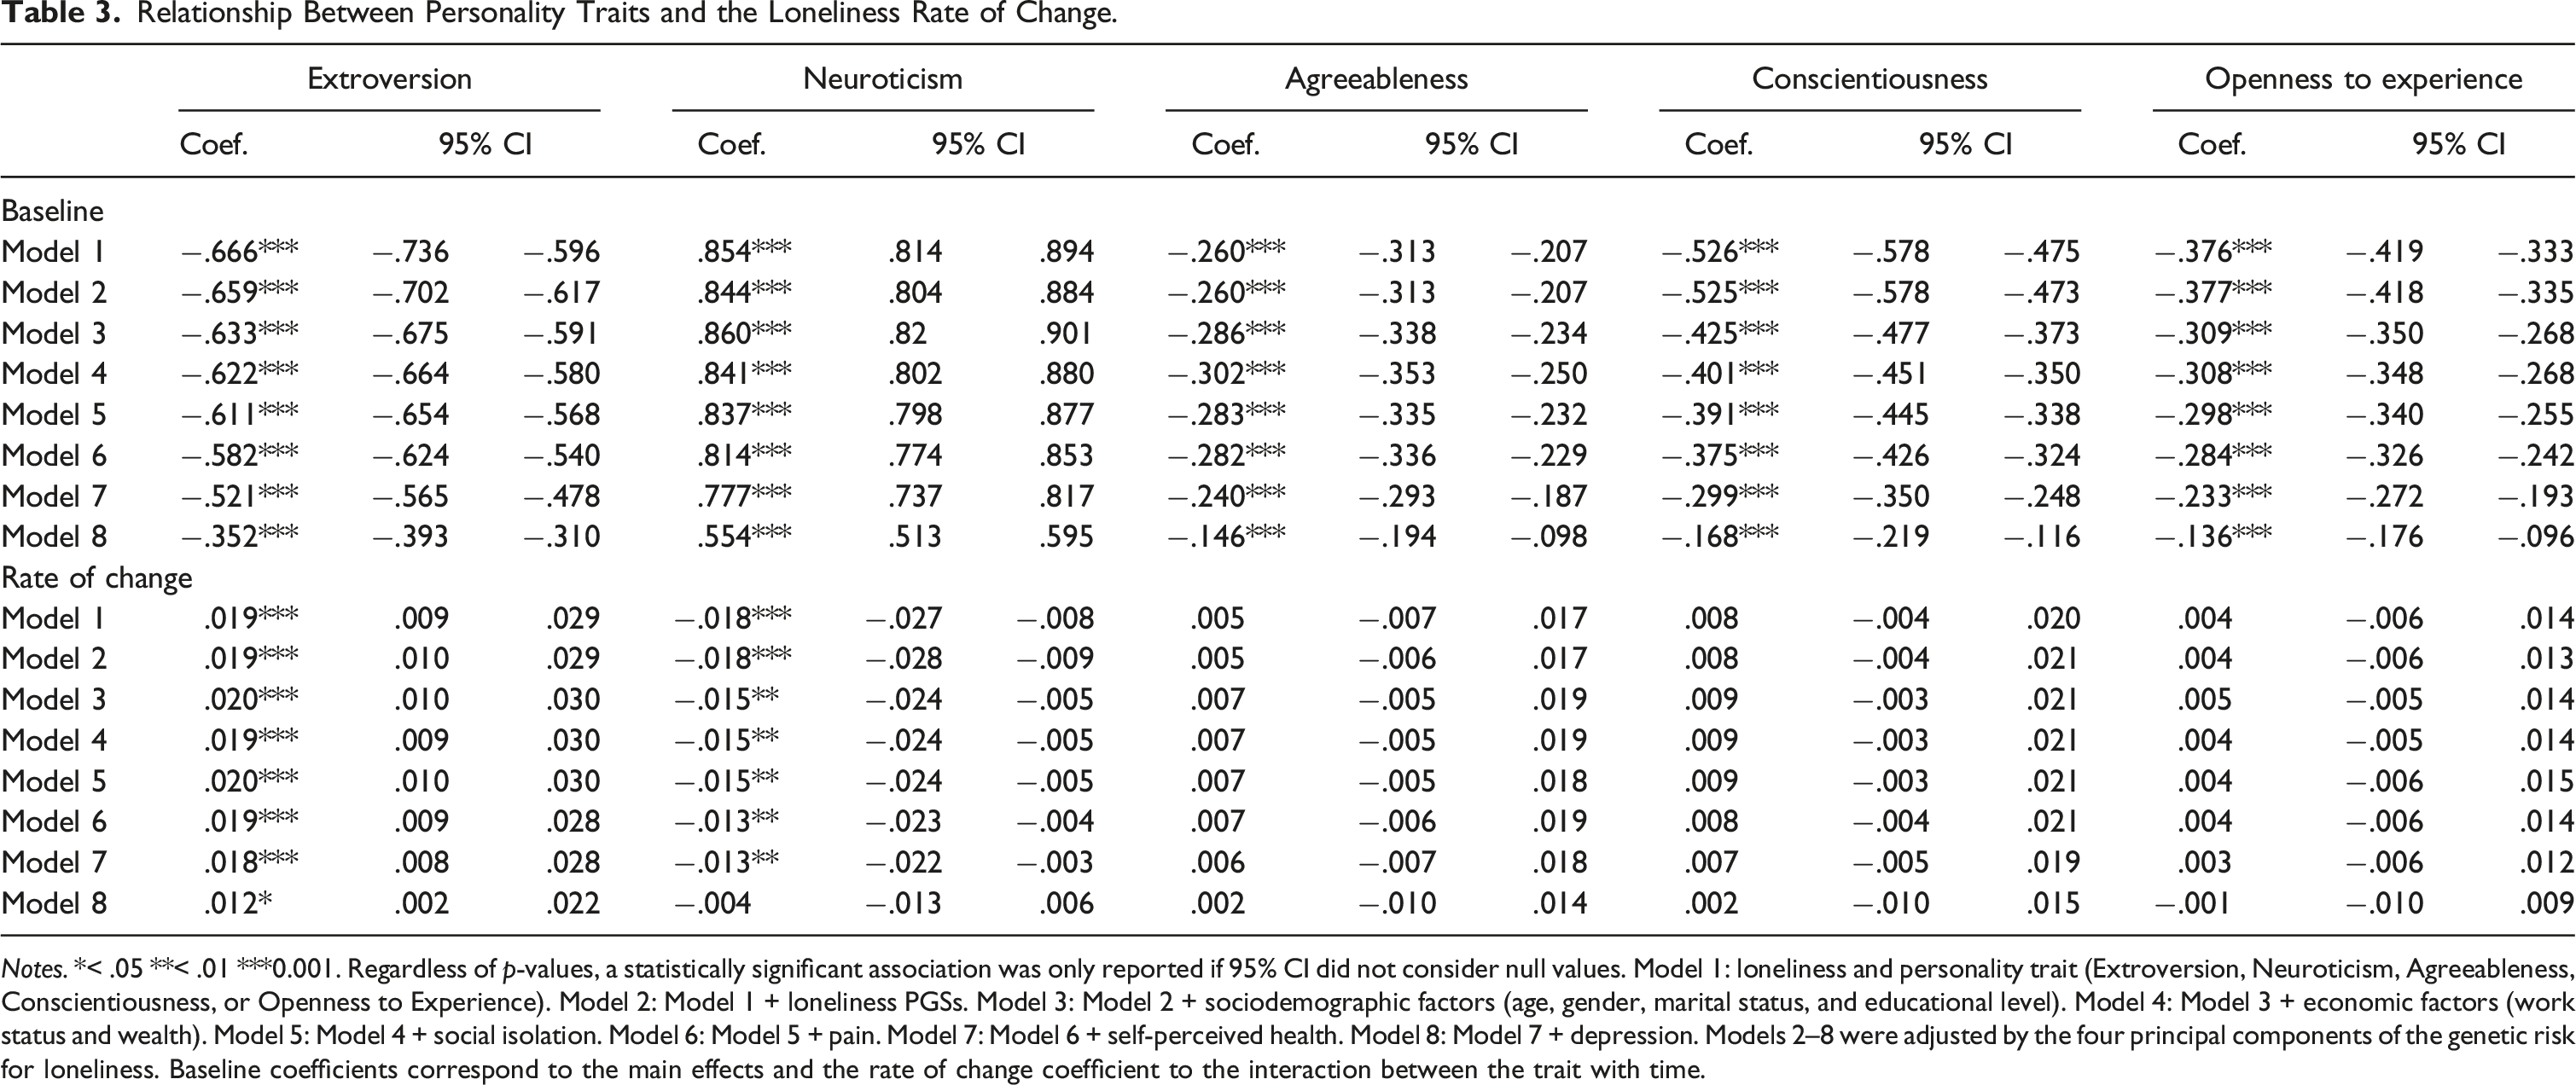
Notes. *< .05 **< .01 ***0.001. Regardless of p-values, a statistically significant association was only reported if 95% CI did not consider null values. Model 1: loneliness and personality trait (Extroversion, Neuroticism, Agreeableness, Conscientiousness, or Openness to Experience). Model 2: Model 1 + loneliness PGSs. Model 3: Model 2 + sociodemographic factors (age, gender, marital status, and educational level). Model 4: Model 3 + economic factors (work status and wealth). Model 5: Model 4 + social isolation. Model 6: Model 5 + pain. Model 7: Model 6 + self-perceived health. Model 8: Model 7 + depression. Models 2–8 were adjusted by the four principal components of the genetic risk for loneliness. Baseline coefficients correspond to the main effects and the rate of change coefficient to the interaction between the trait with time.
The random effect variances represent the person’s specific intercepts and slopes. The statistically significant variance for time (random slope) represents the person’s rate of decline between waves and showed a statistically significantly difference in the rate of decline between waves for each participant. Additionally, the positive covariance for time and intercept means that people with higher levels of loneliness at baseline had a flatter rate of decline over the eight years (see random effect parameters at supplementary materials Tables 16–25; 27–28; 32–33).
Mixed Linear Regression Model Results: The Relationship Between Personality Traits and the Loneliness Rate of Change Adjusted by All Five Personality Traits.
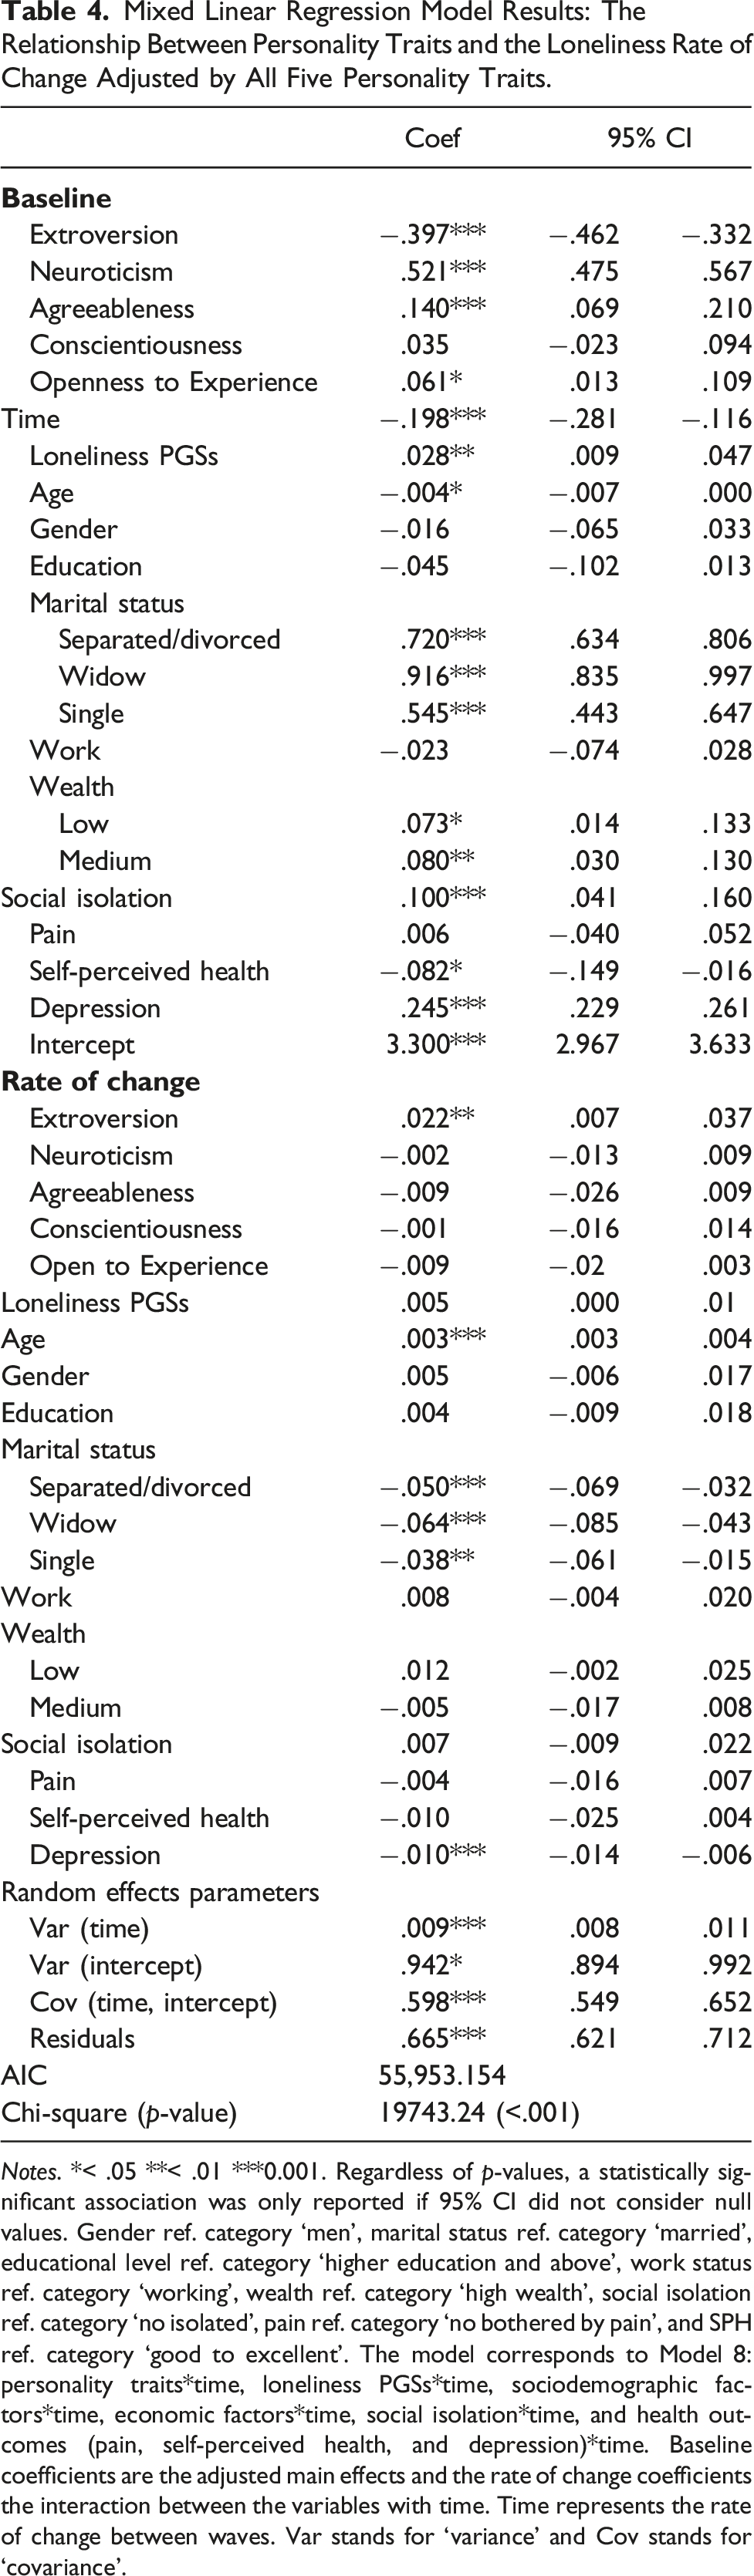
Notes. *< .05 **< .01 ***0.001. Regardless of p-values, a statistically significant association was only reported if 95% CI did not consider null values. Gender ref. category ‘men’, marital status ref. category ‘married’, educational level ref. category ‘higher education and above’, work status ref. category ‘working’, wealth ref. category ‘high wealth’, social isolation ref. category ‘no isolated’, pain ref. category ‘no bothered by pain’, and SPH ref. category ‘good to excellent’. The model corresponds to Model 8: personality traits*time, loneliness PGSs*time, sociodemographic factors*time, economic factors*time, social isolation*time, and health outcomes (pain, self-perceived health, and depression)*time. Baseline coefficients are the adjusted main effects and the rate of change coefficients the interaction between the variables with time. Time represents the rate of change between waves. Var stands for ‘variance’ and Cov stands for ‘covariance’.
Loneliness PGSs were not associated with the loneliness rate of decline (supplementary materials, section C, Table 4; section D, Tables 15–24).
Sensitivity analysis I
When potential depression cases were excluded, the cross-sectional analysis replicated the results. The five personality traits were associated with loneliness. The association between Neuroticism and loneliness was negative and more robust than the other traits. Moreover, the mutually adjusted model also showed an association between Extroversion and Neuroticism, with loneliness. However, Agreeableness was also independently associated with loneliness (Coef. = .126; 95% CI: .013–.239) (see supplementary materials, section E, Table 25).
In the longitudinal analysis, Extroversion was associated with the loneliness rate of decline only in the mutually adjusted model (supplementary materials, section E, Tables 26–27). In the mutually adjusted models, the other four traits completely explained the association between Conscientiousness and loneliness at baseline.
Sensitivity analysis II
When we performed the analysis using only non-depression cases from the extended analytic sample (supplementary materials, section F, Figure 4), the results for the cross-sectional models replicated the ones obtained with the sample constrained to loneliness PGSs (Figure 1). Extroversion, Neuroticism, Agreeableness, Conscientiousness, and Openness to Experience were associated with loneliness. In the mutually adjusted models, Extroversion was negatively associated with loneliness (Coef. = −.384, 95% CI: −.463 to .304) and Neuroticism (Coef. = .539, 95% CI: .480–.598) and Agreeableness (Coef. = .091, 95% CI: .001–.180) were positively associated with loneliness. Notably, the magnitude of the associations was also replicated (supplementary materials, section F, Table 31).
In contrast, in the longitudinal analysis, only Neuroticism was associated with the loneliness rate of decline (supplementary materials, section F, Tables 32–33). Neuroticism was associated with a smaller decrease in loneliness over eight years of follow-up, regardless of social isolation, sociodemographic, economic, and health factors (Coef. = -.009; 95% CI: −.017 to .002). The magnitude of the association remained after adjusting the model by the other four traits (Coef. = −.009; 95% CI: −.017 to .001). In the mutually adjusted model, similar to the original sample with depression cases excluded, the baseline associations replicated the initial sample results; the four traits completely explained the association between Conscientiousness and loneliness.
Finally, Extroversion, Agreeableness, Conscientiousness, and Openness to Experience were not associated with the loneliness rate of decline (supplementary materials, section F, Tables 31–32).
Discussion
To our knowledge, this is the first study about the association between personality traits and loneliness (mean level) and its rate of change over an extensive-time period, using different model specifications and a large set of potential confounders, including loneliness PGSs, social isolation, and sociodemographic, economic, and health factors.
Specifically, our results showed that Extroversion, Neuroticism, Agreeableness, Consciousness, and Openness to Experience had a statistically significant relationship with loneliness' mean levels at baseline regardless of genetic and environmental factors. However, the magnitude of the associations between personality traits and loneliness was substantially reduced when health-related factors were included in the models. The relationship between Extroversion, Neuroticism, and Agreeableness with loneliness remained after the adjustment by the other three traits and the exclusion of potential depression cases. However, in our study, when potential depression cases were excluded, Agreeableness was associated with higher loneliness mean level at baseline, contradicting previous analysed showing a negative association between Agreeableness and loneliness (Buecker et al., 2020). Agreeable individuals usually have smooth and positive relationships. They avoid conflict and empathise with others (Mund et al., 2019). It has been described before that older adults prioritise deeper connections over the number of people (Aartsen et al., 2020; Lim et al., 2020; Mund et al., 2019). Therefore, it is likely that, especially with family tights, higher levels of loneliness are experienced if people do not express their needs to avoid conflict and maintain smooth relationships.
Reassuringly, previous studies have shown similar results on the relationship between personality traits and loneliness. Buecker et al. (2020) showed that in general population samples, Extroversion and Neuroticism had a substantial association with loneliness, while Agreeableness and Conscientiousness had a medium-strength association, and Openness to Experience showed a weak association. Similarly, Hensley et al. (2012) showed that among centenarians, there was a statistically significant relationship between Neuroticism, the Conscientiousness sub-facet ‘Competence’, and the Openness sub-facet ‘Ideas’ with loneliness. Finally, Guthmuller (2022) reported that among older adults 50 years and older in Europe, Extroversion, Conscientiousness, Agreeableness, and Openness were negatively associated with the likelihood of feeling lonely, while Neuroticism showed a positive association.
Notably, when the sociodemographic characteristics were included in the models, except for Neuroticism models, the magnitude of the association between the personality traits and loneliness was also reduced. In the Neuroticism models, only marital status was statistically associated with loneliness, and the magnitude of association slightly increased compared to Model 2. Previously, age, gender, educational level, and marital status have been associated with loneliness (Barreto et al., 2021; Cohen-Mansfield & Parpura-Gill, 2007; Dahlberg et al., 2018; Dahlberg et al., 2022; McDaid et al., 2022; National Academies of Sciences & Medicine, 2020). Particularly, marital status has shown very robust results, with people in partnerships showing lower levels of loneliness (Dahlberg et al., 2022; Victor & Bowling, 2012). These results might reflect the interplay between social risk factors and personal resources in the arise of loneliness previously described by loneliness theoretical models (Aartsen et al., 2020; Cohen-Mansfield & Parpura-Gill, 2007; de Jong Gierveld & Tesch-Römer, 2012).
Loneliness was measured in ELSA every two years, so we analysed the relationship between personality traits with the loneliness rate of change. Loneliness slightly decreased over an eight-year period from our baseline (wave 5 in 2010/11) with significant individual variance, which might be reflecting an age-decreased in loneliness. A previous study using data from NSHAP and the HRS showed that loneliness decreased with age until 75 years old, increasing afterwards (Hawkley et al., 2019) and a metanalysis using 75 studies with 83,679 participants from all ages, found different age-patterns of mean level of loneliness over time. For middle and old adults there was a five-year stability in the mean level of loneliness, with a short-period decreases towards the oldest old ages (80+) (Mund et al., 2019). The authors suggested that these results might be explained by the socioemotional selectivity theory, which states that older adults prioritised close and more intimate relationship over the number of contacts leading to more stable environments (Aartsen et al., 2020; Mund et al., 2019). Moreover, we found individual differences in the rate of decline across waves (see random effect parameters in the supplementary materials, Tables 5-27). These results may reflect different trajectories within the ELSA cohort. A study conducted during COVID-19 showed four individual trajectories of loneliness ranging from low to high (Bu et al., 2020). Additionally, mean level changes in loneliness do not reflect potential rank-order changes over time (Mund et al., 2019).
Notably, the association between personality traits and loneliness rate of decline was not consistent across all the model specifications. In the original study sample, Extroversion was the only trait directly associated with the loneliness rate of decline, even when all traits were added simultaneously. Moreover, after the potential depression cases were excluded, the association was only significant when all five traits were considered. Similarly, the initial relationship between Neuroticism and the loneliness rate of decline was no longer statistically significant after depression was taken into account. In contrast, when we used the extended analytic sample (not restricted to loneliness PGSs), only Neuroticism was directly associated with the loneliness rate of decline. The magnitude of the association between Neuroticism and loneliness rate of decline was stable after the other traits were included. On the contrary, the association between Extroversion and the loneliness rate of decline was statistically significant only when depression cases were considered (data not shown). The sample size and the characteristics of both groups might explain the differences between samples.
Our results highlight the role of depression in the association between Extroversion and Neuroticism with the loneliness rate of change. A genetic association between depression, loneliness, and Neuroticism has been previously reported (Abdellaoui, Chen, et al., 2019; Day et al., 2018). So far, loneliness has been more frequently described as a risk factor for depression (Erzen & Çikrikci, 2018; Lee et al., 2021). However, some depression scales, including the CES-D, consider loneliness a symptom of depression because the clinical diagnostic manuals describe social isolation and feelings of worthlessness as diagnosis criteria (World Health Organization, 2019). Neuroticism, depression, and loneliness share the tendency to negative affect and the lack of trust in others, which might explain their strong association (Goossens et al., 2015; Mund et al., 2019). In the case of Extroversion, other studies have also suggested that Extroversion might be useful as a protective factor only after we consider a person’s tendency to negative affect or clinically significant symptoms of depression (Abdellaoui, Chen, et al., 2019; Kandler et al., 2014). At the same time, these results add evidence to the importance of taking into account the shared variance between the five personality traits and the need to analyse the potential role of the previously described genetic association between Neuroticism and loneliness (Abdellaoui, Sanchez-Roige, et al., 2019; Buecker et al., 2020). Genetic studies have hypothesised that the association between Extroversion and loneliness is due to the strong correlations between Extroversion and Neuroticism (Spithoven et al., 2019). Consistently with the genetic studies, the Big Five-Dimensional Circumplex (AB5C) model, which combines the general circumplex model and the five-factor model, suggests organising the adjectives used to measure personality in ten circumflexes of two different factors with the same level of importance (e.g., Extroversion -, Extroversion +, Neuroticism -, and Neuroticism +) instead of treating the factors as simple structured or bidimensional poles (Bucher & Samuel, 2020; Hofstee, 2003).
There is a scarcity of longitudinal studies analysing the relationship between personality traits and loneliness. To our knowledge, the only similar study was carried out by Ormstad et al. (2020) using data from The Norwegian Life Course, Ageing and Generations Study (NorLAG). They reported gender differences in the relationship between personality traits and the risk of becoming lonely over five years. In contrast, we did not observe any gender differences in associations between personality and changes in loneliness (data not shown). Previously, Cacioppo et al. (2010) analysed the one-year lagged relationship between Neuroticism and loneliness, reporting no statistically significant results, which might be explained by the stability of loneliness levels over short periods of time (Mund et al., 2019).
We also found an unadjusted and adjusted, statistically significant but weak association between the loneliness PGSs and the loneliness phenotype. Previously, Gao et al., (2017) concluded that loneliness seems to be influenced by many common genetic variants of small effect, where individual variants have very modest contributions. Similar to our results, previous studies analysed the hereditability and genetic risk for loneliness (Abdellaoui et al., 2018, 2019a, 2019b). Notably, when Extroversion, Agreeableness, Conscientiousness, and Openness to Experience were the primary exposures, we observed that the association between the loneliness PGSs and loneliness at baseline remained stable after considering the health factors. Contrary, when Neuroticism was the main exposure, or the traits were mutually adjusted, the association between the loneliness PGSs and loneliness at baseline did not remain statistically significant at conventional levels. The genetic risk of loneliness might have a lower contribution to the phenotype when we consider a trait like Neuroticism and older people living conditions, including their health status (Abdellaoui, Sanchez-Roige, et al., 2019). In the same line of results, when considering the rank-order stability of the traits and loneliness, the genetic risk seems to play a more substantial role in the early years of life, while in adulthood, environmental factors have a stronger contribution (Mund et al., 2019). Future research should also analyse the interplay between the polygenic risk for loneliness, personality traits, and depression to predict loneliness.
The PGSs were not a predictor of the loneliness rate of decline. Even when accounting for the individual variances, we might not have captured individual trajectories. The associations between the loneliness PGSs and the loneliness change in time should be analysed in detail by observing the individual trajectories of loneliness and the rank-order stability.
The analysis of the relationship between personality traits and loneliness might have public health implications. In separate studies, loneliness and personality traits have shown an association with health behaviours and health outcomes. Loneliness is associated with increased risk for depression, dementia, sleep disorders, low fruit or vegetable intake, risk of alcohol intake, physical inactivity, and an increment in primary care consultations among older adults (Algren et al., 2020; Gerst-Emerson & Jayawardhana, 2015; Hawkley & Capitanio, 2015; Holt-Lunstad et al., 2015; Lee et al., 2021; Malhotra et al., 2021). On the other hand, low Neuroticism and high Consciousness are linked to positive health behaviours and health outcomes (Hengartner et al., 2016; Turiano et al., 2018). In our study, Neuroticism had a strong relationship with loneliness, even when other traits were taken into account. Greater Neuroticism was related to higher levels of loneliness with less variability over time. However, the relationship between Neuroticism with the loneliness rate of decline was strongly dependent on depression when we considered the loneliness genetic risk. The measurement of personality traits in primary care settings could help to improve prevention strategies among the populations more at risk of developing negative health behaviours and health problems. For instance, the NHS social prescribing program might benefit from the information about the levels of loneliness and personality traits to design its personalised plans and train the link workers. Even though our results showed that Extroversion and Neuroticism are somehow associated with loneliness changes over time, it would be more beneficial to consider individual profiles using the five traits due to their intercorrelation.
The results of our study might be helpful in clinical settings. Interventions targeting loneliness among older adults mainly focus on social connections or dysfunctional thoughts and are partially effective. There is still a gap for improvement if the aim is for people to return to a healthy level of loneliness (Christiansen et al., 2021). It has been pointed out that other factors surrounding loneliness, such as the expectations of social interactions and motivations to communicate, are important (Aartsen et al., 2020; Cacioppo et al., 2015). For instance, more extrovert people have a higher predisposition to connect with others. In contrast, people with higher levels of Neuroticism might need more motivation to connect with others and expect positive results from social interactions (Caspi et al., 2005; Kandler et al., 2014). Interventions for loneliness using information about the relationship between loneliness and personality traits might improve their effectiveness.
Limitations and future research
Our study has some limitations. Firstly, missing follow-up information is always an issue in longitudinal studies. Therefore, there was a significant reduction of loneliness observations from waves 5 to 9 that might be affected the results related to the rate of change in loneliness. We imputed independent variables and confounders at baseline, used LMMs to overcome issues linked to missing information between waves and used bootstrap errors to obtain more precise confidence intervals. Secondly, most of the core members in ELSA are white Europeans. Consequently, our findings might have an external validity issue. Future research might replicate this study using HRS or other sister surveys with a wider ethnicity variety. Thirdly, we assessed loneliness using the three items R-UCLA scale. While helpful to overcome stigma and biases in admitting to loneliness, this brief indirect measure might be insufficient to capture the complex nature of loneliness. New studies should consider combining the three items of UCLA and a direct question about loneliness. Future studies could also consider a measure that distinguishes emotional and social loneliness. Fourthly, we could have had selection bias and power sample issues in the original sample of our study due to the availability of PGSs for around 60% of the ELSA wave five and unbalanced clustering due to the number of follow-up measurements. To overcome those limitations, we used multilevel LMMs, a valuable tool for handling unbalanced cluster data and performed a sensitivity analysis using the complete sample with loneliness information available.
Despite the limitations, the present study results are valuable as they represent the first exploration of the association between personality traits and the loneliness rate of change while considering polygenic risk for loneliness, social isolation, and sociodemographic, economic, and health factors in the context of a population-based cohort of older adults.
Supplemental Material
Supplemental Material - Personality traits and loneliness among older people in the United Kingdom: Cross-sectional and longitudinal analysis from English Longitudinal Study of Ageing cohort
Supplemental Material for Personality traits and loneliness among older people in the United Kingdom: Cross-sectional and longitudinal analysis from English Longitudinal Study of Ageing cohort by Thamara Tapia-Munoz, Olesya Ajnakina, Daisy Fancourt, and Andrew Steptoe in European Journal of Personality.
Footnotes
Acknowledgements
All authors attest they meet the ICMJE criteria for authorship and have approved the final article.
Declaration of conflicting interests
The author(s) declared no potential conflicts of interest with respect to the research, authorship, and/or publication of this article.
Funding
The author(s) disclosed receipt of the following financial support for the research, authorship, and/or publication of this article: This work was supported by the Chilean National Research and Development Agency (Scholarship ID 72210393, Scholarship for postgradu).
Open Science Statement
All waves from the English Longitudinal Study of Ageing (ELSA) are available on the study Web site https://www.elsa-project.ac.uk. ELSA data is publicly available after registration on the Web site, and ELSA genetic data can be obtained after completing an application form. For this reason, we will provide the scripts to recreate the dataset used in the present study using the data available on the ELSA Web site. See the do files at https://osf.io/tev4c/ (Foster & Deardorff, 2017).
Supplemental Material
Supplemental material for this article is available online.
References
Supplementary Material
Please find the following supplemental material available below.
For Open Access articles published under a Creative Commons License, all supplemental material carries the same license as the article it is associated with.
For non-Open Access articles published, all supplemental material carries a non-exclusive license, and permission requests for re-use of supplemental material or any part of supplemental material shall be sent directly to the copyright owner as specified in the copyright notice associated with the article.