
Abstract
In the current study, common and unique genetic and environmental influences on personality and a broad range of well-being measures were investigated. Data on the Big Five, life satisfaction, quality of life, self-rated health, loneliness, and depression from 14,253 twins and their siblings (age M: 31.82, SD: 14.41, range 16–97) from the Netherlands Twin Register were used in multivariate extended twin models. The best-fitting theoretical model indicated that genetic variance in personality and well-being traits can be decomposed into effects due to one general, common factor (Mdn: 60%, range 15%–89%), due to personality-specific (Mdn: 2%, range 0%–78%) and well-being-specific (Mdn: 12%, range 4%–35%) factors, and trait-specific effects (Mdn: 18%, range 0%–65%). Significant amounts of non-additive genetic influences on the traits’ (co)variances were found, while no evidence was found for quantitative or qualitative sex differences. Taken together, our study paints a fine-grained, complex picture of common and unique genetic and environmental effects on personality and well-being. Implications for the interpretation of shared variance, inflated phenotypic correlations between traits and future gene finding studies are discussed.
Policy makers and the scientific community have shown an increasing interest in well-being, recognizing its impact on individuals’ physical and mental health, and other positive outcomes such as work productivity, marital satisfaction, and educational achievement (Diener et al., 2018). In broad terms, well-being refers to an individual’s general emotional and cognitive evaluation of life, that is, the extent to which one’s desires, needs, and aspirations are fulfilled (Diener, 1984). The most common conceptual distinction is made between subjective and psychological well-being (Deci & Ryan, 2008; Ryff, 1989). Subjective well-being (SWB) is defined as the cognitive and affective evaluation of one’s life. The cognitive aspect of SWB is often measured by life satisfaction or quality of life, while the affective aspect is measured by (the presence of) positive affect and (the absence of) negative affect (Diener, 1984). Psychological well-being (PWB) reflects a broad evaluation of positive functioning, including dimensions such as autonomy and purpose in life, typically measured using Ryff’s PWB scales (Ryff, 1989). The current study focuses on SWB.
Insights into the determinants of well-being are needed to, for example, assure that well-being interventions are successful. Previous research has shown that well-being is associated with life events, socio-economic factors, and social relationships (Diener et al., 2018). Another important finding is the consistent association between the Big Five personality traits and well-being (Anglim et al., 2020; Costa & McCrae, 1980; DeNeve & Cooper, 1998; Diener et al., 2003; Emmons & Diener, 1985; Kim et al., 2018; Lucas & Diener, 2009; Soto, 2015; Steel et al., 2008). Given the definition of well-being as the fulfillment of one’s desires and needs and the relative amounts of positive and negative emotions experienced (“hedonic balance”; Bradburn, 1969), personality can be expected to relate to how one evaluates his or her life. Neuroticism is almost intrinsically linked with the negative affect component of well-being as it represents a general disposition to experience more frequent and intense negative emotions, anxiety, and worry, showing strong associations with depression (e.g., Costa & McCrae, 1980; Larsen & Ketelaar, 1991). Extraversion, on the other hand, is related to experiencing positive mood states and preserving social relationships, which may lead to higher levels of well-being (e.g., Costa & McCrae, 1980; Kim et al., 2018; Larsen & Ketelaar, 1991). Similarly, the warmth, kindness, and generousness implied by Agreeableness foster interpersonal relations which may lead to higher well-being (McCrae & Costa, 1991). In addition, personality is associated with one’s hopes, aspirations, and goals, and related to the ability to meet them (DeYoung, 2015). For example, people higher in Conscientiousness tend to show more goal-directed, diligent behavior, and strive for high achievements, making them more likely to achieve their life goals (e.g., McCrae & Costa, 1991).
In line with these arguments, strongest and most consistent associations with well-being are found for Neuroticism and Extraversion, followed by Conscientiousness and Agreeableness. Smallest and inconsistent effects are found for Openness. This is reflected in the most recent and comprehensive meta-analysis to date (Anglim et al., 2020), reporting phenotypic correlations of −.39 for Neuroticism, .32 for Extraversion, .08 for Openness, .20 for Agreeableness, and .27 for Conscientiousness, with life satisfaction. Subtle differences in associations with positive affect (−.34, .44, .24, .19, and .35, respectively) and negative affect (.56, −.21, −.05, −.25, and −.25) are found.
An explanation for these associations may also be sought in overlapping genetic and environmental influences (Hahn et al., 2013; Keyes et al., 2015; Røysamb et al., 2018; Sadiković et al., 2018; Weiss et al., 2008). Previous studies, however, are often limited by the focus on genetic overlap between specific Big Five factors (mostly Extraversion, Neuroticism, and Conscientiousness; Hahn et al., 2013; Røysamb et al., 2018) and/or specific well-being measurements (e.g., life satisfaction; Hahn et al., 2013; Røysamb et al., 2018). In addition, it is well known that self-reported personality traits share part of their variance (Kallio Strand et al., 2021; Schimmack & Kim, 2020; van der Linden et al., 2010), and the same holds for self-reports of different well-being measures (Bartels & Boomsma, 2009; Longo et al., 2017). By investigating the genetic overlap between specific traits (e.g., Neuroticism—life satisfaction), previous studies have failed to control for these common variances, which may have led to conflated estimates of the genetic associations.
In the current study, we investigate the genetic and environmental architecture underlying all Big Five traits and a broad set of well-being measures in a large population sample (Netherlands Twin Register; Ligthart et al., 2019). The set of well-being traits is based on a recent study showing that at the molecular genetic level, well-being can be conceptualized as a broad spectrum encompassing a wide range of traits (the “well-being spectrum” or 5-WBS; Baselmans et al., 2019b). From a larger pool of traits, Baselmans and colleagues derived this spectrum consisting of a positive (defined by life satisfaction, positive affect, and self-rated health), and a negative end (Neuroticism, depressive symptoms, and loneliness), with a high genetic correlation (rg = .86; reflecting the extent to which the genetic factors underlying the traits overlap). The advantage of this model is that it covers a wide range of measures, capturing the broader well-being domain. It hereby lends itself well for answering our first research question, on the extent to which genetic and environmental effects on personality and well-being are common (i.e., to both), domain-specific (i.e., common only to personality traits, and common only to well-being traits), and trait-specific.
In addition to novel insights into common and unique genetic and environmental effects, the present study’s large sample size and the inclusion of siblings allows for answering our second research question on the nature of the genetic effects (additive vs. non-additive; detailed below). Our third and final research question focuses on sex differences: the literature shows consistent mean sex differences in Big Five scores (Costa et al., 2001; Schmitt et al., 2008), while mixed findings are found for well-being (Batz & Tay, 2018; Batz-Barbarich et al., 2018) and related traits (e.g., loneliness; Maes et al., 2019). By including same-sexed and opposite-sexed twin pairs, we aim to explain these findings by investigating sex differences in genetic and environmental effects. In the following section, the research questions are discussed in detail.
Genetic Overlap Between Personality and Well-Being
Meta-analyses on twin studies have indicated that personality traits and well-being are both moderately heritable, with estimates around 40% for well-being traits (Bartels, 2015; Nes & Røysamb, 2015) and around 50% for personality (Johnson et al., 2008; Vukasović & Bratko, 2015). Heritability expresses the proportion of variance in a trait that is due to genetic differences between individuals. When two traits are analyzed jointly, the bivariate heritability expresses the proportion of the covariance between traits due to genetic effects (de Vries et al., 2021). Previous studies have consistently shown that especially Neuroticism, Extraversion, and Conscientiousness show sizeable genetic overlap with well-being (Hahn et al., 2013; Keyes et al., 2015; Røysamb et al., 2018; Sadiković et al., 2018; Weiss et al., 2008). Bivariate heritability estimates varied from 49% (Røysamb et al., 2018) to around 75% (Keyes et al., 2015; Sadiković et al., 2018). In addition, relatively high genetic correlations between well-being, and Neuroticism (∼ −.50 to −1) and Extraversion (∼ .50–.70) are reported, and smaller values for the other Big Five traits (∼ .30–.40). Some studies have found no unique genetic effects on happiness (Weiss et al., 2008) and life satisfaction (Hahn et al., 2013) apart from personality traits, whereas others have found that genetic effects were not completely shared (Keyes et al., 2015; Røysamb et al., 2018; Sadiković et al., 2018).
These results largely generalize to other traits associated with well-being. For example, Conscientiousness and especially Neuroticism are phenotypically and genetically associated with depression (Kendler et al., 2006). Of all the Big Five factors, Neuroticism is (genetically) most strongly linked to loneliness, followed by Extraversion and Conscientiousness (Abdellaoui et al., 2019; Baselmans et al., 2019b; Schermer & Martin, 2019). Genetic and phenotypic personality correlations with self-rated health are generally small to moderate and seem to be mostly driven by Neuroticism (Harris et al., 2017; Kööts–Ausmees et al., 2016). Personality and well-being thus share genetic influences, but estimates differ across traits and studies.
Given these differences, the operationalization of well-being will largely influence the estimated genetic and environmental overlap with personality. Practically, using a multi-indicator measure instead of a single measure of well-being increases its reliability, reducing measurement errors, thereby increasing (bivariate) heritability estimates (Hahn et al., 2013; Lykken & Tellegen, 1996). Theoretically, well-being is conceptualized as a broad multi-faceted construct. As noted, the most common distinction is made between SWB and PWB, but a proliferation of well-being models and measures have been developed over the years combining elements of both, and to which new elements are sometimes also added (Cooke et al., 2016). It has become increasingly clear that a strong general well-being factor underlies all the different well-being models and measures (Longo et al., 2017). Multiple lines of evidence lead to this conclusion. First, within domains, correlations between SWB traits (positive affect, negative affect, and life satisfaction), and correlations between PWB traits (i.e., Ryff’s scales), respectively, suggest a general SWB factor (Busseri, 2018) and general PWB factor (Abbott et al., 2006; Ryff & Keyes, 1995). Second, correlations between these (latent) SWB and PWB factors are often so high that it is difficult to distinguish between them (∼ .60–.90; Disabato et al., 2016; Gallagher et al., 2009; Joshanloo, 2016; Keyes, 2002). Third, this lack of discriminant validity extends to other models and measures of well-being (e.g., Goodman et al., 2018). Finally, at the genetic level, high levels of pleiotropy (i.e., the same genes influencing multiple traits) are found between different measures of well-being, both within and across the SWB and PWB domains (Bartels & Boomsma, 2009; Baselmans & Bartels, 2018).
Each particular measure of well-being (e.g., life satisfaction or positive affect) will thus capture (genetic) variance shared with other well-being measures, and to some extent unique (genetic) variance. The relative amounts of common and unique effects will presumably differ across traits: more general evaluations (e.g., quality of life) will capture “general well-being” more than specific traits (e.g., self-rated health). To get a detailed understanding of the genetic overlap between well-being and personality, it thus seems wise to first take shared domain-specific genetic and environmental overlap into account.
A similar argument can be made for the shared variance among self-reported personality traits. At the phenotypic level, modest amounts of shared variance are found (∼ 20%–60%; van der Linden et al., 2016). At the genetic level, substantial pleiotropic effects underlying multiple or all of the Big Five are also found (Keyes et al., 2015; Weiss et al., 2008). Although there is a debate on what this shared personality variance represents, either self-enhancement or social desirability (Bäckström et al., 2009; Kim et al., 2012; Schimmack & Kim, 2020), or social effectiveness (van der Linden et al., 2016), recent studies in the well-being context suggest that large parts of it can be attributed to evaluative biases. These multi-trait-multi-method (MTMM) studies used self and informant ratings of both personality and well-being to separate trait from method variance (Kallio Strand et al., 2021; Kim et al., 2012; Schimmack & Kim, 2020). They showed that the shared personality variance was strongly related to self-reported well-being, but much less to well-being as reported by others. This implies that the shared personality variance largely captures evaluative biases confined to mono-method measurements (Anusic et al., 2009; Chang et al., 2012). Importantly, not accounting for the shared variance substantially inflated the Big Five correlations with well-being. Nevertheless, when the shared variance was accounted for, personality traits still had sizeable (but reduced) unique associations with well-being, most notably Neuroticism, Extraversion, and Conscientiousness (see Biderman et al. (2018) and Kim et al. (2018) for similar conclusions based on mono-method data). In the current study, we investigate whether these findings translate to genetic associations: although our measures are limited to self-reports, it is clear that accurate estimates of the genetic overlap between personality and well-being are obtained when the shared variance among traits within a domain is controlled for. Research question 1 (RQ1). To what extent do genetic and environmental effects on the Big Five personality traits overlap with a broad range of well-being measures, that is, to what extent are they common to both personality and well-being, domain-specific, and trait-specific?
Additive versus Non-additive Genetic Variance
Genetic variance in a trait can be divided into additive and non-additive effects (Neale & Cardon, 1992). Additive genetic factors (A) represent the sum of the effects of alleles over all genetic loci influencing a trait. Non-additive genetic factors concern interactions between alleles which can occur in two ways, namely at the same locus (dominance) or between alleles at different loci (epistasis). Typically, only non-additive dominance (D) effects are estimated in twin models. If dominance occurs, average allelic effects do not add up in a simple linear fashion. The consequence of dominant genetic effects on a trait is that family resemblance on the trait is reduced (compared to when genes are passed on to offspring in a simple additive fashion). Quantifying the amount of non-additive genetic variance in a trait is important for at least two reasons. First, it limits the size of parent-offspring associations possibly resulting in biased heritability estimates in, for example, pedigree designs (D’Onofrio et al., 2003). Second, molecular genetic designs, such as Genome-Wide Association Studies (GWAS) often assume a simple, additive genetic model (Visscher et al., 2017). The presence of non-additive genetic effects may partly explain why heritability estimates based on additive GWAS are much lower than heritability estimates based on twin studies (Polderman et al., 2015).
Previous studies on the amount of additive and non-additive genetic effects on personality and well-being remain inconclusive. For personality, studies using the classical twin design (CTD) have found little evidence for the presence of non-additive genetic variance in personality traits (e.g., Eaves et al., 1989; Gillespie et al., 2003; Kandler et al., 2009). However, detecting non-additive (vs. additive) effects requires more power and thus larger samples or information on additional relatives of twins (Posthuma & Boomsma, 2000). Studies using “extended twin designs” have found substantial amounts of non-additive variance for personality (Eaves et al., 1999; Hahn et al., 2013; Keller et al., 2005) and well-being (Bartels & Boomsma, 2009; Hahn et al., 2013; Stubbe et al., 2005), and their overlap (Hahn et al., 2013). Research, however, has mostly been limited to life satisfaction as well-being measure. Additional research on a broader range of measures in larger sample sizes is thus needed to arrive at more definitive conclusions on the influence of non-additive genetic factors. Research question 2 (RQ2). To what extent are personality and well-being influenced by non-additive genetic variance?
Sex Differences
Sex differences in the Big Five personality traits are relatively consistent across studies (Costa et al., 2001; Schmitt et al., 2008; Weisberg et al., 2011). Females tend to report substantially higher mean levels of Neuroticism and Agreeableness than men, while smaller differences are found for Extraversion. No consistent differences are found for Openness and Conscientiousness. For well-being, results are more inconsistent. This may be due to variable sex differences across different components of well-being. For happiness or positive affect, sex differences in both directions are found, while for life satisfaction there appear to be no differences between males and females (Batz & Tay, 2018; Batz-Barbarich et al., 2018). At the same time, females usually have higher negative affect scores than males (Batz & Tay, 2018). For self-rated health, females tend to report lower levels compared to males (Idler, 2003). Females report higher depression levels than males (Ferrari et al., 2013), although a recent meta-analysis showed no sex differences for loneliness (Maes et al., 2019) which is strongly linked to depression (Heinrich & Gullone, 2006). The non-significant or inconsistent findings for overall well-being may thus be explained by conflating specific differences on the underlying dimensions when multiple measures are aggregated into a general score (Batz & Tay, 2018).
Theories on sex differences in personality and well-being can broadly be divided into three categories: (1) structural, (2) socio-cultural, and (3) biological/evolutionary. Structural theories focus on the different economic, educational, political, and social opportunities for males and females (Batz & Tay, 2018). Socio-cultural theories focus on gender norms and roles, hypothesizing that sex differences occur because males and females are socialized to behave differently in society (Eagly & Wood, 1999; Wood & Eagly, 2002). Biological theories state that sex differences can be explained by innate biological, for example, genetic, differences between males and females (Buss, 1997). These differences are proposed to have evolved through evolutionary sexual pressures for parental investment related to reproductive success (Trivers, 1972). This may have led men, less concerned with raising offspring and more with competing for mating opportunities, to show more risk-taking and dominant behaviors. Females, on the other hand, are thought to have been selected on cautious, nurturing, and agreeable traits, benefiting the successful upbringing of children. Naturally, sex differences in personality and well-being may also be explained by a combination of structural, socio-cultural, or biological processes (Weisberg et al., 2011). For example, differences in the developmental level and egalitarian values across countries may exaggerate or attenuate existing (biological) differences between males and females (Schmitt et al., 2008).
One way to increase our understanding of sex differences in traits is by investigating differences in their underlying genetic and environmental effects. In twin models, quantitative and qualitative sex differences can be distinguished (Neale & Cardon, 1992). Quantitative sex differences exist when the same genes influence a trait but to a different degree for males and females, indicated by different heritability estimates. When sex differences exist in the (sets of) genes contributing to the variation in a phenotype, then this indicates qualitative sex differences. Previous studies have presented little evidence for both types of sex differences in personality (South et al., 2018); a few primary studies find quantitative or qualitative sex differences, but only for some factors (e.g., Neuroticism; Eaves et al., 1998) or specific samples (e.g., adolescents; Rettew et al., 2008), while a recent meta-analysis found no effect of sex on the heritability of personality (Vukasović & Bratko, 2015). For well-being, no studies have found qualitative sex differences, and the majority of studies did not find quantitative sex differences, with some exceptions finding a slightly higher heritability for females (Bartels, 2015; Bartels et al., 2010, 2013; Keyes et al., 2010; Nes et al., 2008, 2010a; Røysamb et al., 2002; Stubbe et al., 2005). These studies, however, are limited by either the range of well-being measures (mostly life satisfaction), age (focusing on adolescents), and/or smaller sample sizes. Since detecting sex differences requires large groups of same-sexed and opposite-sexed twins (Verhulst, 2017), additional research within a larger sample and on more measures is needed to arrive at improved estimates for sex differences. Research question 3 (RQ3). Are there (a) quantitative or (b) qualitative sex differences in genetic and environmental effects on personality and a broad range of well-being measures?
Method
Sample
Participants were voluntary members of the Netherlands Twin Register (NTR; Ligthart et al., 2019) and part of a large longitudinal survey study in which twins and their families are periodically surveyed. For the current study, data from adult twins and their siblings from Survey 8 (2009) and Survey 10 (2013) were used (Ligthart et al., 2019). When data for one twin was only available at one time point, and for the co-twin at two time points, we used the data from the time point for which both twins had data. When no co-twin data were available, we used the last recorded response available for the single twins. To increase statistical power, a sibling closest in age to the twins was included in the analyses (Posthuma & Boomsma, 2000). To maximize the number of siblings, this selection was made regardless of the time point of the sibling’s response.
The total sample consisted of 14,253 individuals (age M = 31.82, SD = 14.41, range 16–97) from 8232 families, with 67% of the sample being female (N = 9532). Sibling data were available for 1671 individuals (1035 female, 62%). The sample consisted of 1094 monozygotic male (MZM) twin pairs (629 complete, 465 incomplete), 780 dizygotic male (DZM) twin pairs (348 complete, 432 incomplete), 2505 monozygotic female (MZF) twin pairs (1683 complete, 822 incomplete), 1563 dizygotic female (DZF) twin pairs (804 complete, 759 incomplete), and 2290 dizygotic opposite-sex (DZO) twin pairs (894 complete, 1396 incomplete). In total, there were 1145 twin-sibling trios, and 526 single twin-sibling pairs. Because of missing data on our variables, the number of responses varied across traits (see Supplementary Table S1 for a detailed overview of the number of responses per variable).
Measures
Personality
Personality was assessed by the 60-item NEO-FFI-3 (Costa & McCrae, 2010) questionnaire. The Big Five factors were measured by 12 items each. Participants were asked to select the response that best represented them on a 5-point scale: 0–Strongly Agree, 1–Agree, 2–Neutral, 3–Disagree, 4–Strongly Disagree. Example items are “I really enjoy talking to people” (Extraversion) and “I rarely feel lonely or blue” (Neuroticism, reverse coded). Reliabilities (Cronbach’s alpha) in the current sample were .87, .80, .74, .71, and .81 for Neuroticism (Ne), Extraversion (Ex), Openness (Op), Agreeableness (Ag), and Conscientiousness (Co), respectively.
Well-Being
Quality of life (QOL)
The Cantril Ladder (Cantril, 1965) was used to measure QOL. Participants were presented the question “Where on the scale would you put your life in general?”, and responded on a ten-point scale, with a score of 10 being the best life imaginable, and 1 being the worst life imaginable. The QOL retest correlation (with an average interval of 4 years) in our current sample was r = .49, comparable to previous studies (Anusic & Schimmack, 2016).
Satisfaction with life (SAT)
Life satisfaction was assessed with the 5-item SAT scale (Diener et al., 1985), which uses a 7-point Likert scale. It represents a global measure of overall, general life satisfaction. Scores on the individual items are summed to create a life satisfaction score for each respondent. An example item is “I am satisfied with my life.” The reliability of the scale was .87 in the current sample.
Self-rated health (SRH)
Self-rated health was measured using the single item “How would you rate your general health?”, the response options being “Bad,” “Poor,” “Fair,” “Good,” or “Excellent.” Although being limited to a single item, the measure has proven to be a reliable and valid measure of overall health in previous studies (McDowell, 2006). The SRH retest correlation (with an average interval of 4 years) in our current sample was r = .55.
Depression (DEP)
The Anxious-Depressed syndrome scale from the Adult Self Report (Achenbach & Rescorla, 2003) was used as a measure for depression. It includes 14 items (e.g., “I feel that no one loves me”) measuring the presence of depressive symptoms with a response scale ranging from 0 to 2 (0 = not true, 1 = somewhat true, 2 = very true or often true). The items were summed resulting in a sum score (range from 0 to 28), with higher scores indicating higher levels of depression. However, the resulting sum score was highly skewed to the right (i.e., many zero scores), which could lead to biased estimates if used in twin models (Purcell, 2002). To prevent this, we transformed the depression score into an ordinal variable with three categories (low, middle, and high), and specified a liability threshold model with two thresholds for this variable. In threshold models, it is assumed that the categorical variable has an underlying continuous liability score which is normally distributed (Reich et al., 1972). The reliability of the scale in the current sample was .91.
Loneliness (LON)
To measure loneliness, the Three-Item Loneliness Scale (TIL Scale; Hughes et al., 2004) was used. Each item (e.g., “How often do you feel that you lack companionship?”) is rated on a 3-point Likert scale (1 = Hardly ever, 2 = Some of the time, and 3 = Often), resulting in scale scores ranging from 3 to 9. Because this variable was also highly skewed, a liability threshold model with two thresholds—creating three categories (low, middle, and high)—was applied to the loneliness score. The scale’s reliability was .75.
Analyses
Multivariate extended twin models were fitted to answer our research questions. These models use information on the genetic similarity of monozygotic (MZ) twins (100%), dizygotic (DZ) twins (∼50%), and their non-twin siblings (∼50%) to estimate genetic and environmental effects in structural equation models. In this way, two important insights into the relationship between traits can be gained: the decomposition of the observed (co)variance in genetic and environmental sources (i.e., variance components) and their genetic and environmental correlations (Boomsma et al., 2002; de Vries et al., 2021).
Different variance components can be distinguished. Additive genetic factors (A) and non-additive genetic factors (labeled D, for dominance) have previously been discussed. Shared environmental factors (C) capture the variance that is shared by family members, while non-shared environmental factors (E) represent the part of the total variance that is unique to a certain individual, and also includes measurement error. Technically, only when specific constraints are met, all A, C, D, and E variance components can be estimated in multivariate extended twin designs (Boomsma et al., 2021). However, previous studies have found little evidence for shared environmental influences on well-being (Bartels, 2015; Nes & Røysamb, 2015), personality (Johnson et al., 2008), and their overlap (Hahn et al., 2013). In addition, to answer RQ2, on the presumed influence of non-additive variance on (the overlap between) personality and well-being related traits, we were interested in the influence of D. For the remainder of the paper, we therefore focus on models including additive (A), non-additive (D), and non-shared environmental (E) effects.
In addition to genetic influences on the traits’ variances (heritability) and covariances (bivariate heritability), genetic correlations between traits can be computed which reflect the extent to which the genetic factors influencing one trait overlap with the genetic factors that influence the other trait. Similarly, environmental correlations reflect the overlap of the environmental factors underlying the traits. Because the E components partly capture measurement error, environmental correlations also reflect correlated errors.
Sex differences in the genetic architecture of traits can be inferred from differences in the twin correlations between males and females. To answer RQ3a, on quantitative sex differences, differences between monozygotic females (MZF) versus monozygotic males (MZM), and dizygotic females (DZF) versus dizygotic males (DZM) correlations were tested since these, when present, indicate quantitative sex differences. To answer RQ3b, differences in DZO twin pairs correlations compared to DZF and DZM correlations were tested since differences between them indicate presence of qualitative sex differences.
Statistical Models
Saturated Model
Before estimating variance components, saturated models were fitted in which means, thresholds, and (co)variances were estimated freely for different zygosity groups and males and females separately. 1 These models were used to test several twin-sibling model assumptions (e.g., twin-specific effects). We subsequently tested whether means, thresholds, variances, and covariances could be equated across twins and siblings, zygosity group, and across sexes. Age was included as a covariate on the means and thresholds, because age can bias heritability estimates (McGue & Bouchard, 1984).
Cholesky ADE Model
To gain a first, general picture of the underlying sources of (co)variances among the personality and well-being traits, a Cholesky ADE decomposition model was fit to the data (Supplementary Figure S1). In this baseline model, the phenotypic covariance matrix is decomposed into ADE factors by freely estimating all (co)variance components, without assuming any underlying theoretical structure.
Theoretical Models
For the decomposition of genetic and environmental effects into common and specific factors, two types of models can be used, independent pathway (IP) and common pathway (CP) models. In IP models, A, D, and E are conceptualized as one or more (orthogonal or correlated) latent global factor(s) directly influencing the phenotypes (see Supplementary Figure S2A and S3A). In addition to variance components that capture the variance common to multiple traits, specific variance components for each trait can be modeled. These residual factors capture the genetic and environmental variance in each phenotype that remains after common genetic and environmental effects are accounted for (see As, Ds, and Es in Figure 1). CP models are partly analogous to IP models since they also decompose phenotypic variance in common and specific factors. However, in CP models, the genetic and environmental effects are mediated by one (see Supplementary Figure S2B) or more latent phenotypic factors (see, for example, Supplementary Figure S3B), which capture the phenotypic overlap (i.e., the shared variance) among its indicators. Thus, genetic and environmental influences cause individual differences in the latent phenotype, in turn influencing the observed indicators. Best-fitting three (bi-)factor independent pathway model (Model 4) for a single twin. Note. Ne = Neuroticism, Ex = Extraversion, Op = Openness, Ag = Agreeableness, Co = Conscientiousness, SAT = satisfaction with life, QOL = quality of life, SRH = self-rated health, DEP = depression, LON = loneliness, GF = general factor. A1, A2, A3 = additive genetic variance, D1, D2, D3 = non-additive genetic variance, E1, E2, E3 = environmental variance. The subscript s indicates phenotype trait-specific residual variance (for sake of readability, only specific factors for Neuroticism are shown).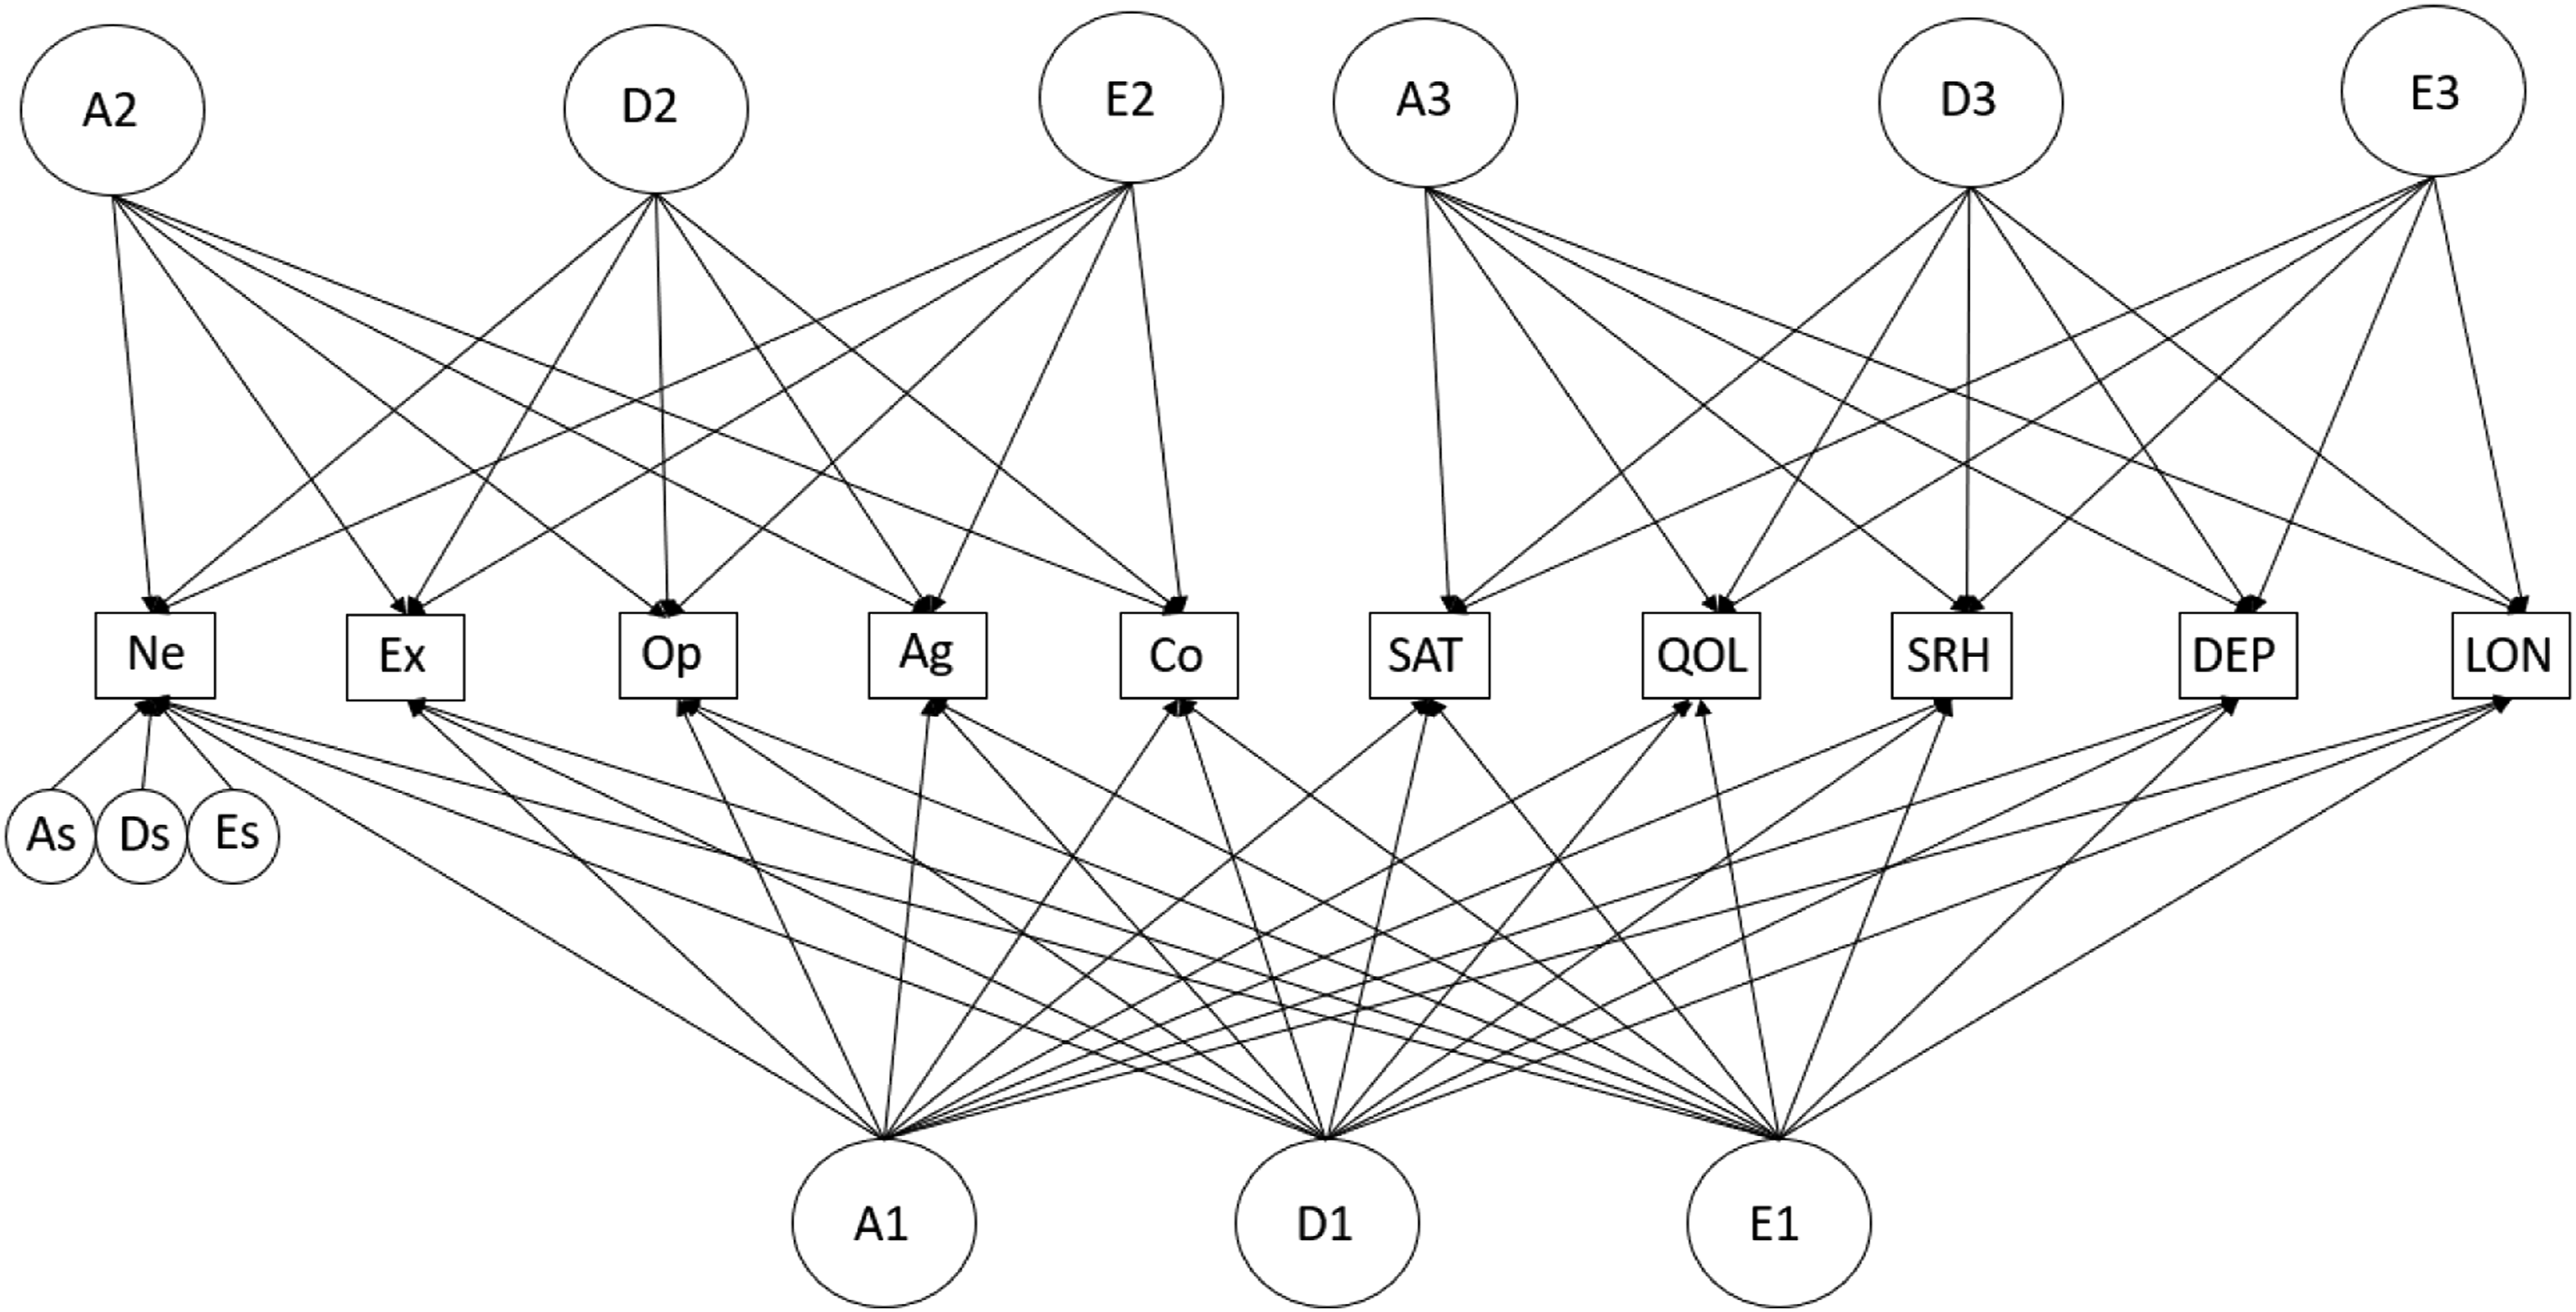
In the current study, a series of IP and CP models were fitted to uncover the underlying common factor structure of genetic and environmental effects on personality and well-being. The number and nature of factors of our theoretical models were based on previous studies (Baselmans et al., 2019b; Keyes et al., 2015; van der Linden et al., 2010). Because the IP models consistently showed improved fit compared to the CP models, only the former are described below and their results presented. Results on the CP models can be found in the Supplemental Materials (Supplementary Table S2). In addition to the described common factors below, trait-specific residual latent ADE factors were estimated in each model. 2
Model 1) Single-Factor Model
In this model, all 10 phenotypes are assumed to be influenced by one single general A factor, one D factor, and one E factor (Supplementary Figure S2).
Model 2) Two-Factor Model—Personality and Well-Being
In the two-factor model, the five personality factors are assumed to be influenced by one set of ADE factors, while the five well-being traits are influenced by a separate set of ADE factors (Supplementary Figure S3). The two latent factors of the same variance component (e.g., A1–A2, D1–D2, and E1–E2) were allowed to correlate with each other.
Model 3) Three-Factor Model—Personality, Positive Well-Being, and Negative Well-Being
In this three-factor model, the Big Five personality traits load on one factor. Based on previous research (Baselmans et al., 2019b), we specified a positive well-being factor with loadings on SAT, QOL, and SRH, and a negative well-being factor formed by DEP and LON (Supplementary Figure S4). Again, correlations between the latent factors (within variance component) were specified.
Model 4) Three-Factor Model—General factor, Personality, and Well-Being
In this model, three groups of ADE factors are also estimated, but in a bi-factor approach (Holzinger & Swineford, 1937). In our bi-factor model, all 10 phenotypes load on one general factor, while two additional “domain-specific factors” are specified: one personality factor on which all of the Big Five load, and one well-being factor on which the well-being traits load. In this model, the latent factors are not allowed to correlate: any correlation between the factors is captured by the common, general factor. Note that this model is similar to Model 2 (Supplementary Figure S3), with the addition of a general overarching factor with loadings on all phenotypes in place of the latent correlations in the IP model (Figure 1) or cross-paths in the CP model (Supplementary Figure S5B).
Model 5) Four-Factor Model—General factor, Personality, Positive Well-Being, and Negative Well-Being
This four-factor model is also specified as a bi-factor model and similar to Model 3 with the only difference being the addition of an overarching general factor on which all phenotypes load. Again, in this model, the latent factors are specified as being orthogonal (Supplementary Figure S6).
For completeness, all theoretical models were directly fitted to the data, rather than first fitting all phenotypic factor models, and subsequently only doing a variance decomposition on this optimal phenotypic model (cf. Røysamb et al., 2018). 3 To limit the number of statistical tests in finding the ultimate optimal model, we decided to first fit the theoretical models described above, find the model (either IP or CP) with the best fit, and then test whether specific or common variance components could be dropped in this best-fitting model only. All analyses were conducted in OpenMx (version 2.18.1.150; Neale et al., 2016) in the R environment (R Core Team, 2020), using full-information maximum likelihood estimation to account for missingness in the data. To ease optimization, we divided each phenotype by a constant so that the variance of each variable was roughly equal to unity, and age was divided by 100 so that the estimated regression coefficients are expressed in centuries.
Given the large sample size and number of model parameters, relying solely on likelihood ratio tests for deciding on the better fitting model is ill-advised; since it is based on measures of exact fit, even tiny departures from the null model will get picked up by the test statistic (e.g., Barrett, 2007). We therefore used the Akaike Information Criterion (AIC) as the main criterion for model comparisons (with lower values being indicative of better fitting models). Absolute model fit was evaluated by the comparative fit index and the Tucker–Lewis index (CFI and TLI; both >.95 good fit, > .90 acceptable fit), and the root mean square error of approximation (RMSEA; <.05 good fit, < .08 acceptable fit), with criteria provided by Hu and Bentler (1999).
Results
Covariate Age and Assumption Tests
Before testing model assumptions, the effect of age on the phenotypes was first investigated. Constraining the 10 age effects (8 on the means and 2 on the thresholds) to zero resulted in a significant loss of model fit (AIC = 53169.36 vs. 51497.74; see Supplementary Table S3 for full model fitting results). Results showed that Ne (b = −.89, 95% CI = −1.05 to −.72), Ex (b = −.90, 95% CI = −1.12 to −.68), SAT (b = −19, 95% CI = −.36 to −.02), and SRH (b = −1.12, 95% CI = −1.34 to −.90) decreased with age, while Op (b = .14, 95% CI = .01–.27), Ag (b = .83, 95% CI = .59–1.09), Co (b = .82, 95% CI = .59–1.06), QOL (b = .34, 95% CI = .16–.51), DEP (b = .87, 95% CI = .65–1.09) and LON (b = .61, 95% CI = .37–.76) increased with age.
Subsequently, we tested whether means, thresholds, and (co)variances were equal across zygosity group, and across twins and siblings, and found this to be the case (except for some small differences in means) judging on the AIC value of the constrained models (see Supplementary Table S4). Thus, no evidence was found for twin-specific effects on the traits; because DZ correlations were equal to twin-sibling correlations, they are constrained and treated as being equal and will be referred to as DZ/sibling correlations below (Supplementary Table S4 and S5 present detailed information on sibling means, variances and correlations).
Sex Differences
Descriptive Statistics for Males and Females.
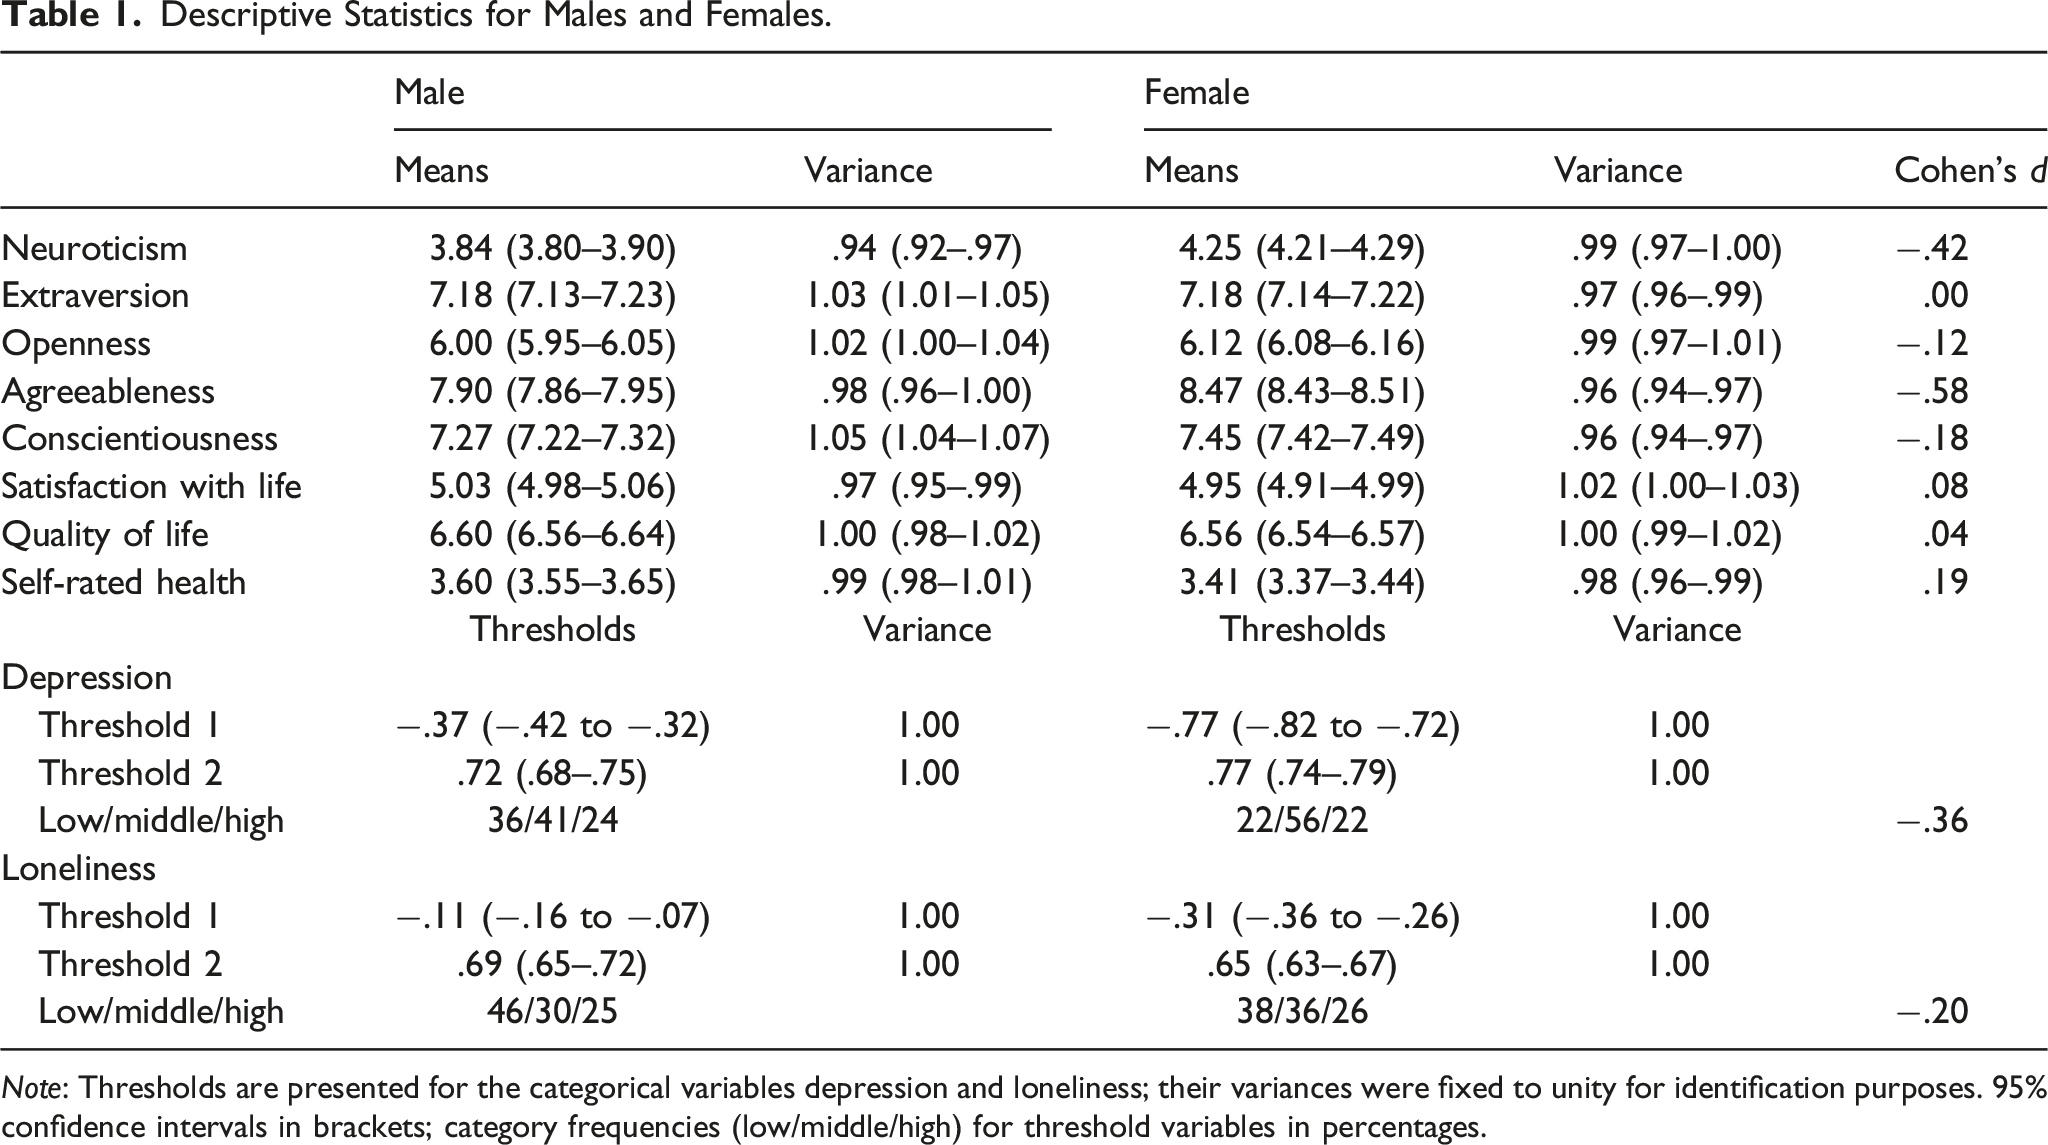
Note: Thresholds are presented for the categorical variables depression and loneliness; their variances were fixed to unity for identification purposes. 95% confidence intervals in brackets; category frequencies (low/middle/high) for threshold variables in percentages.
Significant but small sex differences in trait variances were found only for Ex, Co, and, SAT. Subsequent inspection of the male, female, and opposite-sexed twin correlations revealed that these were highly similar (Supplementary Table S6). Indeed, we found that the DZF and DZM cross-twin cross-trait correlations could be constrained to equality (AIC = 47496.18 vs. 47519.88), subsequently that the DZO correlations could be constrained to these DZ correlations (AIC = 47461.49), and finally the MZF correlations to the MZM correlations (AIC = 47415.61; see Supplementary Table S3). Taken together, insufficient evidence was found for either quantitative or qualitative sex differences, and we thus refrained from testing for sex differences in subsequent models.
Correlations
Figure 2 shows the phenotypic correlations collapsed across males and females. Op and Ag showed relatively low phenotypic correlations with all the other traits. The well-being traits were moderately to strongly related to each other (absolute range .23–.72; Mdn: .47), while the personality variables showed lower and more moderate intercorrelations (absolute range .00–.47; Mdn: .18). This indicates that there were influences common to all the well-being traits, and also common to all personality traits but to a smaller degree. Regarding the overlap between personality and well-being, Ne showed the strongest relations with the well-being traits (median absolute r = .53), most notably with DEP (r = .78, 95% CI = .78–.79). Correlations of Ex (median absolute r = .36) and Co (median absolute r = .30) with the well-being traits were similar in magnitude to each other and modest. Overall, the phenotypic correlations suggest considerable overlap between personality and well-being traits, while being modest enough to suggest substantial unique influences. Phenotypic correlations. Note. Ne = Neuroticism, Ex = Extraversion, Op = Openness, Ag = Agreeableness, Co = Conscientiousness, SAT = satisfaction with life, QOL = quality of life, SRH = self-rated health, DEP = depression, LON = loneliness.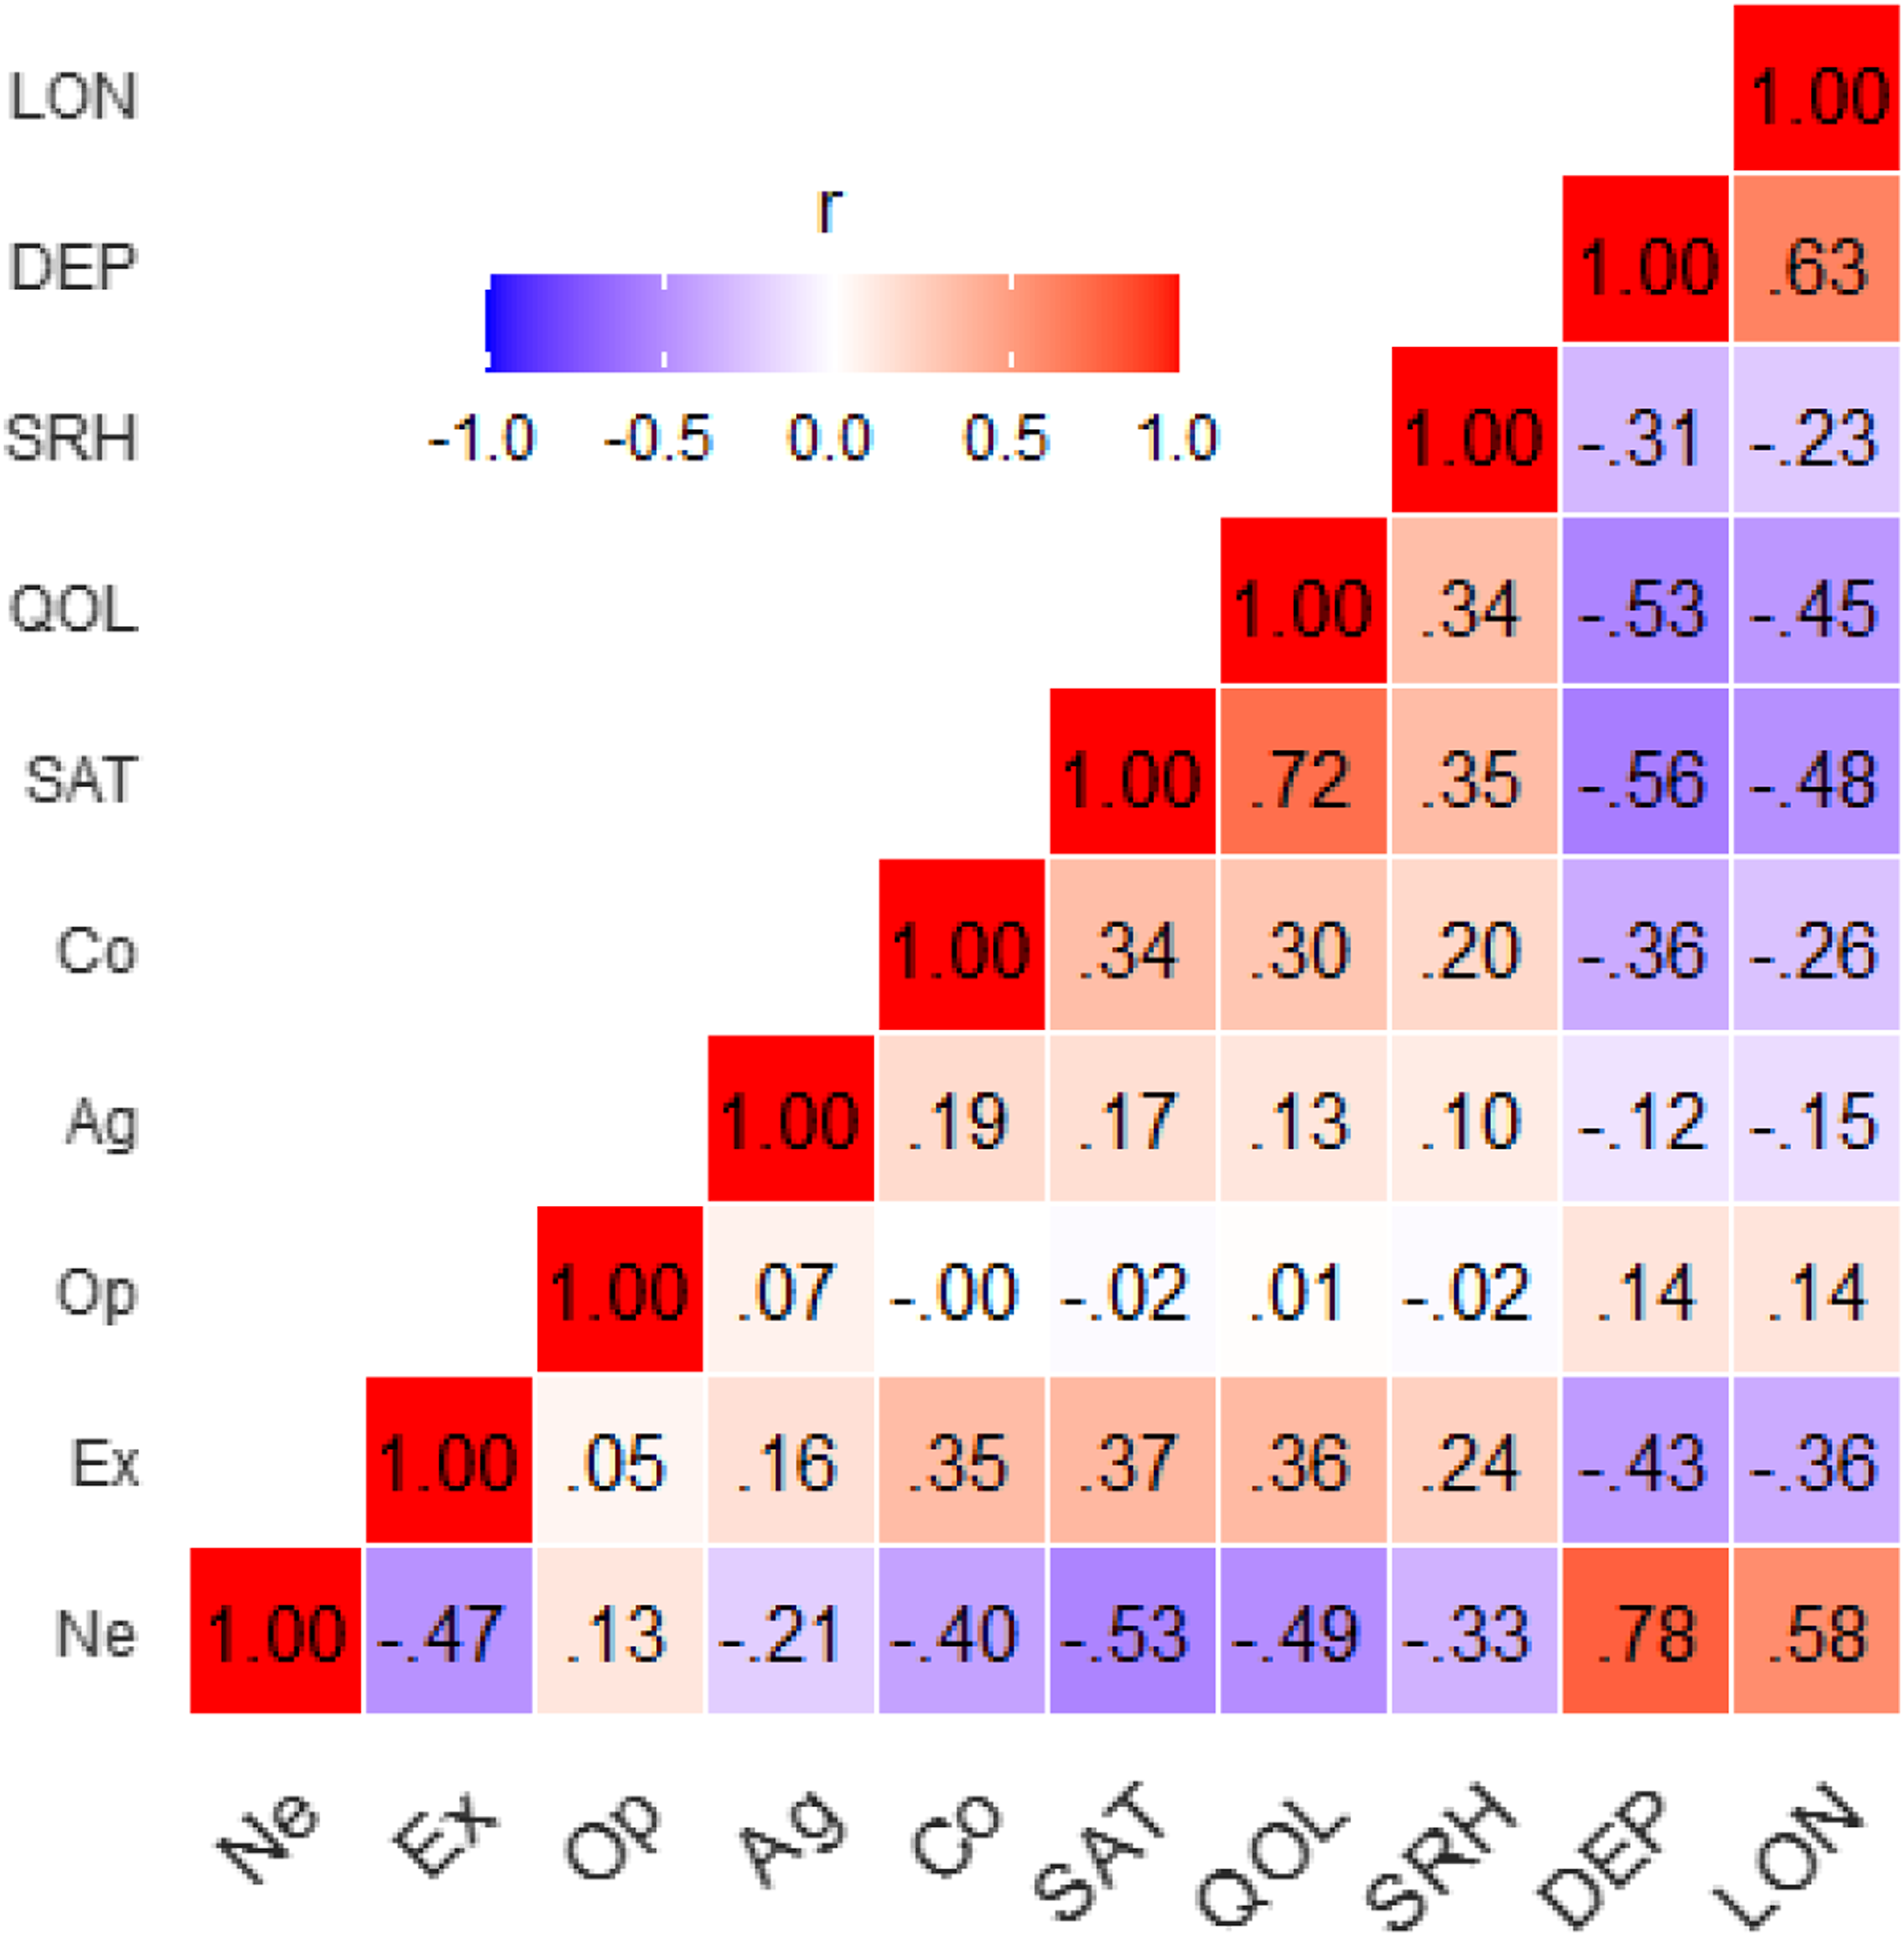
Twin Correlations and Cross-Twin Cross-Trait Correlations.
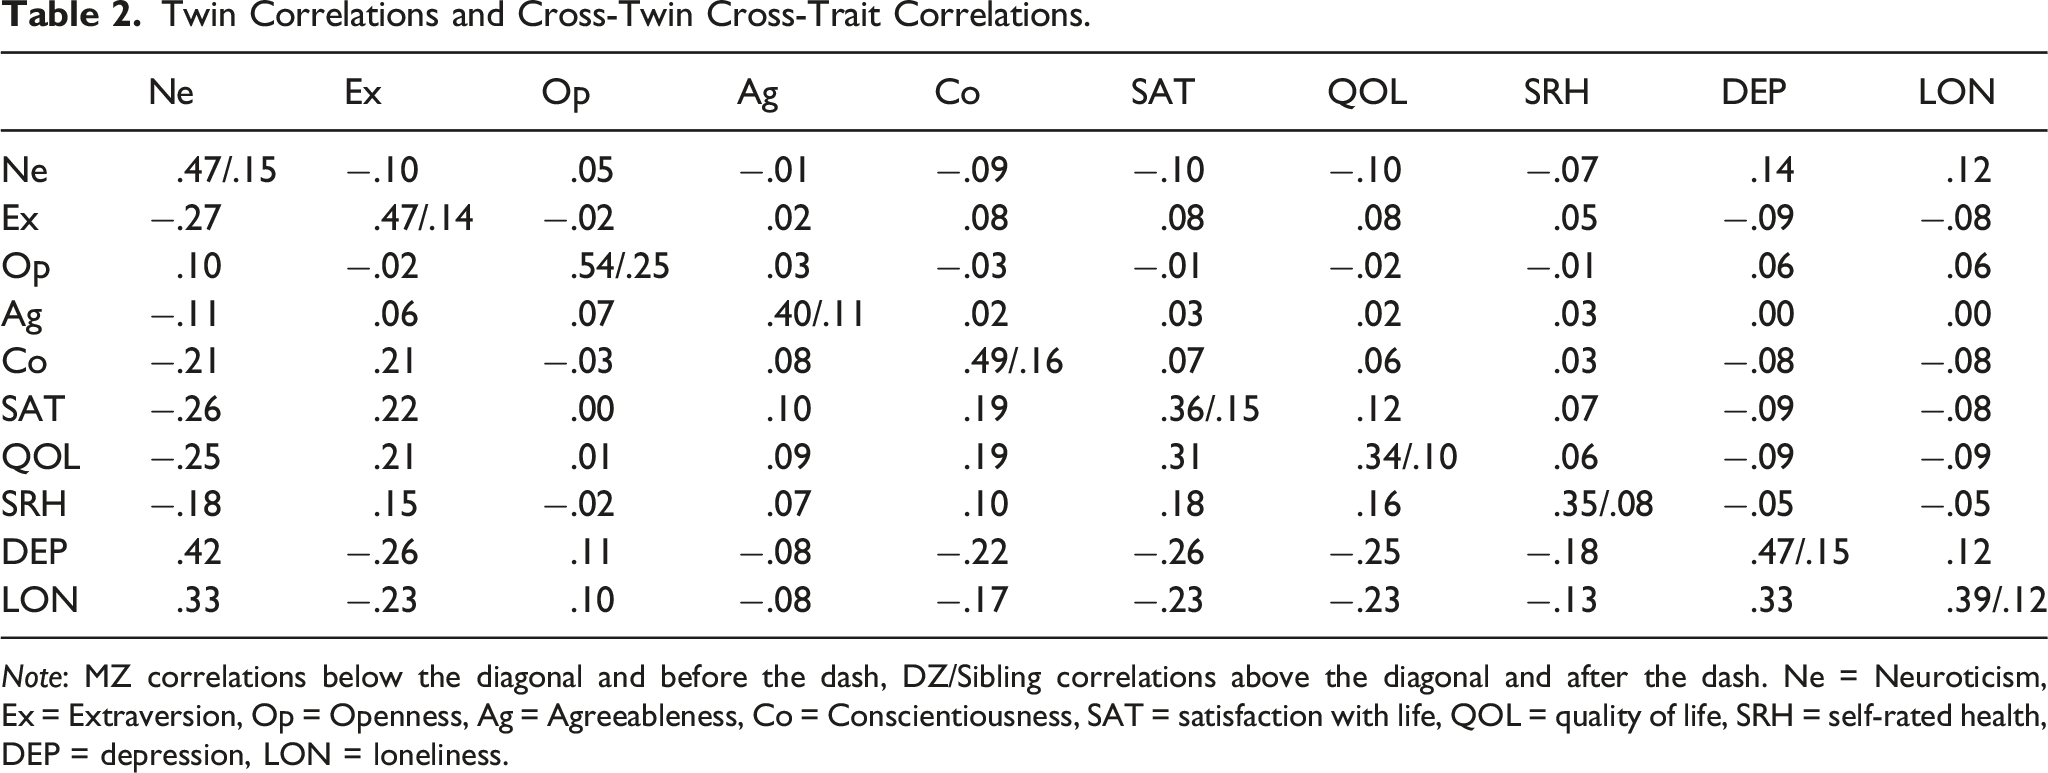
Note: MZ correlations below the diagonal and before the dash, DZ/Sibling correlations above the diagonal and after the dash. Ne = Neuroticism, Ex = Extraversion, Op = Openness, Ag = Agreeableness, Co = Conscientiousness, SAT = satisfaction with life, QOL = quality of life, SRH = self-rated health, DEP = depression, LON = loneliness.
Cholesky ADE Model
Fit Statistics for Multivariate Models.
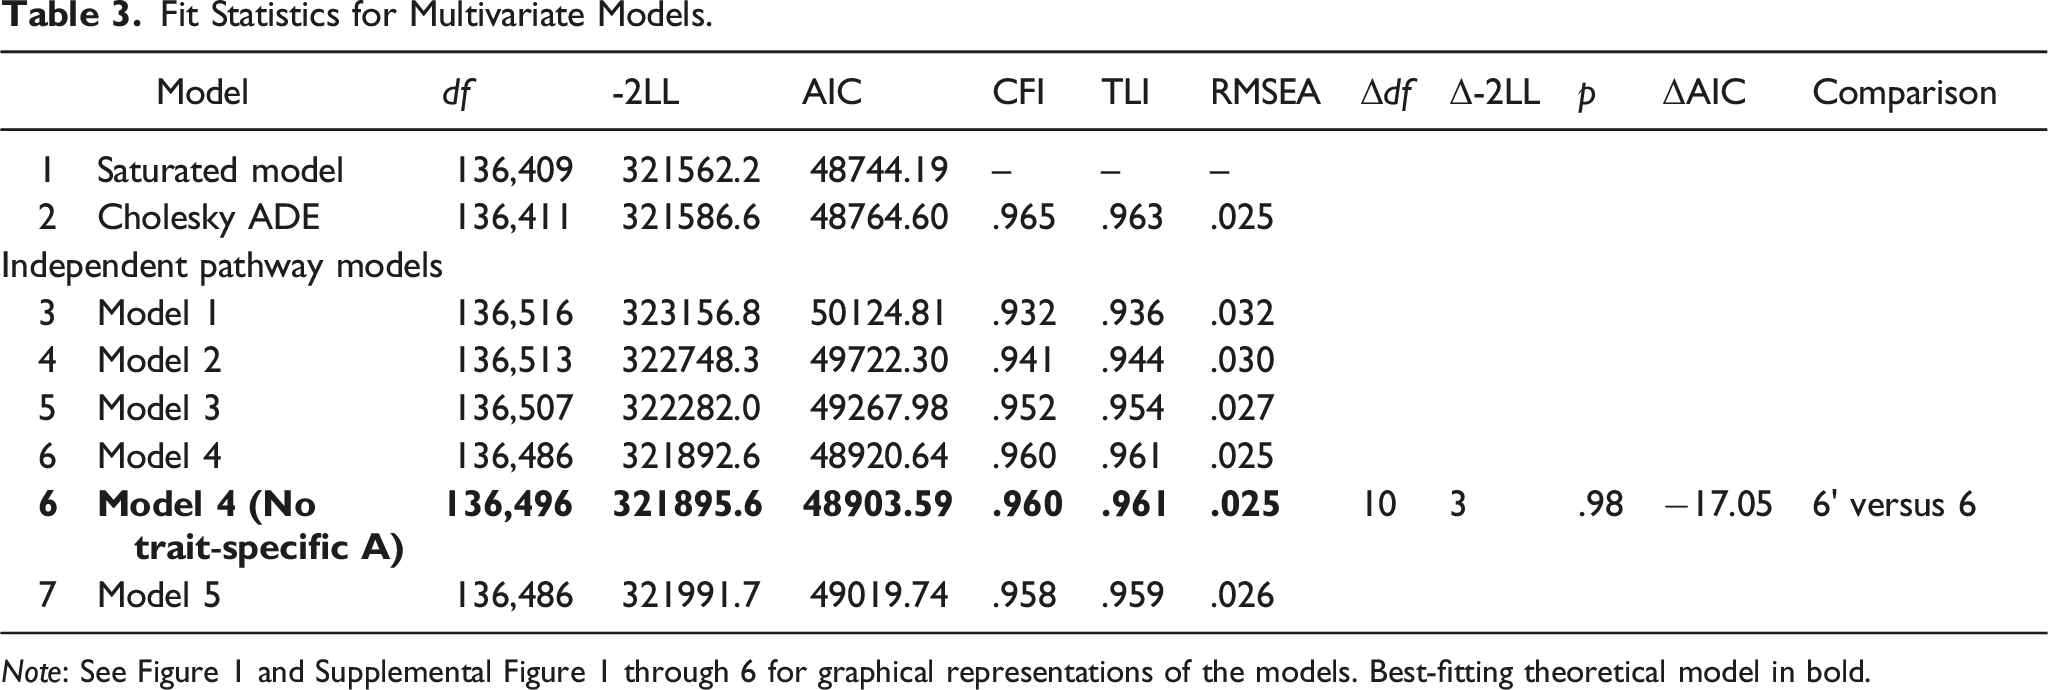
Note: See Figure 1 and Supplemental Figure 1 through 6 for graphical representations of the models. Best-fitting theoretical model in bold.
The genetic and environmental correlations estimated on the basis of the full Cholesky ADE model provide some first insights into the etiological structure underlying personality and well-being (see Supplementary Table S7 and Figure S7). Among the personality variables, Ne, Ex, and Co, showed the strongest genetic overlap. Overall, the genetic correlations were moderate to high among the well-being traits, supporting a common genetic well-being factor, yet SRH showed less genetic overlap with the other well-being traits. SAT and QOL shared more genetic effects with each other than with the other traits, as indicated by their comparatively higher genetic correlations (rA = .92, rD = .91). Finally, Ne showed the largest genetic (additive and non-additive) correlations with the well-being variables (especially with DEP and LON) followed by Ex and Co. Thus, Ne, Ex and Co had more genetic effects in common with each other and with the well-being traits. Op, Ag, and SRH appeared to be more distinct from the other traits. On the whole, the environmental correlations were lower than the genetic correlations.
Theoretical Models
Best-Fitting Model
These aforementioned common and unique effects were reflected in the best-fitting theoretical model, the IP specification of Model 4, which includes a general, common A, D, and E factor and domain-specific personality and well-being ADE factors (Figure 1). 4 Subsequent analyses revealed that the trait-specific residual factors of A (“As” in Figure 1) could be dropped (AIC = 48903.59 vs. 48920.64). 5
Variance Decomposition: Heritability, and Common, Domain-Specific and Trait-Specific Effects
Standardized Variance Components Based on the Best-fitting Theoretical Model—Independent Pathway Model 4 Without Specific Additive Effects.
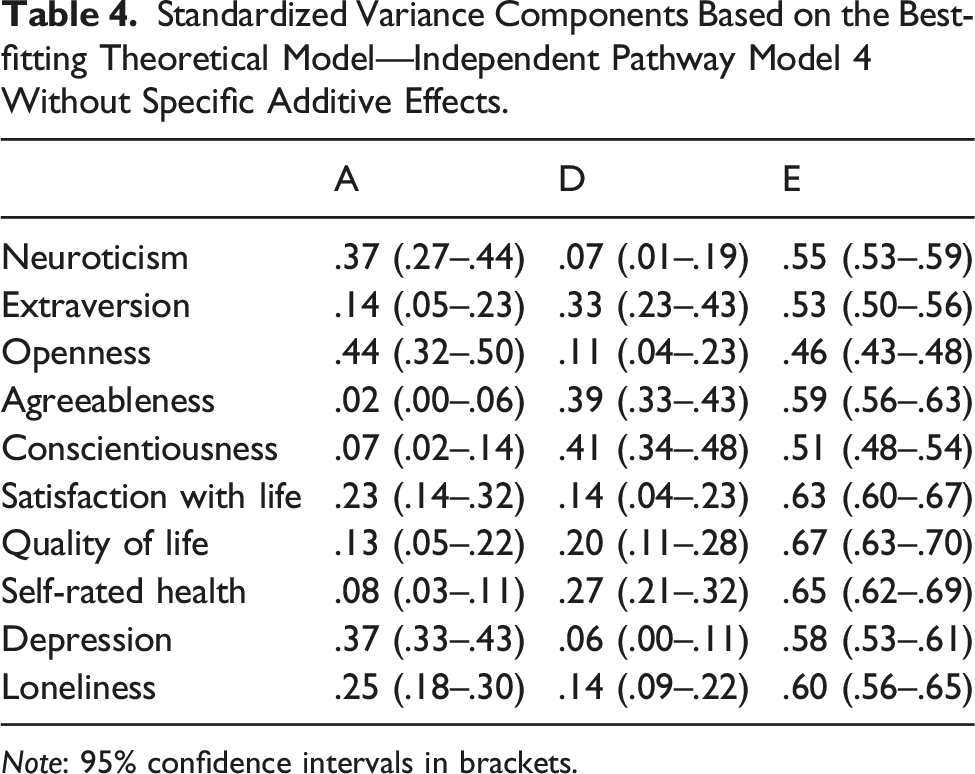
Note: 95% confidence intervals in brackets.
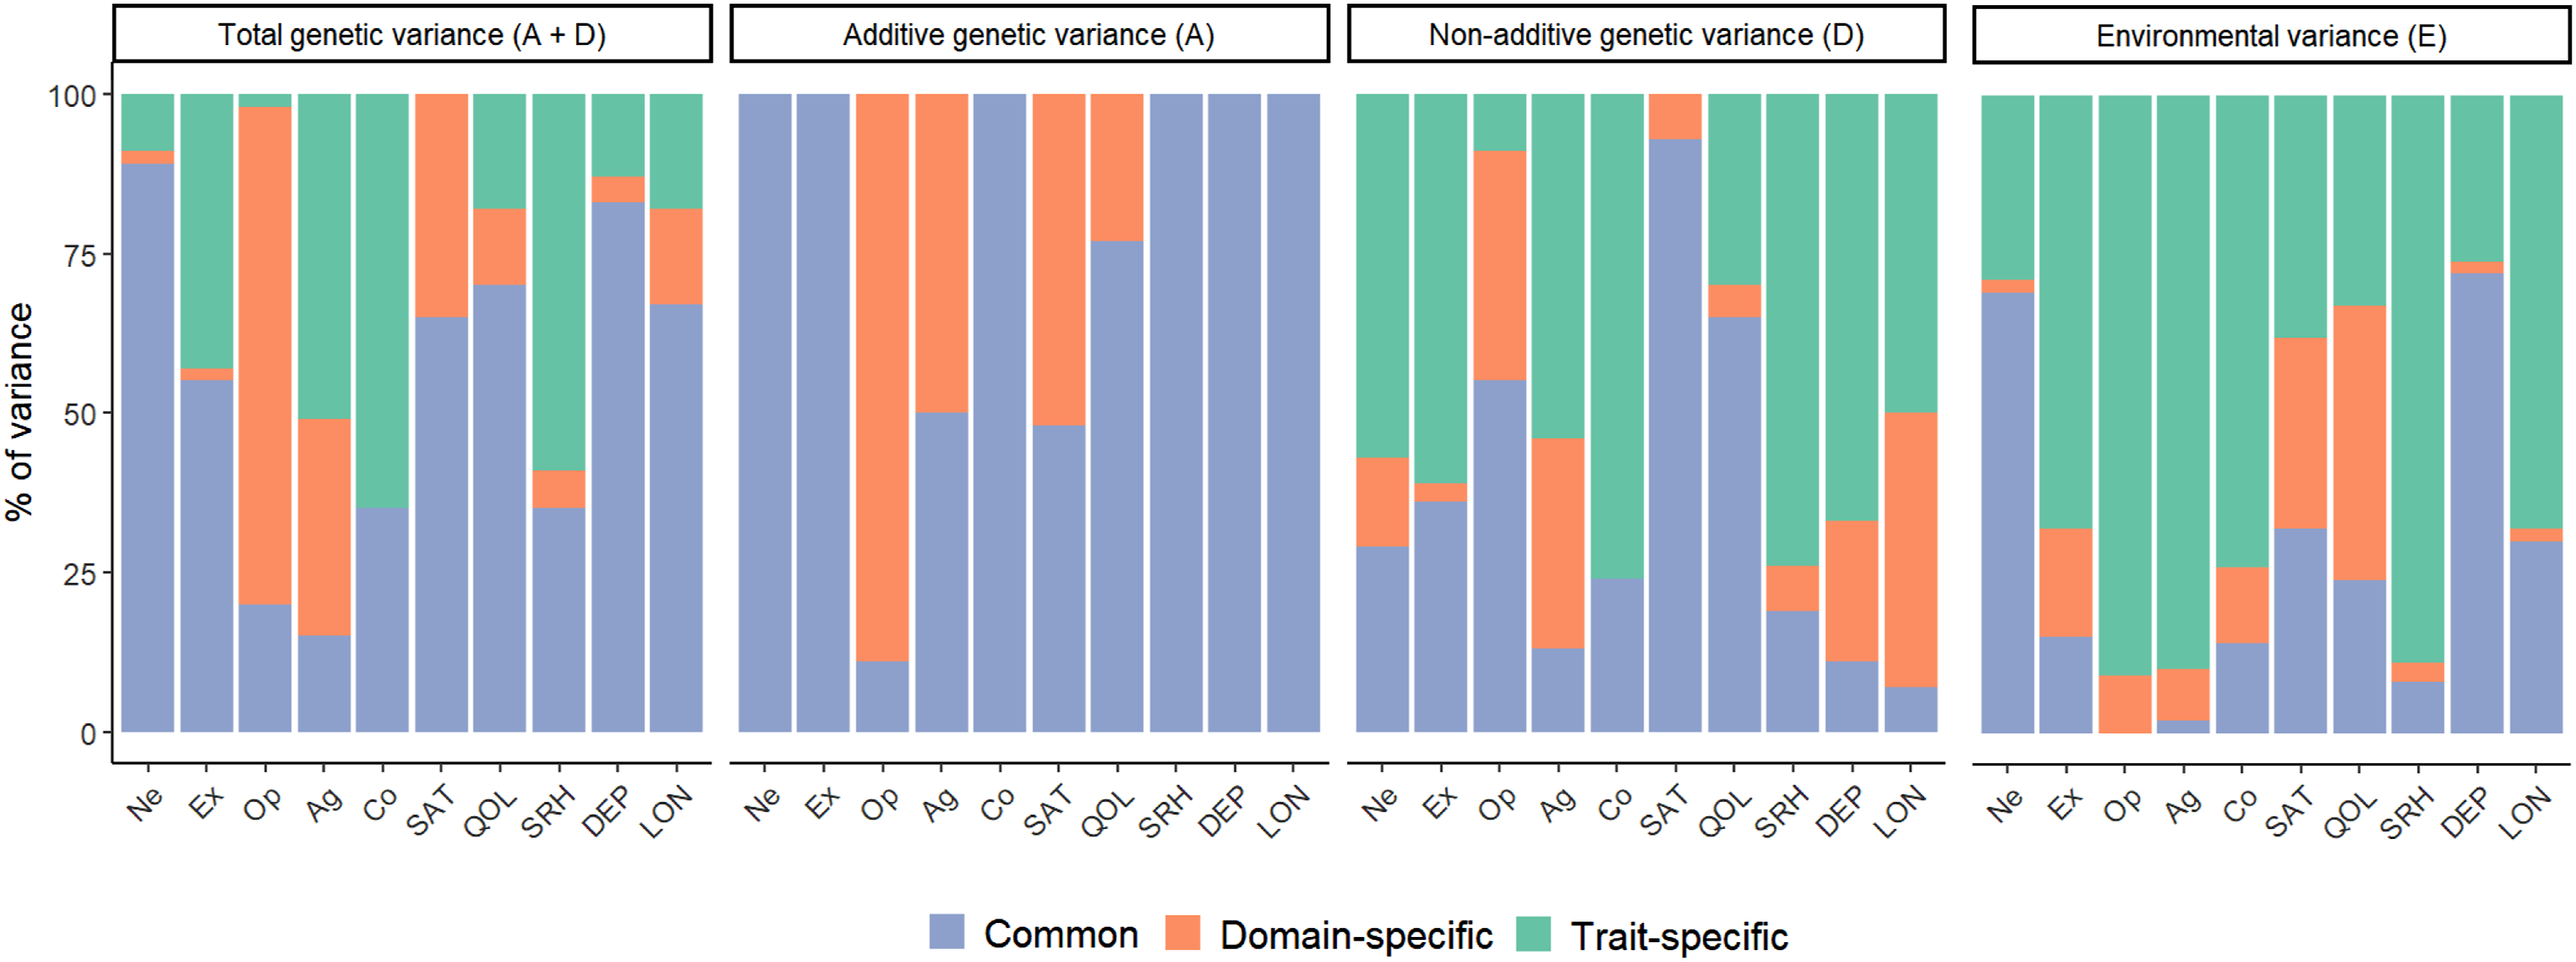
Proportion of variance due to common, domain-specific, and trait-specific factors. Note. Ne = Neuroticism, Ex = Extraversion, Op = Openness, Ag = Agreeableness, Co = Conscientiousness, SAT = satisfaction with life, QOL = quality of life, SRH = self-rated health, DEP = depression, LON = loneliness.
Additive Genetic Variance
For Ne, Ex, Co, SRH, DEP, and LON, all of the additive variance is due to the common factor, while the common factor is responsible for the majority of additive variance in QOL (77%) and half of the additive variance in SAT (48%) and Ag (50%). Only 11% of the variance in Op is due to the common factor, the remaining 89% is due to the domain-specific personality factor. Only Op has a sizeable loading on the domain-specific additive personality factor: however, this domain-specific factor altogether could not be removed from the model (AIC = 48964.16 vs. 48903.59), and neither could only the four loadings of Ne, Ex, Ag, and Co (AIC = 48924.12).
Non-additive Genetic Variance
For non-additive variance, there is a greater mix of influences by the common and specific factors on the traits, with a relatively larger role for the common factor on SAT (93%), QOL (65%), and Op (55%). The domain-specific non-additive personality factor mostly influenced Ag while having little influence on the other personality traits (Supplementary Table S8). Yet, this domain-specific factor could not be dropped from the model (AIC = 48949.67 vs. 48903.59), and neither could only the loadings of Ne, Ex, Op, and Co (AIC = 48951.67).
Total Genetic Variance (Additive + Non-Additive)
Combining additive and non-additive genetic effects, effects on the well-being traits are mostly due to the common, general factor for SAT (65%), QOL (70%), DEP (83%), and LON (67%). The exception was SRH (35%). The domain-specific well-being factor only has a notable influence on SAT (35%), not on the other well-being traits (between 4% and 15%). For the personality traits, only Ne (89%) is largely influenced by the common, general factor, followed by Ex (55%), Co (35%), Op (20%), and Ag (15%). These latter three traits differ substantially in their remaining influences. Op is predominantly influenced by the domain-specific personality factor (78%) without any trait-specific effects (2%), while the reverse is true for Co (65% trait-specific, 0% domain-specific). Ag has a mix of domain-specific (34%) and trait-specific (51%) influences. Ne and Ex are not under the influence of the domain-specific personality factor (both 2%).
Environmental Variance
For Ne (69%) and DEP (72%), the majority of E is captured by the common environmental factor. This common factor has a more modest influence on SAT (32%), QOL (24%), and LON (30%). The domain-specific factors are only responsible for little environmental variance in the traits, with the exception of the well-being domain factor’s influence on SAT (30%) and QOL (43%), indicating that these traits share environmental variance they do not share with the other traits. For most of the traits, the majority of the environmental variance is due to the trait-specific, residual factors.
Discussion
Using a large population sample of twins and siblings, the current study provides detailed insights into the genetic overlap between personality and a broad range of well-being measures. Given our large sample size, the present study was well-powered. Overall, our results are in line with the previous finding that especially Neuroticism, Extraversion, and Conscientiousness are genetically the most important personality traits for well-being (Hahn et al., 2013; Røysamb et al., 2018; Weiss et al., 2008). Furthermore, the heritability of the personality traits of ∼40–55% (Vukasović & Bratko, 2015) and well-being traits of ∼30%–40% (Bartels, 2015; Nes & Røysamb, 2015) are comparable with previous meta-analyses.
Our results indicate that personality traits and well-being traits share considerable amounts of common genetic and environmental influences, yet that they are also influenced by their own domain-specific and trait-specific effects. Additive (vs. non-additive) genetic effects were more shared between personality traits and well-being traits, as no trait-specific additive effects were found after accounting for common effects. Non-additive genetic effects showed a greater variety in effects due to different sources. Below we discuss the results in relation to each of our three research questions in detail.
Genetic and Environmental Overlap Between Personality and Well-Being (RQ1)
Genetic and environmental effects shared between personality and well-being traits varied considerably across traits. Genetic effects due to the general, common factor ranged from 15% (Ag) to 89% (Ne) (Mdn: 60%). Genetic effects on the personality traits due to the personality-specific factor ranged from 0% (Ne) to 78% (Op) (Mdn: 2%). Genetic effects on the well-being traits due to the well-being-specific factor ranged from 4% (DEP) to 35% (SAT) (Mdn: 12%). Finally, trait-specific genetic effects ranged from 0% (SAT) to 65% (Co) (Mdn: 18%). Environmental effects were mostly trait-specific (Mdn: 68%, ranging from 26% for DEP to 91% for Op), and much less common (Mdn: 20%, ranging from 0% for Op to 72% for DEP) or domain-specific (Mdn: 9%, ranging from 2% for Ne, DEP, and LON to 43% for QOL). Of all personality traits, Neuroticism was most strongly related to well-being, and particularly strongly genetically related to depression and loneliness, in line with previous research (Abdellaoui et al., 2019; Fanous et al., 2002; Kendler et al., 2006; Okbay et al., 2016; Schermer & Martin, 2019). Because of its pivotal role, Neuroticism is sometimes included as a well-being trait (Baselmans et al., 2019a, 2019b). On the other hand, Openness, Agreeableness, and self-rated health appeared to mostly be genetically and environmentally distinct from the other traits.
Importantly, the percentages from the previous section are based on common genetic effects on personality and well-being once their respective shared variances have been taken into account. For example, Neuroticism showed the strongest bivariate genetic correlations with well-being traits, but also with the other personality traits. In the best-fitting theoretical model in which shared domain-specific variance was taken into account, it still showed the strongest overlap with well-being. Thus, genetic effects on Neuroticism and well-being were not due to the genetic overlap that Neuroticism shares with other personality traits, or the genetic overlap that well-being traits share with each other. The same was true for Conscientiousness and Extraversion. Earlier claims that these personality traits and well-being are influenced by cross-domain pleiotropic effects (Hahn et al., 2013; Røysamb et al., 2018; Weiss et al., 2008) thus seem to be robust.
Based on our results, it can be concluded that the genetic overlap between personality and well-being is quite large (Mdn: 60%). This is in line with a proposed (genetic) “covitality” factor (Figueredo et al., 2004; Weiss & Luciano, 2015) influencing the variation in both personality and well-being ratings: the recovering of such an overarching factor in our best-fitting model supports this claim. Based on the substantial genetic overlap, it has previously been suggested that “happiness is a personality thing” (Weiss et al., 2008). Yet, without explicit modeling of the direction of causation, personality may be a well-being thing just as well as well-being may be a personality thing (Keyes et al., 2015). At the phenotypic level, both directions of causality may indeed be simultaneously operating (e.g., Soto, 2015; Specht et al., 2013). However, the current study shows that shared genes will act as a confounder for these effects. Additional research on causality in which genetic confounding is taken into account is thus needed (Briley et al., 2018).
When these causal mechanisms become more clear, our results are informative for future intervention studies. Although both are relatively stable over the lifespan, well-being is thought to be more malleable than personality (Anusic & Schimmack, 2016) and several well-being interventions have proven to be successful (van Agteren et al., 2021). Again, genetic effects need to be taken into account, as they play a role in stability and change of both personality and well-being (Nes et al., 2006; Pedersen & Reynolds, 1998). By gaining more insights into what (genetically) separates well-being from personality, it will become easier in the future to target interventions specifically at effects unique to well-being.
Our findings on common, domain-specific, and trait-specific effects have implications for molecular genetic studies. GWASs are designed to identify the genetic variants associated with a trait. Several GWASs on personality (De Moor et al., 2015; Lo et al., 2017; van den Berg et al., 2016; Weiss et al., 2016) and well-being (Baselmans et al., 2019a; Okbay et al., 2016; Turley et al., 2018) have been published in recent years. Recently, multivariate methods have been developed to investigate the (latent) genetic structure underlying traits at a molecular genetic level and use this structure to find new genetic variants for the identified latent factors (Genomic SEM; Grotzinger et al., 2019). Our models can be used as input for such investigations. Ultimately, this should make it possible in the future to arrive at a clear picture of the variants that are uniquely associated with well-being and personality, or with both.
Based on our results, one could alternatively argue that, overall, personality and well-being are quite distinct (100%–60% = 40%). With regards to the overlap and distinction, we largely concur with Keyes and colleagues (2015) who noted that personality reflects how one functions in life, while well-being reflects how well one functions. Being both part of the process of functioning in life they have much in common, but they also differ in their role in this process. These differences and similarities are likely to be reflected in their genetic makeup.
The Influence and Interpretation of Domain-Specific Shared Variance
Although we fitted domain-specific factors mostly to control for domain-specific variance, our results can provide insights for the interpretation of these factors. In the CP models, we found that loadings of Neuroticism (∼ −.85), Extraversion (∼ .55), and Conscientiousness (∼ .46) on the common personality factor were sizeable, while loadings of Agreeableness (∼ .23) and Openness (∼ −.08) were low. We thus did not find strong support for a phenotypic common personality factor (referred to as the General Factor of Personality; van der Linden et al., 2016). At the same time, the domain-specific well-being factor was well-defined by all well-being traits in our CP models, with phenotypic loadings ranging from ∼.40 (self-rated health) to ∼ −.84 (loneliness). In addition, in the IP models, domain-specific effects were more pronounced for well-being compared to personality. These results provide evidence for a broad, general well-being factor underlying different well-being measures (e.g., Longo et al., 2016) and makes it plausible that this factor has a solid genetic basis (Bartels & Boomsma, 2009; Baselmans & Bartels, 2018).
Nevertheless, the superior fit of IP (vs. CP) models implies that these common factors must be interpreted with caution. This finding indicates that they may not be the causal factors influencing their indicators, as the common and unique effects operate at the indicator level, and not at the common factor level (Franić et al., 2013). Yet, the existence of a latent construct cannot be proven or disproven based on the relative fit of IP over CP models alone. For example, IP models tend to fit better than CP models when fitting them to the facets underlying each of the Big Five factors (Franić et al., 2014; Jang et al., 2002). Rather than dismissing the Big Five as constructs altogether, Jang et al. (2002) concluded that they “do not exist as veridical psychological entities per se, but rather they exist as useful heuristic devices that describe pleiotropic effects and the common influence of environmental factors on sets of individual facets.” (p. 99). Similarly, the common factors in the current study may be viewed as an organization of traits on which common genetic and environmental are operate, each of them also having their own unique influences. Ultimately, to answer the question what these common factors represent, multi-trait-multi-method (MTMM) studies based on ratings of personality and well-being (see Schimmack & Kim, 2020) in a genetically informative design are needed to accurately separate trait from method effects (Bartels et al., 2007; Borkenau et al., 2001).
Although not providing clear evidence on its meaning, the current study can parsimoniously explain why controlling for the shared Big Five variance reduces their correlations with well-being (Kallio Strand et al., 2021; Kim et al., 2018; Schimmack & Kim, 2020). In the suboptimal CP models, the genetic and environmental correlations between the latent general well-being and general personality factor were much higher (1.00. .96, and .81, for ADE respectively) than in the IP models (.25, 1.00, and .50, respectively). If then, in the CP models, the common genetic effects on indicators are aggregated to a higher level in an unbalanced way (as is the case for the higher-loading Neuroticism, Extraversion, and Conscientiousness, compared to Openness and Agreeableness), then this will artificially lead to higher genetic correlations between the common factors. These stronger genetic correlations translate to the phenotypic level. Thus, when we control for the shared phenotypic personality variance, then we are haphazardly controlling for the “true” underlying genetic and environmental effects at the indicator level, reducing the correlations between the Big Five and well-being. Again, this hypothesis needs to be tested in the future using genetically informative MTMM studies.
Non-additive Genetic Effects (RQ2)
In line with previous work, significant amounts of non-additive variance were found to influence both personality and well-being, and their overlap (Bartels & Boomsma, 2009; Hahn et al., 2013; Keller et al., 2005). Non-additive genetic effects accounted for between 14% (depressive symptoms) to 95% (Agreeableness) of the total genetic variance in the traits (Table 4). In the Cholesky model, absolute non-additive genetic correlations ranged from .13 to .93 (Mdn: .47). This is important, for example, for future molecular genetic studies trying to identify the genes associated with personality and well-being, since the methods used in such studies often assume additive genetic effects (Visscher et al., 2017). The amount of non-additive variance present in traits is also important for theoretical reasons, as it is assumed to be indicative of the evolutionary pressures that have caused these traits to emerge (Penke et al., 2007; Verweij et al., 2012).
With our current sample size, we had sufficient power to detect non-additive genetic effects (D), but this does not apply to all previous studies on this topic. We found that especially for D, traits differed in the amount of effects due to common, domain-specific, and trait-specific effects. This will obscure results when effects are aggregated to higher trait levels. For example, when one creates a general well-being scale from multiple scales that differ in their common and unique additive and non-additive effects, then the resulting general measure will be a cloudy mix of these different genetic effects. These findings stress the importance of modeling higher order factors (e.g., “general well-being”) as latent variables in twin designs, to uncover the nuances in their underlying genetic effects.
Sex Differences in Genetic and Environmental Effects (RQ3)
In our large sample, we found moderate to small mean sex differences on the Big Five. In line with previous studies (Costa et al., 2001; Schmitt et al., 2008; Weisberg et al., 2011), females scored higher on Neuroticism and Agreeableness, and somewhat higher on Conscientiousness. In contrast to other studies, we found no sex differences in Extraversion, which may be due to our focus on the Big Five factors rather than facets residing below the Big Five. Females tend to score higher on the facet Enthusiasm and males on Assertiveness (Costa et al., 2001; Feingold, 1994; Weisberg et al., 2011). At the aggregate factor level, these differences may have canceled each other out. Sex differences on well-being traits were generally small, with the largest effect found for depression, also replicating previous work (Batz & Tay, 2018; Batz-Barbarich et al., 2018; Eaton et al., 2012).
Given our large sample and similar results from previous studies (Bartels, 2015; Keyes et al., 2010; Røysamb et al., 2018; South et al., 2018; Vukasović & Bratko, 2015), it seems safe to assume that, at the aggregate level, the same genes influence personality and well-being for males and females, and to the same extent. This is important information for theoretical and practical reasons as it suggests that mean differences are probably due to non-shared environmental circumstances. These non-shared environmental exposures reflect idiosyncratic experiences that only a single twin within the same family experiences, making them more different from their siblings. This may include life events, differences in socialization, different opportunities, or specific gender roles (South et al., 2018). Our results further imply that in future gene finding studies, male-specific and female-specific genes for personality and well-being are unlikely to be found.
It is tempting to conclude that the mean sex differences on personality and well-being are completely unrelated to genetic differences. However, genes may still play a role through more subtle processes such as gene-environment interplay. For example, we investigated genetic and environmental influences independent of age effects by regressing them out from the traits. It may be that a sex by age interaction is present, implying that quantitative or qualitative sex differences are only apparent at specific ages (e.g., during adolescence). For instance, puberty seems to coincide with increases in mean levels of internalizing symptoms and with increases in its heritability, particularly in girls (Bergen et al., 2007; Patterson et al., 2018). Future studies investigating genetic and environmental effects as a function of both age and sex are needed to confirm such processes for personality and well-being.
It is also possible that genetic differences exist between males and females, but that these are masked by unmodeled gene by environment interaction (GxE) effects. Traditional twin models assume that GxE is not present, that is, that genetic effects are similar across different environments and/or subgroups. This may not be the case; Nes et al. (2010b), for example, showed that the environmental exposure marriage influenced the heritability estimates of SWB. Importantly, these marriage effects differed across males and females. GxE effects may also explain why gender differences tend to be larger in more prosperous societies: possible genetic differences between males and females may be more easily expressed in developed countries (Schmitt et al., 2008). In our study, we investigated a sample from the Netherlands, a highly developed country with relatively equal opportunities for males and females. Within our egalitarian sample, the smaller amount of variance in opportunities and gender roles between males and females may have attenuated the expression of genetic sex differences. Future studies that explicitly model GxE effects for males and females, preferably across countries with different developmental standards, are thus needed.
Limitations
There are limitations to this study. First, as this study was conducted in a single context, the Netherlands, results may not generalize to other contexts. The heritability estimates of personality traits have been found to differ across cultures (Jang et al., 1998, 2002, 2006). In addition, culture has been found to moderate mean well-being (Deaton, 2008) and mean personality (Schmitt et al., 2007) levels, and their associations (Kim et al., 2012, 2018). Thus, future studies with samples from different countries are needed to investigate whether our results apply to other cultural contexts.
Second, the data used were cross-sectional in nature and we therefore cannot make claims about causal effects or temporal changes in personality and well-being. Nevertheless, our results can still be useful as they indicate that genetic confounding needs to be taken into account in future studies investigating associations between personality and well-being. The growing availability of polygenic scores (i.e., individuals’ genetic risk for a given trait based on the effect sizes from GWAS; Wray et al., 2014) will increasingly allow for this. A third important limitation is that all our trait measures were based on self-reports. It could therefore be the case that the common effects on the personality and well-being traits were partly driven by common method biases (CMB), such as response styles related to item keying, social desirability, or acquiescence, which have been found to be partially heritable (Kam et al., 2013; Melchers et al., 2018). This mechanism is especially relevant for the common variance among personality traits, as it is proposed to mainly reflect CMB (Chang et al., 2012). Although this possibility cannot be completely ruled out, our findings suggest that such effects may be limited. This is because IP models fit better than CP models: if CMB would be driving the associations between variables, then it would probably have led to such strong correlations between the traits that phenotypic common factors would be more pronounced (and lead to improved fit). As mentioned previously, additional genetic research on the overlap between personality and well-being using multiple raters is needed, since such designs can control for rater-specific biases (Bartels et al., 2007; Borkenau et al., 2001).
Fourth, although the (extended) CTD has proven to be a robust method for estimating the heritability of complex traits, it comes with its limitations (Røysamb & Tambs, 2016). First, the CTD only provides an omnibus (upper-limit) test of the total amount of genetic and environmental effects on traits, without identifying specific genes (or environments). Relatedly, in addition to GxE effects, gene-environment correlations (rGE) are assumed to be non-present (Verhulst & Hatemi, 2013). These limitations notwithstanding, the results from extended CTD designs can still be informative for subsequent gene finding studies (e.g., Lo et al., 2017) or investigations of gene-environment interplay (e.g., Krueger et al., 2008). Finally, assortative mating (when people with the same phenotype or genotype tend to mate more than expected at random chance levels) is also not accounted for. However, little assortative mating for personality and well-being is found previously (Luo, 2017).
Finally, in this study, we incorporated a wide range of related traits to cover the broader well-being domain. However, the scope could be expanded by including more traits such as happiness or self-esteem (Bartels & Boomsma, 2009; Diener, 1984; Hufer-Thamm & Riemann, 2021Hufer‐Thamm & Riemann, 2021), which were not available to us. In addition, different conceptualizations and measures of well-being exist, which include (combinations of) hedonic, eudaimonic, emotional, and social aspects (e.g., Keyes et al., 2015). On the personality side, alternatives to the Five-Factor Model exist, such as the HEXACO six-factor model (Ashton & Lee, 2001). These models may cover broader or slightly different aspects of personality and well-being, which in turn may lead to finding different shared and unique effects in relation to well-being. However, because of the large overlap between different conceptualizations of well-being (also genetically; Baselmans & Bartels, 2018), and different personality models (Ludeke et al., 2019), results will likely be highly similar to ours (see Keyes et al., 2015).
Concluding Remarks
Based on a large population sample of twins and their siblings, we presented a fine-grained, complex picture of the genetic and environmental overlap between personality and well-being, finding substantial common, but also unique influences, varying across traits. We hope that our results encourage researchers in the personality field to take note of the genetic overlap between personality and well-being when interpreting associations between them, especially when investigating the direction of causality. For the field of behavior genetics, we hope that this study inspires researchers to keep searching for the genetic variants that are common and unique to personality and well-being.
Data Accessibility Statement

 Being part of a national prospective cohort study (NTR), (a) our data cannot be made publicly available for privacy reasons but are available for legitimate researchers via their data access procedure (https://tweelingenregister.vu.nl/information_for_researchers/working-with-ntr-data) and (b) our sample will, due to the longitudinal data collection procedures, partly overlap with previous publications. The study by Baselmans et al. (2019b) is worth mentioning here as it also used NTR data to investigate the genetic overlap between personality and well-being. However, they only used a subset of participants for whom molecular data were available, included flourishing and happiness instead of QOL, and used molecular genetic methods to answer a different research question. We are the first to use this specific set of phenotypes in an extended twin design. The present study was not pre-registered. Analysis scripts can be found at https://osf.io/wbzgk/. Correlation tables are provided in the supplemental materials for reproducibility.
Supplemental Material
Supplemental Material - Unraveling the Relation Between Personality and Well-Being in a Genetically Informative Design
Supplemental Material for Unraveling the Relation Between Personality and Well-Being in a Genetically Informative Design by Dirk H. M. Pelt, Lianne P. de Vries, and Meike Bartels in European Journal of Personality
Footnotes
Acknowledgments
The authors thank all NTR participants who participated in this study.
Declaration of Conflicting Interests
The author(s) declared no potential conflicts of interest with respect to the research, authorship, and/or publication of this article.
Funding
This work is supported by an European Research Council Consolidator Grant (ERC-2017-COG 771057 WELL-BEING PI Bartels). Data collection in the NTR was supported by NWO large investment (480-15-001/674; Netherlands Twin Registry Repository: researching the interplay between genome and environment), an European Research Council Starting grant 284167, and the Addiction program of ZonMW (31160008). The analyses were carried out on the Lisa Cluster computer, part of the Dutch national e-infrastructure with the support of SURF Cooperative.
Supplemental Material
Supplement material for this article is available in online.
Notes
References
Supplementary Material
Please find the following supplemental material available below.
For Open Access articles published under a Creative Commons License, all supplemental material carries the same license as the article it is associated with.
For non-Open Access articles published, all supplemental material carries a non-exclusive license, and permission requests for re-use of supplemental material or any part of supplemental material shall be sent directly to the copyright owner as specified in the copyright notice associated with the article.