
Abstract
Purpose
Adaptive eating refers to internally regulated eating that is enjoyable and gently guided by the nutritional quality of foods. Despite growing interest in this construct, there is currently no validated scale to measure adaptive eating among US college students aged ≥18 years. This study aimed to develop and evaluate the psychometric properties of the Adaptive Eating Scale (AES) in a diverse sample of US college students.
Design
Thirty-seven items were developed to comprise the AES. Students completed AES and measures of intuitive eating, mental health, diet, and anthropometrics.
Sample
Eight hundred and forty-nine university students aged ≥18 years, from racially and ethnically diverse backgrounds.
Analysis
The sample was divided randomly into two. Exploratory Factor Analysis (EFA) was completed on subsample A (n = 424). Confirmatory Factor Analysis (CFA) was conducted on subsample B (n = 425) to confirm factor structure from subsample A.
Results
EFA showed 17 items representing gentle nutrition (GN), unpreoccupied by food cravings (UBFC), enjoyment of food (EOF), and honoring hunger (HH) explained 63.1% of the variance. CFA showed a bifactor model comprising one global factor and four orthogonal factors (GN, UBFC, EOF, and HH) had excellent fit [CFI = 0.972, RMSEA = 0.051, SRMR = 0.048]. GN, EOF, and HH were reliable, and significantly associated with each other, intuitive eating, emotional eating, weight status, and mental health.
Conclusion
Results showed that AES is best conceptualized as a multidimensional measure with one general factor and specific factors representing GN, EOF, and HH.
Introduction
Behavioral patterns concerning what, when, and how much to eat are influenced by physiological, genetic, psychological, and social factors.1,2 According to behavioral susceptibility theory genetic predispositions toward food approach or avoidance traits are shaped over time by environmental factors such as family dynamics and food insecurity. 3 Eating behaviors are considered maladaptive when they are associated with adverse physical and mental health outcomes.4-9 Examples of maladaptive eating behaviors include binge eating, emotional eating, compulsive eating, hedonic eating, and excessive restriction.10-12 In contrast to the large body of research on maladaptive eating, relatively little is known about adaptive eating, eating behaviors that promote physical and psychological health and well-being.5,13
Wellness is defined as optimal mental and physical functioning despite one’s current environment and circumstances. 14 More than the absence of disease, it focuses on thriving and resilience to life challenges. Based on positive psychology, wellbeing encompasses positive emotions, meaningful activities, positive relationships, mindfulness, and goal achievement. 15 Adaptive eating may support wellbeing when it is pleasurable (ie, positive emotions), supports long-term health (ie, meaningful), reflects a positive relationship with food and body image (ie, positive relationships), is internally regulated (ie, mindful), and serves the goals of satisfying hunger and satiety (ie, goal achievement). While there are measures of adaptive eating that capture some of these constructs, no validated measure currently captures adaptive eating from a wellness perspective. For example, the Intuitive Eating Scale, which measures internally regulated eating, is the most popular measure of adaptive eating, but it was developed based on a theory of eating recovery for chronic dieters, some versions of the scale were found to have inconsistent factor structures across various populations,16-20 and the practical application of the current version (3) is limited by the bifactorial structure of the items. 21 A measure of adaptive eating based on a theory of wellness for a diverse population would allow for research on adaptive eating, its determinants, consequences, and mechanisms of action, which may inform health promotion interventions.
The college years represent a period of transition and growth. College students experience several emotions and stress due to changes in their home and academic environment, societal expectations, and peers. 22 These changes affect dietary habits, which track throughout the lifespan. 23 A validated instrument to measure adaptive eating is the first step to finding ways to support college students in achieving wellness. This study aimed to develop and validate the Adaptive Eating Scale (AES) among racially/ethnically diverse college students. It was hypothesized that the AES would capture (1) the habit of eating when hungry (honoring hunger, HH) and terminating meals and snacks when satiated (respecting satiety, RS), (2) the ability to derive pleasure from food (enjoyment of food, EOF), (3) moderate interest in nutrition when making food choices (gentle nutrition, GN), and (4) freedom from impulses to eat energy dense foods without hunger (unpreoccupied by food craving, UBFC).
Methods
Development of the AES included a literature review, item generation, expert consultation, and measurement. A definition of each step is presented in Text S1. The initial item pool (including subscales of HH, RS, EOF, and UBFC) included 37 items rated on a 5-point Likert scale. For 19 items, response options ranged from “1 = never” to “5 = always” and for 18-reverse-coded items, response options ranged from “5 = never” to “1 = always.” Response options were summed so that higher scores indicate more adaptive eating.
Data Collection
The Research on Eating, Activity, and Community Health (REACH) study evaluated eating behaviors among undergraduate students. In spring 2022, students ≥18 years old from an introductory science course at the University of Houston were eligible. In exchange for course credit, students completed the survey via the web, and anthropometric measurements were collected in the lab. The study was approved by the Institutional Review Board. Out of 974 participants, 125 were removed because they had missing covariate data (n = 98), or missing eating behavior data (n = 27), resulting in a final sample of 849 (87.2%).
Demographic Data
Demographic data comprising age, sex, race, and ethnicity were gathered through a questionnaire.
Internally Regulated Eating
A 6-item subscale (Reliance on Hunger and Satiety Cues, RHSC) from the IES-2 assessed internally regulated eating. 24 Participants responded to items using a 5-point Likert scale (1 = strongly disagree to 5 = strongly agree) (Cronbach’s α = 0.83) (Text S2).
Body Mass Index
Using standard protocols, trained staff collected weight with a scale (Tanita Corporation, Chicago, IL, USA) and height with a stadiometer (Seca 222, WA, USA). Body mass index (BMI) was calculated according to Quetelet’s index (weight (kg)/Height2 (m2). 25
Depression
The Center for Epidemiological Studies Depression Scale (20-items) is a validated self-report measure of current depression symptoms. 26 Responses were scored as 0 = “Not At All” to 3 = ” A Lot” with scores ranging from 0-60 (Text S2).
Emotional Eating Scale
The emotional eating scale is a subscale of the Motivations to Eat measure and examines the frequency of eating in response to negative emotions. 27 It comprised 5 items with response options “never or almost never” (1) to “almost always or always” (5). Higher scores indicate more emotional eating (Cronbach’s α = 0.88).
Starting the Conversation
Starting The Conversation assesses disease risk due to poor quality diet. Participants indicated how often they consumed 8 types of foods: fast food, fruit, vegetables, sodas, beans, chicken, fish, chips, desserts, and margarine 28 (Text S2). Frequent consumption of fruit, vegetables, chicken, fish, and beans lowers the risk of chronic disease, so these items were reverse-coded.
Rosenburg Self-Esteem Scale
Rosenburg Self Esteem Scale (RSES) is a validated scale that measures self-esteem. 29 Response options were 1 = “Strongly agree” and 4 = “Strongly disagree”. Higher scores indicated higher self-esteem (Text S2).
Veggie Meter
Skin carotenoids were assessed using the Veggie Meter (Longevity Link Corp), a pressure-mediated reflection spectroscopy device. The device was calibrated daily and after every ten participants. All participants had the non-dominant ring finger cleaned with an alcohol swab before placing it on the sensor. The device produced a Skin Carotenoid Score (0-800), with higher scores indicating higher carotenoid levels. Three readings were taken using the standard triplicate protocol, and the average was automatically generated.30,31
Data Analysis
Descriptive analyses were conducted to calculate means ± standard deviations (SDs) or frequencies (%). The sample was randomly split into two subsamples A and B, and a cross-validation approach was pursued. All subsample A analyses were conducted using SPSS V29.
Exploratory Factor Analysis
Subsample A was used to investigate the AES item distribution and factor structure via principal axis factoring with varimax rotation. Cronbach’s alpha was used to assess internal consistency (≥0.7 acceptable). Of the 37 original AES items, only items with factor loadings of ≥0.6032,33 were retained. Factors were retained based on eigenvalues >1, scree test, and parallel analysis.34,35 Factors with <3 items loading at ≥0.60 were considered unreliable and excluded. 36
Convergent Validity
The relation between AES total and subscale scores (GN, UBFC, EOF, HH) with the correlates was examined using Spearman’s correlation coefficients for subsample A.
Confirmatory Factor Analysis
Subsample B was used to cross-validate findings from subsample A within a confirmatory factor analysis (CFA) framework. Specifically, four alternative CFA models were estimated in Mplus vs 7 (Muthén & Muthén, 1998-2012) using maximum likelihood estimation. Global model fit was evaluated using a non-significant (P > 0.05) model chi-square test, Comparative Fit Index (CFI) > 0.90 for acceptable and >0.95 for good fit, Root Mean Square Error of Approximation (RMSEA) < 0.05 for good and <0.08 for acceptable fit, a non-significant (P > 0.05) test of the close-fit RMSEA hypothesis (H0: RMSEA ≤0.05), and Standardized Root Mean Square Residual (SRMR) < 0.08.37,38 Given the sample size, less weight was placed on the chi-square test when evaluating the global model fit compared to the other fit indices (ie, CFI, RMSEA, SRMR). 39 Local model misfit, as indicated by Heywood cases and significant standardized residuals, was evaluated. Parameter estimates were also examined for interpretability.
Results
Participants
General Characteristics of participants Included in our Study
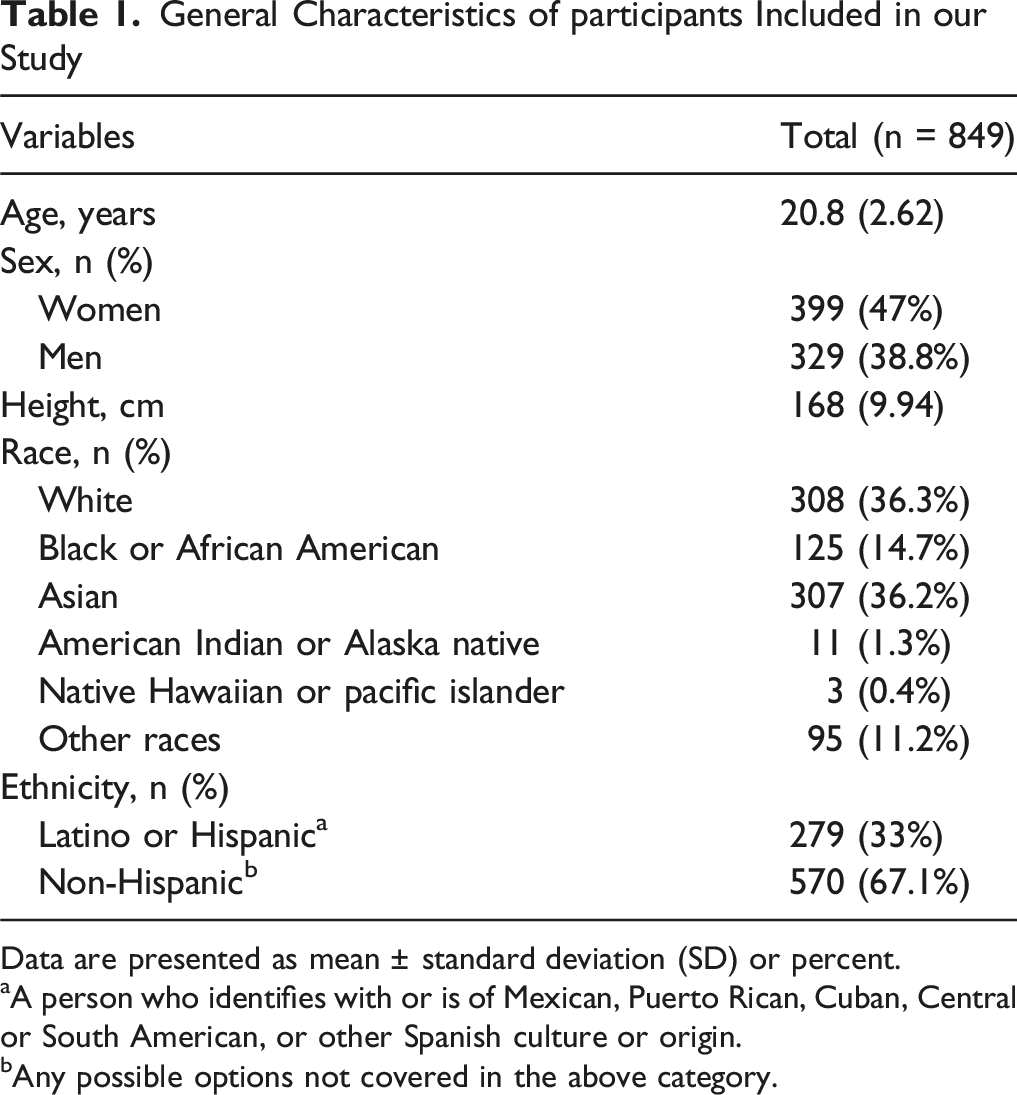
Data are presented as mean ± standard deviation (SD) or percent.
aA person who identifies with or is of Mexican, Puerto Rican, Cuban, Central or South American, or other Spanish culture or origin.
bAny possible options not covered in the above category.
Descriptive Statistics and EFA (Subsample A)
Descriptive Statistics for Adaptive Eating Scale (AES) Items, Cronbach Alpha of AES Subscales, and Results of Principal Axis Factoring Analysis With Varimax Rotation for Random Split Subsample a (N = 424)
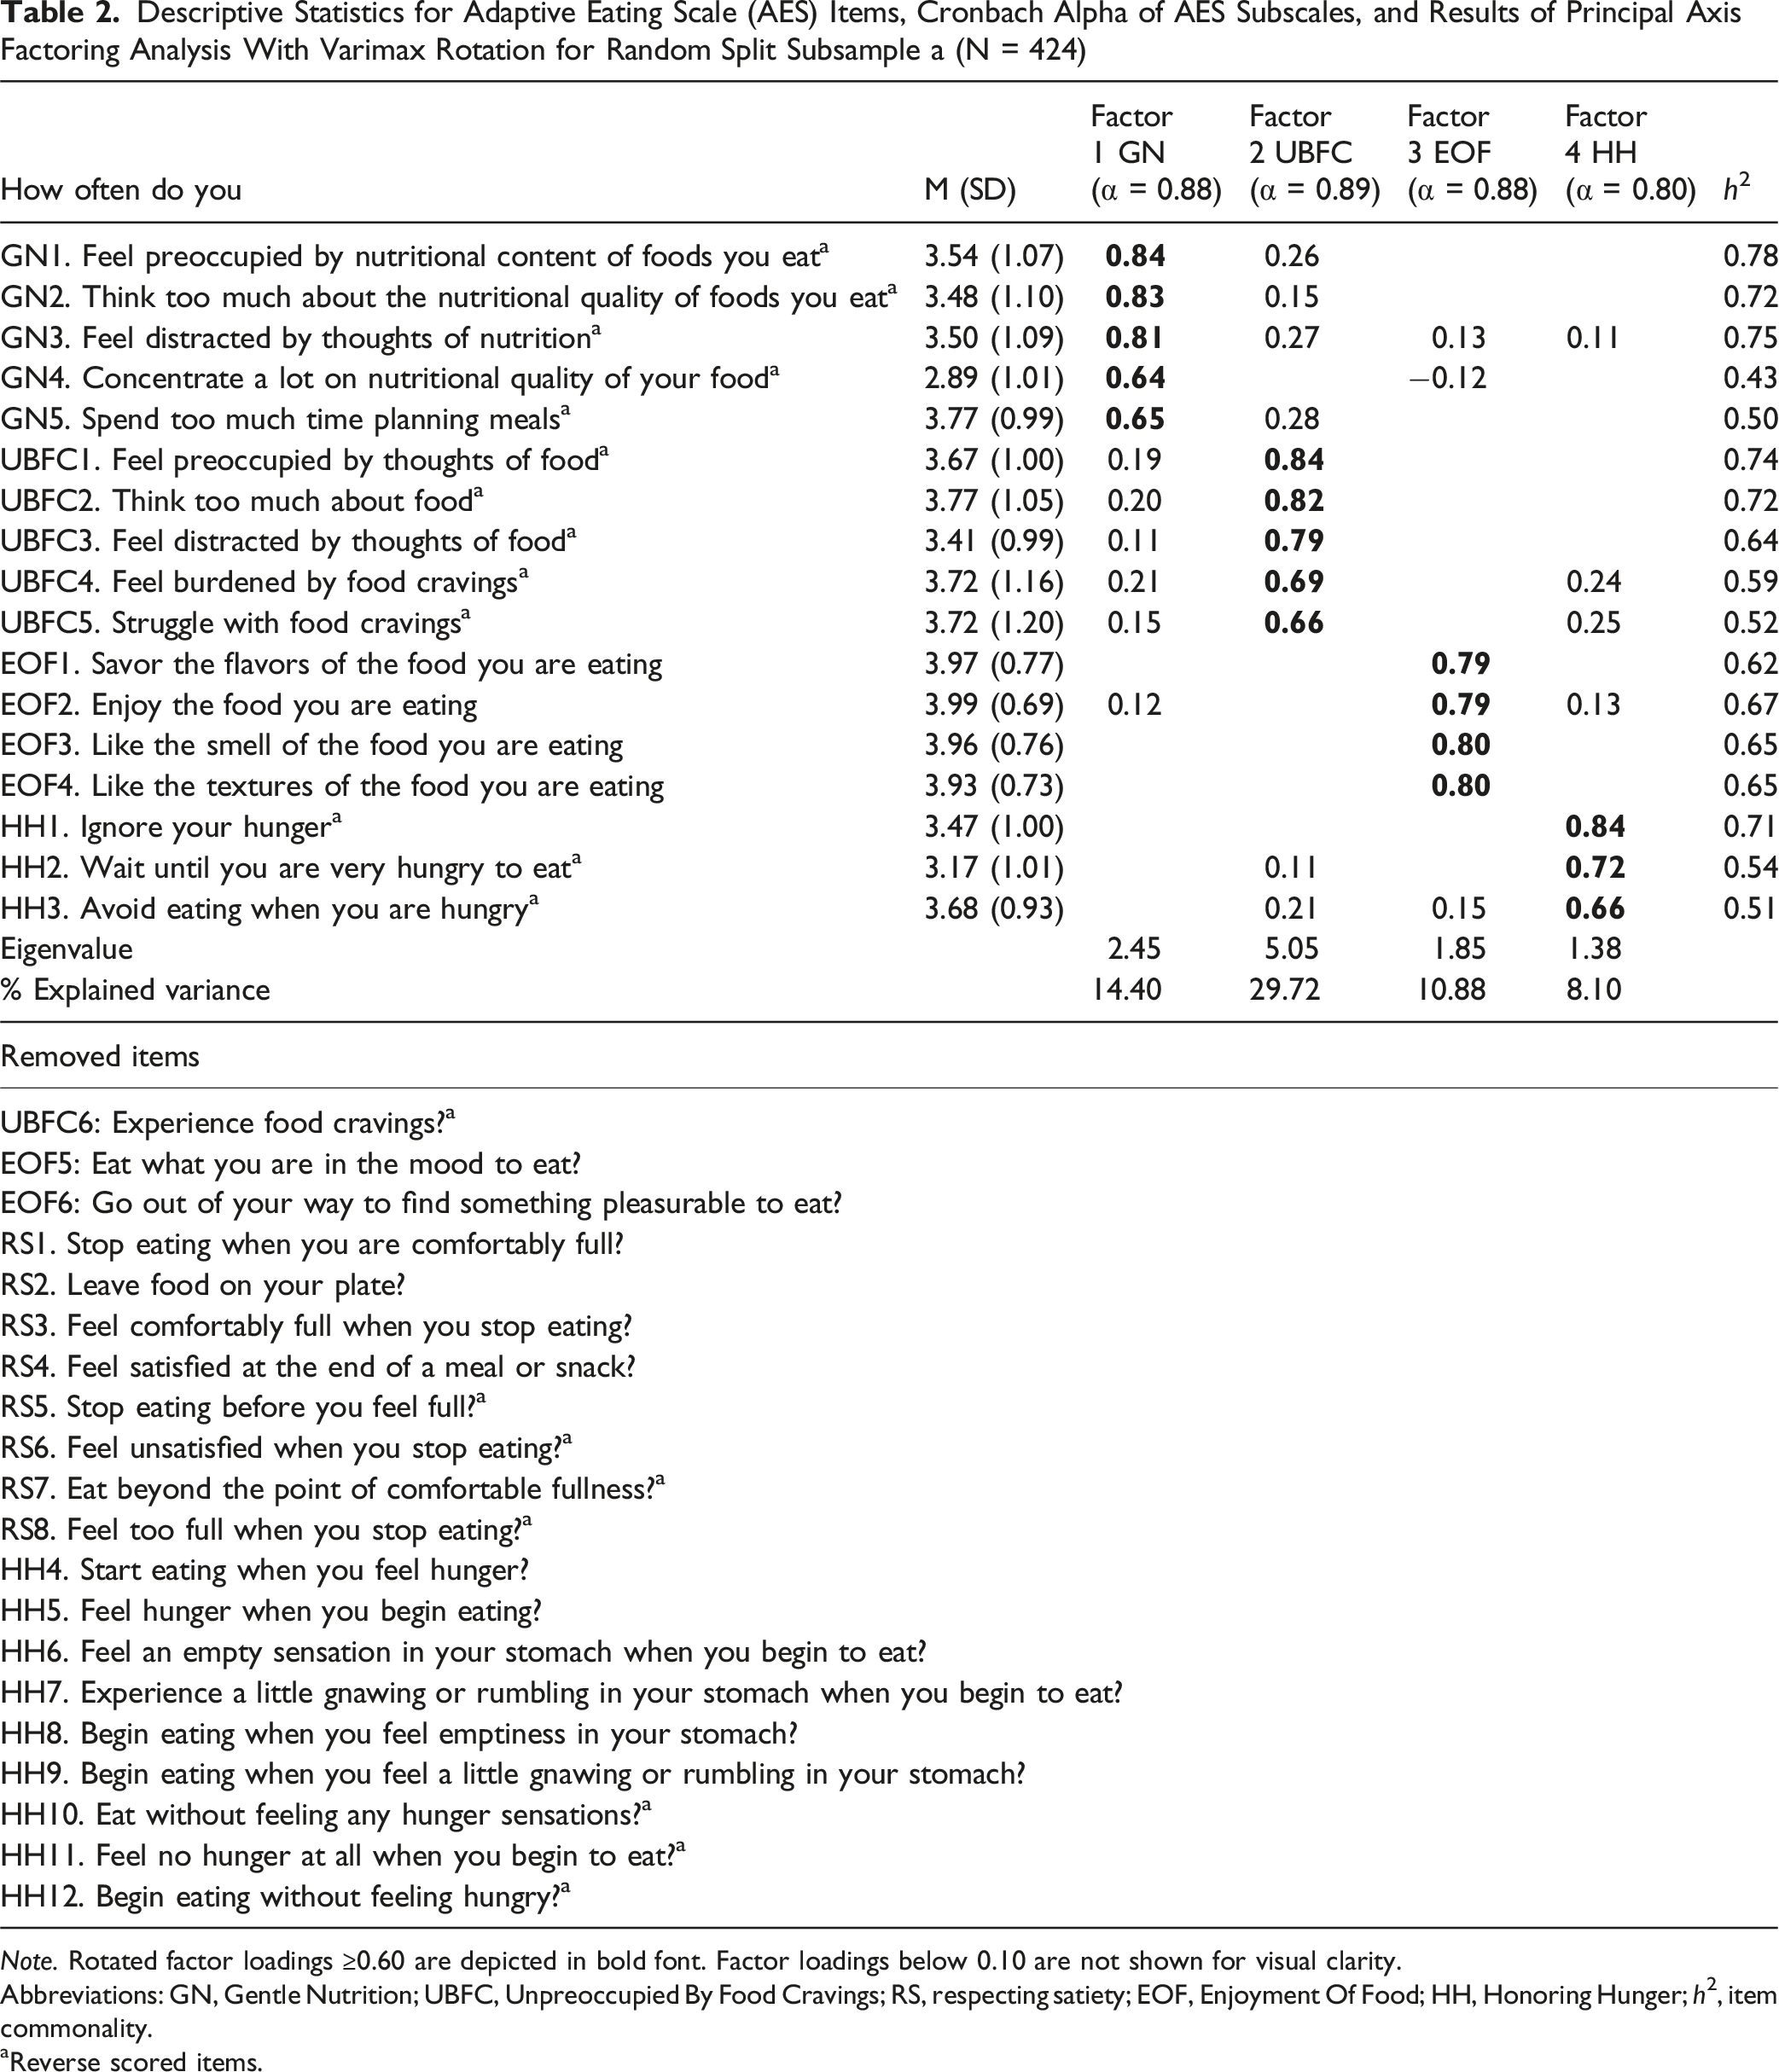
Note. Rotated factor loadings ≥0.60 are depicted in bold font. Factor loadings below 0.10 are not shown for visual clarity.
Abbreviations: GN, Gentle Nutrition; UBFC, Unpreoccupied By Food Cravings; RS, respecting satiety; EOF, Enjoyment Of Food; HH, Honoring Hunger; h2, item commonality.
aReverse scored items.
Internal Consistency and Convergent Validation (Subsample A)
Correlation Table for AES Total and Subscale Scores [Gentle Nutrition (GN), Unpreoccupied With Food Cravings (UBFC), Honoring Hunger (HH), and Enjoyment of Food (EOF)] With Intuitive Eating, Emotional Eating, Diet Quality, Depression, Veggie Meter, Self-Esteem, and Body Mass Index (BMI) for a Random Split Subsample a (n = 424)
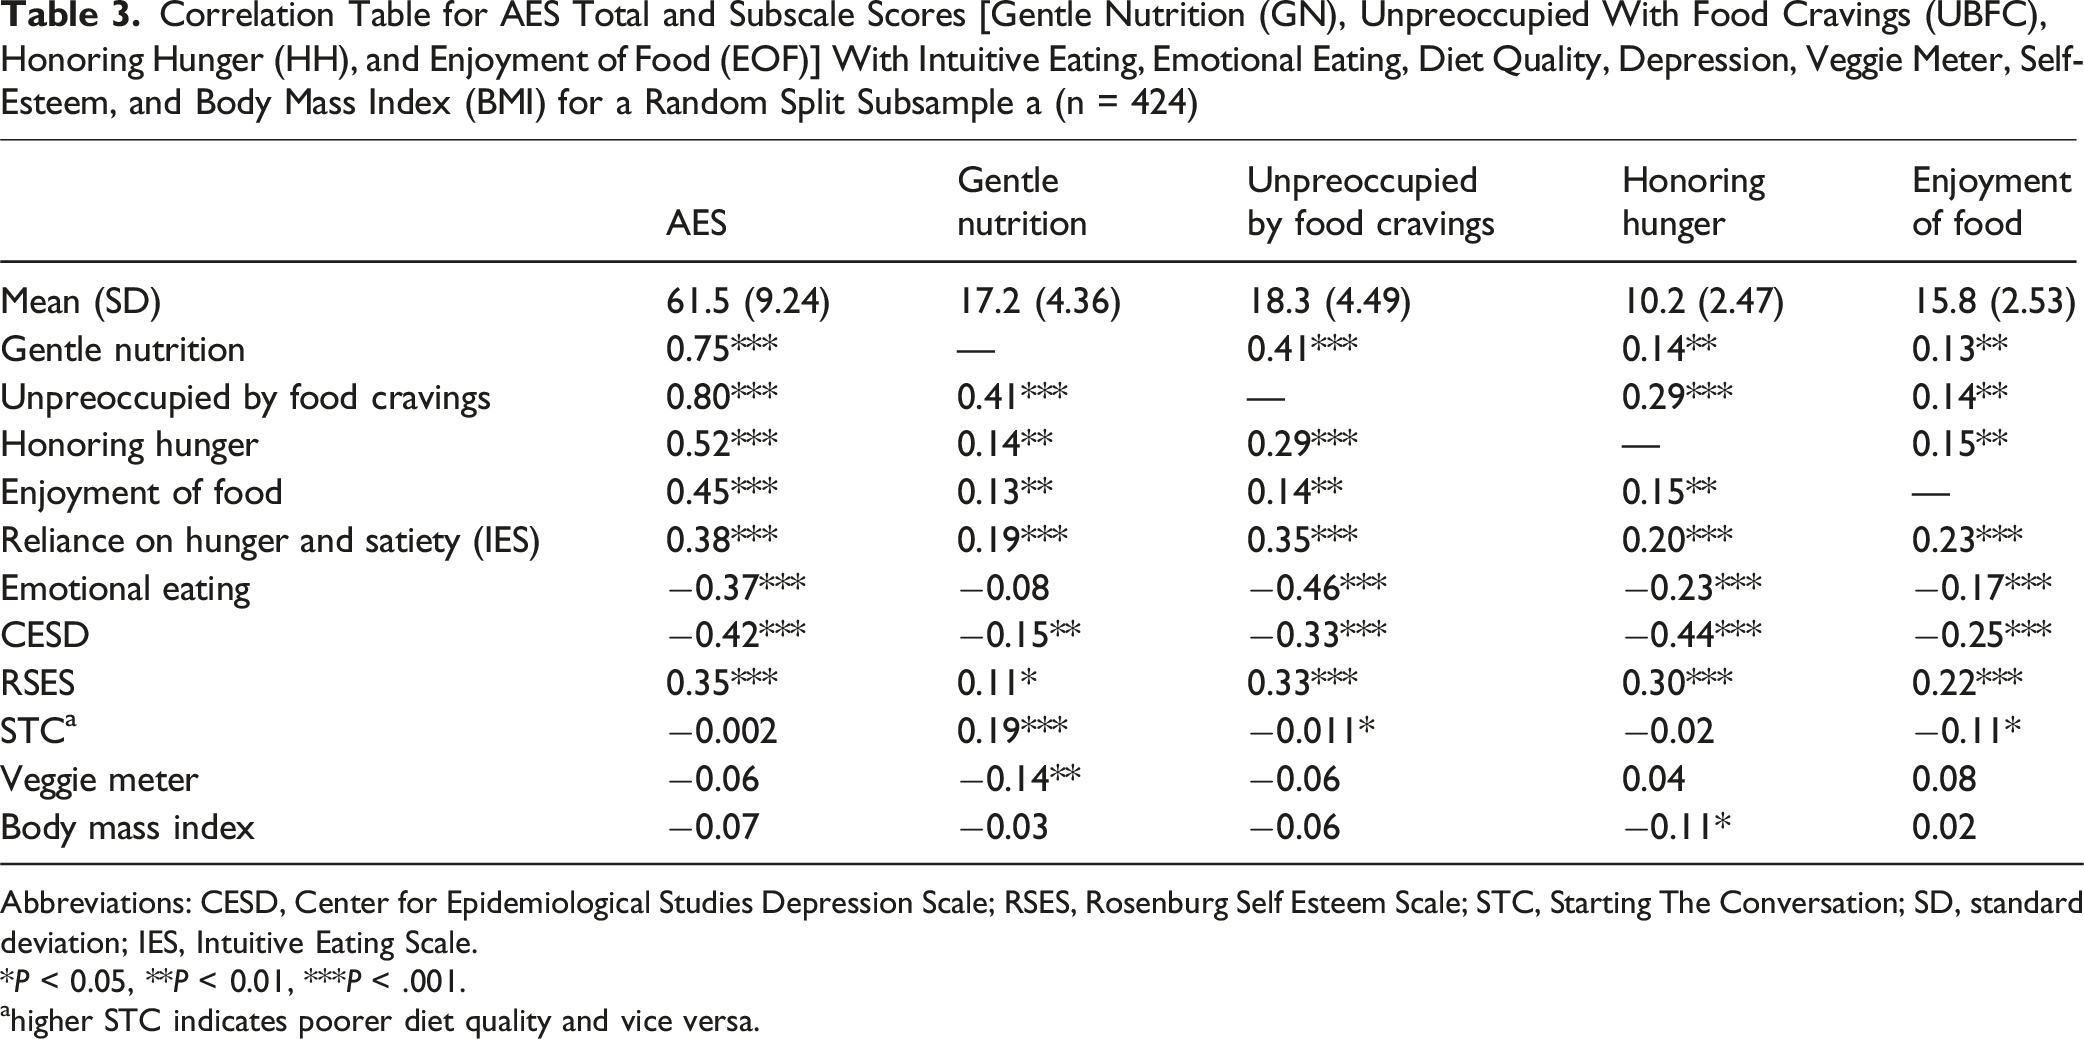
Abbreviations: CESD, Center for Epidemiological Studies Depression Scale; RSES, Rosenburg Self Esteem Scale; STC, Starting The Conversation; SD, standard deviation; IES, Intuitive Eating Scale.
*P < 0.05, **P < 0.01, ***P < .001.
ahigher STC indicates poorer diet quality and vice versa.
CFA (Subsample B)
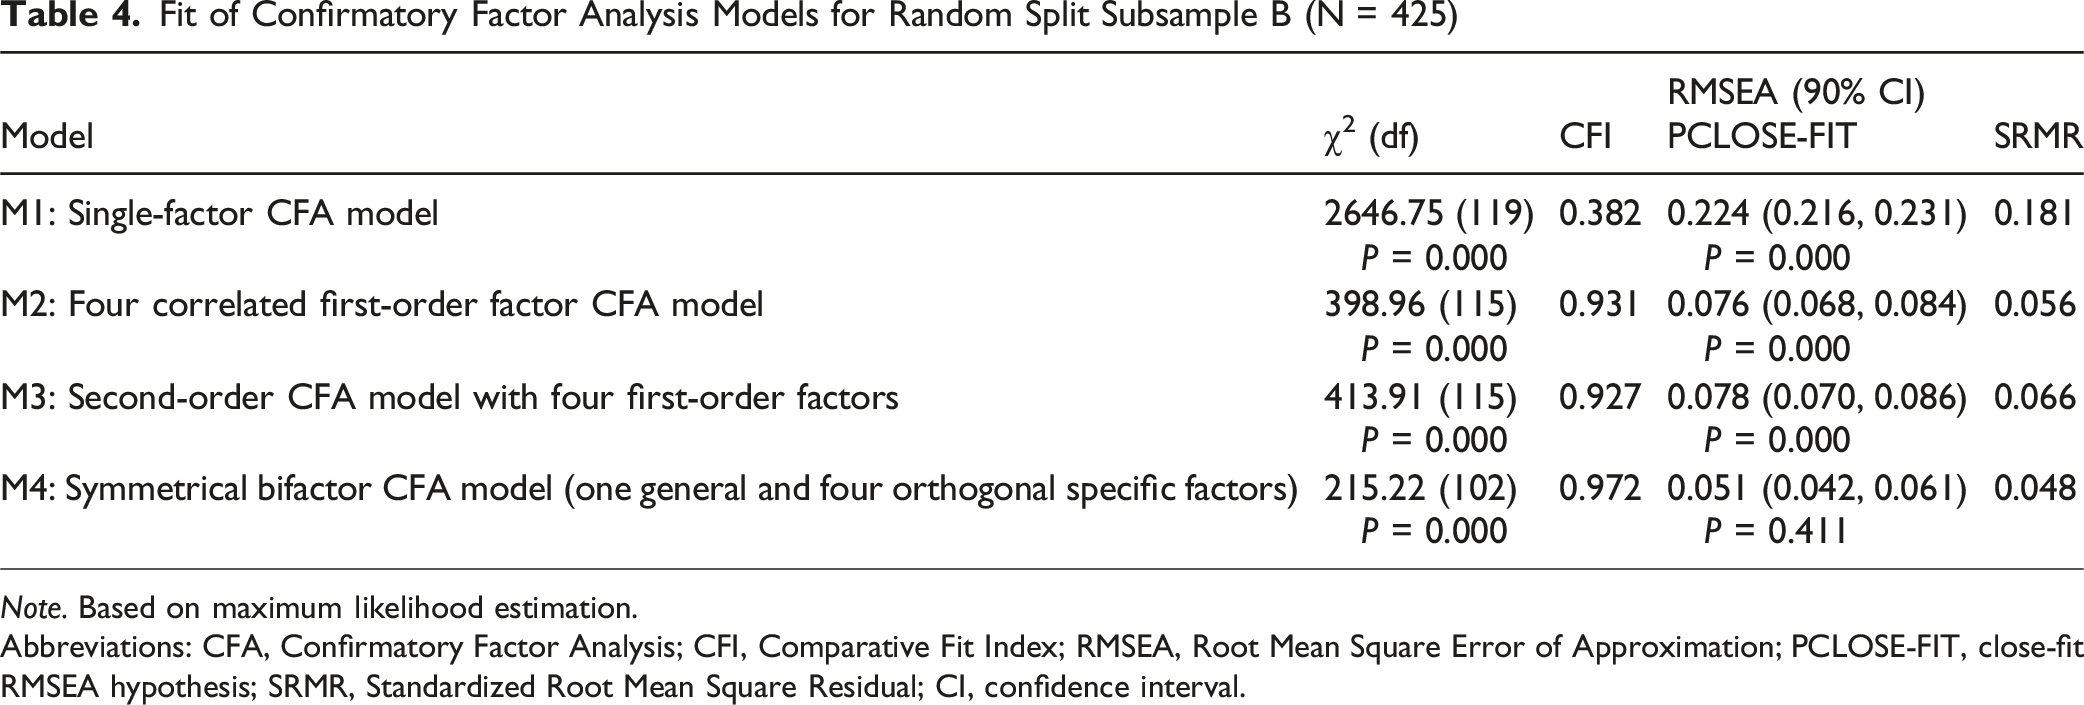
Informed by EFA results, four confirmatory factor analysis (CFA) models were estimated using subsample B (Figure 1 & Table 4). First, a single-factor CFA model (M1): Poor fit (CFI = 0.382, RMSEA = 0.224, SRMR = 0.181), rejected as expected; Second, a four-correlated first-order factor CFA model (M2): Acceptable fit (CFI = 0.931, RMSEA = 0.076, SRMR = 0.056), though RMSEA close-fit hypothesis was rejected. Its completely standardized factor loadings were similar to EFA results from subsample A: GN: 0.63-0.95; UBFC: 0.66-0.90; EOF: 0.74-0.77; HH: 0.75-0.83). The intercorrelations among the 4 first-order latent factors were small-to-moderate (r = 0.00 to 0.40), similar to the EFA (Table 3); Third, a second-order CFA model (M3): This model showed acceptable fit to the data. However, the close-fit RMSEA hypothesis was again rejected (CFI = 0.927, RMSEA = 0.078, SRMR = 0.066). The UBFC first-order latent factor was strongly associated with the general second-order latent factor (completely standardized second-order factor loading: 0.90), whereas the factor loadings of the other first-order latent factors were much smaller in magnitude (EOF = 0.02, HH = 0.33, GN = 0.44); Fourth, a symmetrical bifactor CFA model (M4): Best overall fit (CFI = 0.972, RMSEA = 0.051, SRMR = 0.048), meeting all criteria including RMSEA close-fit. This was selected as the final model. Alternative bifactor models showed, at best, only acceptable fit. Four alternative confirmatory factor analysis models estimated for subsample B. Fit of Confirmatory Factor Analysis Models for Random Split Subsample B (N = 425) Note. Based on maximum likelihood estimation. Abbreviations: CFA, Confirmatory Factor Analysis; CFI, Comparative Fit Index; RMSEA, Root Mean Square Error of Approximation; PCLOSE-FIT, close-fit RMSEA hypothesis; SRMR, Standardized Root Mean Square Residual; CI, confidence interval.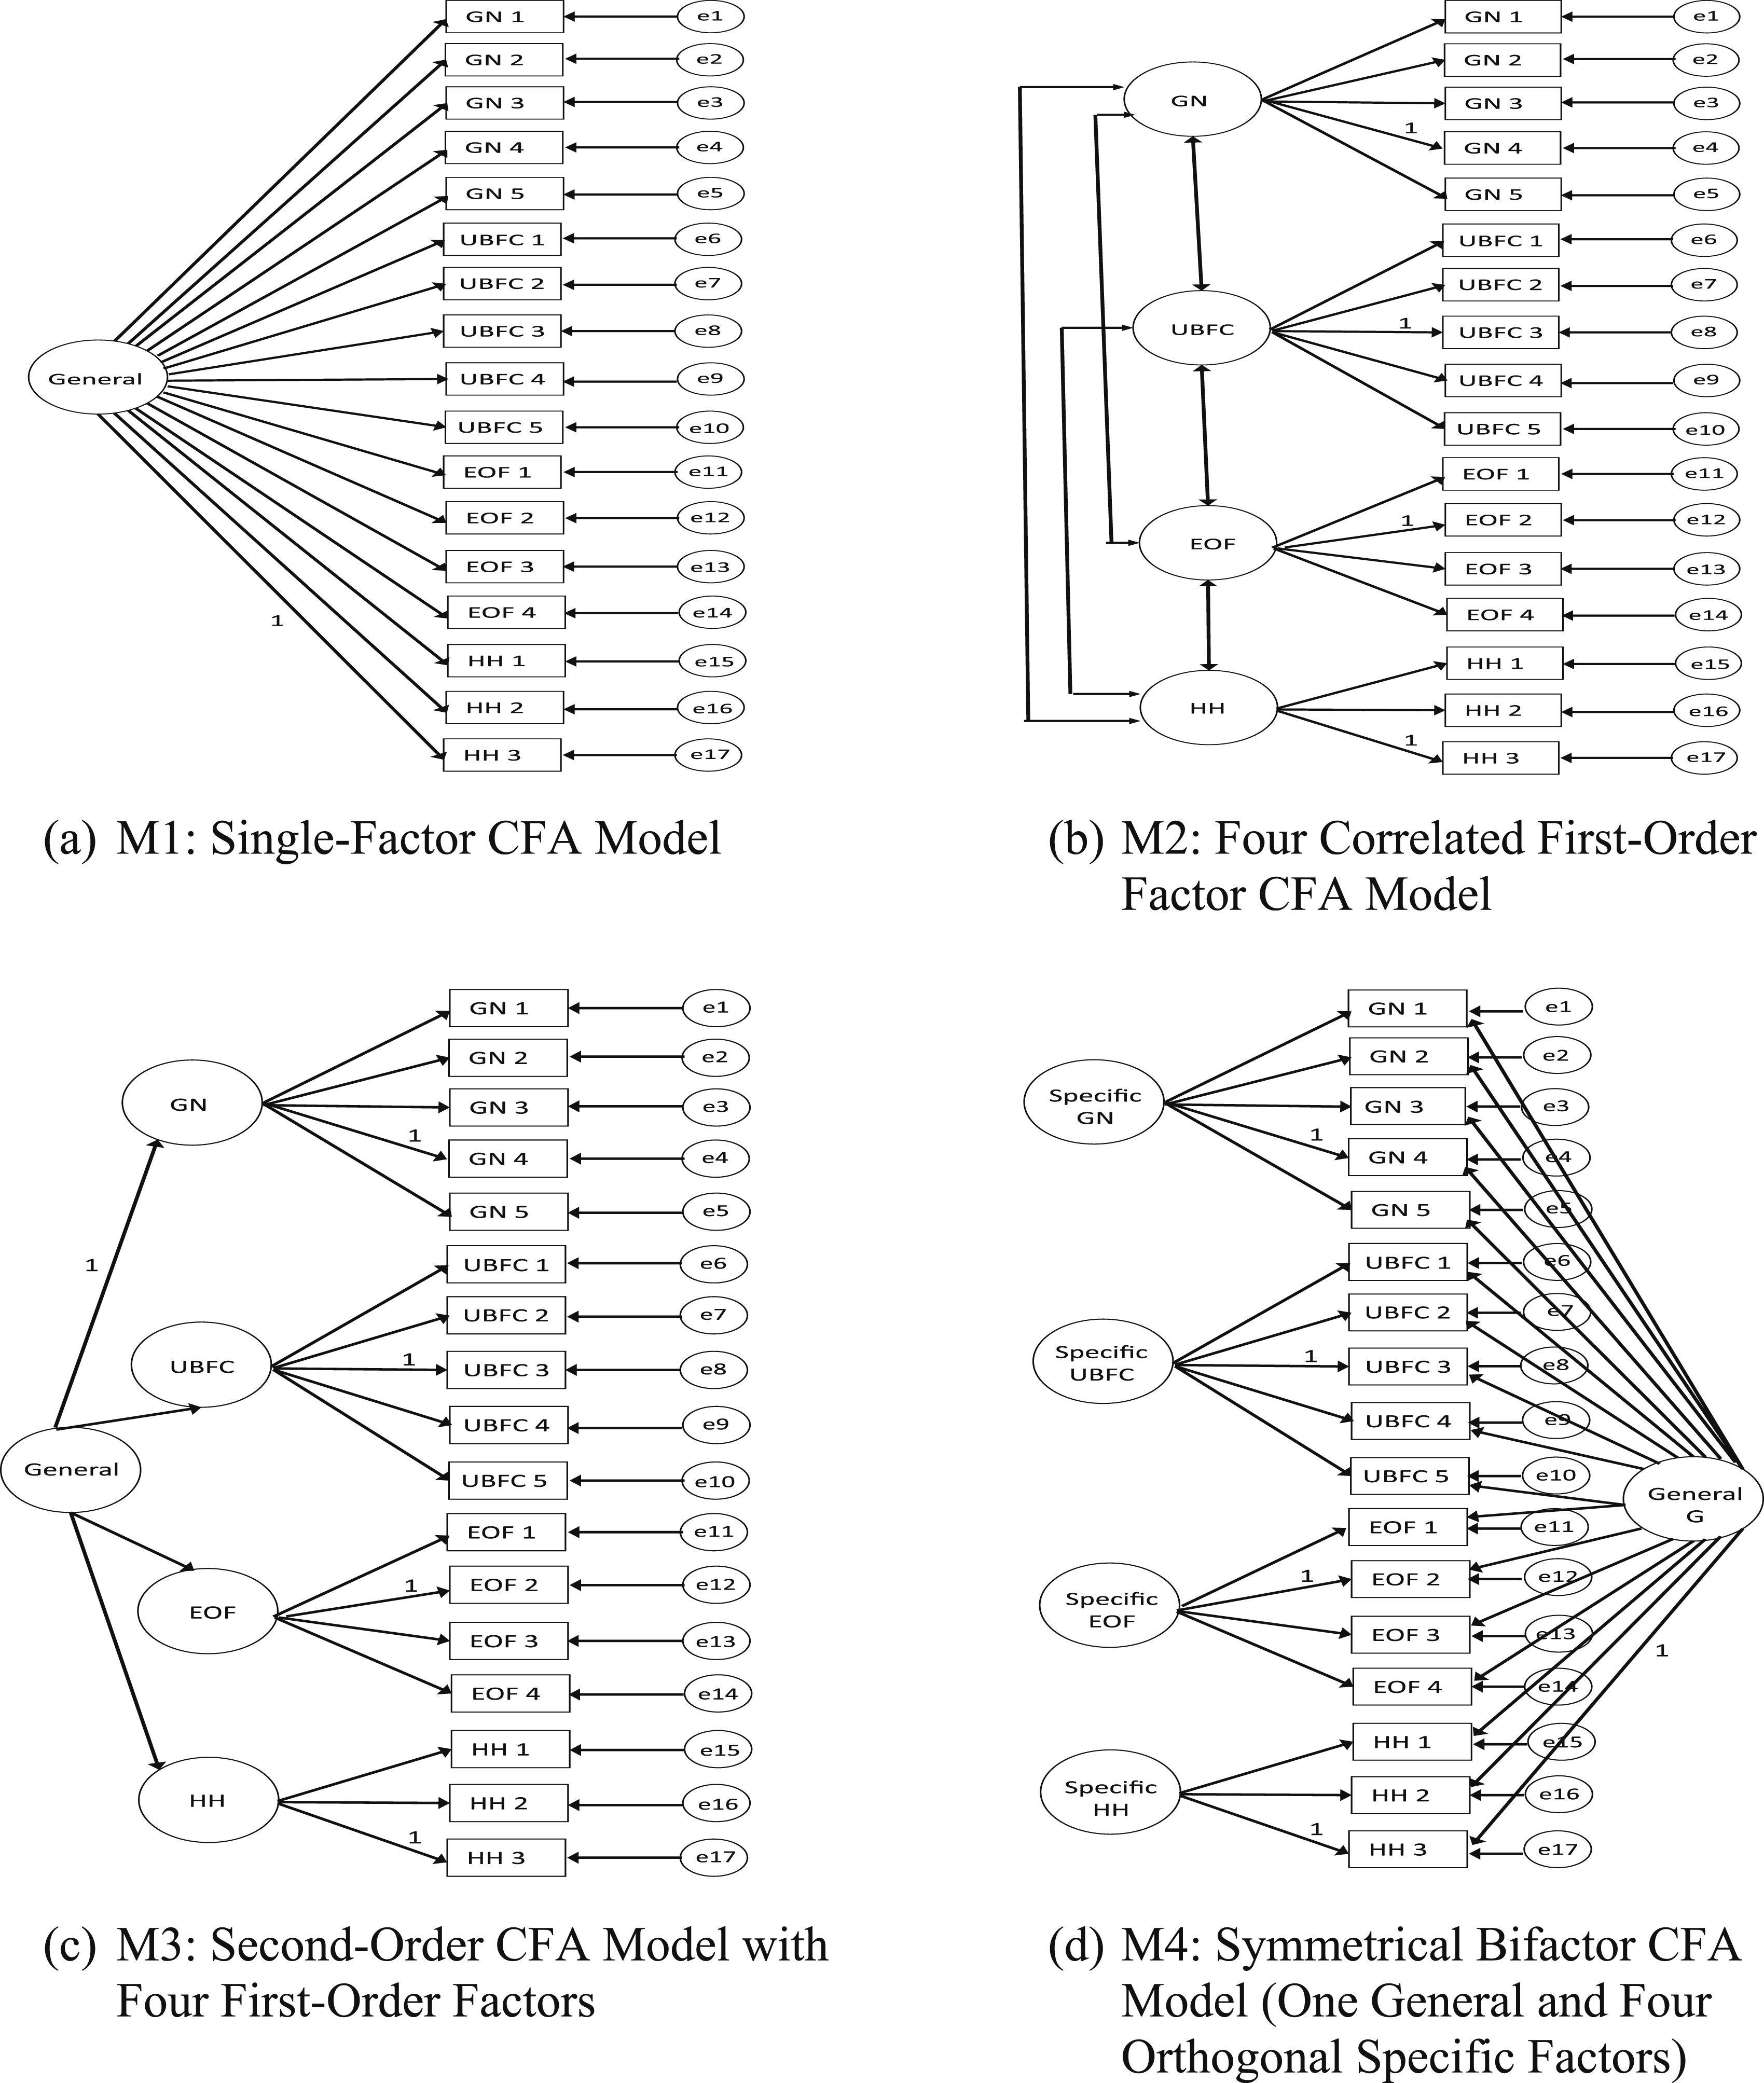
Symmetrical Bifactor CFA Model (Subsample B)
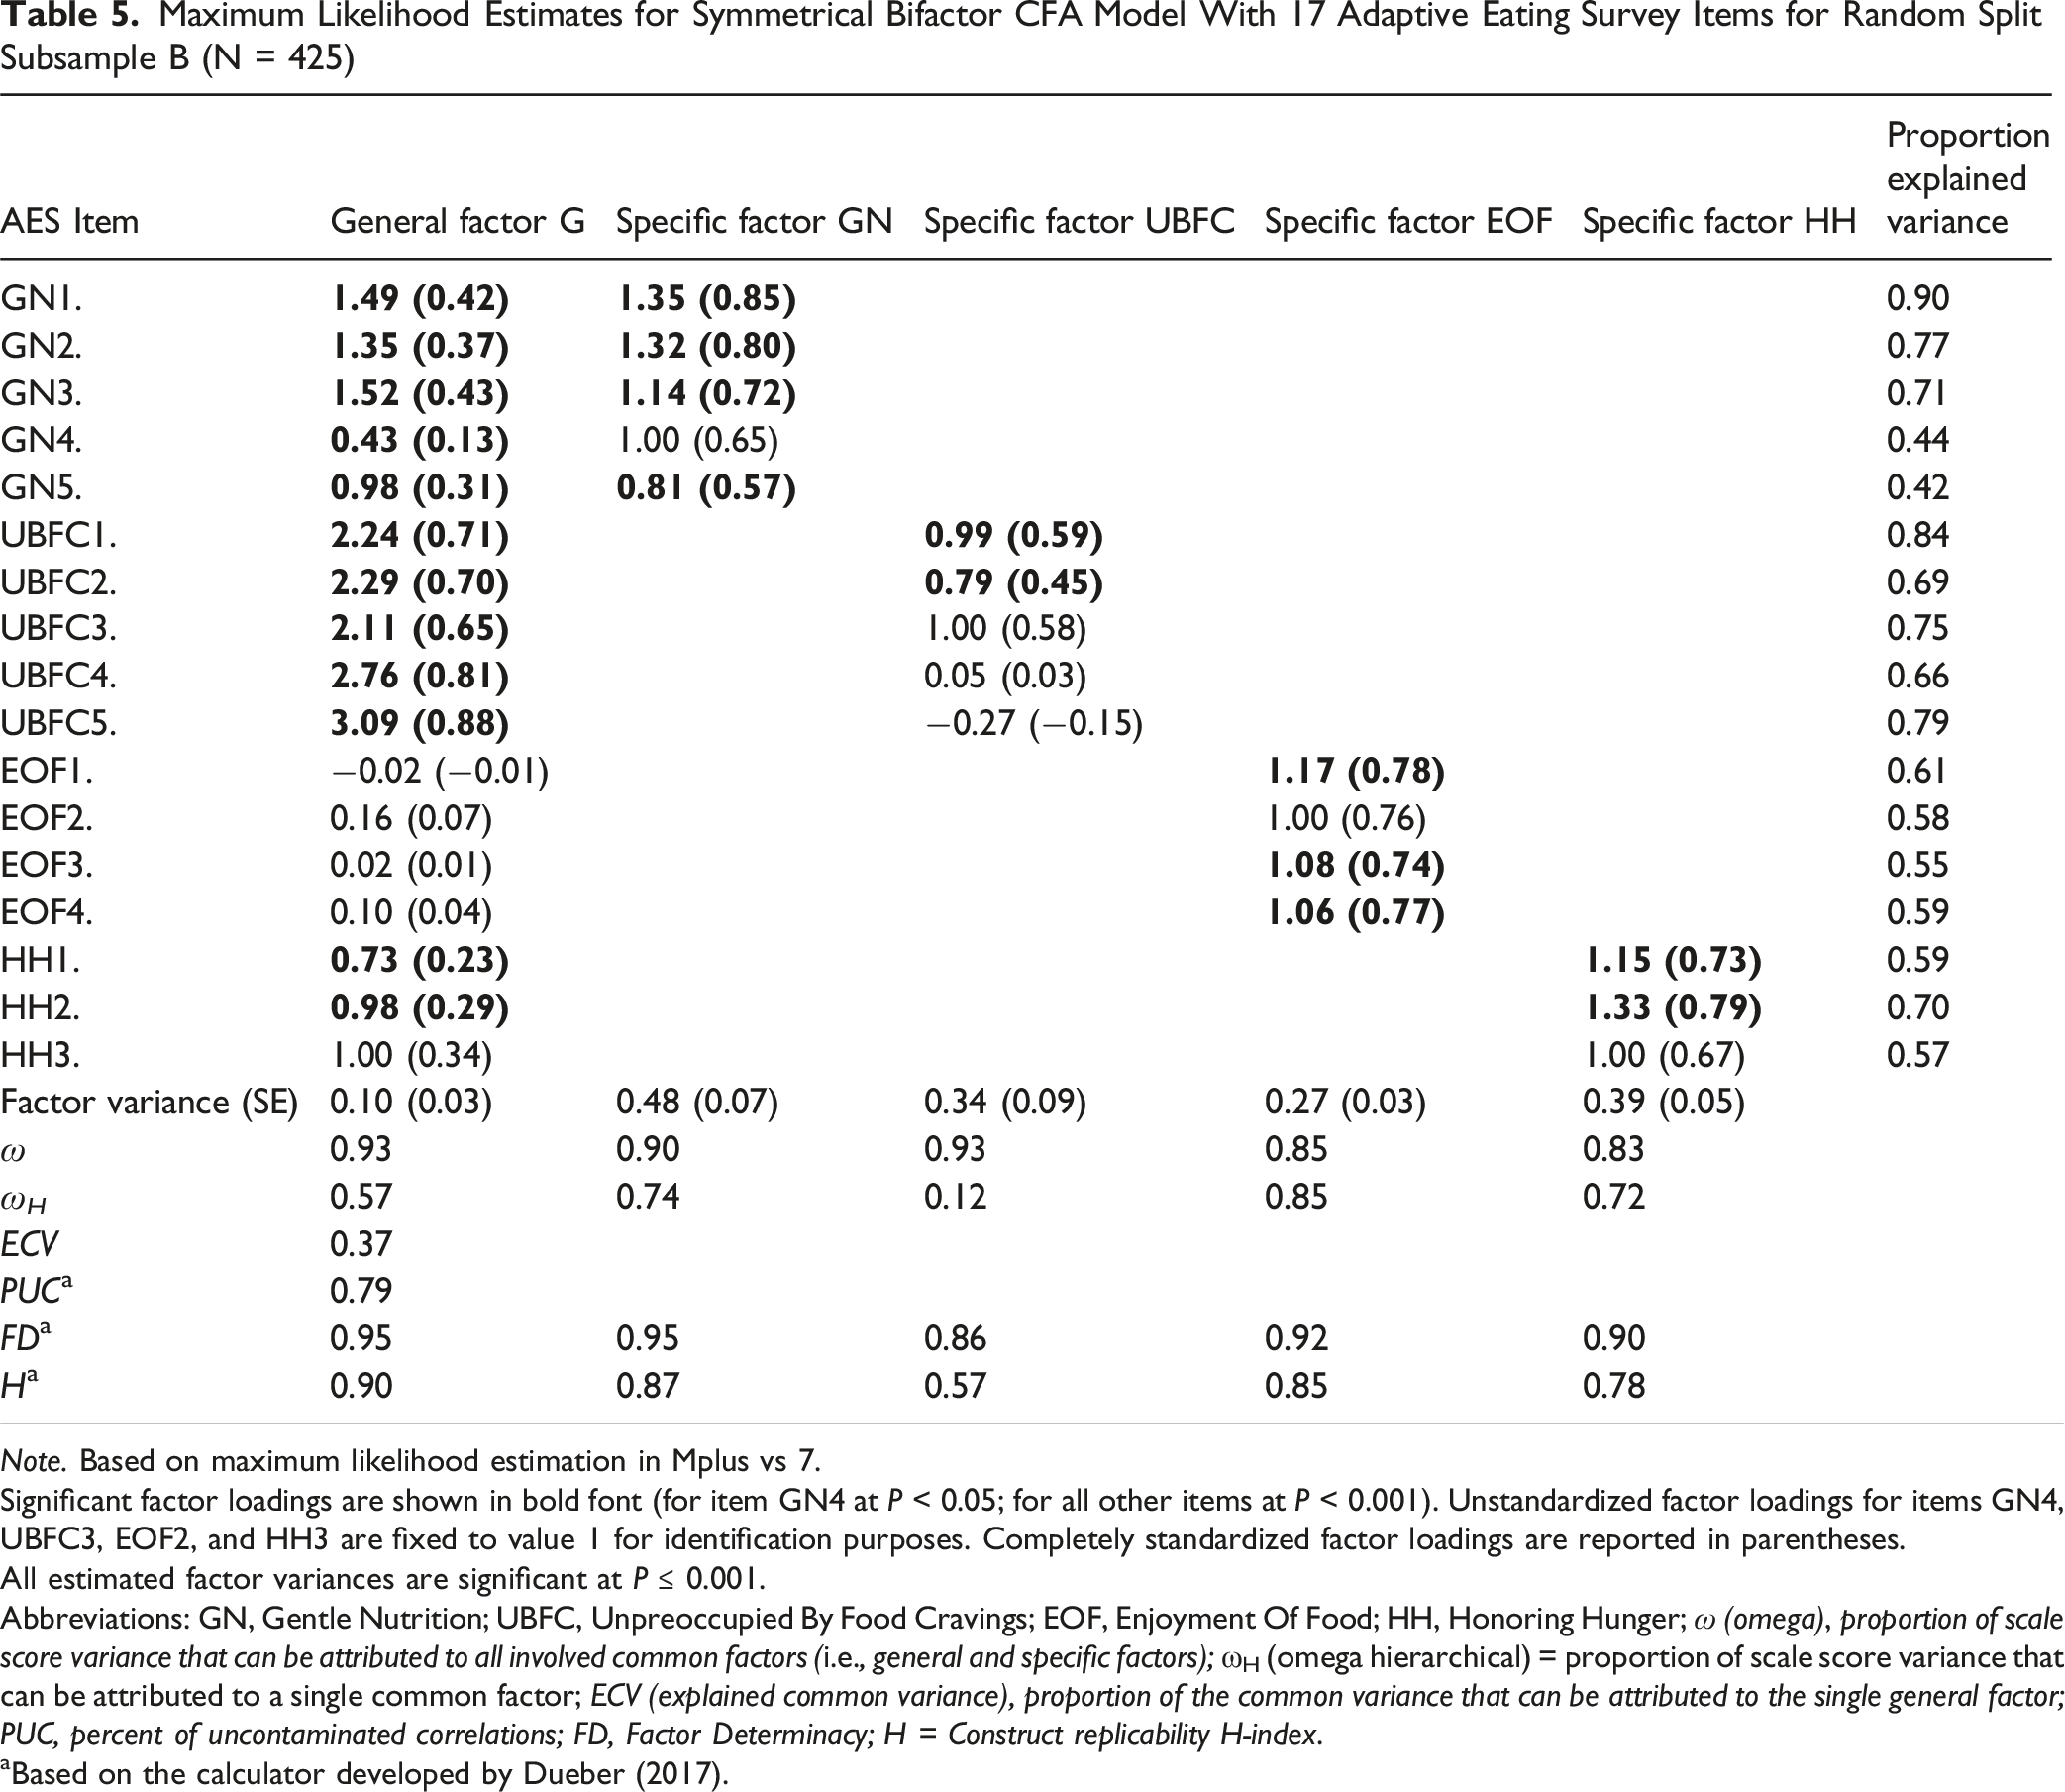
Maximum Likelihood Estimates for Symmetrical Bifactor CFA Model With 17 Adaptive Eating Survey Items for Random Split Subsample B (N = 425)
Note. Based on maximum likelihood estimation in Mplus vs 7.
Significant factor loadings are shown in bold font (for item GN4 at P < 0.05; for all other items at P < 0.001). Unstandardized factor loadings for items GN4, UBFC3, EOF2, and HH3 are fixed to value 1 for identification purposes. Completely standardized factor loadings are reported in parentheses.
All estimated factor variances are significant at P ≤ 0.001.
Abbreviations: GN, Gentle Nutrition; UBFC, Unpreoccupied By Food Cravings; EOF, Enjoyment Of Food; HH, Honoring Hunger; ω (omega), proportion of scale score variance that can be attributed to all involved common factors (i.e., general and specific factors); ωH (omega hierarchical) = proportion of scale score variance that can be attributed to a single common factor; ECV (explained common variance), proportion of the common variance that can be attributed to the single general factor; PUC, percent of uncontaminated correlations; FD, Factor Determinacy; H = Construct replicability H-index.
aBased on the calculator developed by Dueber (2017).
Omega Reliability Coefficients
Model-based omega reliability coefficients assessed the proportion of total scale score variance that can be attributed to (1) all (both general and specific) latent factors that underlie a scale score (ω coefficients) and (2) a targeted latent factor (general or specific only) that underlies the scale score at hand (omega hierarchical (ω H ) coefficients). ω H should exceed 0.50 (preferably>0.75). 40 Findings for ω coefficients indicated a highly reliable multidimensional factor structure (general factor ω = 93% explained variance, the 4 specific factors ω = 83%-93%).
Findings for ω H indicated that the general AES factor was moderately well-defined (57% of the total scale score variance could be attributed solely to the general latent factor). None of the EOF items had significant factor loadings on the general factor, indicating that they had little in common with the items from the other 3 subscales. Three specific factors, GN, EOF, and HH captured unique and reliable information beyond the general factor (ω H = 72-85% of their subscale score variance could be attributed to their specific factor after adjustment for the general factor). However, the UBFC specific factor showed poor reliability (ω H = 12%); most of its subscale score variance was explained by the general factor. Thus, the UBFC-specific factor should be considered negligible and unreliable.
Factor Determinacy and Construct Replicability
The Factor Determinacy (FD) index provides an estimate of the correlation between factor scores and the factors. The range of FD is between 0 and 1, with higher values indicating better determinacy. It is advisable to generate factor scores only when FD is greater than 0.90. 41 With one exception (FD = 0.86 for UBFC), the cut-off was met for the general factor and the other 3 specific factors. This finding suggested that factor scores may be generated for the AES general and GN, EOF, and HH specific factors (but not for UBFC).
The Construct Replicability (H-index) estimates the degree to which a group of items represents the underlying latent factor (cut off >0.7). 42 With one exception (H = 0.57 for UBFC), the AES general and GN, EOF, and HH-specific factors met this criterion. These results suggest that all latent factors (except the UBFC) can be considered stable and replicable across studies.
Dimensionality of AES
A high Explained Common Variance (ECV)-Index value >0.70-0.80 indicates the instrument has a strong general factor compared to specific factors. 42 The observed value (ECV = 0.37) suggested the 17-item instrument cannot be considered sufficiently unidimensional to justify using a one-factor measurement model. Jointly with the ECV-index, the Percentage of Uncontaminated Correlations (PUC)-Index influences the parameter bias resulting from imposing a unidimensional measurement model on a multidimensional bifactor data structure. 42 The value for the AES instrument (PUC = 0.79) stayed below the recommended cut-off. In sum, the ECV- and PUC-index findings are consistent with the poor model fit for the single-factor CFA model (M1).
Discussion
The purpose of this study was to develop and validate the AES. Of the original 37 items, 17 were retained, representing HH, EOF, UBFC, and GN. No items representing RS were retained. The AES is best conceptualized as a multidimensional measure with one general factor and specific factors representing GN, EOF, and HH. Multiple indices suggested that UBFC subscale scores are not reliable.
Although not expected, it is interesting that no RS items were retained in the final model. As with other eating behavior measures the satiety items assessed “fullness” but what made this measure unique was that the items differentiated between “comfortably full” and “too full”. It is possible these subjective terms were interpreted inconsistently by participants, as revealed in previous study on satiety measurement. 43 Moreover, satiety cues are influenced by context and interoceptive awareness, making them difficult to capture reliably through brief self-report items. 44
Implications for Researchers
The findings of this study have important implications for research purposes. First, the hypothesis that the AES represents a unidimensional construct was rejected. Future research aiming to replicate AES factor structure should include bifactor CFA models. Results are consistent with Swami et al (2022) 45 and Tylka et al (2024) 21 who identified a bifactor measurement model for the Intuitive Eating Scale. In their case, a bifactor exploratory structural equation model was chosen. The findings from both studies suggest that bifactor specifications should be included in future measurement model tests of eating behavior scales.
Second, evaluating the utility of subscales in bifactor models remains a methodological challenge.40,42 Our study suggests that the GN, HH, and EOF specific factors were reliably measured and provide unique, meaningful information beyond the general factor. Therefore, it is appropriate to use GN, HH, and EOF subscale scores independently in future research. Conversely, the UBFC factor was not reliably measured and may lack replicability. Pending cross-validation, UBFC subscale scores should not be used independently.
Third, researchers examining how AES is related to external criteria should apply analytical approaches reflecting the multidimensionality of the measure. Chen et al (2012) 46 provided an example of how general and specific latent factors from a bifactor model can be linked to external criteria in a structural regression model. For the AES, the general and 3 specific factors (excluding the UBFC specific factor) should be simultaneously embedded into such models. Because the general and specific latent factors are specified as orthogonal (uncorrelated) in the symmetrical bifactor model, they should be interpreted as distinctive constructs that may be differentially associated with external criteria. Bifactor models may also be used to test differences in latent factor means of both the general and specific factors (eg, across gender groups after measurement invariance has been established). 46 We recommend using this approach in future research because evidence of differential associations with external criteria would further bolster the viability of the GN, HH, and EOF subscales.
Implications for Theory
Wellness is achieved when humans routinely experience positive emotions, participate in meaningful activities, have positive relations, practice mindfulness, and attain goals. 15 Eating that is internally regulated, enjoyable, and gently guided by nutrition, should support wellness. An expert panel of dietitians and psychologists confirmed this definition was consistent with goals they have for their patients. While our definition of adaptive eating was based on research, theory, and clinical expert feedback, the psychometric properties of the AES suggest adaptive eating may not be a valid construct.
The factor structure of the final 17 items of the AES represents a construct different from that defined initially. The items clustered more into GN, EOF, and HH categories than around the general AES construct. Twenty items (including all satiety items) from the original pool did not load significantly on any factors. Three items that were originally conceptualized to represent UBFC did not reliably share variance with each other, although they contributed to the general factor. It is possible that adaptive eating as originally defined, is not a valid construct, meaning it is not a naturally occurring phenomenon. Alternatively, it may be possible but incredibly rare for people to have the constellation of behaviors that make up adaptive eating as we defined it. Additionally, item wording may not have captured the intended meaning among this population. Future qualitative research could help identify the language for assessing adaptive eating accurately.
As independent measures, HH, EOF, and GN showed factorial and concurrent validity. In addition to being positively correlated with each other, these subscales were associated with internally regulated eating and mental health, demonstrating congruence with wellness and positive psychology. Relationships with diet quality and BMI were more variable. HH was not associated with diet quality. GN was weakly associated with poorer diet quality, and UBFC and EOF were associated with better diet quality. In today’s obesogenic society, where low-quality foods are abundant, a strong, committed approach to nutrition rather than a gentle one may be necessary to achieve a higher-quality diet. Most people crave highly palatable, high-sugar, high-fat foods; thus, it is not surprising that those who are unpreoccupied with food cravings also enjoy a higher-quality diet. The positive association between EOF and diet quality aligns with evidence that relaxed, enjoyment-based eating attitudes support greater dietary variety, higher fruit and vegetable intake, and overall higher diet quality.47,48 For BMI, only HH was inversely associated, while GN and EOF were not. Findings from previous studies have produced variable results on the relationship between intuitive eating and dietary quality,49-53 and mindful eating and BMI.54,55 It seems that HH, EOF, and GN may support general wellbeing, but this may not necessarily support healthier diet quality or body composition.
Strengths and Limitations
The results of the study should be considered within the context of the strengths and limitations of the study. This study was strengthened by a multi-step theory-based process for developing the AES, a large diverse sample, and use of validated instruments. Results are generalizable to college students from multiple racial/ethnic and socioeconomic groups at large Hispanic and Asian serving universities. The participants were not chosen randomly, and the sample was made up of students enrolled in an introductory science course, which may increase selection bias. Additionally, reliance on self-reported data raises the possibility of social desirability bias. 56 Future research should aim to replicate these findings using nationally representative samples.
Conclusion
The AES is best conceptualized as a multidimensional measure with a general factor and specific factors of GN, EOF, and HH. Subscale scores for GN, EOF, and HH may be useful in future research. Further studies are needed to assess the feasibility of adaptive eating among American college students, including internally regulated eating guided by enjoyment and moderate nutritional concern. Research should also explore the role of satiety in adaptive eating and evaluate the scale’s applicability in more diverse populations beyond college students. Understanding adaptive eating behaviors may drive innovative interventions to promote well-being beyond simply decreasing disease risk. Maladaptive eating behaviors increase risk for chronic disease and mental health issues. This study introduces and validates the AES, a reliable tool measuring adaptive eating as internally regulated, enjoyable, and nutrition guided. The AES offers a valid measure for assessing positive eating behaviors and can inform interventions promoting balanced, non-restrictive eating in young adults.So What?
What is Already Known on This Topic?
What Does This Article Add?
What are the Implications for Health Promotion Practice or Research?
Supplemental Material
Supplemental Material - Development and Validation of the Adaptive Eating Scale: Exploratory and Confirmatory Factor Analyses
Supplemental Material for Development and Validation of the Adaptive Eating Scale: Exploratory and Confirmatory Factor Analyses by Sheida Zeraattalab-Motlagh, Margit Wiesner, Cynthia Yoon, Sarah Sasson, Randi Betts, Craig Johnston and Tracey Ledoux in American Journal of Health Promotion
Footnotes
Ethical Considerations
Consent was written and collected before individuals began the study. This survey was also affirmed by the University of Houston Human Subjects Review Committee.
Consent for Publication
Consent was obtained from all study participants for publication.
Author Contributions
Funding
The authors received no financial support for the research, authorship, and/or publication of this article.
Declaration of Conflicting Interests
The authors declared no potential conflicts of interest with respect to the research, authorship, and/or publication of this article.
Data Availability Statement
The current study’s datasets are available from the corresponding author for use and analysis.
Supplemental Material
Supplemental material for this article is available online.