
Abstract
Objective
To conduct a systematic review of process evaluations (PEs) of diabetes self-management programs (DSMPs).
Data Source
An electronic search using Medline (Ovid), Embase (Ovid), CINAHL (Ensco), Academic Search (Ebsco), and APA PsycInfo (Ebsco).
Study Inclusion and Exclusion Criteria
Peer-reviewed, empirical quantitative, qualitative, or mixed-method studies were included if they (1) were a traditional, group-based DSMP, (2) involved adults at least 18 years with T1DM or T2DM, (3) were a stand-alone or embedded PE, and (4) published in English.
Data Extraction
The following process evaluation outcomes were extracted: fidelity, dose delivered, dose received, reach, recruitment, retention, and context. Additional items were extracted, (eg, process evaluation type, data collection methods; theories; frameworks or conceptual models used to guide the process evaluation, and etc).
Data Synthesis
Due to heterogeneity across studies, studies were synthesized qualitatively (narratively).
Results
Sixty-eight studies (k) in 78 articles (n) (k = 68; n = 78) were included. Most were mixed methods of low quality. Studies were typically integrated into outcome evaluations vs being stand-alone, lacked theoretical approaches to guide them, and incorporated limited outcomes such as dose received, reach, and retention.
Conclusion
Future research should 1) implement stand-alone theoretically grounded PE studies and 2) provide a shared understanding of standardized guidelines to conduct PEs. This will allow public health practitioners and researchers to assess and compare the quality of different programs to be implemented.
Objective
Approximately 537 million adults between the ages of 20-79 years are living with diabetes mellitus (DM) worldwide, with the prevalence expected to rise to 643 million by 2030 and 783 million by 2045. 1 Because of this, Diabetes Self-Management Programs (DSMPs) have been utilized to facilitate the knowledge and skills needed for diabetes self-care in addition to the activities that assist an individual in implementing and sustaining behaviors required to manage the condition on an ongoing basis.
Findings have offered strong support that successful implementation of DSMPs are associated with better outcomes (ie, improved hemoglobin A1C levels, health indicators, self-efficacy, and self-care behaviors).2-7 Durlak and colleagues’ review shows that data from nearly 500 studies evaluated in 5 meta-analyses indicate that the magnitude of mean effect sizes is at least 2 to 3 times higher when programs are carefully implemented and free from serious implementation errors. 7 Hence, process evaluations are needed to assess the implementation of programs. 7
Previous systematic reviews have addressed the use of process evaluations in health-related interventions.7-13 Yet, few systematic reviews have explored the use of each process evaluation outcome in studies conducted on any DSMPs, more particularly traditional (face-to-face), group-based programs. For these reasons, a systematic review focused on these programs was conducted to assess the following research questions: 1) What is known from the existing literature about stand-alone or embedded process evaluations of any traditional, group-based DSMPs?, 2) Which process outcomes are commonly characterized in traditional, group-based DSMPs?, and 3) What methods have been used to conduct process evaluations of any traditional, group-based DSMPs?
Saunders, Evans, and Joshi’s (2005) process evaluation guide and book for health promotion program implementation were employed as a framework for evaluating the published literature and synthesizing the findings of this review.14,15 To simplify the terminology, process, feasibility, and acceptability evaluations and/or assessments will be called “process evaluations.”14,15
Methods
This review was performed in accordance with the Preferred Reporting Items for Systematic Reviews and Meta-Analyses (PRISMA) statement. 16 The review protocol registered a priori, is published online in the International Prospective Register of Systematic Reviews (PROSPERO) database (PROSPERO registration number CRD42020177170). 16
Data Sources
The following bibliographic databases were searched till January, 12, 2024: Medline (Ovid), Embase (Ovid), CINAHL (Ebsco), Academic Search (Ebsco), and APA PsycInfo (Ebsco). The search strategy was developed by a Texas A&M University librarian who specialized in conducting systematic literature reviews. The search included 3 concepts: diabetes, self-care, and implementation. Each of these concepts were searched with multiple synonyms and keywords as appropriate for each database. The electronic search was supplemented by searching for relevant studies and reviewing the grey literature.
Inclusion & Exclusion Criteria
Empirical studies were included if they: 1) contained 1 or more traditional, group-based DSMPs (ie, diabetes education programs, group medical visits, peer support groups, and hybrid models), 2) involved adults at least 18 years of age with either T1DM or T2DM determined by specifications in the methods or results sections (ie, eligibility criteria, the ranges of ages for included participants, or by the average age of included participants), 3) were a stand-alone or embedded process evaluation that incorporated at least 1 process outcome [ie, fidelity, dose delivered, dose received, reach, retention, recruitment and context]), 4) were a quantitative, qualitative, or mixed-method study, and 5) were published in English. Adults at least 18 years of age and older with either T1DM or T2DM were included 1) to increase the number of studies retrieved for this systematic review and 2) because of their ability to a) self-direct their learning, b) draw on life experiences to assist with learning, and c) apply new knowledge to real-life situations and problems.17,18
Study Selection
Three investigators independently screened the same titles and abstracts; those retained were subjected to full-text review. Forward and backward citations and additional searching via the grey literature were performed. Each article was subjected to data extraction, and its methodological quality was appraised concurrently. Disagreements were resolved on study selection and extraction by consensus if needed.
Data Extraction and Quality Appraisal
A data-extraction form was developed by the primary investigator and pilot-tested by all authors. 19 2 investigators independently extracted the data for each included study, discussed results, and resolved disagreements through discussions between investigators. Examples of items extracted include (1) process evaluation research design type, (2) process evaluation type, (3) process evaluation outcomes, (4) overall methods of data collection, (5) qualitative methods of data collection, (6) quantitative methods of data collection, (7) thematic analysis of process evaluation terms, (8) theories, frameworks, or conceptual models used, and (9) timing of data collection.
The Mixed Method Appraisal Tool (MMAT) was used to critically appraise each included study’s quality. MMAT is designed to appraise systematic mixed-method reviews and permits the appraisal of 5 categories of empirical studies: qualitative research, randomized controlled trials, non-randomized studies, quantitative descriptive studies, and mixed methods studies.20,21 Based on MMAT’s classification of empirical studies, the studies included in this review composed of more than 1 article were categorized as a combination of the research designs of their separate articles (i.e., 1 RCT +1 QUAL-type study).
Furthermore, if the process evaluation was embedded (integrated) into an outcome evaluation-focused article, then that article’s study design was deemed the process evaluation research (study) design. For example, if a non-randomized study aimed to measure the effectiveness of diabetes education on clinical outcomes, such as hemoglobin A1C, but included assessments of feasibility and acceptability of the intervention to assess the implementation of the program, then, this would be considered an integrated (embedded) process evaluation with a non-randomized research (study) design.
Data Synthesis
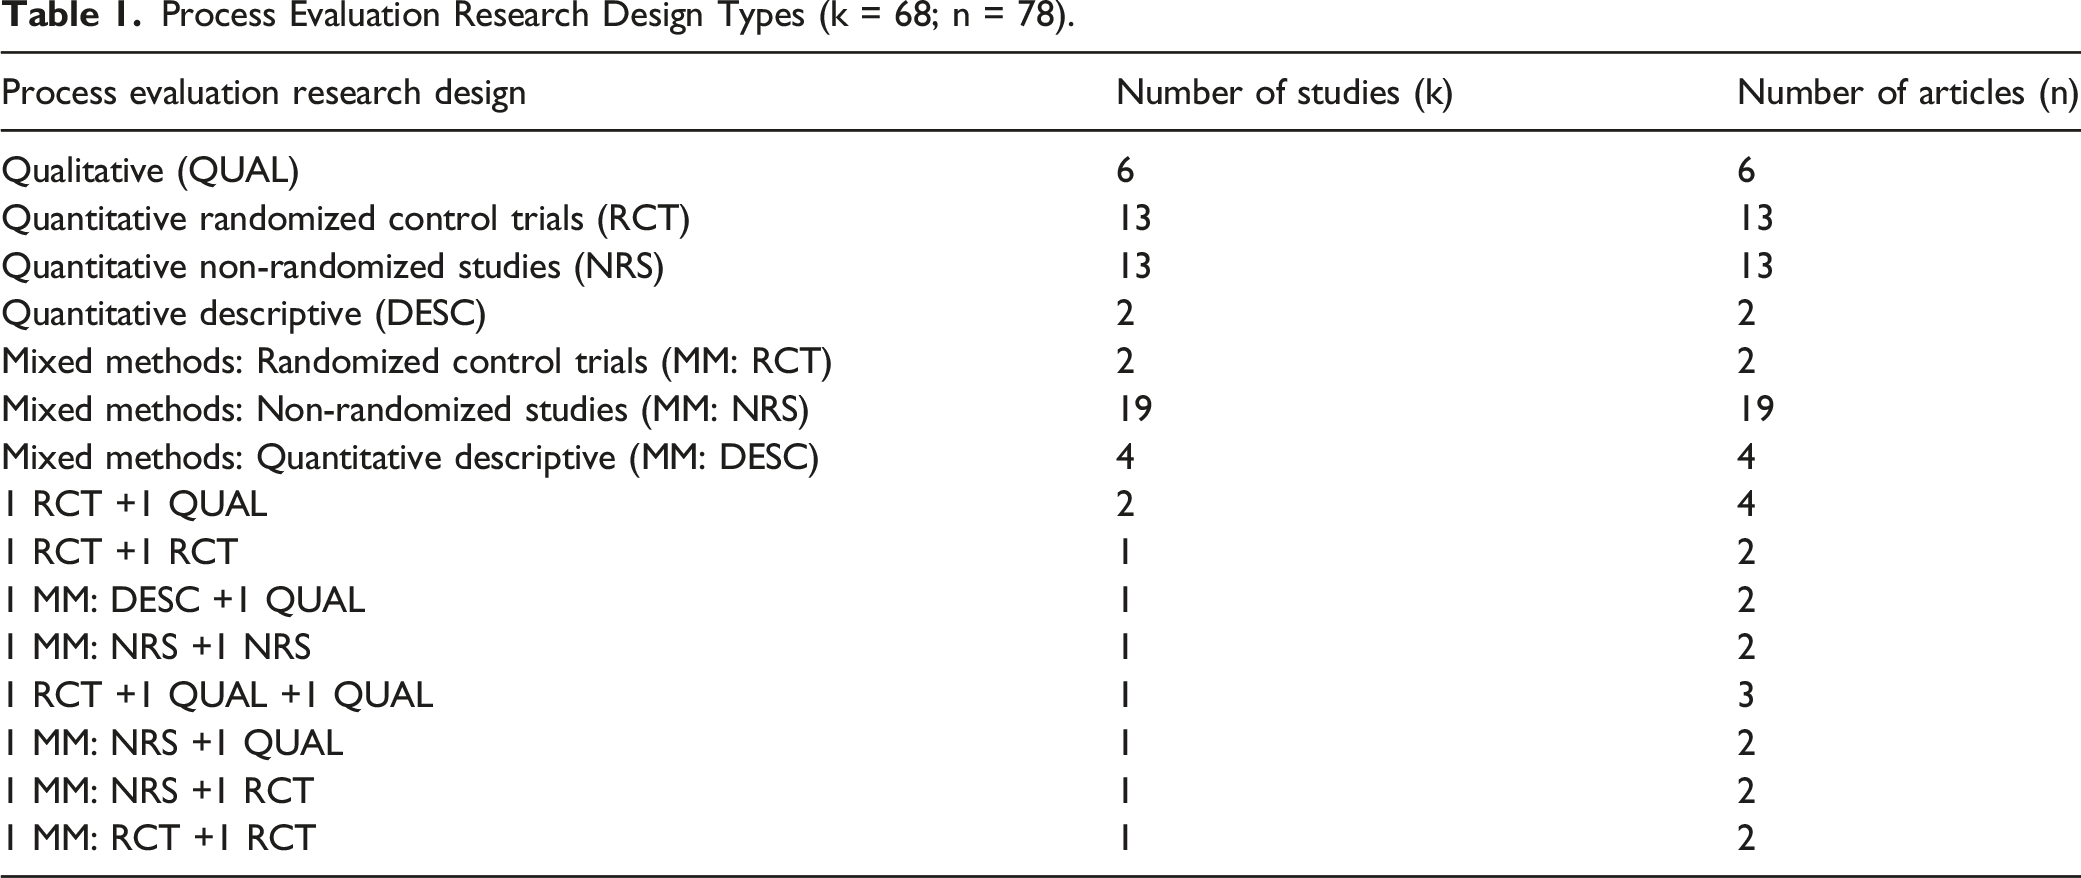
Process Evaluation Research Design Types (k = 68; n = 78).
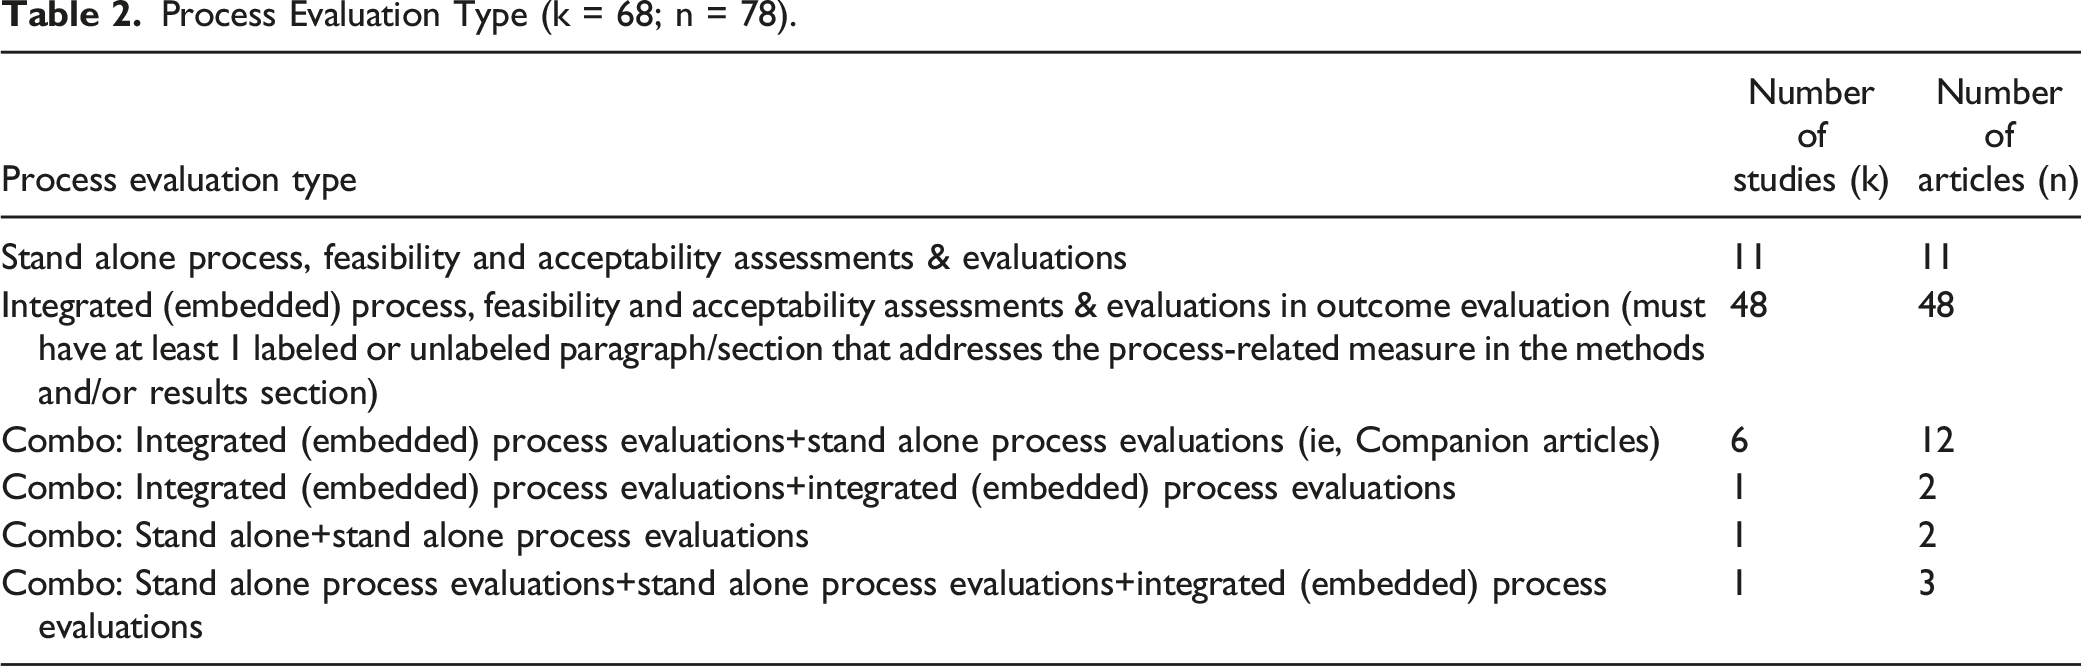
Process Evaluation Type (k = 68; n = 78).
Stratification of Process Evaluation Outcomes (k = 68; n = 78). a
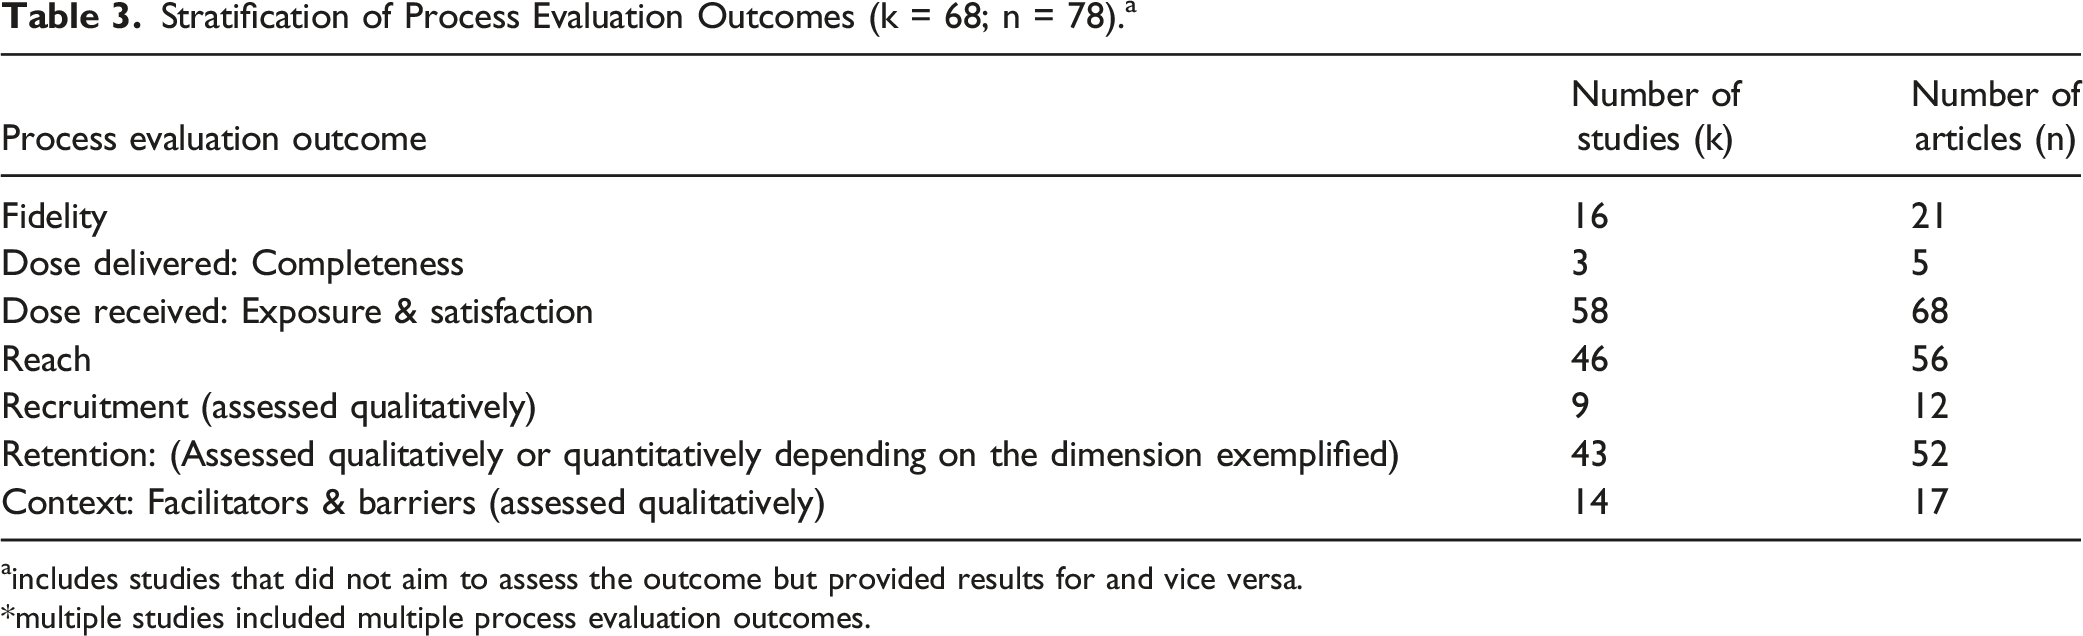
aincludes studies that did not aim to assess the outcome but provided results for and vice versa.
*multiple studies included multiple process evaluation outcomes.
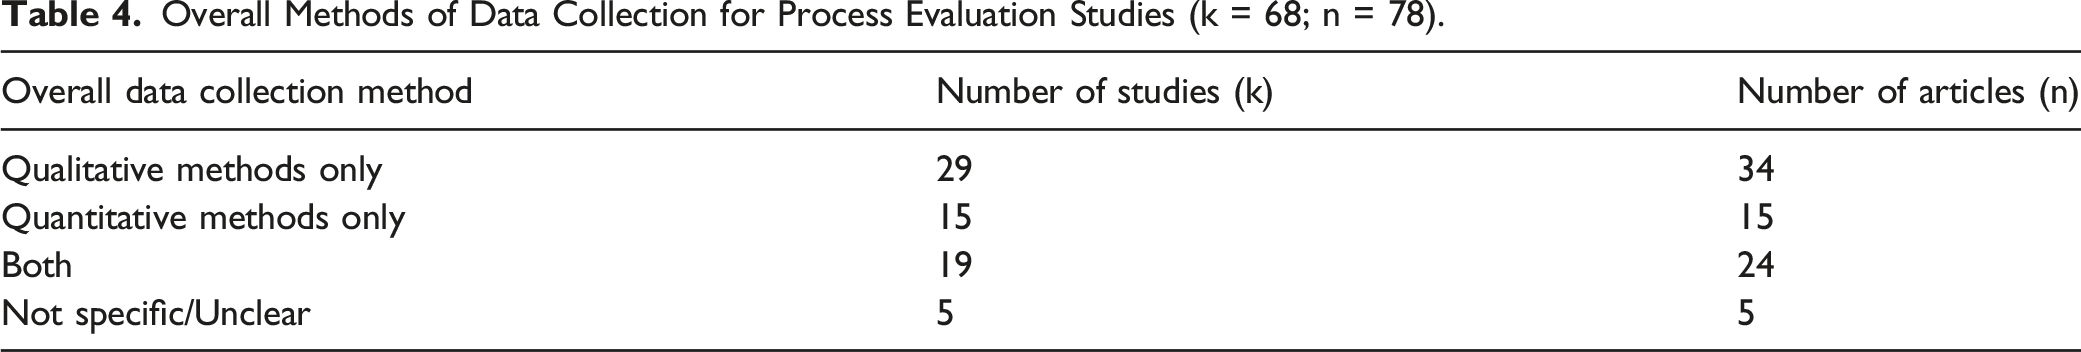
Overall Methods of Data Collection for Process Evaluation Studies (k = 68; n = 78).
Applied Theories, Frameworks or Conceptual Models Used in Process Evaluation Studies (k = 68; n = 78).
Characteristics of Included Studies (k = 68; n = 78).
Distribution of MMAT Scores for ALL Process Evaluation Studies (n = 78).
• (0 = lowest and 100 = highest quality criteria).
Results
Sixty-eight studies (k) in 78 articles (n) (k = 68; n = 78) met the inclusion criteria. Throughout the results section, the letter “k” will refer to the number of studies while “n” will refer to the number of articles. Figure 1 PRISMA 2020 flow diagram for new systematic reviews which included searches of databases and other sources only. From: Page MJ, McKenzie JE, Bossuyt PM, Boutron I, Hoffmann TC, Mulrow CD, et al. The PRISMA 2020 statement: an updated guideline for reporting systematic reviews. BMJ 2021;372:n71. doi: 10.1136/bmj.n71. For more information, visit: https://www.prisma-statement.org/
Process Evaluation Research Designs
The process evaluation research designs included the following: qualitative (k = 6; n = 6),22-27 quantitative: randomized control trials (RCT) (k = 13; n = 13),28-40 quantitative: non-randomized (k = 13; n = 13),41-53 quantitative descriptive (k = 2;n = 2),54,55 mixed method randomized control trial (k = 2; n = 2),56,57 mixed-method quantitative non-randomized, (k = 19; n = 19),58-76 and mixed-method quantitative descriptive (k = 4; n = 4). 77-80
Nine studies comprised more than 1 article (k = 9; n = 19). 81-99 2 studies included 1 RCT and 1 qualitative article (k = 2; n = 4). 81-84 One of the studies included 2 RCTs (k = 1; n = 2).85,86 One study included both a mixed-method: quantitative descriptive and qualitative article (k = 1; n = 2).87,88 One study included both a mixed method: non-randomized and quantitative non-randomized article (k = 1; n = 2).89,90 One study consisted of a randomized control trial and 2 qualitative articles (k = 1; n = 3).91-93 One study included both a mixed method: non-randomized and qualitative article (k = 1; n = 2).94,95 One study included both a mixed method: non-randomized and randomized control trial article (k = 1; n = 2).96,97 Finally, one study included both a mixed method: randomized control trial and a randomized control trial article (k = 1; n = 2).98,99
Process Evaluation Type
Eleven process evaluation studies were stand-alone (separate) (k = 11; n = 11)23-25,27,36,51,54,55,77,78,80 while forty-eight were integrated (embedded) within outcome evaluations (k = 48; n = 48).22,26,28-35,37-50,52,53,56-76,79 The remaining 9 studies consisted of more than 1 article that included both integrated and stand-alone process evaluations (k = 9; n = 19).81-99 Out of these 9 studies, 6 studies consisted of 1 integrated and 1 stand-alone process evaluation (k = 6; n = 12). 81-86,94-99 One study had 2 integrated process evaluations (k = 1; n = 2)89,90 while another had 2 stand-alone process evaluations (k = 1; n = 2).87,88 The final study consisted of 2 stand-alone process evaluations and 1 integrated (embedded) process evaluation (k = 1; n = 3).91-93
Process Evaluation Outcomes
Process evaluation studies varied in the frequency of process evaluation outcomes represented. Multiple studies included more than 1 process outcome. Sixteen studies included assessments of fidelity or whether or not the programs were implemented consistently within the underlying theory and philosophy (k = 16; n = 21). 33,35,37,46,51,56,57,59,61,77-79,83,84,91-93,96-99 Three studies included information on the dose delivered which is the amount or number of intended units of each program component delivered to the target audience (k = 3; n = 5).51,77,91-93 Fifty—eight studies included measures of dose received, which assessed the engagement with intervention activities or satisfaction with the intervention (k = 58; n = 68).22-26,28–30,32-37,40–51,53-55,57-64,66-74,77-79,81-99
On the other hand, forty-six studies (k = 46; n = 56) 26,28–30,33,35-37,40,41,43,45,47,48,50-52,54-63,67,69,70,72-75,77-94,96-99 included assessments of reach conceptualized as any of the following: 1) proportion of those enrolled in the study out of those eligible to participate which may be referred to as recruitment rate (Reach = enrolled/eligible), 37 2) Attendance per session or average attendance (data is collected during the intervention) with or without documentation of participation barriers, and 3) documentation of participation barriers only.
Nine studies included assessments of recruitment procedures used to attract participants at the individual or organizational levels (k = 9; n = 12). 27,31,50,57,80,83-88,94 Forty-three studies (k = 43;n = 52) 27,29,31,33,34,37–43,45,48–50,56–60,62,63,68–74,77–94,96–99 included measures of retention conceptualized as any of the following: 1) procedures used to maintain participation in the program, 2) barriers and facilitators to retention, and 3) proportion of those who completed the intervention out of those who enrolled.
Fourteen studies (k = 14; n = 17) included assessments of contextual factors that may impede or strengthen program implementation. 22,23,27,30,33,63-65,69,76,77,79,83,84,91-93 Initially, these factors were conceptualized as whether they included facilitators, barriers, and both. Six studies included barriers only (k = 6; n = 9),22,27,30,64,83,84,91-93 3 studies included facilitators only (k = 3; n = 3), 23,77,79 and 5 studies included both facilitators and barriers (k = 5; n = 5). 33,63,65,69,76 Furthermore, contextual factors were subdivided into any of the 8 constructs described by Watson to categorize factors that impact the external implementation of health promotion programs. 100
These factors consisted of the following: 1) professional influences, 2) political support, 3) social climate, 4) local infrastructure, 5) policy & legal climate, 6) relational climate, 7) target population, and 8) funding and economic source. 98 Multiple articles included multiple constructs in their contextual factors. Four studies included professional influences (k = 4; n = 4).22,30,33,64 Six studies included local infrastructure (k = 6; n = 8).27,63,64,69,79,91-93 One study (k = 1; n = 1) included relational climate. 33 8 studies (k = 8; n = 8) included target population,22,23,30,64,65,69,76,77 and 1 study (k = 1; n = 2) included funding and economic climate.83,84 None of the studies included constructs related to political support, social climate, policy, and legal climate.
Overall Methods of Data Collection
The overall data collection methods for included process evaluations were disparate. Twenty-nine studies (k = 29; n = 34) included qualitative methods only,22-25,27,29-31,33-35,46,48,50,59,61-66,69,72,75,76,81-84,91-95 while fifteen studies (k = 15; n = 15) included quantitative methods only.32,37-39,41-43,47,49,53-55,68,73,80 Eighteen studies (k = 18; n = 23) included both qualitative and quantitative methods of data collection, 26,44,56-58,60,67,70,71,74,77-79,85-90,96-99 and 5 did not include, nor specify or were unclear about their data collection methods (k = 5; n = 5).28,36,45,51,52
Multiple studies utilized multiple data collection methods due to multiple process-related outcomes. Forty-seven studies included qualitative methods (k = 47; n = 57).22–27,29-31,33-35,40,44,46,48,50,56,58-67,69-72,74,75,77-99 Twenty-three studies included individual interviews (k = 23; n = 28). 23,27,29,34,35,40,56,60,63-66,69,71,73,75,79-84,87,88,91-94 Twenty-one studies included focus groups (or group interviews) (k = 21; n = 28). 22,24,26,33,35,56,58,60,62,64,72,74,77-79,81-84,89-93,96-99 Eleven studies included observations, observation tools, and field notes (k = 11; n = 14).27,30,35,46,58,61,63,70,77,91-93,98,99 Seven studies included open-ended surveys, questionnaires, and forms (k = 7; n = 9) 44,50,60,61,67,85,86,96,97 while 4 studies included audiotapes and transcripts (k = 4; n = 7). 58,69,91-93,98,99 One study included log diaries and contact records (k = 1; n = 2).83,84
Thirty-one studies included quantitative methods (k = 31; n = 36).26,32,37,40-44,47,49,53-56,58,60,67,68,70,71,73,74,77,79,80,84-89,95-99 Twenty-one studies included closed-ended surveys, questionnaires, and forms (k = 21; n = 22). 32,41,42,44,47,49,54,55,60,67,68,70,71,73,78,85,86,89,90,96,97 Sixteen studies included attendance records or logbooks (k = 16; n = 17), 26,37-39,54,55,57,73,74,78-80,87,88,96,97 and 4 studies (k = 4; n = 4)57,77-79 included checklists or observation forms.
Summary of Key Process Evaluation Terminology
Multiple studies used multiple terms to describe their process evaluations. Two studies did not specify key process evaluation terms utilized, while all other studies did (k = 2; n = 3).66,81,82 When categorized, it was found that feasibility (k = 35; n = 39) 22,24,26,30-32,34,35,37,40-46,49,51,55,56,58,59,61-63,68,69,72,73,77,79,83,84,94-99 was the most widely used term followed by acceptability (k = 33; n = 36),25,26,28,29,31,33,35,40,42,44-46,49-51,55-57,59,61,62,67-70,72-74,77,79,94-99 and satisfaction (k = 19; n = 20).22,32,34,40-42,44-47,50,51,54,60,68,71,78,79,89,90 The least widely used terms were implementation evaluation (k = 4; n = 4),51,54,78,79 feedback (k = 2; n = 2),24,51 engagement with an intervention (k = 2; n = 2),36,63 sustainability (k = 1; n = 2),96,97 contextual factor (k = 4; n = 4),23,27,76,79 adherence (k = 3; n = 3),41,53,56 adoption (k = 1; n = 2),96,97 and appropriateness (k = 1; n = 2).96,97
Theories, Frameworks, Research Approaches, and Conceptual Models Used to Assess Process Evaluations
Theories, frameworks, research approaches, and conceptual models have been used to assess the core themes of process evaluations. 58 Additionally, research approaches such as community-based participatory research can also guide data collection, analysis, and interpretation of implementation processes.48,69 None of the included studies utilized theories and conceptual models, 3 of the studies utilized research approaches (k = 3; n = 4),48,69,96,97 and 7 of the studies utilized evaluation frameworks (k = 7; n = 9).27,33,35,36,51,83,84,94,95 The research approaches employed were community-based participatory research (k = 3; n = 4).48,69,96,97
Conversely, the evaluation frameworks employed were the UK MRC Framework (k = 2; n = 2),33,35 NIH Behavioral Change Consortium Treatment Fidelity Framework (k = 1; n = 2),83,84 and RE-AIM (k = 1; n = 1). 36 Then, 3 studies included more than 1 evaluation framework: 3 study included both the RE-AIM & PIPE Framework (k = 1; n = 1), 51 the other study included both the RE-AIM & MRC Framework (k = 1; n = 2).94,95 and the final study included both REAIM & FRAME. 27 Fifty-eight studies did not identify a theoretical nor research approach to guide their process evaluations (k = 58; n = 65).22-26,28-32,34,37-47,49,50,52-68,70-82,85-93,98,99
Timing of Process Evaluation Data Collection
The majority of process evaluation studies collected data during and after the intervention’s implementation (k = 30; n = 33).26-30,34,37-42,46,47,49,54-57,59,60,62,68,70,71,74,79,87-90,96,97 The remaining studies collected data pre, during, and post-intervention (k = 17; n = 24),33,35,50,51,61,63,69,73,77,78,80-86,91-95,98,99 post-intervention only (k = 11; n = 11),22,23,25,32,44,53,64-66,75,76 pre & post intervention (k = 6; n = 6),31,43,45,58,67,72 and during the intervention only (k = 4; n = 4).24,36,48,52
Critical Appraisal Scoring
Many of the articles had met at least 60% or more of the quality criteria in MMAT (n = 57).22-29,31,33-48,50-56,64-67,70,72,73,77,78,81-93,95,98,99 Twenty-one articles had 60% of their quality criteria met (n = 21). 34,35,41,43,45,64-67,70,72,77,78,82,85,86,89,92,95,98,99 Seventeen articles had 80% of their quality criteria met (n = 17).28,31,33,36,39,40,42,44,46-48,52,54-56,83,90 Nineteen articles had 100% of their quality criteria met (n = 19).22-27,29,37,38,50,51,53,81,84,87,88,91,93,94 On the other hand, there were a few articles that met at least 40% or less of their quality criteria (n = 21).30,32,49,57-63,68,69,71,73-76,79,80,96,97 Three article had 0% of their quality criteria met (n = 3)59,74,75 while 7 had 20% of their quality criteria met (n = 7).57,58,73,76,79,80,97 Eleven articles had 40% of their quality criteria met (n = 11).30,32,49,60-63,68,69,71,96
For the quantitative studies, there were issues with blinding assessors, having complete outcome data, and confounders being accounted in the design and analysis. On the other hand, for mixed method studies, when it came to the appraisal of the qualitative portion, there were issues with qualitative findings not being adequately derived from the data, interpretation of results not being substantiated by the data, and not having coherence between qualitative data sources, collection, analysis, and interpretation. Furthermore, when it came to the overall assessment of mixed method studies, most issues were with providing an adequate rationale for using a mixed method design to address research questions.
The distribution of MMAT scores for included articles varied. The lowest scoring study design was mixed-method (n = 30)56-80,87,89,95,96,99 with 37% of mixed-method articles having 40% and below of their quality criteria met (n = 11) while 63% (n = 19) of the mixed-method articles met 60% or more of their quality criteria. On the other hand, qualitative articles were the highest-scoring study design (n = 12), with all qualitative articles having 100% of their quality criteria met.22-27,81,84,88,91,93,94
Discussion
This systematic review identified several insights into the extent, range, and nature of evidence related to process evaluations of traditional, group-based DSM programs. First, the majority of included studies were integrated (i.e., embedded) process evaluations rather than stand-alone process evaluations. The United Kingdom’s (UK) Medical Research Council’s (MRC) Process Evaluation Guidance provides pros and cons for separating or integrating process and outcome evaluations. For example, the framework states that separation may reduce potential biases in the analysis of outcome data arising from feedback on how the intervention functions. 101 However, finding from this systematic review highlight that most studies integrate their process and outcome evaluations. This may be due to cost decisions associated with a stand-alone process evaluation, the need to avoid duplication of efforts, and reduce measurement burden for participants if process measures are being collected as part of the outcome evaluation. 101
Second, findings illustrate that studies tend to measure dose received, reach, and retention rather than context, fidelity (quality), recruitment, and dose delivered. The UK MRC states that there is no unified definition of the term “process evaluation.” 101 Process evaluations can range from simple satisfaction questionnaires to complex mixed-method studies. 101 Nevertheless, Saunders and colleagues recommend that process evaluations should include, to a minimum, the following outcomes to assess the implementation of programs: completeness (dose delivered), fidelity, reach, and sometimes, dose received. These process outcomes are crucial in helping us understand why a program was or was not effective.14,15 Thus, process evaluations should include these assessments of complete and acceptable delivery of a program, policy, or practice in addition to understanding the enablers and/or barriers to why interventions were successfully implemented (i.e., context).14,15
Third, there was a lack of clear distinction between the process outcomes of reach and retention among studies, so researchers of this systematic review conceptualized these outcomes in various dimensions. For instance, according to Saunders and colleagues, reach is evaluated as the number of individuals exposed to and/or receiving the program, policy, or practice compared to the total population intended or the possible population.14,15 It can be reflected by attendance at specific sessions or events or exposure to elements of the program as well.14,15 Yet, included studies fail to express true population reach because the studies use proxies for the total possible population, such as those who received recruitment material or those who were deemed “eligible” to participate. Ezeugwu defines reach as those who enrolled in the intervention divided by those who were eligible to participate. 102
Conversely, in relation to retention, Saunders only defines retention in the context of recruitment: it is the “maintenance of participant involvement in intervention and measurement components of a study.” Consequently, this definition illustrates that retention is assessed qualitatively, which Saunders confirms. However, Ezeugwu provides a stand-alone definition for retention by defining it as the number of enrollees (enrolled) divided by the number of completers, thereby providing a more quantitative definition.14,15,102 Ezeugwu’s definition of retention fails to be explicitly stated in the included studies of this review. Thus, to better evaluate the process outcomes of reach and retention, process evaluation studies should provide: 1) a more standardized method of determining the total possible population of a program, policy, or practice to calculate reach and 2) a standardized quantitative definition of retention.
Fourth, most studies included qualitative data collection methods, with focus groups being the most prominent. In contrast, only a few studies employed quantitative data collection methods, with most employing closed-ended surveys, questionnaires, and forms. In the case of process evaluations, it is best for quantitative and qualitative studies to be conducted together and not separately. The UK MRC states that when designing and conducting process evaluations, mixed-method forms of data collection should be used. 101 Quantitative methods should be used to measure process variables such as fidelity, dose, and reach, while qualitative methods should be used to capture emerging changes in implementation and intervention experiences. 101 Furthermore, qualitative data can identify strengths and weaknesses in the structures in place to implement the intervention, while quantitative data may confirm what was effectively implemented. 101 Process evaluations should not be limited to 1 form of data collection, and a combination of qualitative and quantitative methods should be employed to balance data from all process outcomes.
Fifth, our findings draw attention to the myriad of terms used to describe process-related outcomes, resulting in a lack of consensus on how to describe process outcomes. As mentioned previously, feasibility was the most widely used term followed by acceptability, satisfaction, and retention to describe the focus of process evaluations. Standardizing terms used to describe process evaluations and their outcomes is critical to allow comparisons across studies. Additionally, mindful attention is needed to comprehensively include terms that describe fidelity and dose delivered, as these are outcomes that are not only the least widely used terms but are not commonly assessed in process evaluations.
Sixth, the lack of theoretical and research approaches guiding process evaluations of these programs is prominent in this systematic review. Forty-Eight (k = 58; n = 65) studies did not utilize a theoretical or research approach to guide their process evaluations. Theoretical and research approaches (i.e., process models, evaluation frameworks, determinant frameworks, class theories, and implementation theories) can be used to assess the core themes of process evaluations.14,15,101 Process evaluations grounded in theory provide a means of understanding the evidence surrounding how and why interventions work, allowing interventions to be translated to diverse populations. 58 This can better inform and improve the quality of health care, public health practice, policy, and broaden the field of implementation science.14,15,101
Seventh, the timing of process evaluation data collection occurred most frequently during and after the intervention’s implementation. Timing is a key concern when designing process evaluations since the intervention, participants, and contexts are not static in nature. Thus, careful consideration must be given when process evaluation data is collected.14,15,101 Considerations include 1) the intervention staff’s perceptions of the intervention and how their practices change over time when they receive feedback from the audience, 2) how the organization changes gradually over time to allow full integration of the intervention, and 3) the resources available to collect data at multiple time points to capture changes over time.14,15,101 Thus, the timing of data collection should occur throughout the entirety of the process evaluation: before, during, and after and not specific to only 1 time point.
Finally, another essential finding of this review is that qualitative studies possessed the strongest methodological quality, with all articles meeting 100% of their quality criteria. Also, most studies met 60% or more of their quality criteria, showing that these programs had sound methodological quality. On the other hand, mixed-method articles had the highest frequency of low MMAT scores with 37%; (n=11/30) of mixed-method articles meeting 40% or below their quality criteria. It suggests that mixed-method articles tend to possess a lower quality than other study designs. This can be due to a lack of standardized reporting guidelines or the challenging nature of the mixed-method studies. 12 These findings about mixed-method articles are consistent with another systematic review. 12
A couple of limitations of this systematic review can be noted. First, the researchers included published studies in English only. Thus, publications in other languages with significance to this study’s aim could be missed. However, based on evidence, excluding publications from non-English journals has little impact on post-synthesis conclusions. 103 Secondly, the data collection methodology of included process evaluations did not extend beyond the data reported in studies, so there is a possibility that process elements were collected and analyzed but did not get included in published papers due to journal limitations in the word count.
Conclusion
Diabetes self-management programs (DSMPs) empower people with diabetes to utilize the knowledge and skills to implement and sustain health behaviors required to manage their condition on an ongoing basis. This systematic review showed that there is a lack of stand-alone, theoretically grounded process evaluations of DSMPs that fail to incorporate outcomes such as fidelity and dose-delivered with most having a mixed method study design of low quality. Because of this, process evaluations of DSMPs should be improved to include these outcomes and increase their methodological quality to determine why and how these programs work. DSMPs are an essential health promotion component in helping individuals with diabetes to acquire the knowledge and skills necessary for implementing and sustaining self-care behaviors on an ongoing basis. Findings have strongly supported the idea that successful implementation of DSMPs is associated with better outcomes, such as decreases in A1C and improved self-efficacy. While DSMPs are increasingly prominent, minimal research has been done to assess the implementation of such programs, more particularly traditional (face-to-face), group-based programs. Evaluations lacking such documentation are considered incomplete and lessen careful interpretation of the effectiveness of such programs. This review provides guidance on elements that should be considered in conducting process evaluation research and choosing a DSMP. This systematic review provides evidence on the quality of existing literature related to stand-alone or embedded process evaluations of any traditional, group based DSMPs, and the methods utilized to conduct such evaluations. A better approach is needed to conduct process evaluations so that we can better understand why programs are or are not working. If process evaluations are not capturing important information and are of low quality, then, we can’t truly evaluate how well the program worked or predicted how it will work in different contexts.So What? (Implications for Health Promotion Practitioners and Researchers)
What is Already Known on This Topic?
What does this article add?
What are the Implications for Health Promotion Practice or Research?
Supplemental Material
Supplemental Material - Process Evaluations of Diabetes Self-Management Programs: A Systematic Review of the Literature
Supplemental Material for Process Evaluations of Diabetes Self-Management Programs: A Systematic Review of the Literature by Chinelo Nsobundu, Yeka W. Nmadu, Nikita Sandeep Wagle, Margaret J. Foster, E. Lisako J. McKyer, Ledric Sherman, Marcia G. Ory, James (Jim) N. Burdine in American Journal of Health Promotion
Footnotes
Acknowledgements
The authors would like to thank the Texas A&M University Writing Center for providing the necessary guidance and resources for drafting a scientific manuscript for publication.
Declaration of Conflicting Interests
The author(s) declared no potential conflicts of interest with respect to the research, authorship, and/or publication of this article.
Funding
The author(s) received no financial support for the research, authorship, and/or publication of this article.
Supplemental Material
Supplemental material for this article is available online.
References
Supplementary Material
Please find the following supplemental material available below.
For Open Access articles published under a Creative Commons License, all supplemental material carries the same license as the article it is associated with.
For non-Open Access articles published, all supplemental material carries a non-exclusive license, and permission requests for re-use of supplemental material or any part of supplemental material shall be sent directly to the copyright owner as specified in the copyright notice associated with the article.