
Abstract
In this study, we evaluated the feasibility of using the virtual fit pressure map in a clothing-specific CAD program to predict pressures applied by sports compression garments by analyzing pressure prediction accuracy and process practicability. In wearer trials with whole-body compression sportswear, we measured in vivo pressures and compared them to virtual pressures recorded from the virtual fit pressure maps of the garments fitted to 13 participants’ body scan avatars. No clear correlations between virtual and in vivo pressures were identified and problems in the virtual fit process became apparent. The CAD software currently lacks a link to physical fabric, seam and component properties, which inhibits its use for predictions in new product development. By considering all simulation settings and assessing the numerical pressure prediction capability of a clothing-specific CAD program, this research provides a step forward in assessing the limitations of virtual fit for technical product development.
Keywords
Sports compression garments (SCGs) are skin-tight, elastic garments that, unlike conventional clothing, are designed to be smaller than the wearer’s body to apply pressure (Liu & Little, 2009). SCG brands typically claim that this enhances blood flow and stabilizes body tissue, which improves sports performance, shortens recovery time, and prevents injuries (MacRae et al., 2011; Textiles Intelligence Limited, 2019). The compression pressure applied by SCGs is a force delivered by the fabric strain to an area of body surface, the interface pressure (Partsch, 2005; Tyler, 2015), hereafter referred to as pressure. In the medical field, where SCGs originated, Laplace’s Law is frequently used to calculate applied pressure levels (Macintyre, 2007). Laplace’s Law defines interface pressure as the ratio of fabric tension and the radius of the cylinder it is applied to (Macintyre, 2007).
The increasing use of SCGs as an ergogenic aid by professional and recreational athletes (Textiles Intelligence Limited, 2019) has led to a growth of research into SCGs, especially in the physiology and biomechanics fields (Fu et al., 2013). Most researchers investigated the effects of SCGs on sports performance and recovery through experimental exercise trials, as summarized in various review studies (e.g., Born et al., 2013; Brown et al., 2017; MacRae et al., 2011). However, there is a need to focus on garment characteristics and pressure application in the SCG research field (MacRae et al., 2011, 2016). Garment characteristics, such as fabric properties and garment construction methods, influence pressure delivery by affecting fabric strain (MacRae et al., 2016; Troynikov et al., 2013). The curvature and tissue composition of the affected body area (MacRae et al., 2016) and the relationship of the body and garment size (i.e., fit) also influence pressure application, due to fabric strain variations. Nevertheless, in many experimental studies pressure is not reported and/or measured (e.g., Duffield et al., 2008; Hooper et al., 2015) and no researchers have considered SCG fit.
Researchers (Brophy-Williams et al., 2015; Hill et al., 2015) have found that pressure levels applied by existing commercial SCGs vary across individuals. Even though there are presently no optimal pressure levels for SCGs, the applied pressure is the dosage of the compression treatment, which needs to be clearly defined and controlled when designing (or developing) SCGs. This is critical, as different claimed benefits of SCGs are likely based on diverse compression effects (e.g., hemodynamic, reduction of vibration) that may require different pressure levels and profiles for optimal results (MacRae et al., 2011). Users should be able to make informed decisions when purchasing SCGs for specific applications.
To understand the pressure behavior of a SCG before producing a sample, pressure levels need to be predicted accurately. Yet, there is limited research on SCG design and pressure prediction. Researchers have provided modified versions of Laplace’s law for application with medical compression bandages (Thomas, 2003) and tubular medical compression garments (Barhoumi et al., 2020; Macintyre, 2007). However, Laplace’s law is not applicable to non-cylindrical body parts and the calculation of Laplace’s law is complex and not practicable for designers in the development of intricate cut-and-sew SCGs.
Over the past decade, developments in three-dimensional (3D) simulation technologies have enabled the virtual fitting of two-dimensional (2D) garment patterns on simulations of the human body in clothing-specific computer-aided design (CAD) programs (Porterfield & Lamar, 2017). Most clothing-specific CAD programs feature built-in heat maps denoting pressure levels at the simulated garment–body interface. Pressure levels across the body simulation are presented in different color nuances enabling subjective fit evaluation, and numerical values displayed on a scale bar permit objective fit evaluation. So far, no researchers have assessed the accuracy of the numerical pressure values. However, if the virtual fit heat maps represented realistic fit and pressure simulations, they could facilitate the design of cut-and-sew SCGs by enabling designers to assess the pressure application of newly developed SCGs prior to making physical samples. This would offer an effective and practical solution for the design of SCGs with controlled pressure delivery. Therefore, the purpose of this study was to evaluate the feasibility of using the built-in virtual fit pressure map in a clothing-specific CAD program to predict the pressures applied by SCGs to bodies of known size. To assess the feasibility, we focused on two aspects: the accuracy of the virtual pressure values compared to in vivo measurements and the practicability of using the virtual fit technology in an apparel design and development environment, as expressed in the following two objectives: Analyze the accuracy of the numerical pressure simulation of SCGs virtually fitted to body scan avatars. Evaluate the practicability of using virtual fit technology for pressure prediction in a practical design environment.
Review of Literature
Virtual Fit Technology
The technological challenge of virtual fit lies in simulating fabrics in combination with representations of the human body including their geometric contacts (Volino & Magnenat-Thalmann, 2005). Fabric simulation is far less developed than the simulation of solid objects due to the anisotropic character of fabrics (Goldstein, 2009). The accuracy of virtual fit depends largely on the computer-based fabric models used to simulate garments (Jevsnik et al., 2017; Volino et al., 2005). For CAD programs to be efficient and virtually fit a garment onto an avatar in a few seconds, cloth simulation models are generally based on geometric approximations (particle grid systems) resulting in loss of accuracy (Power, 2013). Most clothing-specific CAD programs feature fabric libraries with pre-set properties for certain fabric types (e.g., 100% polyester interlock knit; 89% polyester, 11% lycra knit). However, fabric properties can vary substantially even among the same fabric type. Hence, the input of objective fabric test results would be preferable but is not supported by most CAD programs due to proprietary, non-standardized commercial test kits (Power, 2013).
Parametric models are avatars of varying age and gender that are built into clothing-specific CAD programs. They can be morphed to various sizes, however, many body measurements are limited or interlinked, and the distribution of mass within a circumference (e.g., more mass in front or back of the body) can generally not be adjusted, prohibiting the exact recreation of body shapes (Mahnic Naglic et al., 2016). The import of 3D body scan avatars into CAD programs has been found to result in improved garment design, as scan avatars are more accurate representations of human bodies (Mahnic Naglic et al., 2016; Stjepanovic et al., 2011). However, depending on the quality of the 3D body scan output, it may require substantial cleaning and retopologizing of areas with data occlusion. Both parametric models and body scan avatars are treated as solid objects in clothing-specific CAD programs (Kuzmichev & Cheng, 2019). Thus, virtual fit represents the fit on a solid body form, which may affect the accuracy of garment pressure simulation, as in vivo pressure measurements (PMs) can be influenced by underlying body tissue (MacRae et al., 2016), however, this has not been addressed by existing research.
Accuracy of Virtual Fit
Several researchers (Apeagyei & Otieno, 2007; Kim & LaBat, 2013; Lee & Park, 2016; Song & Ashdown, 2015; Wu et al., 2011) have assessed the accuracy of virtual fit simulations using commercial clothing-specific CAD programs. Some researchers assessed cross-sections of virtual models (Apeagyei & Otieno, 2007), others compared virtual to real garment fit on a mannequin (Wu et al., 2011) or human bodies (Kim & LaBat, 2013; Lee & Park, 2016; Song & Ashdown, 2015). The researchers reported adequate accuracy of overall fit simulations but highlighted problems with the accurate simulation of detailed fit indicators, such as smaller fabric wrinkles and draglines (Kim & LaBat, 2013; Lee & Park, 2016). This could result in the detection of fewer fit issues in virtual garments compared to real garments and is likely caused by a lack of technical construction details, such as stitch tension and thread type, informing the simulation (Lee & Park, 2016). Some researchers identified higher inaccuracies in fit simulations at certain body parts (Lee & Park, 2016; Song & Ashdown, 2015; Wu et al., 2011). Song and Ashdown (2015) also reported lower simulation accuracy for poorly fitting garments. All researchers used woven garments with positive ease, which inhibits drawing conclusions for the virtual fit of SCGs, as SCGs are generally made from knitted fabrics with high elastane content (Troynikov et al., 2013).
Recent Research Using CAD Heat Maps
Several researchers (e.g., Lee et al., 2019; Lim & Istook, 2011; Yan & Kuzmichev, 2020) have utilized heat maps to evaluate virtual garment fit in CAD programs, but none directly compared heat maps to real garment fit. Fit assessments based solely on the visual assessment of the color-coding of heat maps can be subjective, as differences in color nuances can be small and, as per the default setting, heat maps present the maximum value in red and the minimum value in blue for each garment independent of absolute values (Power, 2013; Sayem, 2017a). Nevertheless, only a few researchers (Allsop, 2012; Sayem, 2017b; Sayem & Bednall, 2017) included the numerical values provided by heat maps in their analyses.
Sayem and Bednall (2017) found significant correlations between changes in ease and tension as well as stretch levels of sleeveless shirts using Optitex PDS 10, an old version that supported FAST (Fabric Assurance by Simple Testing) data input. They concluded that drape can be objectively predicted using heat maps. Allsop (2012) highlighted difficulties with simulating complex men’s compression tops and reported mixed results in the accurate simulation of pressure distribution across the torso using a parametric model in Vstitcher (Browzwear, Singapore). A shortcoming of the study is a disregard of simulation settings. Stitch parameter settings were neglected in both studies. There are no published comparisons of absolute in vivo pressure values applied by garments and virtual pressures recorded from heat maps of commercial clothing-specific CAD programs. Thus, this study addresses a research gap as we evaluate the feasibility to predict pressure values with a virtual fit heat map by analyzing the accuracy of the simulated pressure and the practicability of the process.
Method
The study applied an experimental research design consisting of four stages: (a) wear trials to take in vivo PMs and 3D body scans, (b) virtual fit data preparation, import, and creation, (c) virtual PMs, and (d) analysis of the in vivo and virtual PMs (see Figure 1).
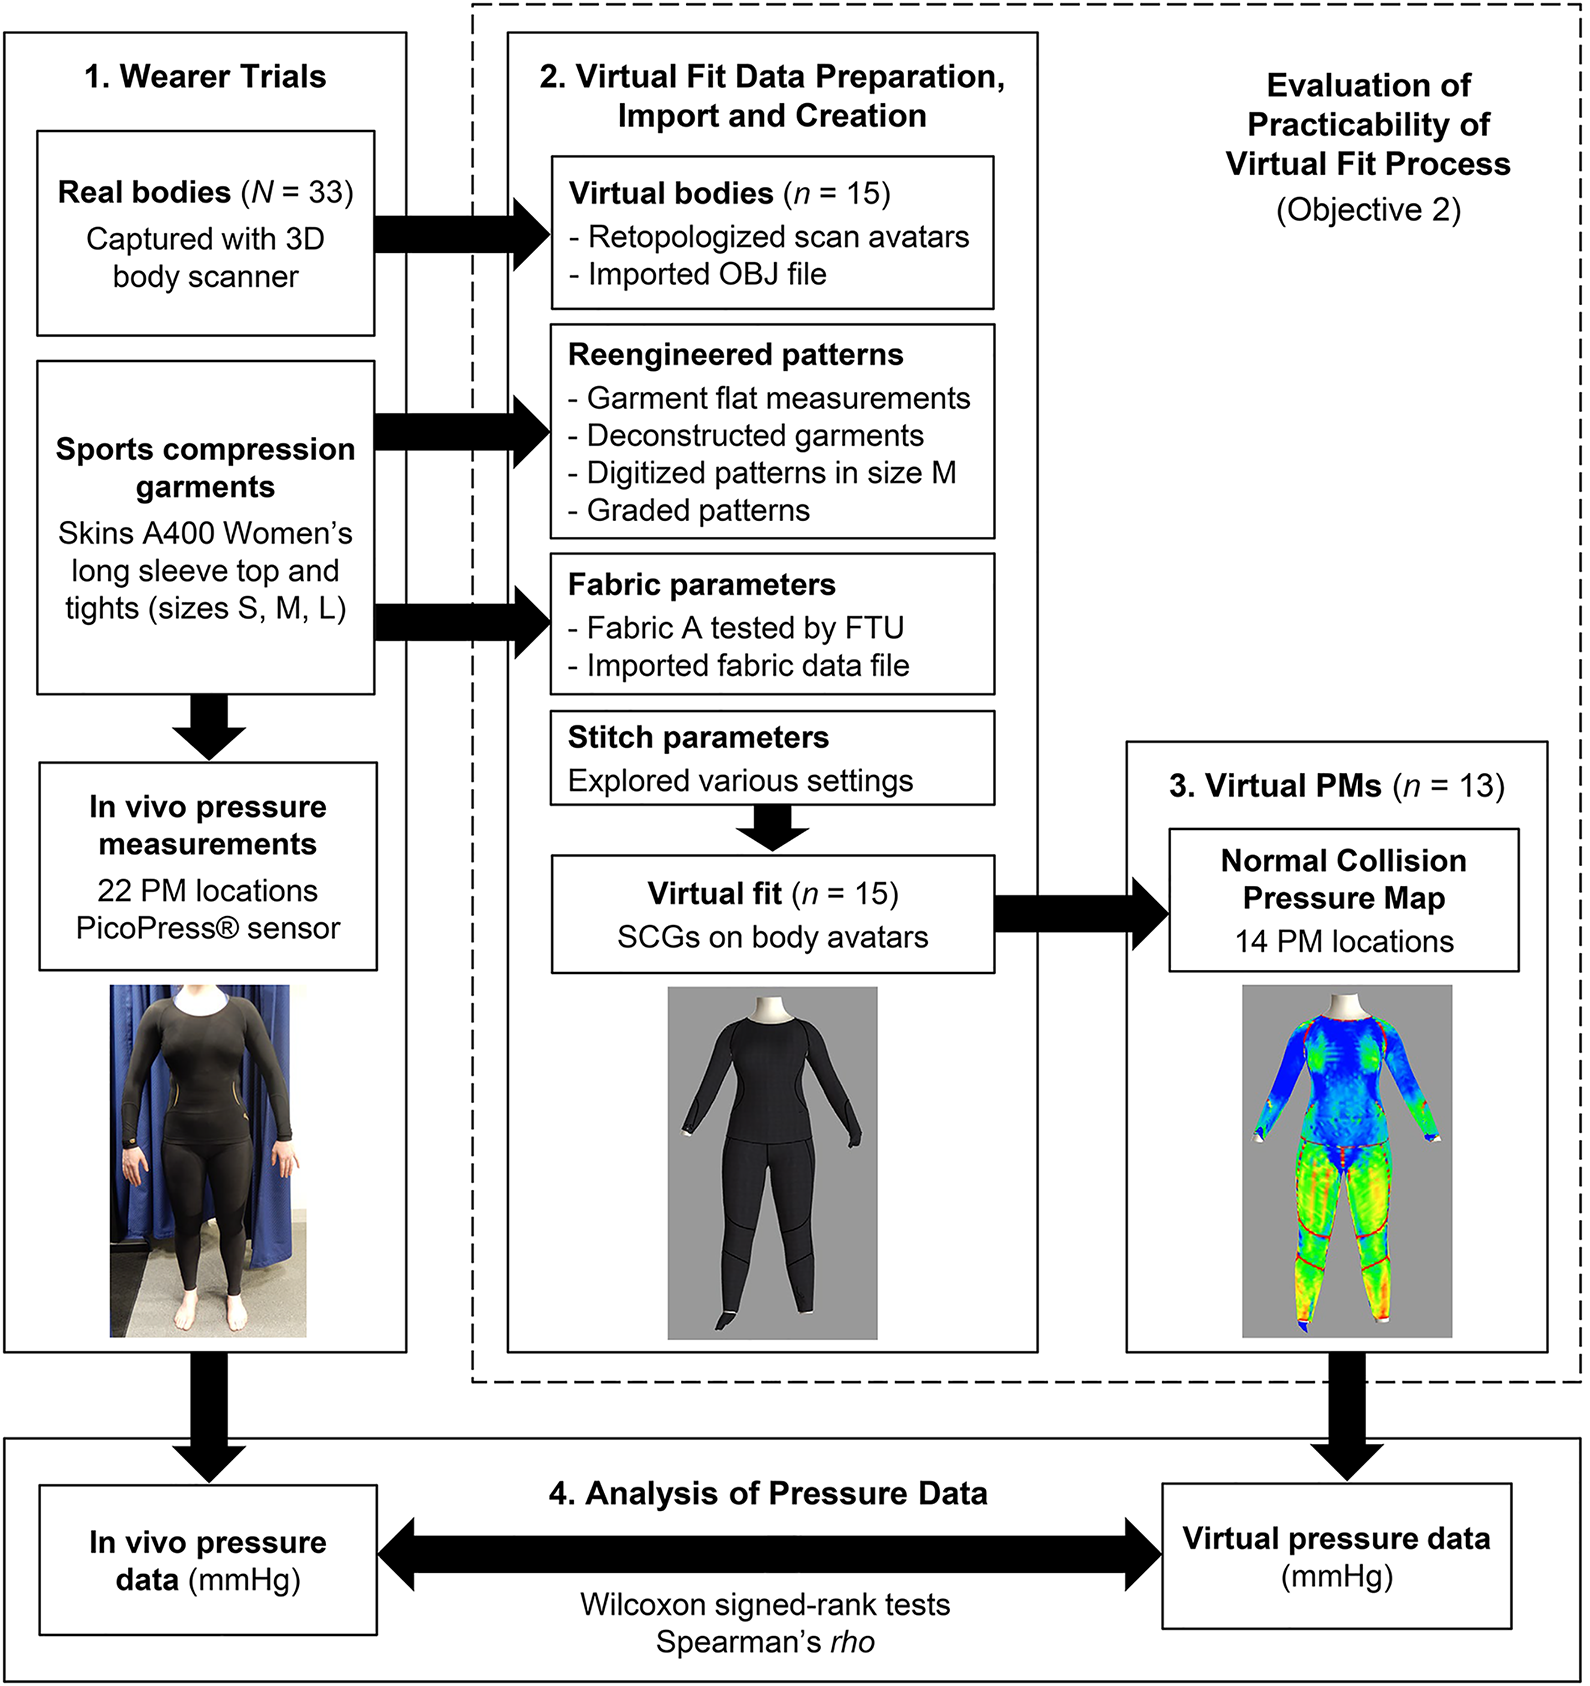
Overview of Research Strategy.
Wear Trials
We conducted wear trials with commercial whole-body SCGs to obtain in vivo PMs and to capture 3D body scans of participants for use in the virtual fit process. We chose SKINS SCGs because SKINS was the most popular brand among SCG users responding to an online survey (Brubacher, 2018) and the brand heavily invests in research and development (Textiles Intelligence Limited, 2014). The SKINS A400 range was developed in collaboration with scientific research organizations (Skins, n.d.), hence we selected SKINS A400 Women’s Active Long Tights (B33001001) and Long Sleeve Tops (B33001005) in sizes S, M, and L for this study.
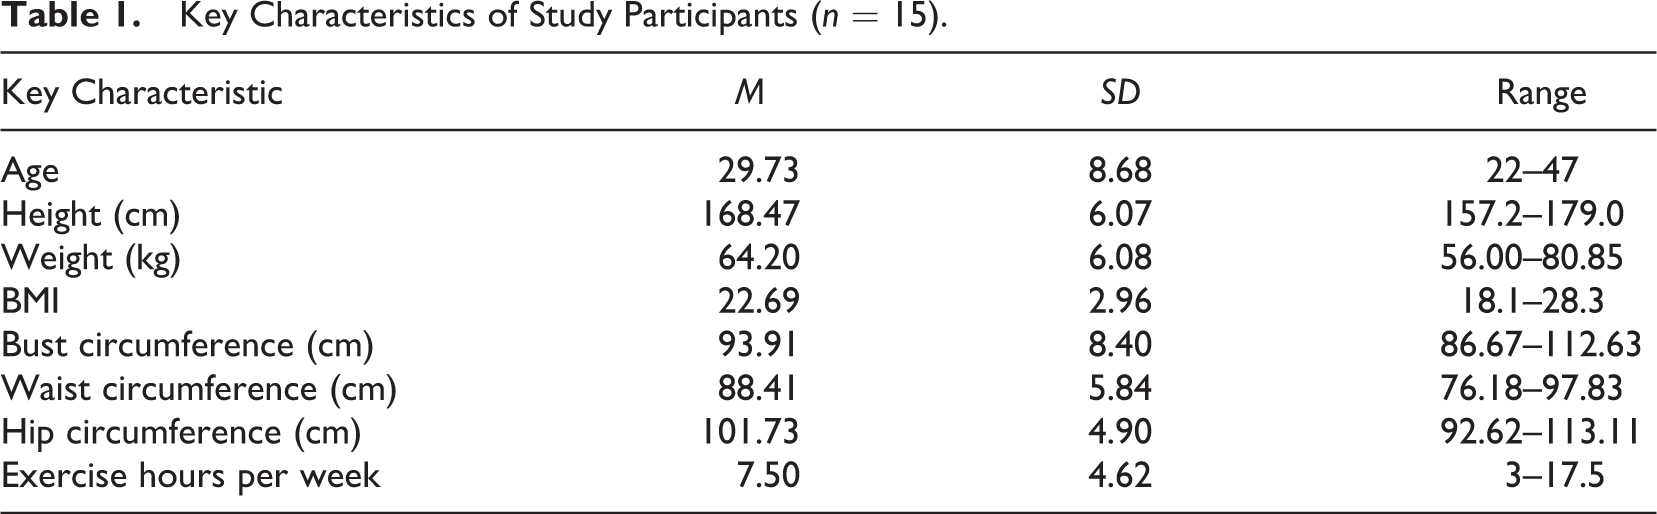
Ethical approval was obtained from the university’s research ethics committee. Participation in the study was voluntary and not incentivized. All participants gave written informed consent. We recruited participants through posters and flyers distributed across the university campus, in local fitness centers, and selected online forums. The consecutive, volunteer sampling technique applied meant that every volunteer who was female, 20–55 years old, and exercised at least 3 hours a week was included in the study. We focused on active women of this age group to allow comparability of fit. 3 hours of exercise a week exceeds the minimum physical activity guidance of 2.5 hours per week (National Health Service, 2019). 33 females participated in the wear trials, 15 of which were randomly selected for the study described in this paper (see Table 1). For the data analysis, two participants were excluded for each the top and tights as one of their key body measurements fell outside the parameters of the size charts for sizes S, M, and L. A sample size of 13 for the pressure analysis was appropriate, as wear trials are small-scale studies that can yield useful data from 10–12 participants (British Standards Institution, 1994).
Key Characteristics of Study Participants (n = 15).
A non-contact 3D body scanner (SS14, Size Stream, Cary, NC, USA) with 14 infrared depth sensors was used to remodel the body surface in a point cloud. The scanner’s accuracy in circumferential measurements is reported as <±5 mm (Size Stream, 2016). Participants were scanned in their underwear (wearing their own sports bra). The scan outputs were a raw scan data file (binary file) and a refined body mesh (OBJ file) based on the raw scan data.
Each participant wore the compression tights and top in size S, M, or L. We allocated sizes following the brand’s size charts, which were based on the ratio of height and weight for the tights and the bust circumference for the top. The size distribution varied across the top (1× S, 8× M, 4× L) and tights (8× S, 5× M) due to the different sizing approaches. Most participants wore a smaller size in the tights.
We chose 22 PM locations based on a detailed review of literature on PM locations for medical compression stockings (British Standards Institution, 2001; Partsch & Mosti, 2010; Wildin et al., 1998) and SCGs (Brophy-Williams et al., 2015; MacRae et al., 2012; Sear et al., 2010) (see Figure 2). The locations were based on body landmarks (e.g., T11 inner biceps at maximum girth) and garment landmarks (e.g., B9 waistband at center front). To facilitate the PM process, we marked the PM locations on the outside of the donned garments with tape. We used a pneumatic PM device (PicoPress®, Microlab, Italy) to measure the applied pressure at the 22 locations. Despite potential modifications of the local limb curvature by air-filled sensors (Chassagne et al., 2018; Thomas, 2014), the PicoPress® PM device offers adequate accuracy for in vivo use (2.79% mean variation coefficient; Partsch & Mosti, 2010) and is superior to other PM devices for the use with SCGs (McManus et al., 2020).
Participants stood in the anatomical zero position with their weight evenly distributed across both feet. The PicoPress® sensor (dia. 50 mm) was placed flat between the skin and the SCG centrally under the tape mark; with the fabric flat over the sensor. PMs were taken following the manufacturer’s instruction and recorded (in mmHg) once the output value had settled (after 3–5 s). To increase reliability and validity, one operator took all PMs and measured twice at each location with the mean used for data analysis. A pilot study had shown minimal variation (max. 1 mmHg) between three PMs taken at each location; hence, two PMs were sufficient and improved measurement efficiency.
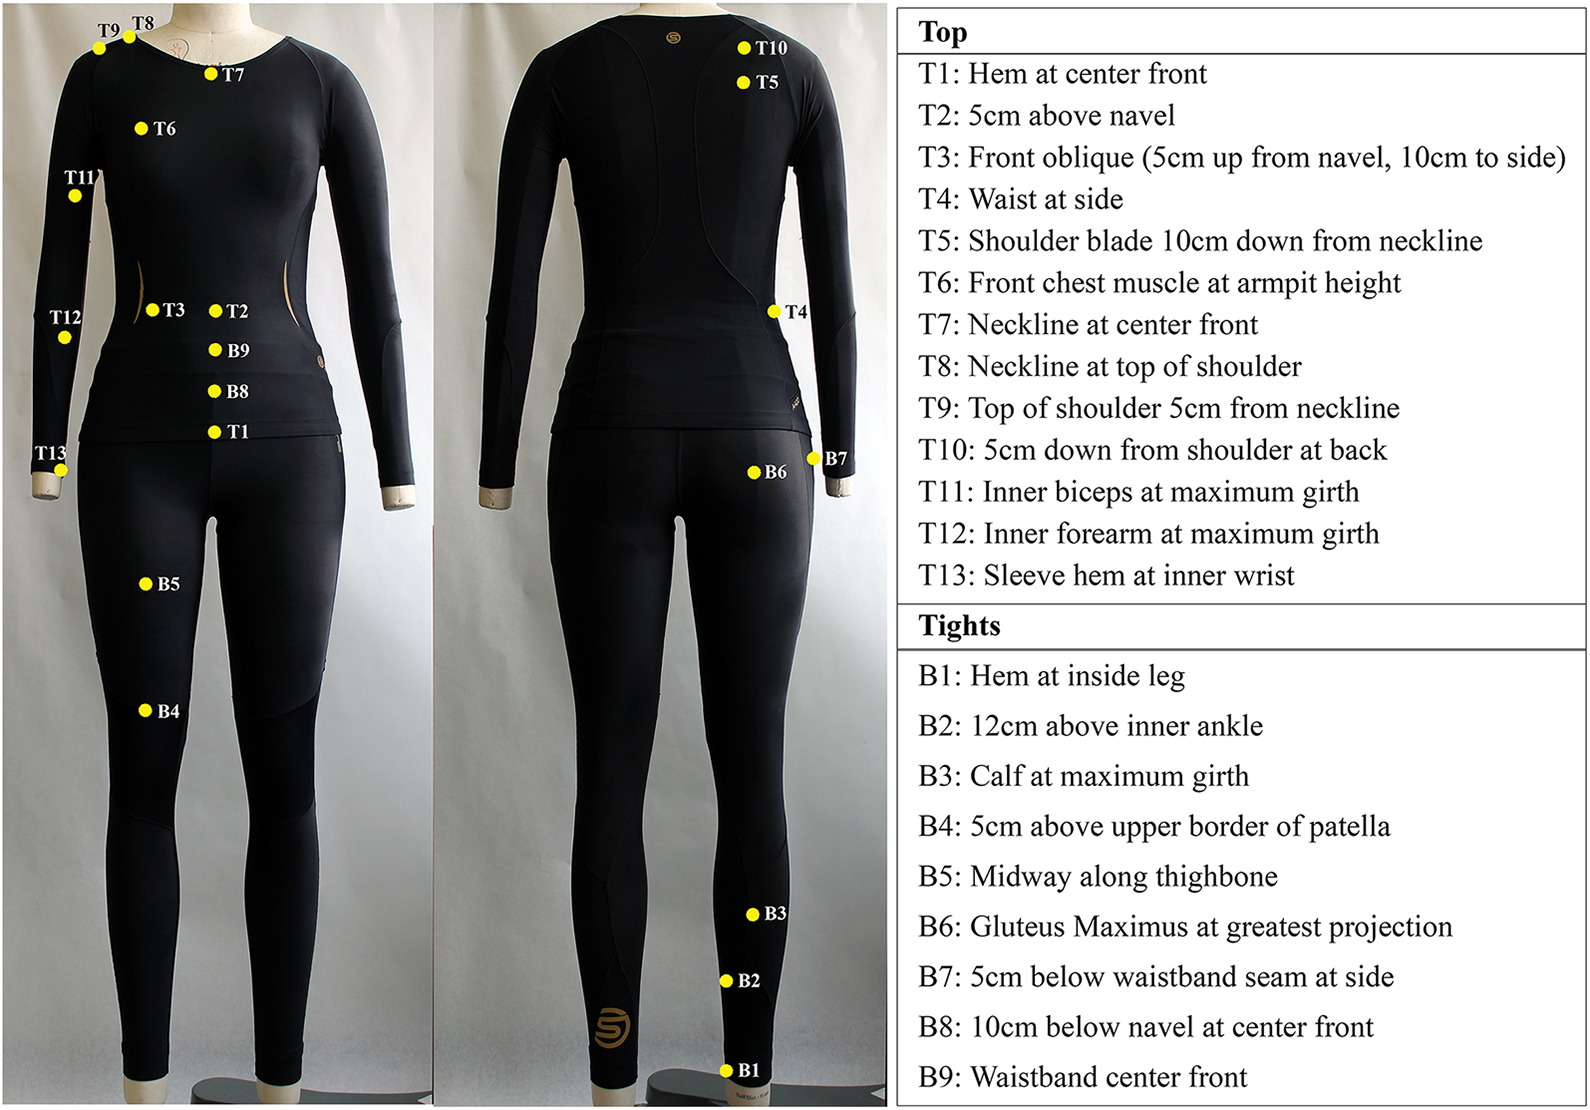
In Vivo Pressure Measurement Locations on the Sports Compression Tights and Top.
Virtual Fit Creation
The clothing-specific, commercial CAD program Optitex Pattern Design Software 11 (EFI Optitex, Israel) was used to virtually fit the SCGs used in the wear trials to the 15 participants’ body scan avatars. We chose Optitex for this study, as two other CAD programs lacked support for the import of body scan files and fabric parameters (AccuMark® 3D, Gerber Technology, USA) and the adjustment of stitch parameters (VStitcher, Browzwear, Singapore). The body scan data files could not directly be used for virtual fit. We had to retopologize the refined body meshes (OBJ files) using a 3D modeling software (Maya®, Autodesk, Inc., USA) to smooth the avatar surface and remove webbing in the underarm and crotch areas caused by data occlusion. The head, hands, and feet were removed, as they were not directly required and the body scanner could not capture hands (holding onto handholds) and feet accurately. The dimensions of the avatar were not affected by the retopology.
We deconstructed the compression tights and top used in the wear trials in size M (base size) and digitized the garment panels (GERBERdigitizer™, Gerber Technology, USA) to re-engineer the garment patterns in a pattern design software (AccuMark®, Gerber Technology, USA). We graded the patterns based on flat measurements of the SCGs in sizes S, M, and L. The graded patterns were then exported in DXF format and imported into Optitex, where they were checked and saved in the Optitex pattern file format (.pds).
User-adjustable simulation settings in Optitex include fabric parameters, stitch parameters, resolution, and global simulation settings. The 3D draping algorithm of Optitex is based on the fabric parameters weight, thickness, bending, stretch, shear, and friction. These properties can be measured and converted into the algorithm by a Fabric Testing Unit (FTU) proprietary to Optitex. We sent the main fabric of the SCGs (Fabric A) to Optitex to be tested by the FTU. The other fabrics used in the SCGs were only used for small garment panels, too small for FTU testing. However, we tested all fabrics using the FAST method to obtain objective fabric properties. We imported the FTU results file into Optitex and manually adjusted the stretch, thickness, and weight values of Fabrics B–F (see Figure 3A) to more realistically represent their properties by comparing the FAST results. It is a major shortcoming of Optitex that the input of objective fabric properties is not supported.
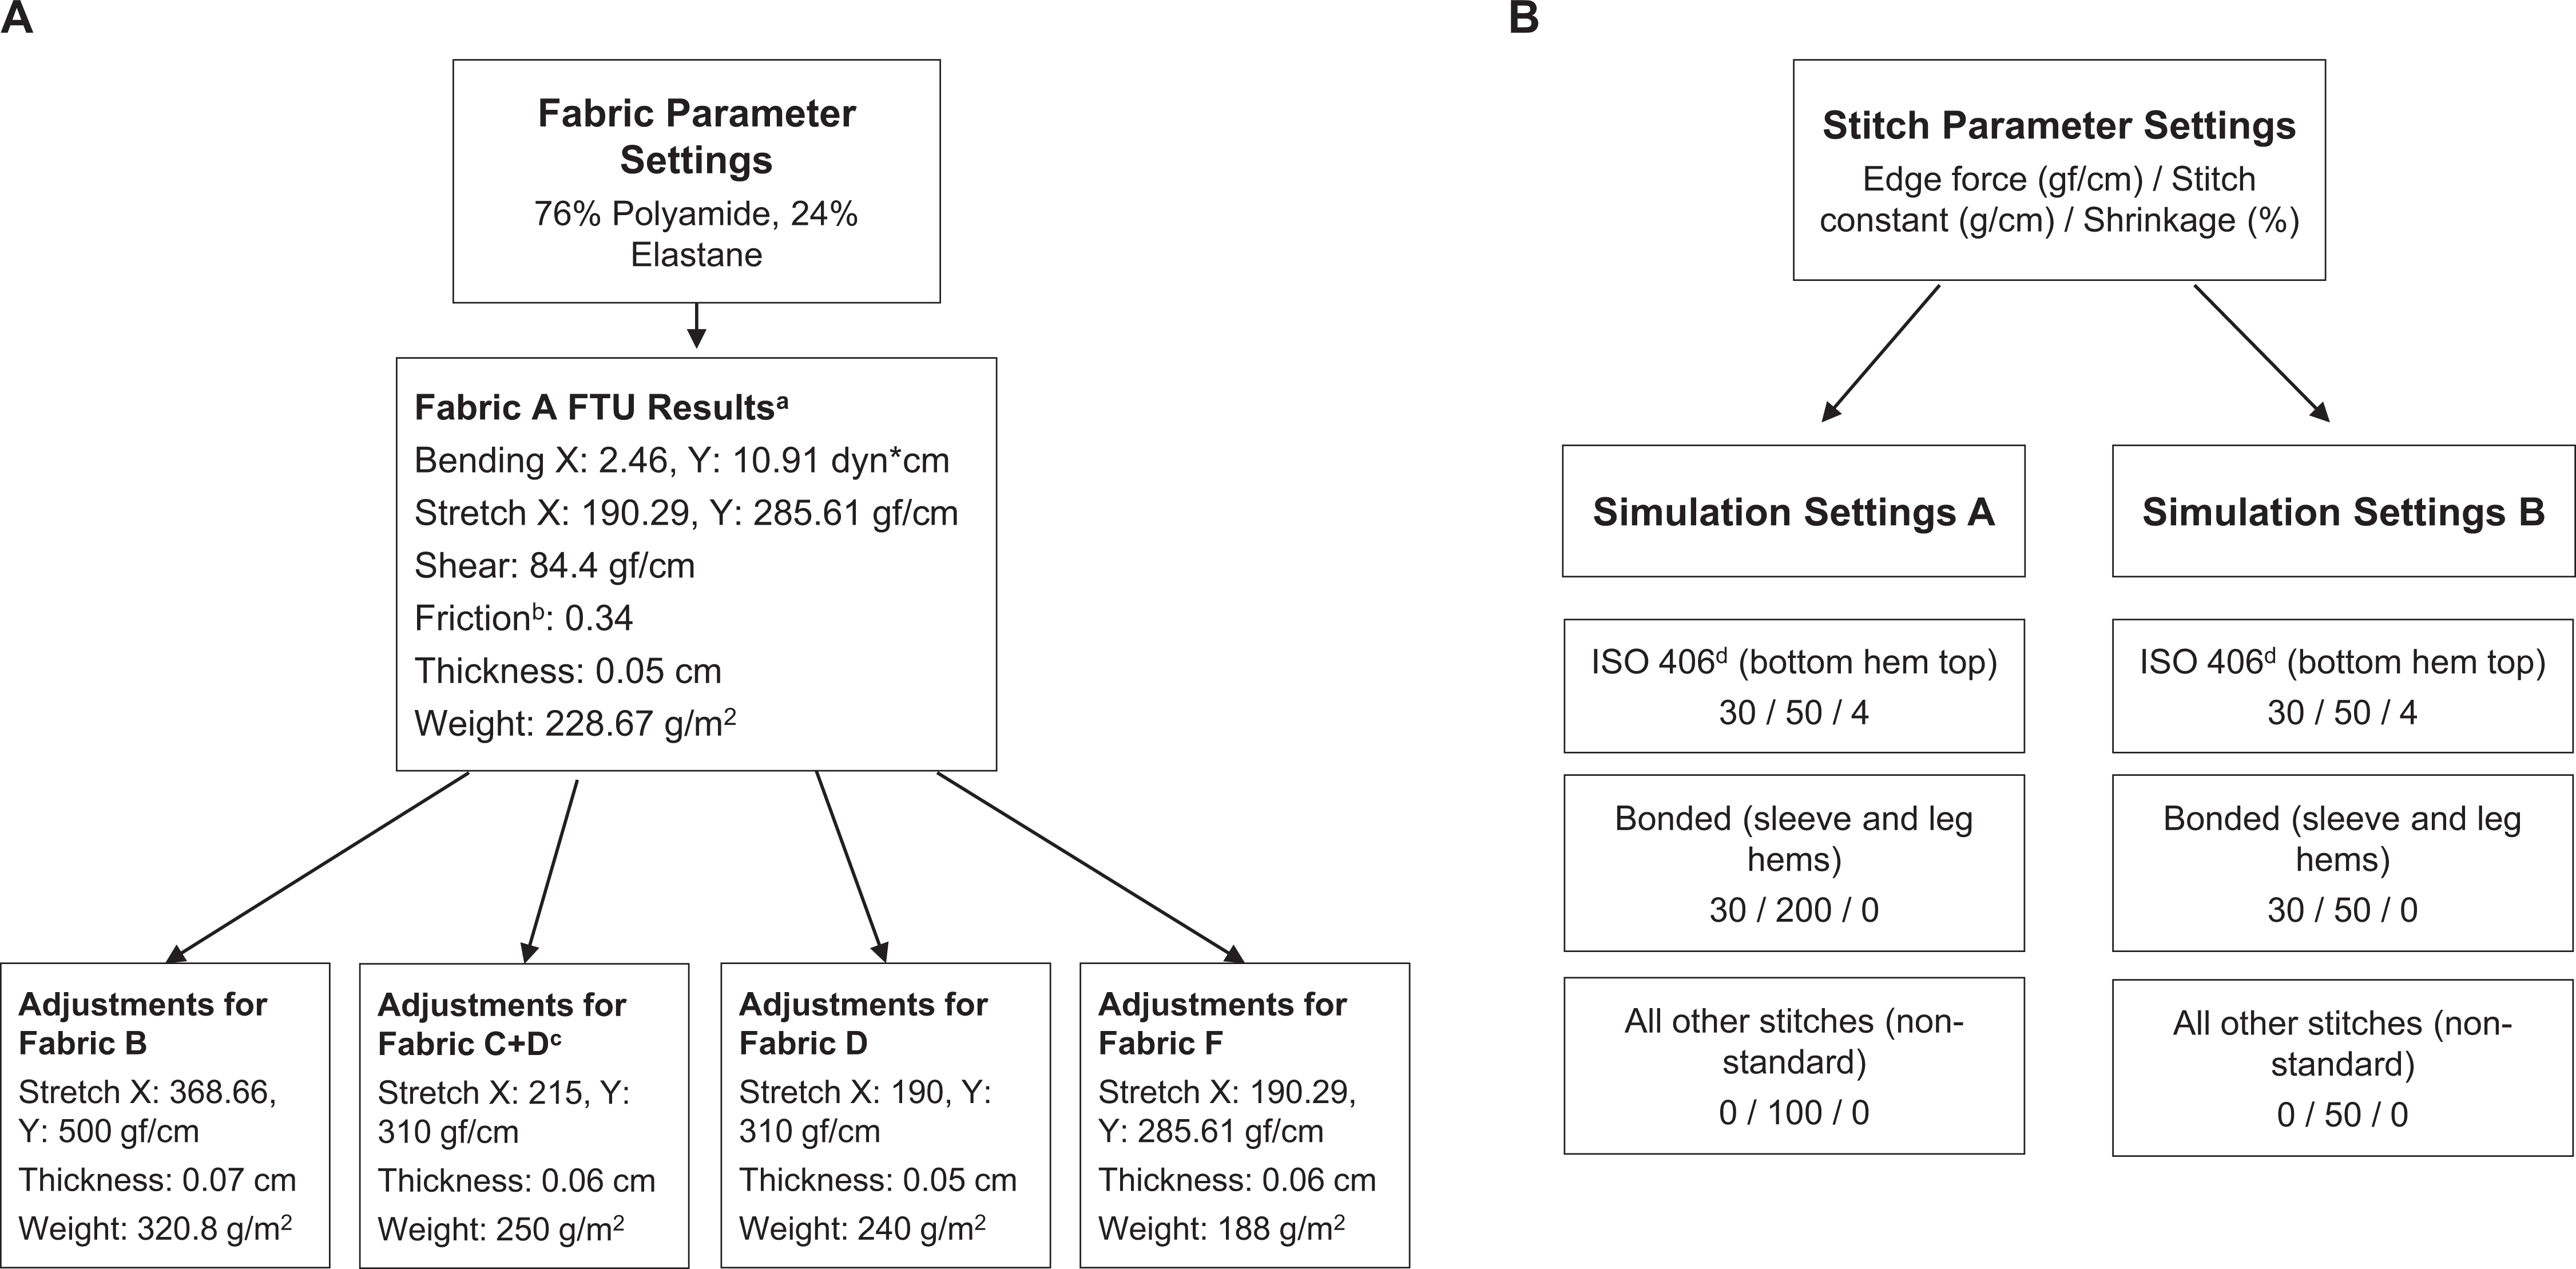
Optitex Fabric and Stitch Settings Used in This Study.
Stitches are defined by three parameters in Optitex: edge force (gf/cm), stitch constant (g/cm), and shrinkage (%). Edge force is a force that pulls the cloth in its direction with a higher force needed for stretch fabrics (EFI Optitex, 2011). Stitch constant is related to the extensibility of a stitch with a high value representing low extensibility of the simulated stitch (EFI Optitex, 2011). Shrinkage of the stitch relates to the shrinkage percentage from relaxed to finished stitch (e.g., through gathering) (EFI Optitex, 2011). Although it is possible to select predefined stitch types with associated settings for these three parameters, it is evident that the parameters do not reflect physical stitch properties, as the predefined parameters for overlock (three- and four-thread), flatlock, and single needle lockstitch are the same. The realistic properties of these stitches would vary substantially (Laing & Webster, 1998).
The main stitch and seam type used in the SCGs were a non-standard cover stitch and a flat seam developed by the brand for improved elasticity and comfort (Skins, n.d.). As it was not possible to translate physical stitch properties into stitch parameters and with no option to set seam properties within the software, we trialed different stitch parameter settings and chose the two sets of settings (simulation settings A and B) that resulted in successful and visually satisfying simulations (see Figure 3B). This also allowed an evaluation of the effects of stitch parameter settings on pressure map values.
The resolution and global simulation settings were kept as per the default settings, only the time step was changed from 0.02 s to the lowest value (0.01 s), as it leads to more accurate simulation results despite slightly longer computation times (EFI Optitex, 2011). For simulation settings A, we had to change the spring stitch constant in the global simulation menu, which determines the strength of the spring in a stitch (EFI Optitex, 2011), to 400 from 250 (default) to achieve successful simulations for all avatars. For the virtual fit creation, we followed the standard process (EFI Optitex, 2011), which involved selecting line segments of different pattern pieces that were to be joined and placing pattern panels around each avatar with a distance to the body to reduce collisions of the garment and avatar.
Virtual Pressure Measurements
We recorded pressure values from the heat map in Optitex that displays normal collision pressure (NCP) on the virtually fitted SCGs on each of the avatars by placing the cursor on each landmark used previously during the wear trials. The pressure values shown on the scale bar were recorded in dyne per cm2 and converted to mmHg (1,333.22 dynes/m2 = 1 mmHg). The NCP map measures the “residual collision forces applied to each face in the direction perpendicular to the fabric’s mesh” (EFI Optitex, 2011). Due to potential inaccuracy in pinpointing the exact PM locations on the avatars, we used the mean of three pressure readings for analysis. We also undertook a reliability check to ensure consistency of results; the SCGs were fitted to each avatar three times in a row with the same settings.
Analysis of In Vivo Versus Virtual Pressure Data
In the pressure analysis, we excluded PMs taken at the ankle (B2, B3), wrist (T13), and chest (T6) due to simulation issues at these locations. We further eliminated PM points B8 and T10, as these were hard to identify on the body avatar and we neglected the neck area (T7, T8). This left six PM locations on the tights and eight on the top for the pressure analysis. As the pressure data were non-normal (Shapiro-Wilk test), we conducted Wilcoxon signed-rank tests to identify differences between the in vivo and virtual PMs using IBM® SPSS® Statistics (Version 24). We also ran Spearman’s ρ correlation tests to detect correlations between the in vivo and virtual pressure data.
Results and Discussion
Objective 1: Accuracy of Numerical Pressure Simulation
The reliability check in Optitex indicated that there were visual differences between repeat simulations; however, the normal collision pressure values remained constant, allowing the analysis of pressure data. The mean in vivo and virtual pressure values (see Figure 4) were higher for the compression tights than the top with bigger differences between the virtual and in vivo pressure values of the tights than the top. The differences were significant at all PM locations of the tights. Contrarily, pressure distribution of in vivo and virtual pressure values of the top followed a similar pattern with no significant differences except at the top of the shoulder (T9; A: Z = −2.83, p = .005, r = −.78; B: Z = −2.48, p = .013; r = −.69). The different sizing approaches for the tights and the top resulted in a tighter fit and increased fabric stretch of the tights compared to the top. It appears that the software simulated the lower pressure levels of the top more accurately.
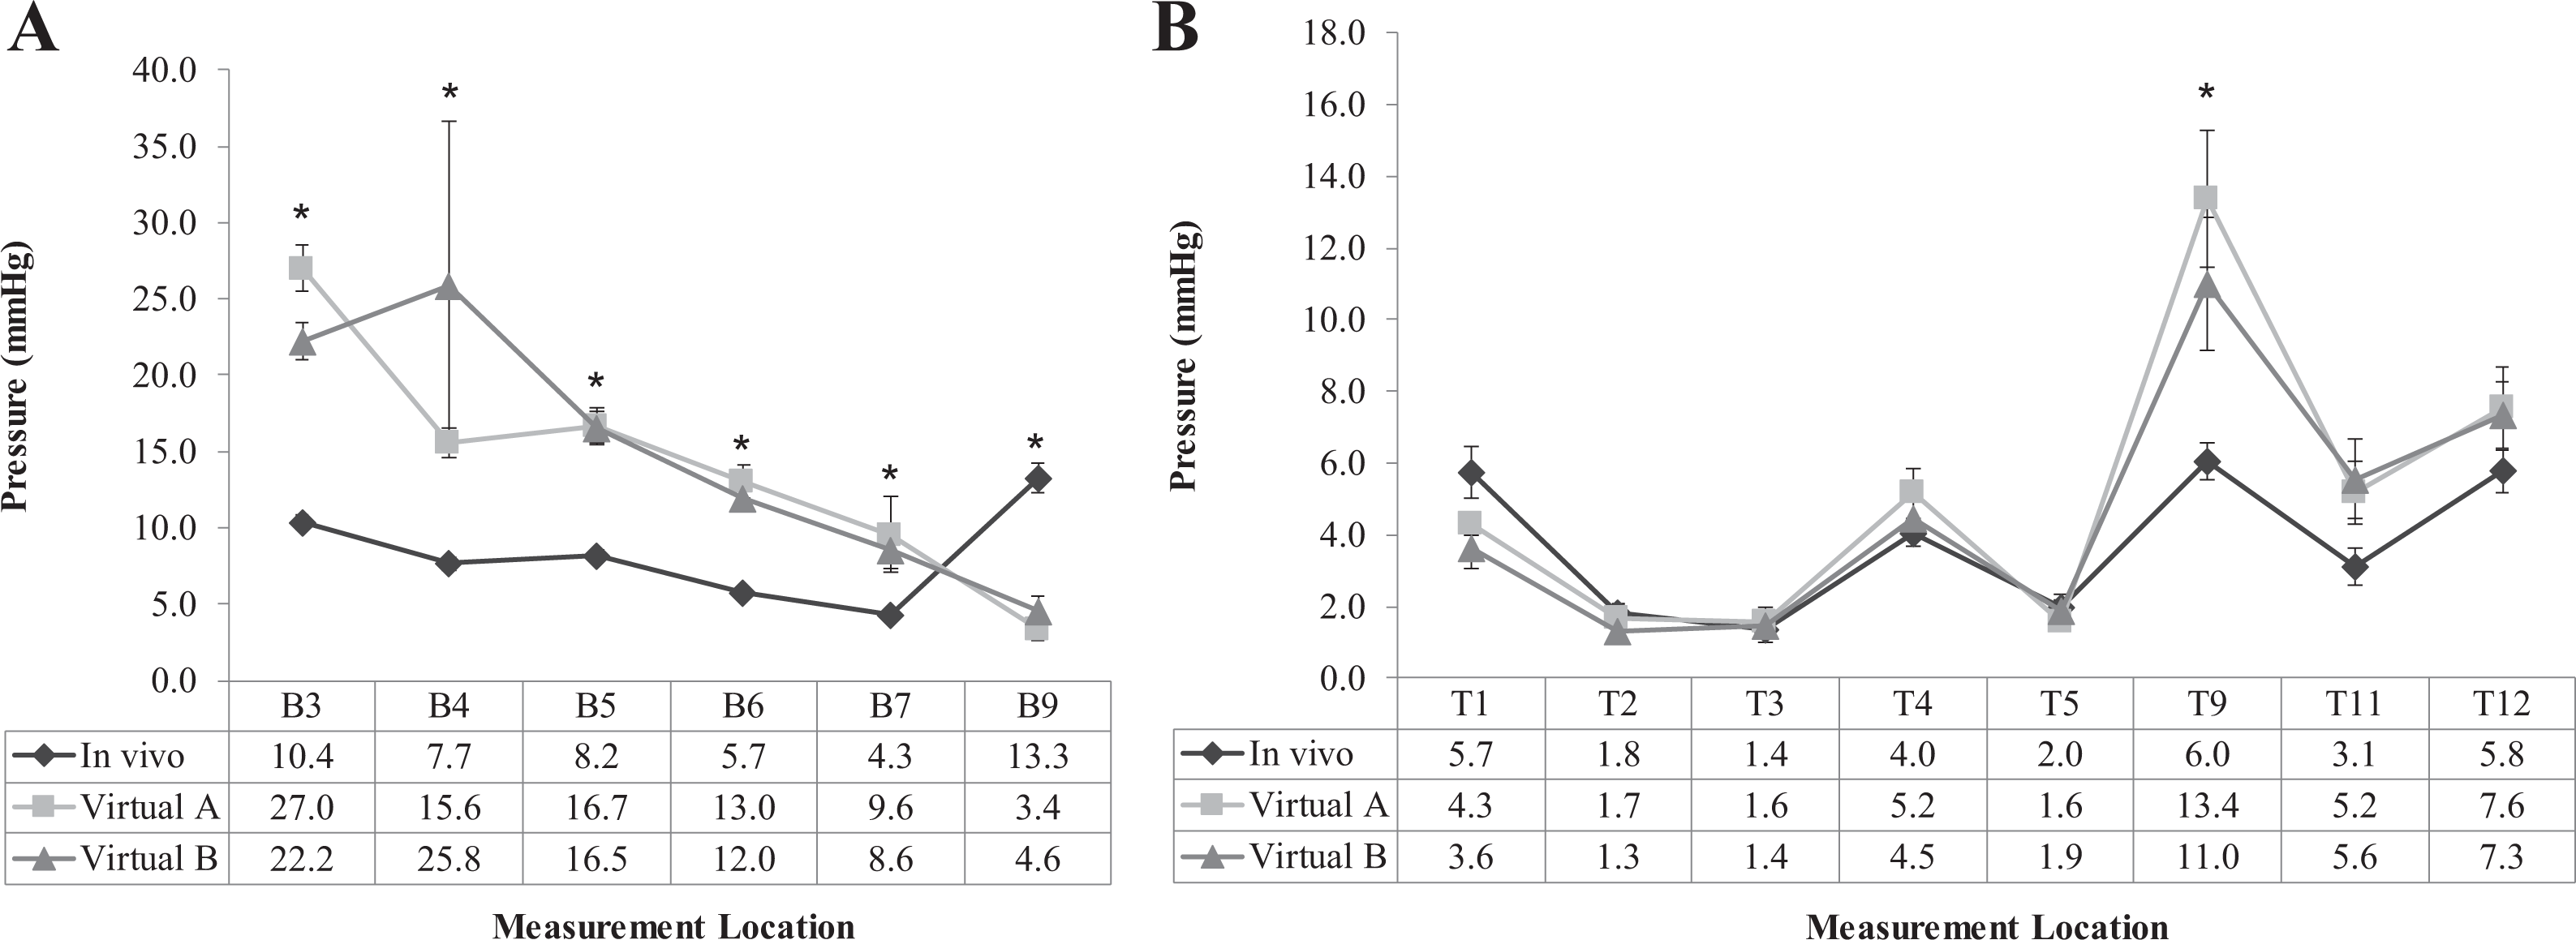
Comparison of Mean In Vivo and Virtual Pressure Measurements.
The virtual PMs at the top of the shoulder (T9) were higher than pressure values at all other locations. Allsop (2012) reported that the top of the shoulder was one of the PM locations eliciting the highest pressure both measured on compression tops on a male body form and recorded from a pressure map in CAD. In this study, however, the in vivo pressure at the top of the shoulder did not vary substantially from other PM locations. The fact that both Optitex and VStitcher (used by Allsop, 2012) predicted high pressure values at the top of the shoulder indicates that their simulation models overestimate pressure at this location, which could be related to the fact that upper body garments sit on and fall from the top of the shoulders.
The waistband (B9) was the only PM point on the tights where virtual pressures were lower than in vivo pressures, likely caused by poor simulation of garment components. The real tights featured a strong 39 mm elastic band at the waistband that was covered by Fabric A. It applied a higher level of pressure to the underlying body. The CAD software was unable to simulate the properties of the elastic and the layering of different materials realistically. Spearman’s correlations between the in vivo and virtual pressure values were non-significant at all PM locations except T5 for simulation settings B, ρ = .70, p = 0.008.
The use of two stitch parameter settings (A and B) showed that the differences in stitch parameters did not substantially affect virtual pressure levels except at location B3 (calf), where pressure values were significantly higher for simulation settings A, Z = −3.18, p = .001, r = −.88. The compression tights featured several seams at the calf, which could be why virtual pressures were affected by the different stitch settings. The large difference between virtual pressures at B4 is likely caused by difficulties in pinpointing the exact position, which was determined by palpation in the wear trials.
Overall, the statistical analysis of PMs indicates that the virtual pressure values provided by the NCP map are not realistic representations of the in vivo pressures applied by the SCGs to the participants’ bodies. In contrast to Sayem and Bednall (2017) who found that heat maps supported the prediction of the drape of woven sleeveless shirts with positive ease, we found that the heat maps could not predict the pressure applied by highly elastic knitted garments with negative ease.
Objective 2: Practicability of Virtual Fit Technology for the Design of SCGs
Figure 5 presents the NCP maps for all participants. Visually the virtual fit of the SCGs appeared realistic with seams positioned correctly. However, there were problems with excess fabric at wrists and ankles, potentially caused by the lack of feet and hands of the avatars. Sleeves and legs of the SCGs were too long for many participants creating fabric folds at the ankles and wrists. The software was unable to simulate this behavior, which diverged from the ideal fit. When placing garment pattern panels around the avatars in preparation for virtual stitching, garment–avatar collisions were unavoidable, as the SCGs were smaller than the participants’ bodies. This frequently resulted in simulation failure or seam gaps, particularly in the underarm area due to the raglan sleeve and at the legs due to high garment stretch levels.
Figure 5 shows that pressure levels at the seams were extremely high (i.e., red) compared to the rest of the garments. This was the case for all avatars. Pressure values at these locations were unrealistically high, ranging far beyond compression capabilities of garments (approx. 90–450 mmHg). Pressure levels applied by SCGs generally range from approximately 8–32 mmHg, only rarely reaching levels above 32 mmHg (Born et al., 2013). It is not possible to adjust seam properties in Optitex. Adjustments to the stitch constant parameter, which relates to stitch extensibility, did not reduce pressure levels at the seam, indicating that the software is unable to simulate extensible seams.
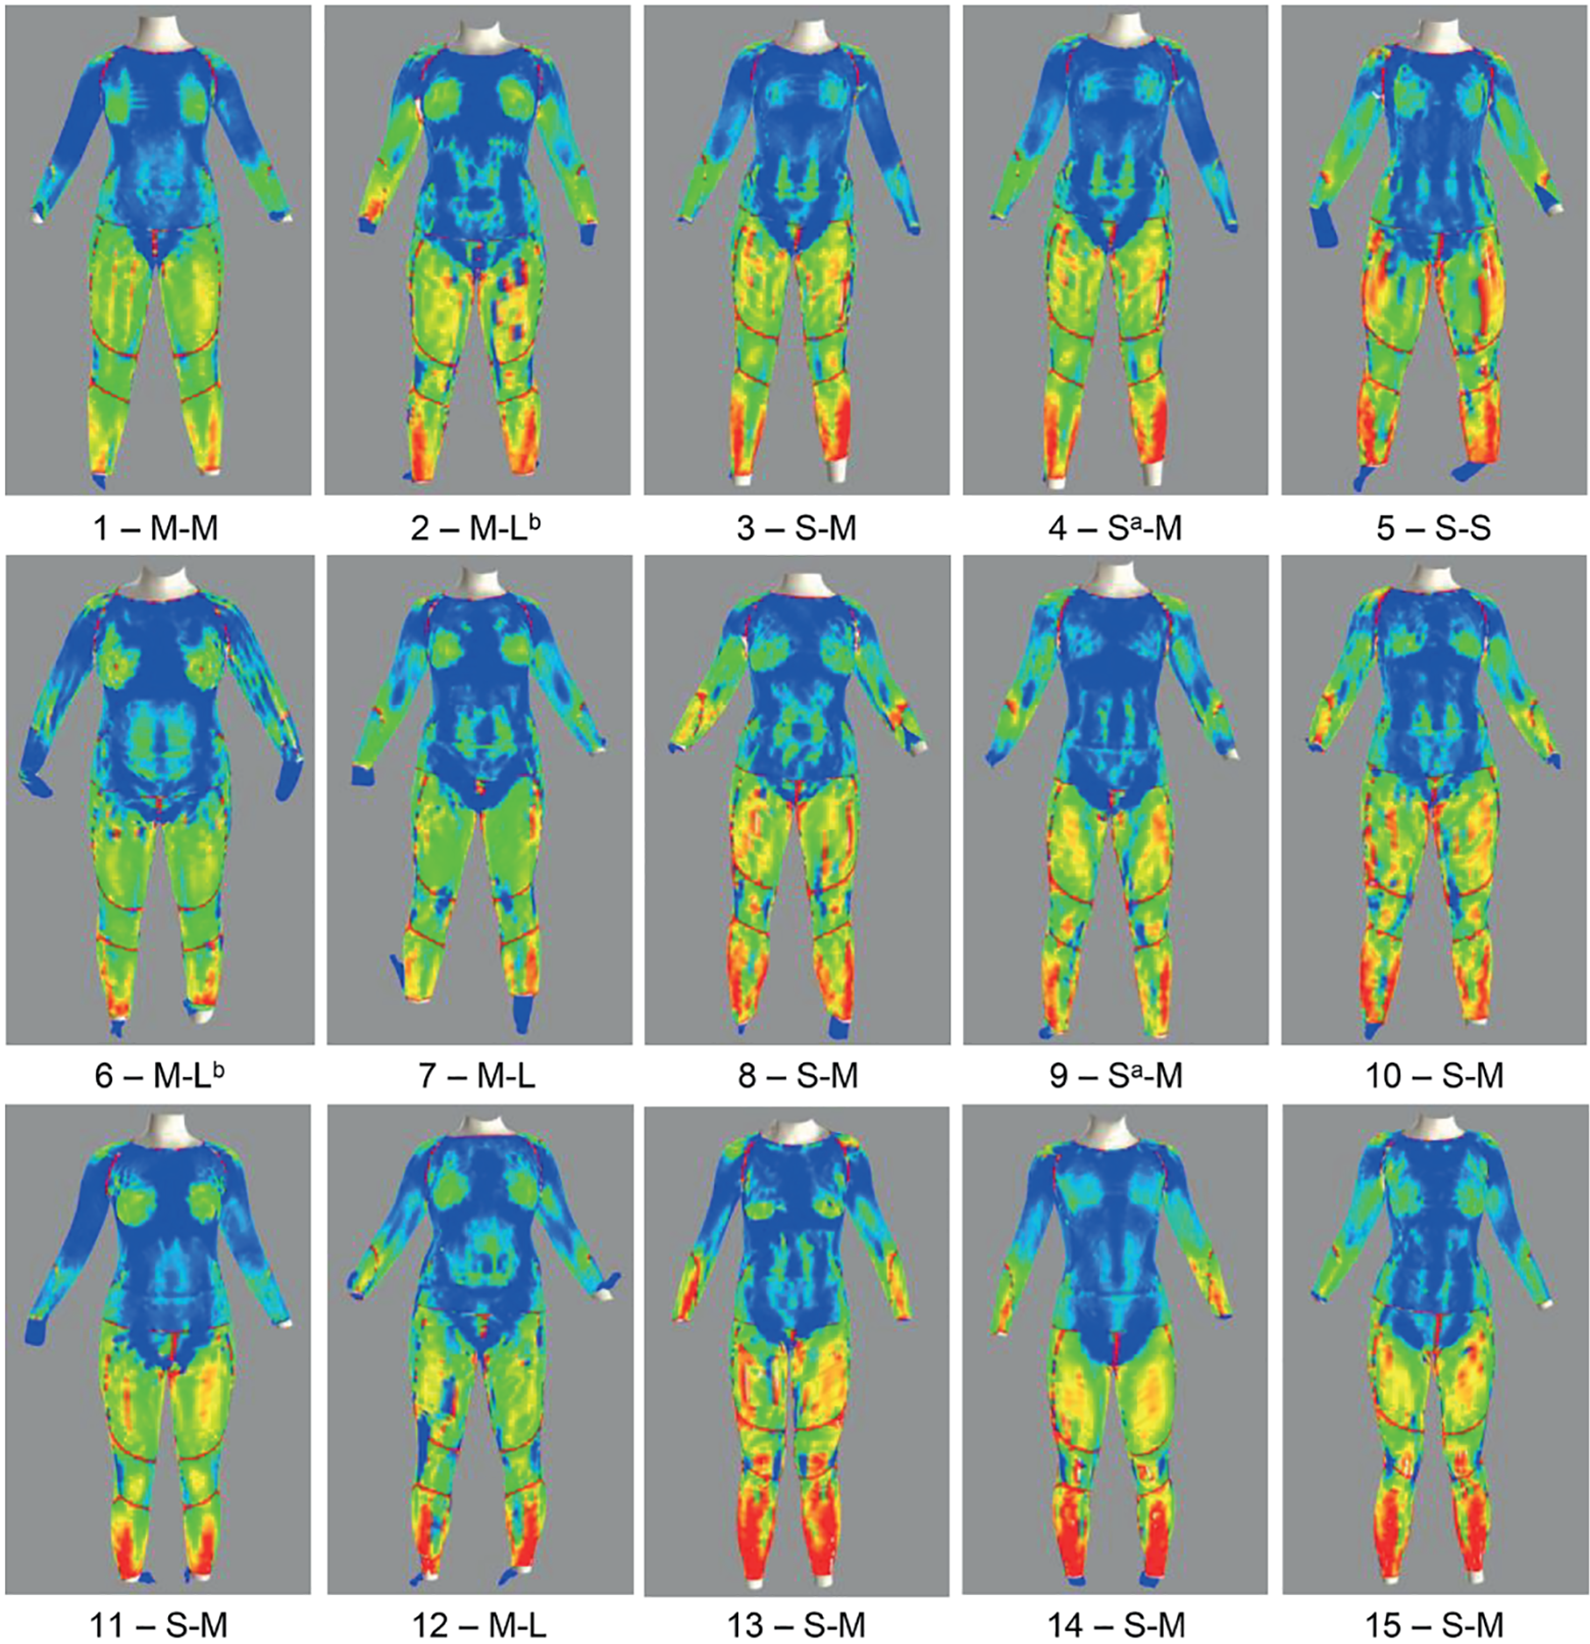
Normal Collision Pressure (NCP) Map of Compression Tights and Top Virtually Fitted to Participants’ Avatars.
Stitch properties are a particularly difficult area in garment simulations, which has been neglected by current researchers. Stitch properties needed to be adjusted according to fabric properties, as edge force and stitch constant are affected by the stretch properties of the fabric to be stitched. The fact that one of the global simulation settings had to be changed to achieve a successful simulation for simulation settings A indicates a dependence of the stitch settings and general simulation settings. Apart from assessing the appearance of the simulation with certain stitch settings, it is currently difficult to know which stitch settings are the most realistic from a technical point of view.
Using virtual fit technology for technical evaluation requires precision and a reliable process. Obtaining acceptable simulation results was time-consuming, as virtually stitching complex garments is intricate and placing the stitched garment panels around the avatar for the simulation was unpredictable. The process ranged from only a few simulation attempts to needing numerous adjustments, as the simulation failed or was defective (e.g., fabric gaps). The visual results of repeat simulations were unreliable, which is impractical for industry application. Although some of the simulation problems described here are likely related to the negative fit and the related high stretch level of the SCGs, other researchers simulating garments with positive ease have also reported the unpredictability of the process. It took Porterfield and Lamar (2017) 2–23 attempts to obtain a successful fit simulation of a dress. The time-consuming process and potential inter- and intra-operator variability make the successful application of the CAD program for virtual fitting in the fast-paced apparel industry questionable.
A successful virtual fit process depends on the accurate 3D representation of the properties of both the garment and the wearer’s body. As was the case for other researchers (e.g., Stjepanovic et al., 2011), it was impossible to import the 3D body scan avatars directly into the CAD program due to uneven surfaces and data occlusion, which required substantial expertise and time to remodel the body scan files. Therefore, the use of built-in parametric models would be more practicable. There needs to be more flexibility in the adaptation of body measurements of parametric models to allow body shape reproduction. Ideally, avatar adjustments based on the import of detailed lists of body measurements obtained from body scanning should be supported. Furthermore, body avatars are solid objects in CAD (Kuzmichev & Cheng, 2019) and therefore cannot simulate realistic tissue compositions of the human body (e.g., muscle mass, fatty tissue, bony prominences), which could result in different levels of applied pressure. Compressible, soft tissue avatars are needed to support a more accurate simulation of SCG–body interface pressure. Overall, the time-consuming, unreliable simulation process is not practicable in commercial settings.
Conclusion
Summary
Designing SCGs with desired pressure specifications requires pressure levels to be predicted. With Laplace’s law being difficult to apply in a design environment, this study addressed a gap in research by assessing the feasibility of using the built-in pressure map in a clothing-specific CAD program to predict the applied pressure before making a sample. The goal was to apply existing technology to facilitate the design and development of complex cut-and-sew SCGs in practice.
We conducted physical wear trials with SCGs to measure in vivo pressures and compared them to numerical pressure values recorded from a virtual fit pressure map on 13 body scan avatars for a compression top and tights. Pressures applied by the compression tights were substantially higher than pressures applied by the compression top, which resulted in larger variances between in vivo and virtual pressure levels of the tights. Overall, there was a lack of correlations between virtual and in vivo pressure values (with exception of T5).
The technically realistic simulation of SCGs on body avatars is currently not possible due to shortcomings of the CAD program in the simulation of garment characteristics (e.g. stitches). It may be possible to tweak parameters to achieve a good fit between the simulation and the real world, but the process of tweaking parameters does not correlate with robust data and cannot be applied for new products with no in vivo data. Consequently, the predictive value of the software is low and it is not feasible to use it for the prediction of pressures applied by SCGs.
The virtual fit process was time-consuming and unpredictable, and inter-user variability is likely to occur, making it impractical for industry application. Fitting high-stretch garments to avatars was difficult both in terms of process (panel placement) and simulation results (fabric gaps). This highlights the lack of insight into detailed garment properties of the software and allows a hypothesis to be made about its garment simulation capabilities. The software appears to have been developed for simple garments with positive ease and low stretch properties focusing on visualizing garments through photorealistic rendering for marketing and sales purposes, rather than the realistic simulation of technical garment aspects.
For virtual fit technology to be more suitable for technical garment evaluation, the input of fabric and stitch parameters that have a clear relation to physical fabric and stitch properties obtained through objective, standardized testing should be supported. A fabric, stitch, and component library that is based on meaningful technical parameters of standard garment components would be useful for more technically accurate simulations. The virtual fit process needs to be reliable in terms of repeat simulations and inter-user reliability for it to be useful in practical design environments. The simulation of the human body also needs to be improved by enabling more flexible avatar morphing and the import of detailed body measurements obtained from body scanning. Future developments should include soft tissue avatars to provide a more realistic garment–body interface.
Limitations
The evaluation of virtual fit for pressure prediction was limited by the restrictions of the CAD software. The manipulation of the simulation parameters relied partly on the principal investigator’s expert judgment because there were no clear links between the parameters applied by the software and physical garment properties. Only Fabric A was tested by Optitex, as the fabric panels of the other fabrics were too small for testing. Although fabric settings were guided by FAST data, some variations may have existed in the fabric properties used in the study. The pressure analysis is only valid for the settings used in this study. Pinpointing the exact PM locations when taking pressure readings from heat maps can be difficult, however, three measurements were taken to counteract this limitation. At the same time, it highlights the challenge of incorporating virtual fit in practical design environments. Future research should consider placing markers on avatars to facilitate virtual PMs.
Implications for Academia and Industry
With increased reliance on virtual applications in design and product development, this study took a different approach to previous research, which mainly compared virtual fit to real fit. We focused on the use of virtual fit for pressure prediction in new product development. As the first known study to critically assess the accuracy of a built-in pressure map in a commercial clothing-specific CAD program, this study provides a significant contribution to existing work on virtual fit. It is a crucial step forward in assessing the effectiveness of virtual fit for new product development, which requires prediction, not just a virtual copy of reality.
The manipulation of the individual elements of fabric and stitch parameters and simulation settings demonstrated a lack of technical garment considerations in the existing virtual fit settings. Substantial work is needed in the development of more sophisticated virtual fit software systems before they are of use in technical design. This study provides insights into the varying requirements of virtual fit for marketing and sales purposes and virtual fit for technical design, which currently do not seem to be fully understood by software developers. Future developments of commercial clothing-specific CAD software should be based on inter-disciplinary collaborations between textile, garment, and software specialists to develop CAD programs that realistically simulate garments on body avatars for new product development, pressure prediction, and technical garment analysis.
Footnotes
Acknowledgments
Part of the wearer trial study was conducted using the 3D body scanning facilities of the Department of Materials at the University of Manchester. The authors would like to thank Dr Simeon Gill and Dr Steven Hayes from the Apparel Design Engineering group for their kind support.
Declaration of Conflicting Interests
The author(s) declared no potential conflicts of interest with respect to the research, authorship, and/or publication of this article.
Funding
The author(s) disclosed receipt of the following financial support for the research, authorship, and/or publication of this article: This work was funded by a PhD studentship awarded to Kristina Brubacher by the Manchester Metropolitan University.