
Abstract
Victimization surveys have become a standard means of measuring crime trends, with the aim of capturing unrecorded crime in addition to crimes known to the police. “Reporting propensity” is often considered to be a major threat to the validity of police-recorded crimes as a measure of crime levels, but analogous processes can also impact the validity of victim surveys. Changes in sensitivity to perceiving incidents as “violence” is a case in point. In particular, the present study provides an empirical assessment of the extent to which changes in sensitivity to violence may pose a threat to the validity of survey-based research on violence. We drew on three sweeps of the Finnish National Crime Victim Survey (2013, N = 6,561; 2017, N = 5,615; 2021, N = 4,309) to examine changes in sensitivity and the association between sensitivity and reported victimization trends. An increase in sensitivity to violence during the research period was observed. Results from our mediation analysis suggest that adjusting for sensitivity significantly changes the association between survey year and the propensity to report multiple types of violent victimization. In particular, an increase in sensitivity may suppress an actual decrease in reporting victimization. Implications for measuring victimization trends in surveys and developing sensitivity measures are discussed.
Introduction
National-level crime victim surveys and statistics are central tools in identifying broader trends in crime. Since the inception of victim studies in the United States in the 1960s, similar survey-based studies have been carried out in many countries. In Finland, the first national-level crime victim survey was conducted in 1980, and measurement has continued ever since, with some minor variations in methodology. Most notably, the data collection method was updated in 2012, resulting in the current Finnish National Crime Victim Survey (FNCS).
Victim surveys continue to be seen as a “corrective” to trend analysis based on police-recorded administrative statistics on crimes, as they also include unrecorded victimization incidents. However, the reporting propensity challenge is not entirely resolved using survey methodology. One factor that may influence people’s responses is how they perceive and conceptualize the domain of violence or crime in general. Researchers from various disciplinary traditions have spoken of issues such as cultural sensitivity, interpretive elasticity, conceptual creep, and prevalence inflation (Foulkes & Andrews, 2023; Kivivuori, 2014; Levari et al., 2018; Lynch & Addington, 2015; van Breen et al., 2024).
In this article, we define “sensitivity to violence” as a tendency to perceive incidents as violence. Thus, while perception is a nondirectional concept, sensitivity refers to the increasing scope of violence perception. While this tendency may vary at both individual and societal levels, the present study specifically addresses cultural sensitivity as a societal characteristic that may, as we hypothesize, affect any between-time-point or cross-country comparisons of a variety of violence measures. In the present study, the focus is on self-reported victimization compared across survey sweeps. A recent Swedish study suggests that the increase in self-reported victimization rates may be explained by a lowered tolerance, particularly toward sexual violence (Hagerlid & Löfgren, 2024). We expand this inquiry by incorporating explicit measures of violence perception in our analysis.
As for the framing of our inquiry, we first discuss the theoretical and contextual sources of the cultural perception perspective and examine prior studies. Second, we describe how cultural perception has been measured in the FNCS. Third, we use three measuring points (2013, 2017, and 2021) from the FNCS system’s 10-year period (2012–2021) of perception measurement to answer two research questions: (1) Has sensitivity to perceiving incidents involving conflict as violence increased in the context of Finland? (2) If there have been changes, what are their implications for the observed trends of survey-reported interpersonal violence?
It is evident that definitions of violence vary depending on context and individual perspectives embedded in cultural frameworks. We argue that any measure of violence may be subject to validity issues and biases due to explicit or implicit differences in how violence is defined. In particular, the present study provides an empirical assessment of the extent to which changes in sensitivity to violence may pose a threat to the validity of survey-based research on violence. Although surveys typically aim at explicit and concrete act-based descriptions of violence, individual experiences are still subject to variance in human interpretation (Skogan, 1986). Notably for the present study, we hypothesize that systematic temporal variance in perceptions of violence is likely to introduce bias when comparing surveys conducted at different time points.
To the best of our knowledge, no similar empirical inquiries in the field of criminology and criminal justice research have addressed these issues before the present study. This study will therefore serve as an introductory approach to examining the relationship between cultural sensitivity and victimization trends. Our focus is largely on the survey instrument, which was first developed and introduced by Kivivuori (2014), and the preliminary picture this instrument allows us to paint in relation to violence victimization trends over the time period of a decade. Results from our analysis provide tools for further developing measurements of cultural sensitivity in survey research.
Conceptual Background
The study of perceptions of crime is a classic tradition in sociological criminology. The theoretical rationale for research into the perception of violence was originally formulated by Durkheim in his 1895 book on sociological methods. In effect, Durkheim saw the crime rate as the key to understanding definitions of crime: A significant drop in the crime rate would result in an expansion of the concept of crime. Later, Moynihan suggested that the mechanism was a two-way street: Increasing crime would result in “defining deviance down” (Moynihan, 1993). Moynihan argued that this was what happened in the United States in the postwar period. That is, societal changes led to increasing crime and, via a Durkheimian cultural logic, to the lowering of standards for what was considered unacceptable behavior.
Over recent decades, several sociological theories have suggested that Western societies have become increasingly sensitive to conflict and that people are increasingly prone to defining conflict as violence and/or as a crime, something that needs to be tackled legally. Beck’s “risk society” thesis (Beck, 2006) and Furedi’s “culture of fear” theory (Furedi, 2006) are examples of such grand theories of epochal diagnostics. In criminology, Garland’s concept of “high crime society” resembles such theories. Garland did not refer only to the high frequency of (petty) crime but also to the increasing cultural salience of the concept of crime in Western societies. Because of rising crime and economic insecurity from the 1970s onward, the need for security and crime prevention became “ever-more urgent aspects of middle-class psychology and culture,” making citizens “crime conscious” and “attuned to the crime problem” (Garland, 2000, p. 361). Indeed, Garland sees the rise of crime culture as a response or backlash to the postwar increase in crime, but he additionally factors in other kinds of insecurity apart from normalized mass criminality. Garland also links the rise in social crime sensibility to the middle classes. The Swedish criminologist von Hofer (2000) sees a wider and longer connection between increasing security and rising crime sensitivity: The objective increase in life expectancy and medical progress in curing diseases direct human fears toward crime, making people sensitive to identifying interpersonal conflict and threats.
Societal Context: Defining Violence
Like other Nordic countries, Finland is usually classified as having a social democratic welfare regime that has achieved high levels of income equality and social mobility (Esping-Andersen, 2015). An emphasis on equality has also made the Nordic countries some of the most gender-equal countries of the world, as cultural values emphasize personal autonomy and the protection of basic human rights. According to some analysts, this may translate into a particular proneness to perceiving infringements of personal safety as social problems and even crimes (Gracia & Merlo, 2016).
In criminological theory and research, notions of crime or violence are typically conceptualized as extending beyond the legal definitions of crime as violations of criminal law. In particular, survey-based criminological studies often include relatively minor offenses, such as verbal threats or pushing. In youth research, even unauthorized absences from school are commonly categorized as forms of offending behavior (Näsi et al., 2024).
While legal definitions of violence are not a necessity when studying experiences or perceptions of violence, especially within a survey framework, they may be seen as indicators of how violence is conceptualized in a broader societal context and how these conceptualizations evolve. Certainly, the perception of what constitutes violence, including what should be the legal threshold for violence, is constantly debated. In Finland, there have been several changes in societal discussions and in legislation in the past two decades. Especially in the fields of sexual and intimate partner violence, reforms have usually expanded the sphere of criminalized behavior or shifted the domain of public prosecution to less severe crimes (Kotanen, 2018). Discussions on the legal regulation of noncontact violence have been particularly in evidence in recent years. Stalking became a criminal offense in 2014 under the Finnish Criminal Code (Governmental Proposal, 19/2013). There has also been more public discussion around the potential criminalization of different forms of psychological violence (“coercive control” in particular, e.g., McMahon & McGorrery, 2020). Yet, despite the visibility of this societal discussion on conceptualizing violence, its implications for measuring crime in criminological research remain largely unexplored.
Prior Research
There is a small but growing body of empirical research on cultural sensitivity to seeing conflict as a crime or violence. One can detect the contours of an emerging Durkheimian research program in criminological study of social reactions to crime. In the first phase of studies, researchers relied on trend comparisons to detect differential logics in “serious crime” and “nonserious” or “borderline” incidents reported to authorities. Kivivuori (2014) conducted such comparisons in Finland and observed trends consistent with an increasing level of sensitivity (more “petty” crime per homicide). He additionally used a survey indicator to examine the correlates of sensitivity, finding that a high level of education, female gender, and non-victim status were linked to a higher level of sensitivity. Kivivuori discussed the possibility that the decades-long drop in the crime rate could be self-camouflaging: A decrease in the number of victims might be hidden by an increase in the number of non-victims having a broad conception of violence. Also, the rise in people participating in higher education could lead to increasing numbers of people trained to have low sensitivity thresholds (Kivivuori, 2014).
Hagerlid and Löfgren (2024) explored the “reverse gender gap” in the Swedish Crime Survey by analyzing change in the measurement equivalence of victimization measures. Specifically, they investigated whether a lowered tolerance of violence contributed to shifts in self-reported victimization by assessing whether different cohorts interpreted victimization questions differently over time. The results supported their hypothesis that changes in victimization rates were primarily driven by shifts in perceptions of sexual offenses specifically, rather than by an actual increase in crime. Fagerlund and Kääriäinen (2018) used trends of emergency calls and survey data to examine people’s sensitivity to violence-related problems. Their findings highlighted domestic violence as a domain in which perceptions of violence have expanded the most. Their study corroborated earlier findings on gender and age differences but did not replicate findings concerning the role of education (Fagerlund & Kääriäinen, 2018).
Lynch and Addington (2015) noted that from a long-duration historical perspective, “an expanding cultural definition of violence is readily apparent.” They took a closer look at recent trends based on U.S. national victim studies and found that sensitivity had increased especially in the domains of sexual and domestic violence, but not so much in the domain of verbal threats. However, trend comparisons were consistent with the Durkheimian compensation hypothesis, leaving the generalist versus specialist of conceptual expansion open (p. 323). Lynch and Addington concluded that cultural changes have affected the way crime trends are manifested in victim surveys and administrative statistics and that evidence is stronger for domestic violence than for other types of violence such as rape and verbal threats. In addition to explicit crime data, a conceptual expansion of violence has also been observed in public discourses. Recently, van Breen et al. (2024) used natural language processing techniques to study the use of the term “violence” in national newspapers in the Netherlands. Their results demonstrate a shift in the public discourse on violence, as the use of the term has expanded beyond its traditional meaning to increasingly cover societal challenges and social injustice.
Changes in the perception of deviance have also been increasingly studied in disciplines other than criminology. Psychologists have examined the phenomenon of “conceptual creep” through a series of ingenious experiments (Levari et al., 2018). These experiments showed that when participants were asked to track a special feature that had been manipulated to decrease, people compensated for it by expanding the definition of the relevant cue. This was demonstrated to be the case for neutral stimuli (the color of balls) but also for criminology-relevant characteristics such as face aggressivity. The manipulated decrease in aggressive faces was compensated for by the participants in that they started to define more neutral faces as hostile. The experiment thus supported the theory of frequency-dependent conceptual inflation if a command to track a special cue is given. Public health researchers have also studied similar phenomena under the label of conceptual inflation (Foulkes & Andrews, 2023). They have suggested that increasing the number of campaigns to sensitize people to mental health issues has led to an increase in mental health problems. In criminology, a comparative case in point would be the salience of intimate partner violence. Increasing consciousness of its status as a crime may have resulted in successful conceptual expansion.
Methodology
Operationalizations of Sensitivity to Violence
Criminologists have proposed several ways of operationalizing cultural sensitivity. Some related constructs such as crime reporting propensity have been suggested. But the most prevalent method of empirically exploring sensitivity has been to compare different crime indicators that are differentially susceptible to cultural interpretation. Thus, lethal violence can be compared to nonlethal or petty forms of violence, with the notion that as lethal violence presents a more objective measure, divergent trends capture changes in sensitivity; or, in a similar manner, injury-causing violence can be compared with other violence (Kivivuori, 2014). Often, this trend-comparison approach combines several variables to critically discuss the role of cultural sensitivity. Such trend comparisons have been seen as supporting sensitivity trends at least in Sweden, France, and Finland (Estrada et al., 2014; Kivivuori, 2014; von Hofer, 2000).
But can divergence in lethal versus nonlethal or injury-causing versus other violence be seen as a good measure of sensitivity? It always remains possible that nonlethal and noninjury-causing violence actually increases or decreases without the trend being explainable by cultural factors impacting reactions to crime. Increasing reporting of less serious incidents could also reflect the ease of reporting due to advanced communication technology (internet, mobile phones). Clearly, there is a need to use other means of studying cultural changes in human sensitivity. As suggested by Lynch and Addington (2015, p. 324), one option is to use survey methods to tackle the sensitivity question—we opted for that approach by using a direct measure of sensitivity in a survey.
Current Focus
Although the topic of perceptions of violence is not a neglected one within social scientific research, the significance of varying levels of sensitivity to violence has received comparatively little scholarly attention—particularly in relation to how crime is measured through survey-based methods. The rationale for the present study rests on the following argument: drawing upon theoretical literature, societal trends, and existing empirical findings, we argue that it is highly plausible that cultural differences in sensitivity to violence exist and that these differences may influence survey-based trends of violent victimization and offending. Yet, this potential source of measurement bias has not been systematically examined in prior empirical work. The present study seeks to address this gap in research by offering an initial, exploratory contribution to analyzing how cultural sensitivity to violence shapes the validity of survey-based crime measurement.
Rather than conducting a separate sensitivity survey, we used a shorter instrument—that is, a scale to measure sensitivity—in the context of the FNCS, with the benefit of having data from 10 consecutive years. This instrument was first developed and introduced by Kivivuori (2014) and has been used annually as part of the FNCS data collection. For the purposes of this analysis, we used data from three of the measuring points, 2013, 2017, and 2021. The first part of our empirical analysis describes and examines the FNCS sensitivity instrument and its dimensions. Based on previous theoretical and empirical work as well as ongoing societal trends in Finnish society, we hypothesize that sensitivity to violence has increased during the research period.
The second part of our analysis concerns the implications of changes in sensitivity for measuring crime. Essentially, we hypothesize that sensitivity to violence is associated with a propensity to report violent victimization in the survey. Building upon that, we seek to assess the ramifications of that association for violent victimization trends measured in 2013, 2017, and 2021. In practice, we examine whether adjusting for sensitivity to violence significantly influences the observed victimization trends. This is carried out by applying a mediation analysis framework that allows for adequate, non-biased comparisons between sensitivity-adjusted and non-adjusted models.
Data and Methods
The FNCS is a nationally representative victim survey that has been conducted annually from 2012 to 2021. According to Finnish law and the ethical guidelines of the Finnish National Board on Research Integrity (Finnish National Board on Research Integrity TENK, 2019), research of this type does not require approval from an official research ethics committee.
Each year, a net sample of 14,000 people aged 15 to 74 years permanently residing in Finland was drawn from the Population Information System using stratified random sampling, with gender, age group, and region as the strata. Since there have been slight modifications to the sampling strategy 1 as well as to some of the survey instruments 2 in some of the measurement years, we chose to use data from three comparable measuring points, 2013, 2017, and 2021. This way we could ensure that our findings were not biased due to different sampling strategies or differences in measurement. This also allowed us to examine trends in both sensitivity and violence victimization for the duration of the data collection of FNCS while using data that are suitable for trend analysis.
All respondents were sent a paper questionnaire with an option to participate online. Participants provided informed consent by completing the survey. The paper questionnaire was available in Finnish and Swedish, the official languages in Finland, while the online questionnaire was additionally available in English and Russian. The availability of multiple languages in the online survey was indicated in a multi-language cover letter that was sent along with the Finnish-language paper questionnaire to people who had indicated on the Population Information System that their native language was neither Finnish nor Swedish. The response rate was 50.0% for the 2013 sweep, 44.4% for the 2017 sweep, and 34.4% for the 2021 sweep. The declining response rate is not unique to the FNCS but indicative of a broader global trend in survey research (Stedman et al., 2019). After excluding respondents with missing data for our key variables, the number of respondents in our analysis samples were 6,561 for 2013, 5,615 for 2017, and 4,309 for 2021.
Sensitivity Scale
In addition to the standard victimization sections, the survey also includes a standard sensitivity module. This module was incorporated into the fixed part of the FNCS from the first sweep in 2012. The module includes 11 actions that A directs at B. The action formulations were largely consistent with the preceding victimization module and prior victim survey items used in Finland. The situations described in the sensitivity scale are as follows:
A threatens to harm B physically over the phone or other messaging device.
A hits B so that the hit results in a bruise.
A slaps B in the face.
A knowingly blocks a doorway so that B cannot pass.
A grabs or touches B in a way that B finds sexually insulting.
A threatens B with physical violence in a face-to-face situation.
A tries to force B into sexual intercourse without succeeding in it.
A pushes B on purpose.
A grabs and pushes B.
A hits B without causing a visible sign or injury.
A forces his/her spouse B into sexual intercourse.
The following instructions preceded the questions: “In the following questions, general perceptions of violence are examined, regardless of the gender of the victim and the perpetrator. The purpose of the questions is to ask for your perception of whether the event in question should be considered violence. This is not about whether the event constitutes a violent crime under Finnish law, but rather whether you personally would describe the event as violence. First, read through all of the example situations without answering the questions. After that, respond to each item by indicating how well you think the word ‘violence’ describes the event. In the example situations, persons A and B are adults, but their other characteristics (such as age, gender, etc.) are not specified.” The respondents were prompted to focus on the perceptual-semantic issue by asking whether they perceived each of A’s actions toward B as violence (“In Your view, can A’s action toward B be described as violence?”) with a four-point response scale, with the following answer options: 1 = No, 2 = Yes, to some extent, 3 = Yes, to a large extent, and 4 = Yes, absolutely. The four-point response scale makes it possible to examine more subtle changes in perceptions of violence compared to just dichotomized yes or no responses.
Table 1 presents the descriptive statistics of each of the 11 items in the sensitivity scale from 2013, 2017, and 2021. We see that the mean value of each item has increased significantly over time, indicating that the respondents increasingly perceive each of the described acts as violence.
Descriptive Statistics of the Sensitivity Scale.
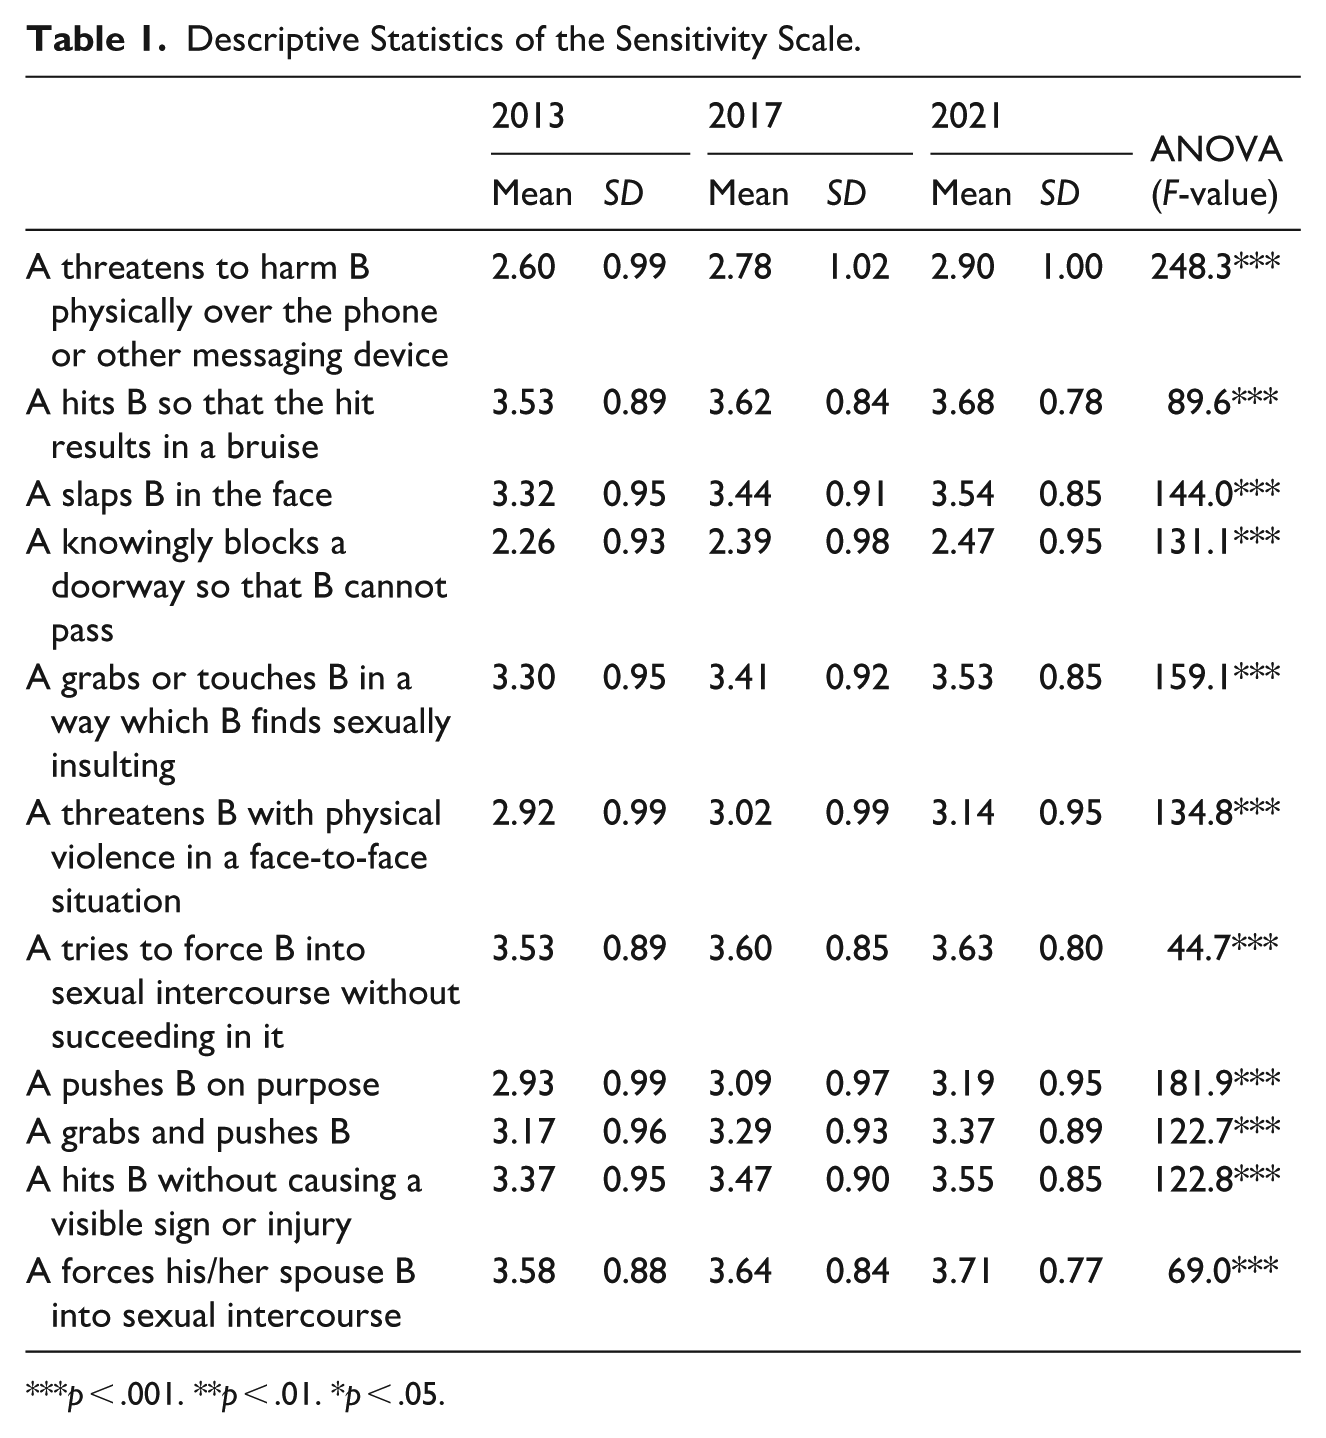
p < .001. **p < .01. *p < .05.
Victimization Measures
The FNCS violent victimization measures included 13 acts of violence that were categorized into five dichotomous variables for the purpose of the present analysis: violent threats (face-to-face threats; threats over telephone, e-mail, or other communication mediums); minor physical violence (grabbing or preventing from moving; pushing or shoving); more severe physical violence (slapping; pulling hair; punching; hitting with a hard object; kicking or strangling; using a weapon of some sort); sexual violence (forced sexual intercourse or other sexual acts; and attempts at such); and “all victimization” that, in addition to the ones mentioned above, also included unspecified “other physical violence” defined by the respondent. The variables indicated whether the respondent had been subjected to these acts by any perpetrator (three answer options included former or current spouse, or a cohabiting or dating partner; some other person familiar to the respondent; stranger) during the previous 12 months.
Controls
To control for the influence of respondent age and gender on the results, we also included measures of these in the analysis. Age was used as seven 10-year age groups, and gender was used as a dichotomous measure based on the Population Information System’s information on the respondent’s gender, male or female.
Descriptive statistics for the control variables and reported violent victimization for each survey sweep are presented in Table A1 in Appendix. The statistical significance of the differences in victimization measures was tested for the difference between 2013 and the subsequent measuring points. There were no statistically significant changes in reported violent victimization between 2013 and the subsequent measuring points, with the exception of an increase in reported sexual violence in 2021.
Analytic Strategy
Our main analysis is twofold. We began by describing and exploring the sensitivity scale in order to use it in an adequate manner for our analysis. To assess the composition of the scale and reducing its dimensions in a justifiable manner, we performed an exploratory factor analysis (Fabrigar & Wegener, 2011) to see what underlying factors the scale consists of. The factor analysis was conducted using maximum likelihood extraction with varimax rotation. The correct number of factors was carefully assessed by parallel analysis, examining scree plots, eigenvalues, Kaiser–Meyer–Olkin factor adequacy and factor loadings for different solutions, by running the factor analysis separately for each survey sweep and different subsamples (males and females; age groups; victims and non-victims), and by assessing the interpretative usefulness of each solution. After choosing and inspecting the most adequate solution, the factor loadings from the results of the factor analysis were used as a basis for composite variables describing each factor. For this purpose, we used sum-scores divided by the number of factors above the cutoff value of 0.5 (=mean value of items with high or relatively high loading values). Other options for computing composite variables were also tested, such as variables based on regression scores (DiStefano et al., 2019), but the chosen strategy provided the most distinctive and interpretative variables in the same metric with each other and the original scale. These composite variables describing different dimensions of sensitivity were then inspected and used in the subsequent analyses.
In the second part of the analysis, we aimed to assess the role of sensitivity in trends of reported violent victimization. We began with a descriptive comparison of the observed prevalences of different types of violence and the predicted probabilities for 2017 and 2021, holding sensitivity measures constant at their 2013 mean levels. Predicted probabilities were derived from logistic regression models where victimization measures were used as outcomes, holding covariates at their 2013 mean values and estimating outcomes for 2017 and 2021. In the modeling, “a logit shift” was applied—adding a constant to the model intercept so that 2013 predictions matched the observed 2013 rate—to align the model’s baseline with reality and make year-to-year differences directly interpretable (Rosenman et al., 2023).
Next, although our inquiry deviates from a standard mediation design, we applied a “mediation logic” to our trend analysis in order to accurately disentangle whether sensitivity-adjusted and non-adjusted victimization trends diverged from each other. For this purpose, we applied the Karlson, Holm, and Breen (KHB) method (Karlson et al., 2012) that is specifically developed to separate the portion of the association that is mediated by an intermediary variable. This method was also chosen due to the nonlinear nature of our outcome variables (dichotomous victimization measures) and the suitability of the KHB method in separating direct and indirect effects specifically in nonlinear models, such as logit or probit models (Kohler et al., 2011). In other words, the method was chosen because it enables unbiased comparison of coefficients across models by correcting for rescaling bias, ensuring that differences between models are substantive. This method is particularly suitable for our purpose of disentangling whether divergences between sensitivity-adjusted and unadjusted victimization trends are genuine or occur due to model scaling. Also, an advantage of the KHB method is that it allows for the inclusion of multiple “mediators” as well as control variables in the model (Breen et al., 2013; Karlson et al., 2012).
In practice, our application of the KHB method assessed whether adjusting for the dimensions of sensitivity (composite variables based on the factor analysis results) significantly affected the association between the survey year (treated as an independent variable) and violent victimization (treated as the dependent variable), while simultaneously controlling for the influence of age and gender. In other words, we assessed the extent to which the association between measurement point and reported victimization was “mediated” via sensitivity to violence. A similar analytic strategy within the field of criminology has recently been applied by Näsi et al. (2024).
The mediation analysis applying the KHB method was undertaken with Stata version 17, using the user-written KHB module for Stata (Kohler et al., 2011). All other analyses were implemented using R (version 4.3.2).
Results
The Composition of the Sensitivity Scale
Our assessment of factor analysis models suggested that the best fit was a four-factor solution. The Kaiser–Meyer–Olkin factor adequacy values, including the overall measure of sampling adequacy were all above 0.9 for that model, suggesting the suitability of the method and model chosen, and the sums of squared factor loadings (all well above 1) also indicated a good fit. The factor loadings and the fit statistics for the full sample (data from 2013, 2017, and 2021 combined) are presented in Table 2. Based on the factor loadings, the four underlying factors seem to reflect (1) sensitivity to sexual violence, (2) sensitivity to verbal and nonverbal threats, (3) sensitivity to minor physical violence, and (4) sensitivity to major physical violence.
Results From the Factor Analysis (4 Factors).
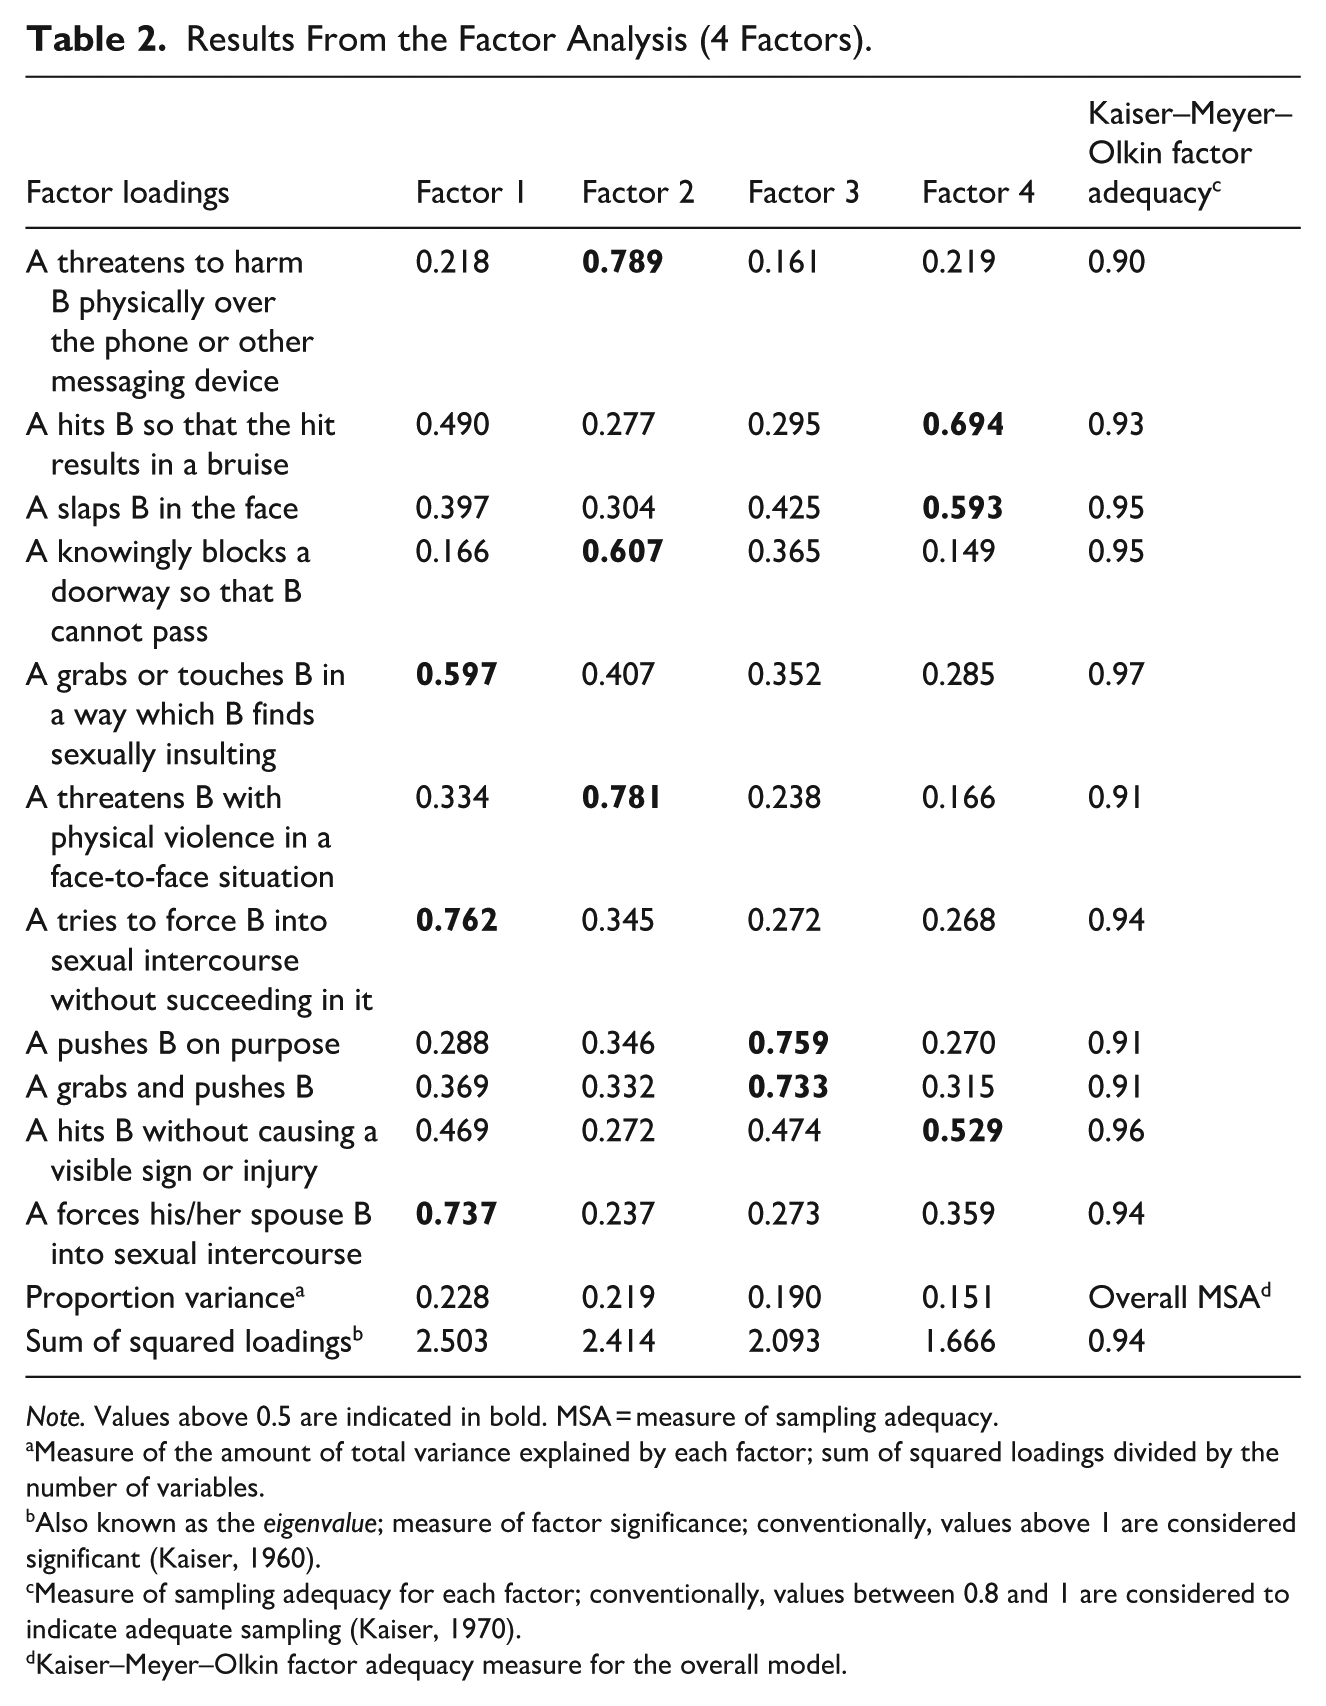
Note. Values above 0.5 are indicated in bold. MSA = measure of sampling adequacy.
Measure of the amount of total variance explained by each factor; sum of squared loadings divided by the number of variables.
Also known as the eigenvalue; measure of factor significance; conventionally, values above 1 are considered significant (Kaiser, 1960).
Measure of sampling adequacy for each factor; conventionally, values between 0.8 and 1 are considered to indicate adequate sampling (Kaiser, 1970).
Kaiser–Meyer–Olkin factor adequacy measure for the overall model.
Based on the results of the factor analysis, composite variables describing the four underlying dimensions of sensitivity were composed. The correlations among these variables are presented in Table 3, showing that all four dimensions of sensitivity are correlated. The strongest correlation occurs between sensitivity to sexual violence and major physical violence.
Pearson Correlation Matrix of the Four Dimensions of Sensitivity.
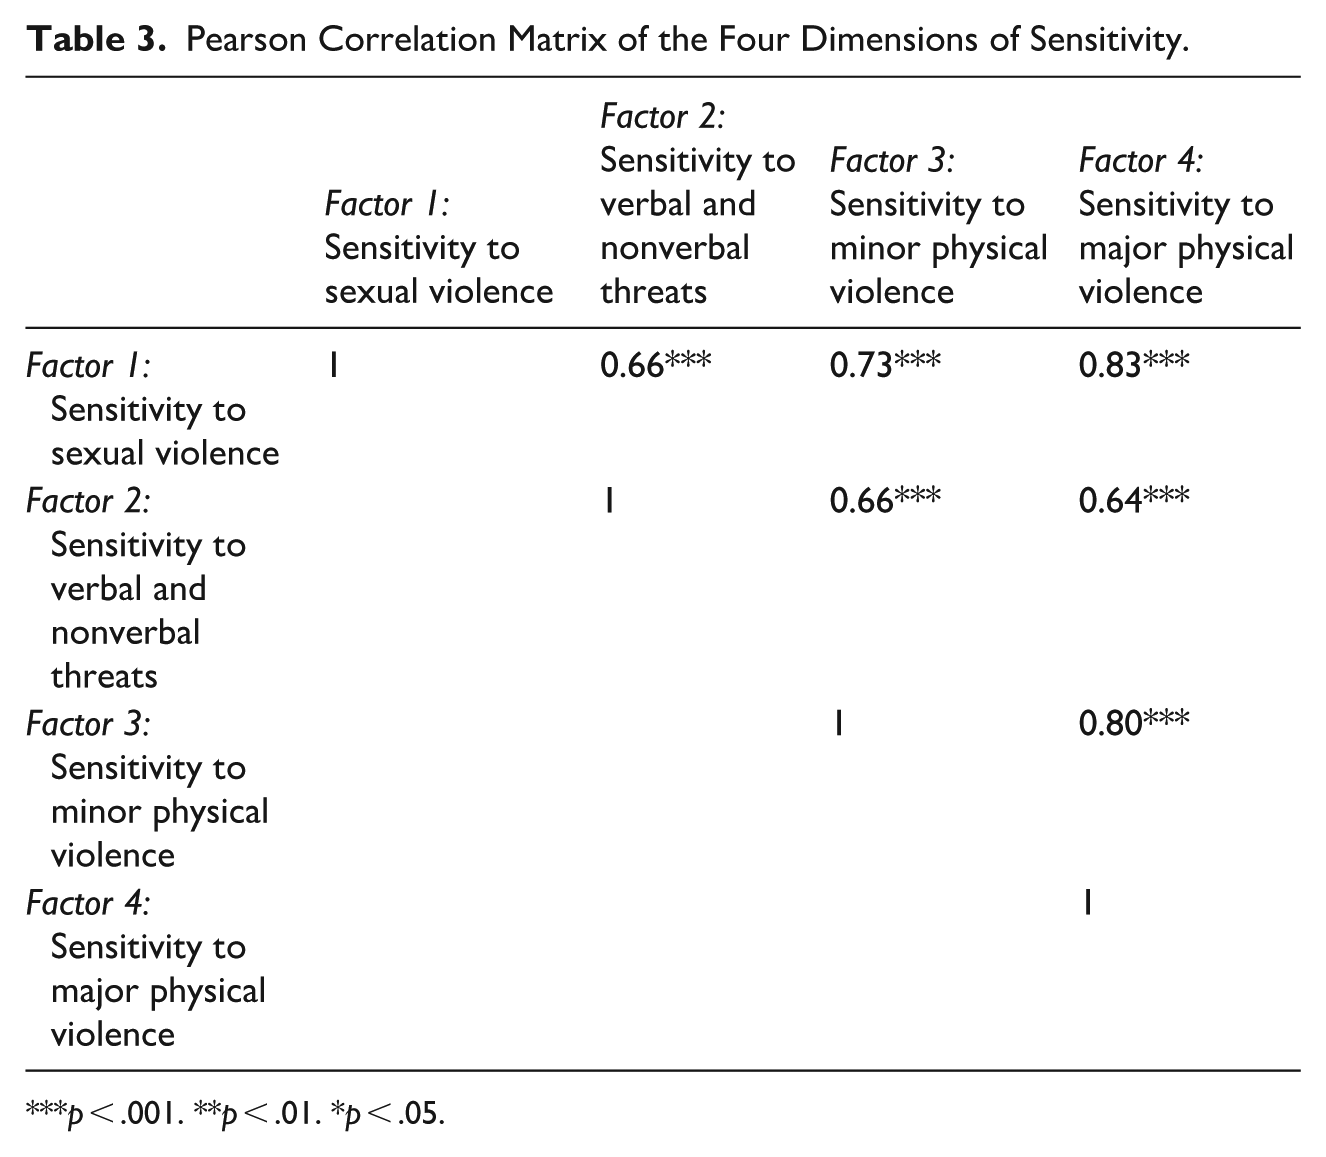
p < .001. **p < .01. *p < .05.
We further examined the dimensions of sensitivity by examining the mean values of the composite variables over the measurement points. To assess whether the observed changes depend on the victimization status of the respondent, we also checked the descriptive statistics separately for those who did and did not report any type of violent victimization in the survey. These results are presented in Figure 1 (tabulated results in Table A2 in Appendix). In line with the descriptive statistics on the original items presented in Table 1, an increase in sensitivity can be observed in each dimension of sensitivity. Overall, the biggest increase occurred regarding sensitivity to verbal and nonverbal threats. Furthermore, in terms of each factor, respondents who had reported violent victimization in the survey did generally score higher in sensitivity than respondents who had not reported victimization; the difference between victims and non-victims was statistically significant between all measurement points and each sensitivity measure, apart from sensitivity to threats where there was no significant differences between victims and non-victims in 2017 and 2021. Notably, however, the increase in sensitivity occurred for both victims and non-victims across all sensitivity measures.
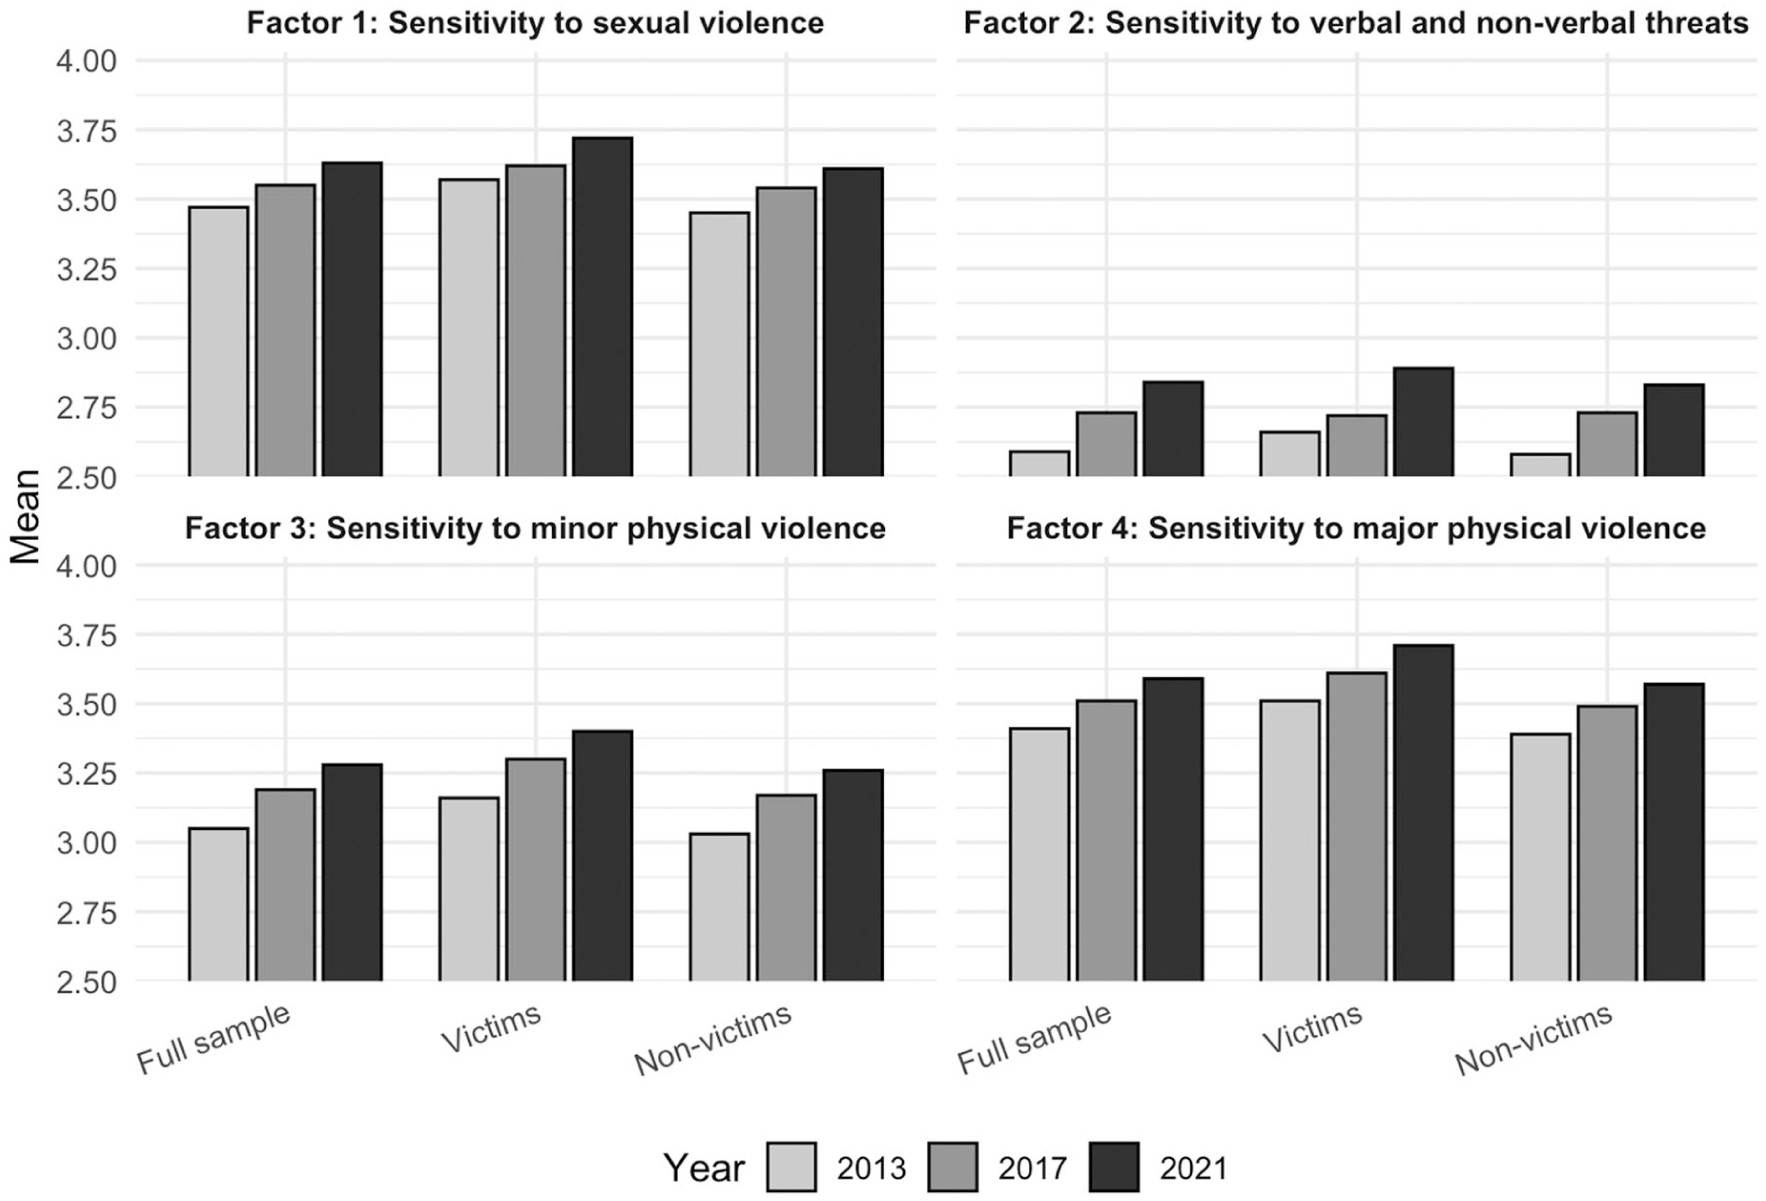
Four dimensions of sensitivity; full sample, reported victims and non-victims separately.
The Implications of Changes in Sensitivity for Victimization Trends
In the second part of the analysis, we assessed the role of observed changes in sensitivity to violence in terms of reported violent victimization. We first compared the observed prevalences of different types of violence with predicted probabilities for 2017 and 2021, holding sensitivity measures constant at their 2013 mean levels. Figure 2 displays this comparison for five victimization types: any, serious physical, minor physical, sexual, and threats (note that scales differ across outcomes, so magnitudes are not directly comparable). Overall, predicted probabilities adjusted to 2013 sensitivity levels are consistently lower than the observed prevalences. While the differences are generally modest, they are noteworthy given the short time frame of the survey. The largest differences are observed in 2021 for overall victimization and minor physical violence (about 0.3 percentage points), while the smallest difference at the same time point is for sexual violence (about 0.1 percentage points).
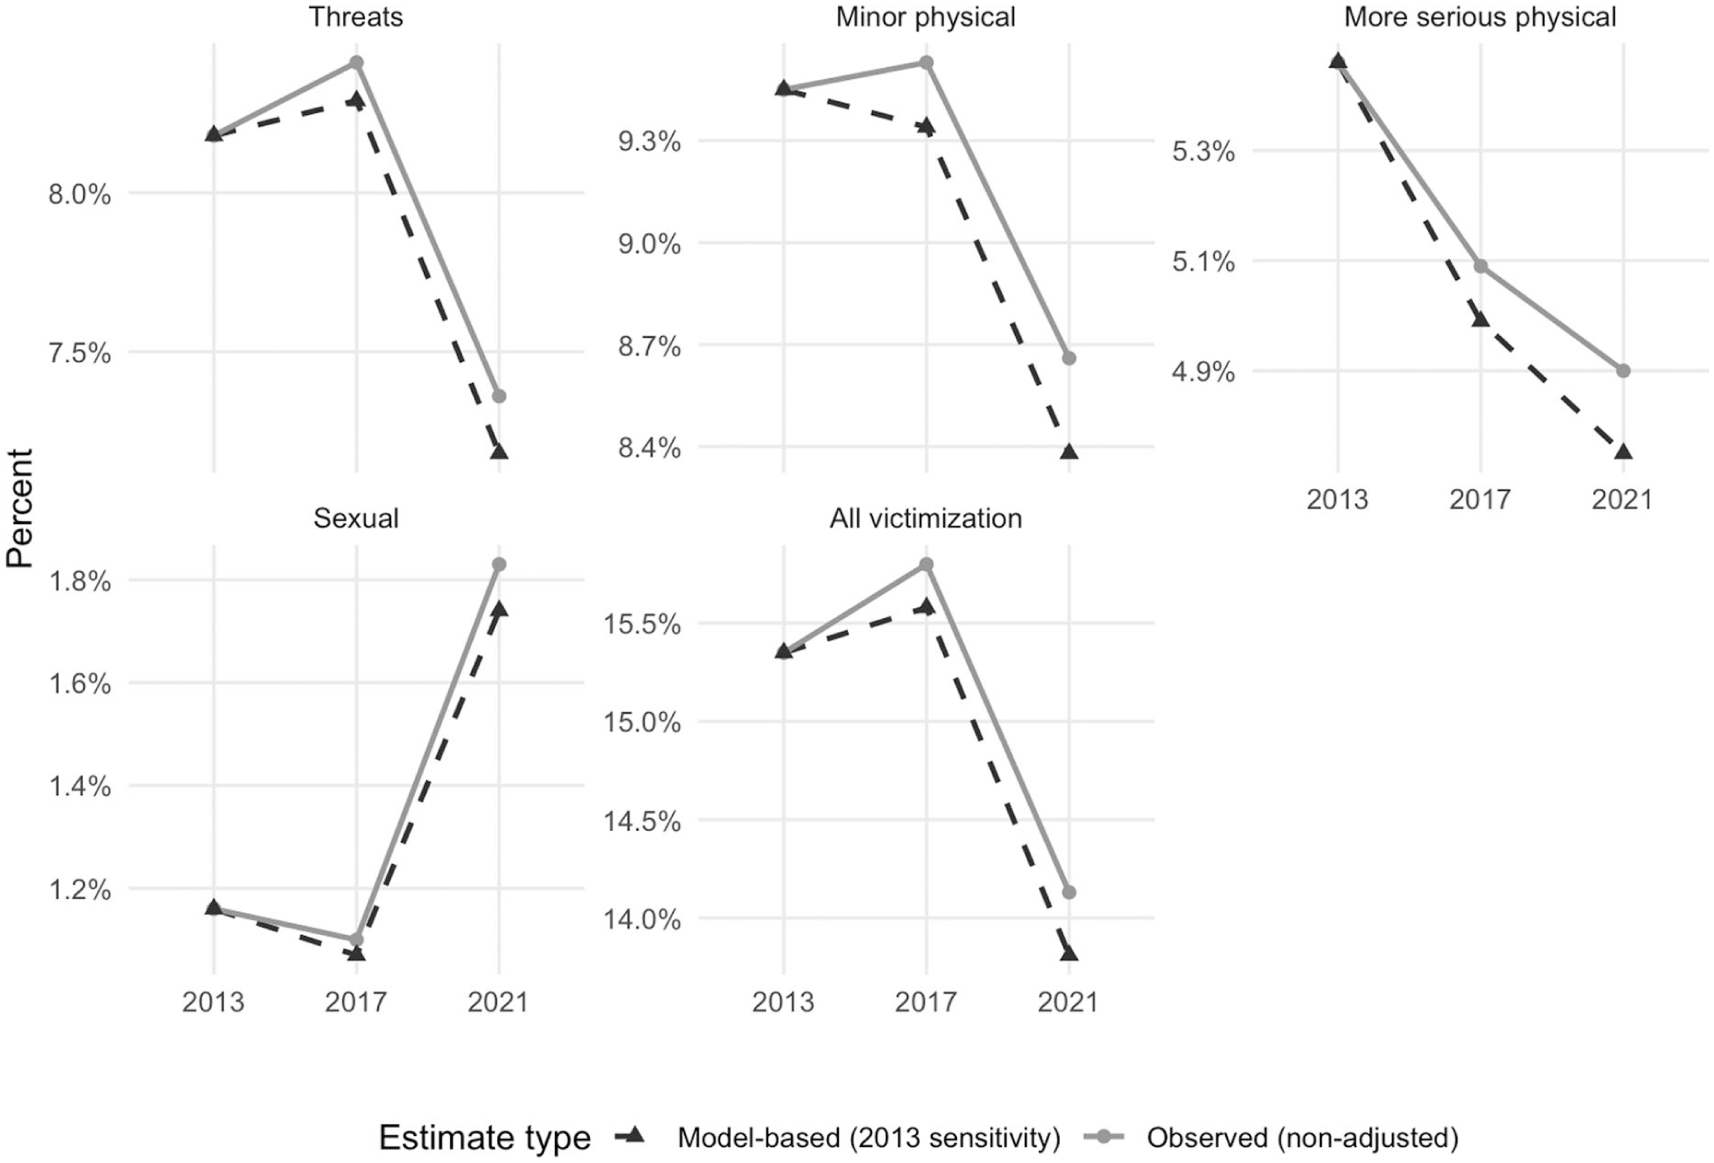
Observed prevalences and predicted probabilities of different victimization types (sensitivity measures held at their 2013 mean levels).
In the final part of the analysis, the KHB method was used to adequately assess whether adjusting for sensitivity significantly affects the association between survey year and reported victimization. Building on the earlier descriptive comparison of observed versus predicted probabilities, this analysis evaluates whether the sensitivity adjustment leads to substantial changes in the estimated association, also controlling for age and gender. Table 4 shows results from a KHB mediation analysis in which the four dimensions of sensitivity are treated as mediators. In practice, models adjusted and non-adjusted for sensitivity were compared to assess whether the adjustment significantly affects the association between survey year and victimization.
Mediation Analysis (KHB Method) With Logistic Regression Models; the Associations Between Survey Year (Reference Year: 2013) and Reporting Violent Victimization Adjusted and Non-Adjusted for Sensitivity to Violence. Associations Presented as Odds Ratios (ORs). Age and Gender Adjusted in All Models.
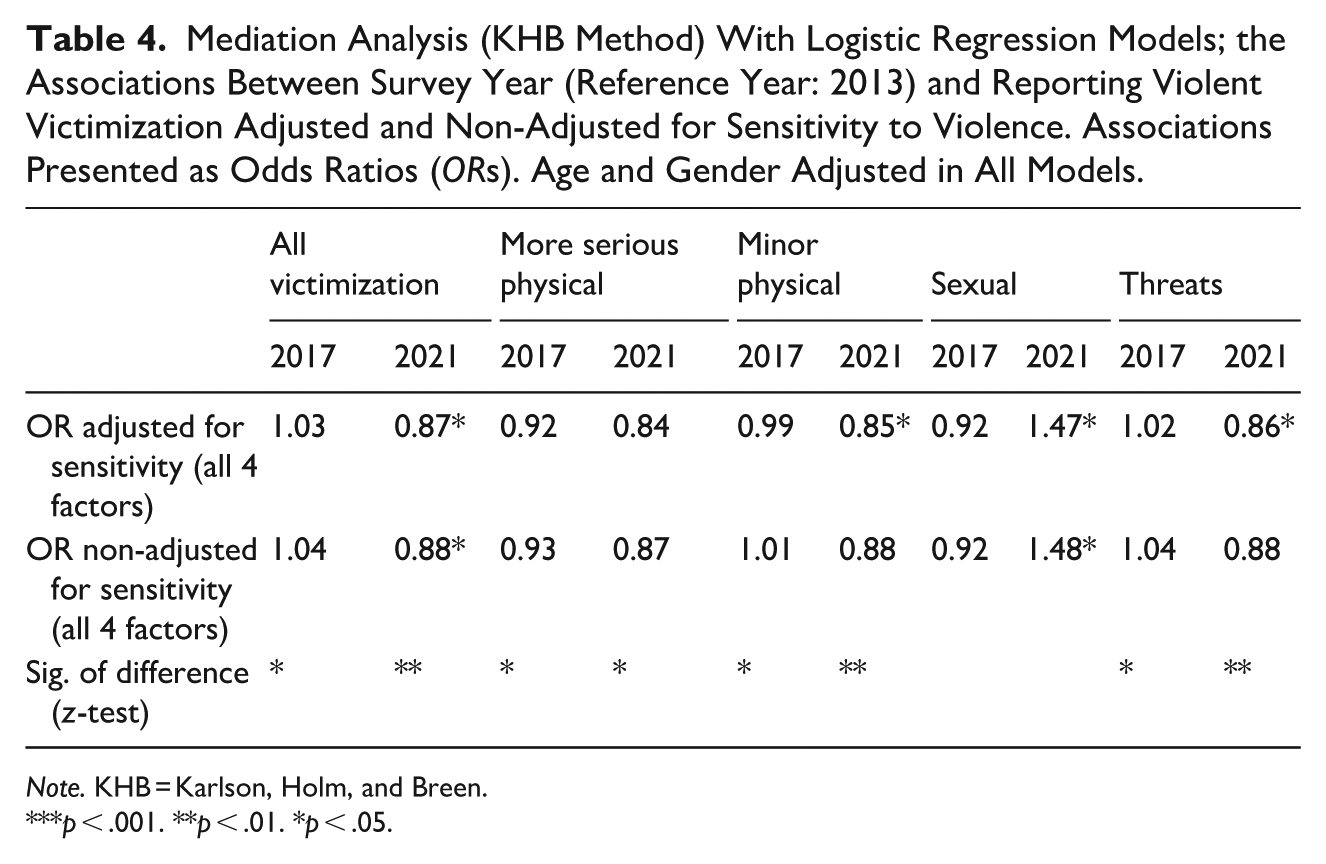
Note. KHB = Karlson, Holm, and Breen.
p < .001. **p < .01. *p < .05.
Overall, adjusting for the four factors of sensitivity to violence statistically significantly changes the associations between survey year and reported victimization for all victimization types with the exception of sexual violence. More specifically, the results suggest that for all victimization outcomes apart from sexual violence, adjusting for sensitivity to violence suppresses the association between measurement point and victimization, as demonstrated by smaller odds ratios (ORs) in adjusted versus non-adjusted models. As for changes between 2013 and 2017, neither adjusted nor non-adjusted models displayed statistically significant associations between survey year and victimization for any outcome (despite statistically significant differences between these associations). This is also true for more serious physical violence victimization between 2013 and 2021. However, for reporting minor physical violent victimization and threats, the results show that while associations between survey year and victimization are nonsignificant in the non-adjusted models, adjusting for sensitivity leads to statistically significant negative associations between survey year and the victimization outcome. For these outcomes, adjusting for sensitivity leads to a different interpretation of the (age- and gender-adjusted) change between 2013 and 2021, the non-adjusted model suggesting no change, and the sensitivity-adjusted model suggesting a statistically significant decrease in reporting victimization. As for the outcome measure comprising all violent victimization, both adjusted and non-adjusted models comparing 2013 and 2021 display statistically significant negative associations between survey year and victimization outcome. In this case, adjusting for sensitivity thus leads to results suggesting a (statistically significantly) steeper decline between 2013 and 2021 in reporting victimization.
Sensitivity Analyses
In order to assess the robustness of our results, we performed multiple sensitivity analyses to ensure that our main findings are not influenced by arbitrary technical or methodological choices. First, although our main KHB analysis controlled for age and gender, we also conducted the analysis without these covariates. Overall, the results were very similar and consistent with the age- and gender-adjusted findings. The only notable difference was that, when age and gender were not included, the statistical significance of the mediation for sexual violence increased slightly, surpassing the significance threshold (p < .05). Second, while our main analysis relies on data from three comparable surveys sweeps due to different sampling strategies implemented in various years, we also analyzed the full FNCS data to make sure that our main findings are not sensitive to the selected measurement points. Victimization trends as well as development of the composed sensitivity dimensions for the full FNCS data (2012–2021) are presented in Tables A3 and A4 in Appendix. This examination demonstrates that the measurement points of our main analysis do not diverge from the general trend observed in the full data. Additionally, we replicated the KHB analysis using the full data and treating year as a continuous variable. Results from this analysis, presented in Table A5 in Appendix, were mostly consistent with our main findings: Adjusting for sensitivity measures substantially altered the associations between year and reported victimization for both the “all victimization” outcome and threats. Similarly to the main findings, this effect was not observed for sexual violence. Additionally, unlike the main results, the mediation was also insignificant for more serious and minor physical violence. This can be seen as expected as the mediation was also relatively modest in the main analysis, and as year was treated as a continuous variable instead of a categorical variable as in the main analysis, such an approach would be likely to yield significant results only if there was a strong linear trend across years. Accordingly, the categorical treatment of year in the main analysis provides a more suitable modeling strategy. However, it is promising that even the alternative modeling strategy with the full data provides support for the notion that adjusting for sensitivity affects observed victimization trends.
Finally, although we were unable to disentangle causal associations and their direction due to our cross-sectional study design, we addressed the issue of possible “reverse causation,” that is, victimization affecting sensitivity to violence, by reformulating the KHB models in such a way that sensitivity to violence was used as the outcome variable and victimization measures as the “mediators.” The results from these models provided no support for the notion that associations between sensitivity and the measurement points would be significantly affected by changes in violent victimization measures as none of the models displayed statistically significant results in terms of the mediation—in other words, the associations between the sensitivity measures and the survey year do not depend on victimization measures.
Discussion
While victimization surveys have been developed for the purpose of measuring crime in a way that is not prone to biases related to reporting propensity, differing and changing levels of perceptual sensitivity to violence may pose a threat to the validity of survey-based measures. The present study assessed changes in the tendency to define conflict as violence across three measurement points of the FNCS. Moreover, the extent to which changes in sensitivity may affect the observed level of survey-reported violent victimization was also assessed. Our results suggest that there has been an increase in sensitivity to violence across 2013, 2017, and 2021 in all four dimensions of sensitivity (sensitivity to sexual violence, sensitivity to verbal and nonverbal threats, sensitivity to minor physical violence, and sensitivity to major physical violence). Notably, the results from the mediation analysis show that adjusting for sensitivity significantly affects the associations between survey year and various victimization outcomes. The results suggest that the observed increase in reporting sexual violence victimization is not attributable to changes in sensitivity as measured by the sensitivity scale. However, for other victimization types, the results provide tentative support for the notion that an increase in sensitivity to violence may have affected observed trends of reported victimization between the measurement points, adjusted for age and gender. In particular, the increase in sensitivity may have suppressed an actual decrease in reporting victimization. These findings are partially consistent with Kivivuori’s (2014) camouflage hypothesis: Cultural phenomena can hide a decrease in crime, but this affects different types of violence differentially.
As for the question of the extent to which the present results point toward considerable validity threats in survey measures of victimization due to an increase in sensitivity, one way of providing answers is to compare interpretations of victimization trends from sensitivity-adjusted and non-adjusted models of the mediation analysis. Importantly, adjusting for sensitivity changes the association between survey year and reporting minor physical violence and threats (from nonsignificant to significant) when the years 2013 and 2021 are compared. In other words, controlling for sensitivity seems to reveal a statistically significant decline in reported victimization (adjusted for age and gender) not visible when the increase in sensitivity is not adjusted for. It could be argued that due to different conclusions drawn from the sensitivity-adjusted and non-adjusted models, changes in sensitivity do indeed pose a true validity threat in tracking crime trends using survey measures of violence. Our findings regarding a potential validity issue are particularly noteworthy due to the relatively short time frame of the present study. If changes in the level of sensitivity could significantly affect the observed trend of reported violent victimization within an eight-year period, what are the implications for comparing survey-reported victimization in a much longer time frame? It would be beneficial to examine and follow up on the role of sensitivity in a time frame that expands beyond one decade, as well as systematically including sensitivity items as part of victimization survey studies.
Overall, the results of this study clearly demonstrate that accounting for sensitivity is likely to be a critical aspect to consider when planning and designing the means to adequately measure self-reported victimization. However, the association between sensitivity and reporting propensity is complex, and, based on the results, further development of the sensitivity scale is needed. The complexity of measuring sensitivity is demonstrated by our results concerning sexual violence reporting not being subject to changes in sensitivity, which contrasts with a previous study that used indirect measures of changes in sensitivity and reported opposite results (Hagerlid & Löfgren, 2024). Clearly, the findings are inherently influenced by the methodological approach used to measure sensitivity.
Limitations
While the present study presents novel findings of considerable methodological significance for criminological and criminal justice research, there are several limitations that need to be addressed. Importantly, the present data are cross-sectional in nature, and thus, the results are insufficient for the purpose of establishing a causal relationship between sensitivity to violence and reporting violence in a survey. Other research designs, such as quasi-experimental approaches, are necessary to investigate whether sensitivity to violence affects reporting propensity, as suggested by existing experimental research (Levari et al., 2018). Similarly, our research does not provide any empirically assessed explanation of why the level of sensitivity to violence has increased across the survey sweeps. While this could be indicative of a broader population-level trend, it is also possible that the increase reflects other differences between the survey samples that could be related to a decline in the response rate. However, it could be argued that the findings on the relevance of accounting for sensitivity are equally important regardless of the source of the changes in the level of sensitivity.
Due to the introductory nature of our analysis, we only controlled for the effect of the most basic background characteristics, that is, gender and age. It is noteworthy that controlling for these known correlates of sensitivity (Kivivuori, 2014) did not substantially alter the main findings (see “Sensitivity Analyses”). This suggests that our results are relatively robust with regard to unobserved confounding by comparable background characteristics, provided that their distributions do not differ markedly between the compared samples. Nevertheless, future research should empirically identify reliable correlates of sensitivity and examine their influence when comparing victimization levels across samples.
Finally, the sensitivity scale used in the present study is not a validated measure of sensitivity to violence, as validated measures are yet to be established—this reflects the current scarcity of research in this domain. While the present results do point out some limitations of the FNCS sensitivity scale, they more importantly offer valuable insights that can inform the application, refinement, and future development of sensitivity measures.
Future Research and Development of Sensitivity Measures
The issue of differing levels of sensitivity as a potential threat to the validity of survey-based measures of violence has been largely overlooked in criminological methodological work. Consequently, there are numerous potentially fruitful avenues for future research to expand on this issue. Most basically, correlates of sensitivity to violence, such as socioeconomic measures, area of residence, and cultural background, should be examined in detail and across varying samples to understand the full ramifications of differing levels of sensitivity for measuring violence. Moreover, it is plausible that complex and multidirectional interdependencies exist among sensitivity, reporting propensity, and victimization that are beyond the scope of the present study but should be explored in future research. In particular, certain background characteristics, such as level of education, may be positively associated with sensitivity to violence—and consequently with reporting violence in surveys—but negatively associated with a hypothetically objective measure of violent victimization. Future research should aim to rigorously disentangle these potential effects to develop more valid means of measuring violence.
Lynch and Addington (2015) earlier suggested that cultural sensitivity should be probed in a specialized survey. Our study used a survey to study temporal shifts in sensitivity. The price of including the instrument in the questionnaire was that it had to be short. Thus, there remains a need for a specialized cultural expansion study. The instrument itself should be validated and further developed. Possibly the scale should focus more on the least serious items that typically yield the highest variation in responses. That said, our finding on differential sensitivity impacts justifies the inclusion of items capturing different types of offense. In the future, the role of cohort, age, and period effects should be addressed in sensitivity analyses. Sensitivity measures should also be tested on a range of samples, including criminally active people such as prisoners and other marginal populations that are difficult to reach in community surveys.
The present findings indicate that cultural sensitivity to violence has risen in Finland, a Nordic welfare state with high levels of safety and security. Since the primary aim of this study was methodological (impact on surveys as measures of crime), we did not seek to explain why sensitivity appears to have increased over the last decade. While long-term historical interpretations refer to increasing affluence and security as drivers of sensitivity (von Hofer, 2000), we admit that this kind of economic-materialist explanation is difficult to apply to a single decade in Finland. The Durkheimian explanation of a drop in crime may also be strained: In our observation period, homicide rates decreased, assault offenses remained stable, and sexual offenses increased (Kivivuori et al., 2023). We cannot ascertain whether the detected sensitivity effect is sufficient to “camouflage” a real drop in crime. Possibly cultural trends should not be reduced to material bases; perhaps they are autonomous or reflect unique events such as the MeToo movement, or the European refugee crisis of 2015, sometimes linked to perceived or real threats of sexual and other violence (Feltes et al., 2018).
Cultural explanations could partially explain the “Nordic paradox,” for example, the observation that the Nordic countries have the highest gender equality and highest victim-reported intimate partner violence rates in European surveys (Gracia & Merlo, 2016). In the future, studies could address whether specific legal reforms have been preceded or followed by changes in sensitivity to examine the direction of causality between reforms and popular sentiment. Furthermore, future research on cultural sensitivity should go beyond the confines of Nordic and European studies to test the universality of any findings on cultural sensitivity. Most research has been undertaken in the highly developed societies of the West: in the United States, in the Nordic countries, and in Western Europe. It is therefore of some interest that the International Self-Report Delinquency Study has incorporated a measure of cultural perception sensitivity in its fourth sweep (Marshall et al., 2022). Using that dataset, it would be possible to ascertain whether cultural sensitivity is a relevant variable in global cross-comparative research.
Footnotes
Appendix
Mediation Analysis (KHB Method) With Logistic Regression Models; the Associations Between Survey Year (2012–2021) and Reporting Violent Victimization Adjusted and Non-Adjusted for Sensitivity to Violence. Associations Presented as Odds Ratios (ORs). Age and Gender Adjusted in All Models; N = 54,936.

| All victimization | More serious physical | Minor physical | Sexual | Threats | |
|---|---|---|---|---|---|
| OR adjusted for sensitivity (all 4 factors) | 0.989* | 0.964*** | 0.999 | 1.001 | 0.972*** |
| OR non-adjusted for sensitivity (all 4 factors) | 0.991* | 0.965*** | 1.000 | 1.003 | 0.974*** |
| Sig. of difference (z-test) | ** | ** |
Note. KHB = Karlson, Holm, and Breen.
p < .001. **p < .01. *p < .05.
Ethical Considerations
According to Finnish law and the ethical guidelines of the Finnish National Board on Research Integrity (Finnish National Board on Research Integrity TENK, 2019), research of this type does not require approval from an official research ethics committee.
Consent to Participate
Participant provided informed consent by voluntarily completing the survey.
Funding
The authors disclosed receipt of the following financial support for the research and/or authorship of this article: This research was partially funded by the Strategic Research Council (SRC) established within the Research Council of Finland, grant numbers 352600 and 352601.
Declaration of Conflicting Interests
The authors declared no potential conflicts of interests with respect to the authorship and/or publication of this article.