
Abstract
Does the social work labor force reflect the field’s commitment to social and economic justice? Using individual-level census data for 1980–2014 on self-identified social workers and on other college graduates in college-majority occupations, this article finds three key patterns. First, representation of women, blacks, and Latinx in social work is high and growing, greatly exceeding that in most of these other occupations. Second, white men continue to earn more than comparable women, blacks, and Latinx, but gender/racial/ethnic pay disparities in social work have dropped by half or more since 1980 and are far smaller than in most other occupations. Third, social workers earn substantially less than comparable employees in other occupations, and the pay disadvantage is growing. That low pay, however, may contribute to both the diversity and relative pay equity in social work.
Keywords
Given its strong commitment to social and economic justice, social work prioritizes diversity and pay equity in its own workforce (Mallinger, Starks, & Tarter, 2017). The profession excels in its representation of women, blacks, and Latinx (Gibelman & Schervish, 1993; Schilling, Morrish, & Liu, 2008), but its success in achieving pay equity is less clear. Social work is a “female-dominated profession” only in the sense that women are the numerical majority, not that they wield disproportionate power (McPhail, 2004). Women earn less than their male colleagues, with or without controlling for differences in qualifications (Lane & Flowers, 2015). Several authors echo Williams (1992) in arguing that men in social work, far from facing a “glass ceiling,” ride a “glass elevator” toward the top (Mallinger et al., 2017; McPhail, 2004), reaching managerial positions sooner than comparable women (Gibelman & Schervish, 1993). Less research examines racial differences in pay and career success.
One explanation for the diversity of social workers may be low pay in the profession (Barth, 2003; Ozawa & Law, 1993). Social work topped CNN Money’s list of “Stressful Jobs that Pay Badly” (Schweitzer, Chianello, & Kothari, 2013, p. 147). Low pay may result from both social workers’ willingness to accept low pay in order to perform good work and employers’ ability to hire people without specific credentials or training to fill social work positions (Barth, 2003). Low pay makes it more difficult for social work to attract groups that earn high salaries in other occupations—especially white and Asian men—which may increase representation of women, blacks, and Latinx. Low pay may also encourage pay equity, as people who enter the field may value economic rewards less and pay equity more (Leete, 2000).
Understanding diversity, pay equity, and pay levels in social work requires not merely comparing social work patterns to an ideal but also seeing whether the profession is making progress toward the ideal and whether it is succeeding more than other occupations. Most of the research on diversity and pay equity in social work relies on data sources that make this impractical. Using individual-level census data for 1980–2014 allows both analysis of trends in social work and comparison to other professions.
The article begins with a brief review of research on workforce diversity, pay disparities, and pay levels in social work and other occupations. It then describes the strengths and weaknesses of the census data, including a markedly different definition of social workers. The findings section reveals good and bad news. The percentage of social workers who are women, blacks, and Latinx is rising and is much higher than in other professions. Pay disparities are shrinking and are smaller than in most professions. Social work pays poorly, however, and pay is falling relative to other professions. This may increase diversity and advance pay equity, however. The conclusion discusses possible steps forward.
Literature Review
Diversity
Women have always made up a majority of U.S. social workers (Gibelman & Schervish, 1997; McPhail, 2004). Jane Addams and Mary Richmond are widely credited with founding the profession, and “the idea that the ‘nurturing’ capacity of women naturally fits the ‘nurturing’ function of social work” is long-standing (quoted in McPhail, 2004, p. 323; Meyer, 1982). Citing Gilligan (1982) and Chodorow (1978), Freedberg (1993, p. 535) suggests that both “a ‘feminine’ ethic of care (…. [a] longing for connectedness…that underlies the moral development of women)” and women’s socialization into nurturing roles help explain why most social workers are women.
Most research finds that representation of women and people of color in social work is high and growing. Schilling, Morrish, and Liu (2008) report, for instance, that the female percentage of master of social work [MSW] graduates rose from 58% in 1953 to 85% in 2000 and that the percentage who are people of color grew from 22% in 1974 to 26% in 2000. Still, as Whitaker, Weismiller, and Clark (2006, p. 17) note, “Social workers…are less diverse than the civilian labor force and the population they serve.”
Other occupations are clearly diversifying as well. The female percentage of the civilian labor force has grown from 42% to 47% since 1980, after a rapid rise after World War II, when only 29% of the labor force were women (U.S. Department of Labor, 2017); women’s educational gains suggest that they are a more rapidly rising percentage of the college-educated workforce. Immigration has caused growth in the Latinx and Asian percentages of the workforce, with a more rapid rise among the college-educated workforce for Asians.
Some of the overrepresentation of women, blacks, and Latinx could potentially be due to differences in educational attainment, age, and location, but the history and mission of the field suggest the following hypotheses:
Pay Disparities
Lane and Flowers (2015) review dozens of studies since the 1960s and only find one where female social workers earn more than men, with or without controlling for education, experience, and race/ethnicity. Fewer studies examine racial and ethnic pay differences; a National Association of Social Workers (2007) report on pay in the profession, for instance, highlights gender but not race. The studies are not comparable enough to trace trends over time, but in the general economy, women’s average pay has risen relative to men’s and blacks’ relative to whites’, though the gains have slowed or even reversed in recent years. Blau and Kahn (2016) report that women’s average pay rose from 62% of men’s in 1980 to 79% in 2010 and that, from 1980 to 1990, women’s earnings rose from 71% to 82% of men’s after adjusting for individual differences (e.g., age and education) and from 79% to 92% after also adjusting for occupation and industry; neither ratio rose between 1990 and 2010, however (also see Goldin, 2014). Black–white pay differences narrowed until about 1980 but have stabilized or widened since (Cancio, Evans, & Maume Jr, 1996; Thomas, 1993). Sizes and trends in racial and ethnic pay differences also vary by gender (Browne & Askew, 2005; Mandel & Semyonov, 2016).
Barth (2003) finds that the male–female pay difference is smaller in social work than in other occupations. Gender pay disparities also tend to be smaller than average in most female-majority occupations, both in the general economy (England & Herbert, 1993; England, Herbert, Kilbourne, Reid, & Megdal, 1994) and in the nonprofit sector (Faulk, Edwards, Lewis, & McGinnis, 2013). Leete (2000) argues further that nonprofit organizations have smaller pay disparities because they attract more altruistically motivated employees who value pay equity more highly. Smaller gender and race pay disparities also make occupations and workplaces more attractive to women, blacks, and Latinx (e.g., Llorens, Wenger, & Kellough, 2008).
This leads to the following hypotheses:
Pay Levels
Social work has long had a reputation for poor pay. Ozawa and Law (1993) find that lifetime earnings were far lower for social workers than doctors and lawyers, as well as lower than for nurses and teachers. Barth (2003, p. 11) finds that social workers earned 11% less in 1999 than people of the same race, sex, age, and education working in other occupations. Ng (2010, p. 352) reports that the median monthly wage of social workers in 2007 was 20% lower than for all professionals and 31% lower than for registered nurses.
Low pay is, of course, quite common in primarily female occupations (e.g., England, 1982; Macpherson & Hirsch, 1995; Reskin, 1988). Low pay in “women’s work” may result from overcrowding (Bergmann, 1974; Sorensen, 1990) as well as from social construction of women’s skills as being of lower value than men’s skills (Hochschild, 1979; Steinberg, 1990). Occupational segregation by sex declined in the 1970s and 1980s, but convergence has slowed since the 1990s, and the impact of the gender composition of occupations on pay may be growing (Blau & Kahn, 2016; Goldin, 2014; Mandel, 2013; Mandel & Semyonov, 2014).
Barth (2003) suggests that social workers have such a strong desire to do this important job that they are willing to accept large pay penalties. His conclusions echo the donative labor hypothesis (Hansmann, 1980; Preston, 1989; Rose-Ackerman, 1996), which argues that nonprofit workers accept below-market wages as a way of donating labor to nonprofits, and the public service motivation literature (e.g., Perry & Wise, 1990; Ritz, Brewer, & Neumann, 2013), which argues that government workers prioritize public service over pay. Economists, however, present conflicting evidence on whether nonprofit employees really earn less than they would in the for-profit sector (Leete, 2001; Ruhm & Borkoski, 2003), and an extensive literature stretching back to Smith (1977) finds that federal employees actually earn more than comparable private sector workers. Although no economists since Barth (2003) have tested the perception that social workers are underpaid, several studies do cast doubt on whether social workers willingly accept low pay: The research indicates that “one of the strongest predictors of turnover is worker dissatisfaction with compensation” (Scannapieco & Connell-Carrick, 2007, p. 33; see also Schweitzer et al., 2013; Wermeling, 2013).
The research suggests the following hypotheses:
Data and Method
This analysis uses the 5% Public Use Microdata Samples of the 1980, 1990, and 2000 census and the 2005–2014 American Community Surveys (ACS). (The annual ACS largely replaces the long form of the census.) Census data provide detailed demographic and employment information on huge random samples of the American population. Even after restricting the sample to college graduates aged 21–65, working full-time, full-year in college-majority occupations (explained below), the sample includes 2.7 million employees (see Table 1 for specific sample sizes).
Gender and Racial/Ethnic Composition of Occupations.
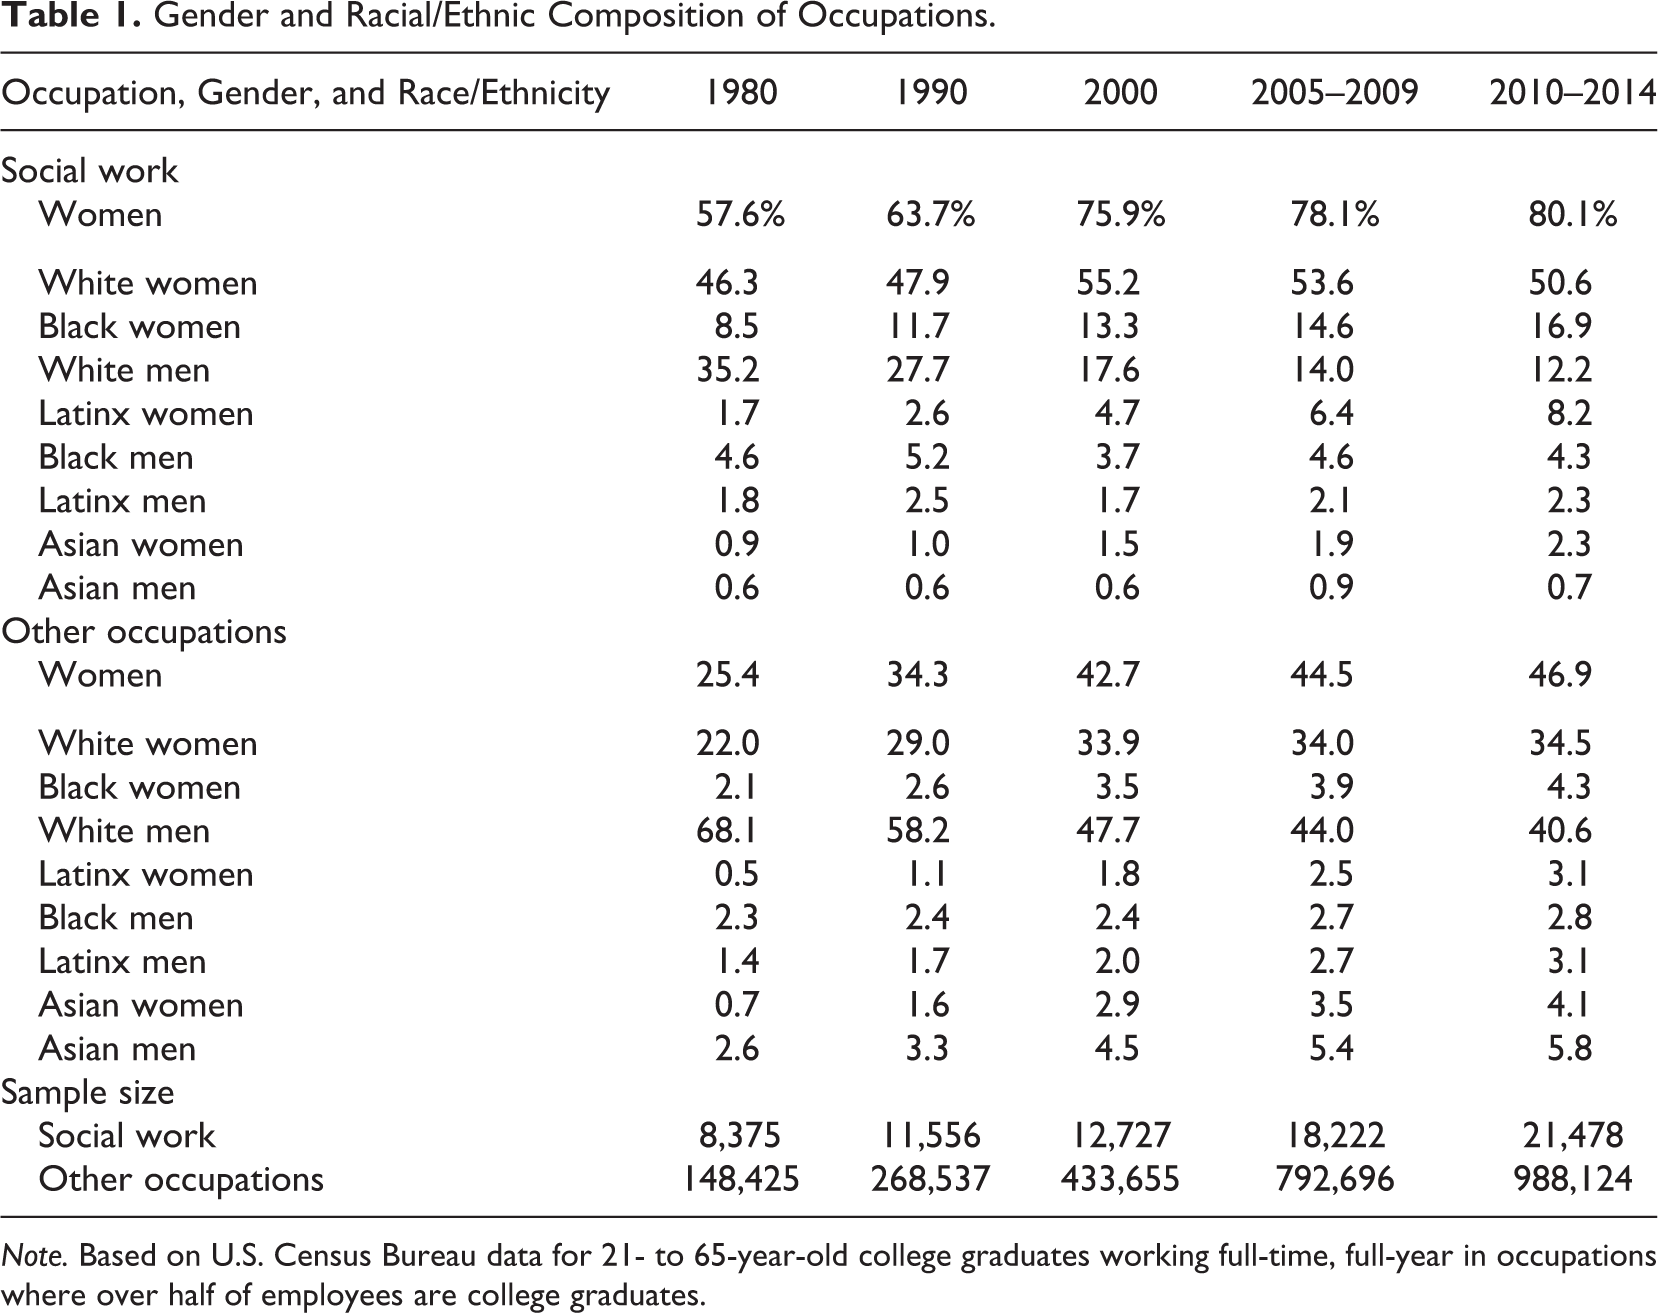
Note. Based on U.S. Census Bureau data for 21- to 65-year-old college graduates working full-time, full-year in occupations where over half of employees are college graduates.
The key independent variable is self-reported occupation. The census definition differs from most previous research on social workers, which only looks at social workers with specific educational credentials; one quarter of self-identified social workers in the census data do not have bachelor’s degrees, and only one fifth majored in social work. Nonetheless, Barth (2003) includes all self-identified social workers in his analysis of the 1999 Current Population Survey and argues for the validity of that choice, based on social work’s fuzzy boundaries and employers’ ability to ignore specific credentials in filling most social work positions. This study takes an intermediate position, restricting the sample to college graduates (though analysis of all self-identified social workers yields similar findings).
Only two previous studies of pay disparities explicitly compare social workers to other occupations. Ozawa and Law (1993) compare them to four other professions (medicine, law, teaching, and nursing), and Barth (2003) compares them to all other occupations. This study takes a midway position, comparing social workers to other college graduates working in occupations where most employees are college graduates (though dropping seven highly paid occupations that require professional degrees [e.g., doctors and lawyers]). These 70–79 college-majority occupations have an expectation, or at least aspiration, that employees will have college educations, which makes them a reasonable comparison group. Most are not direct competitors—few people debate whether to choose an engineering or a social work career—but leaving out male-dominated occupations would seriously bias findings about diversity, pay equity, and pay. The analytical sample only includes college graduates, but analysis of all employees in college-majority occupations yields similar findings.
Diversity
The analysis divides the sample into eight groups by gender and race/ethnicity (white, black, Latinx, and Asian American men and women; anyone identified as Latinx is coded as not belonging to the other groups). The test of Hypothesis 1 tracks the percentage of social workers who belonged to each group in 1980, 1990, 2000, 2005–2009, and 2010–2014 to determine whether representation of women, blacks, and Latinx grew. The test of Hypothesis 2 tracks the same percentages for other college-majority occupations as a group and compares them to social workers. A second test computes the percentages for each college-majority occupation individually, to determine how many had higher representation of women, blacks, and Latinx.
The test of Hypothesis 3 uses a logit analysis to predict which employees are social workers. The dependent variable is coded 1 for social workers and 0 for everyone else. The key independent variables are seven dummies for gender/race/ethnicity, with white men as the reference group. The control variables are education, age, and state of employment. As there is no reason to expect those variables to have a linear impact on being a social worker, the logit models uses three dummy variables for education, 44 dummy variables for age, and 50 dummy variables for state of employment. Table 2 reports gender/race/ethnicity differences in the probability of being a social worker, relative to white men of the same age and educational level working in the same state. Reported percentages are average partial effects, calculated using the margins command in Stata (version 15). If Hypothesis 3 is correct, white women and black and Latinx men and women should be more likely to be social workers than comparable white men.
Differences in Probabilities of Being Social Workers Among Comparable Employees.
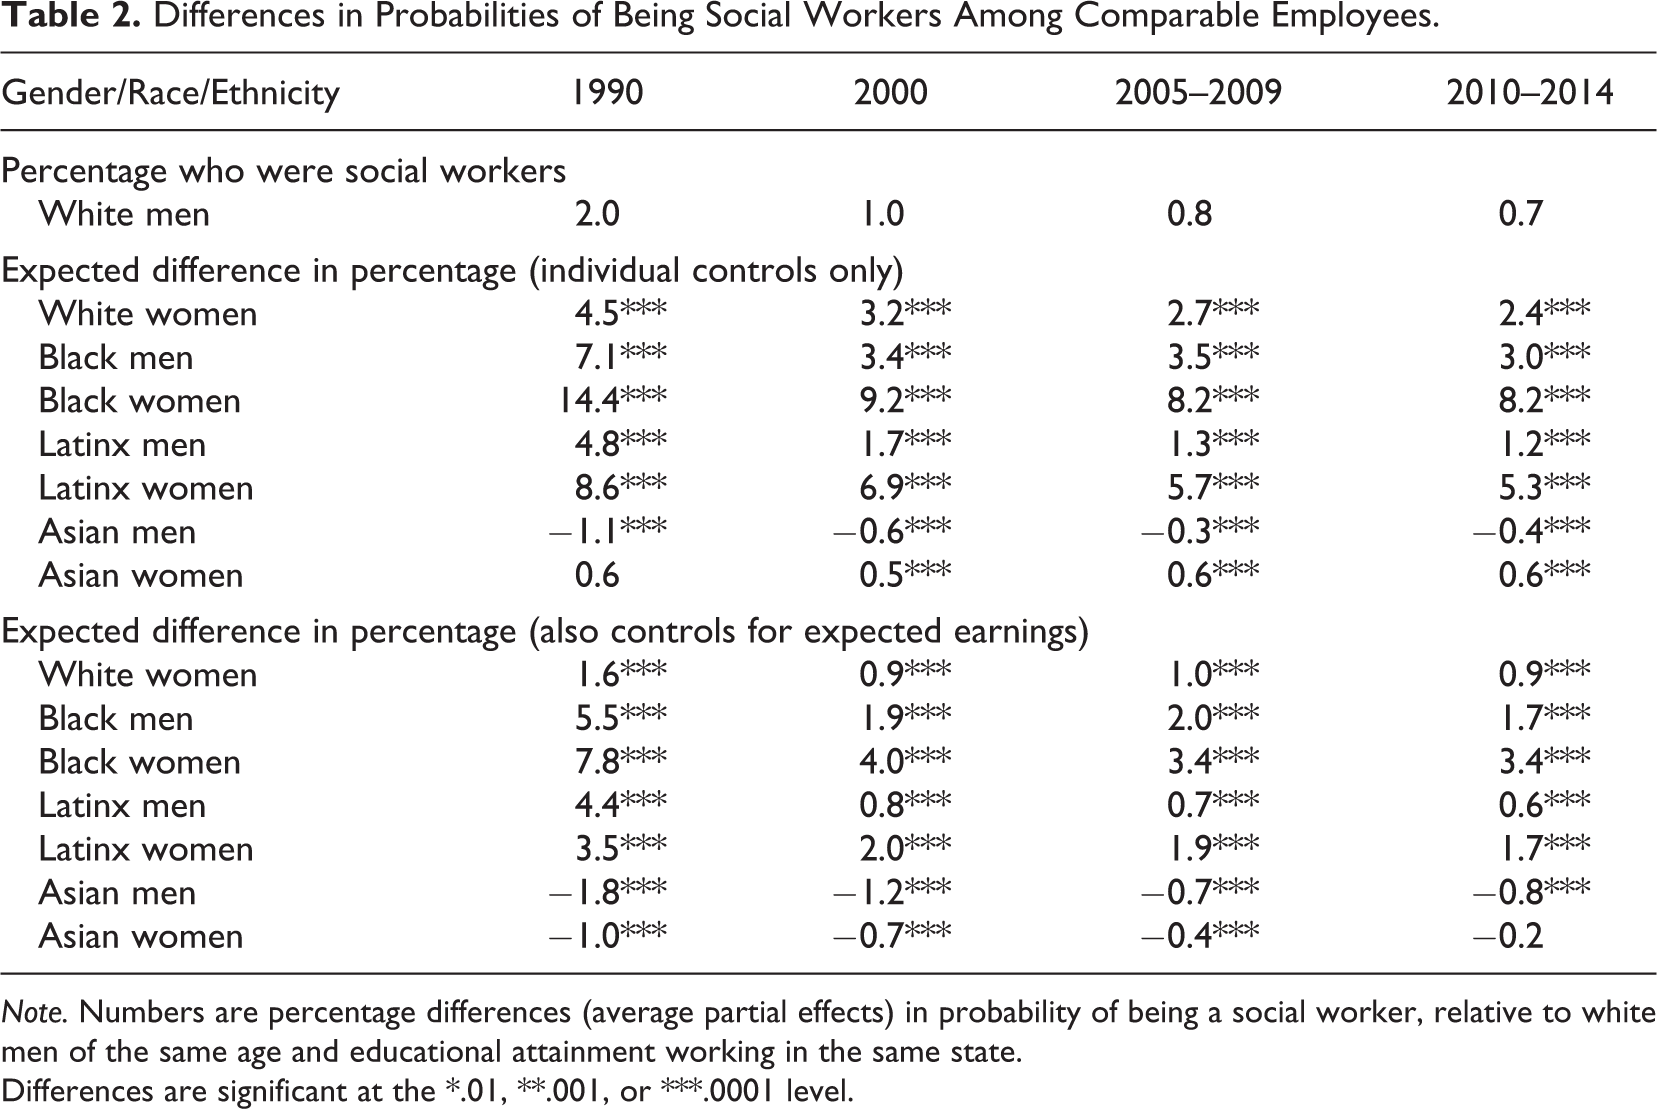
Note. Numbers are percentage differences (average partial effects) in probability of being a social worker, relative to white men of the same age and educational attainment working in the same state.
Differences are significant at the *.01, **.001, or ***.0001 level.
Pay Disparities
The test of Hypothesis 4 calculates gender/racial/ethnic pay differences for comparable social workers. The dependent variable in the regression analysis is the natural logarithm of annual earnings for the previous year. (This coding assumes that the independent variables have constant percentage, rather than constant dollar, impacts on earnings [e.g., that white women are expected to earn 12% less, rather than US$8,000 less, than comparable white men].) The key independent variables are seven dummy variables distinguishing white women and black, Latinx, and Asian men and women from white men (the reference group).
To make the groups comparable, the regression models control for education, age (as a proxy for work experience), state of employment (to capture differences in labor markets and cost of living), and hours worked in a typical week (as a measure of work effort), all of which legitimately influence earnings. The analyses that combine 5 years of ACS data also control for year. To make the fewest assumptions about how each variable impacts earnings and to minimize the chance of biasing estimates of gender/racial/ethnic effects through model misspecification, all independent variables enter the regressions as sets of dummy variables (3 for education, 44 for age, 50 for state, and 64 for hours worked). The gender/race/ethnicity coefficients are converted into percentage differences in expected earnings, relative to white men (by exponentiating the coefficients, subtracting 1, and multiplying times 100). If Hypothesis 4 is correct, those percentage differences will shrink over time.
Testing Hypothesis 5 requires many regression analyses. The first set combines college graduates working in all college-majority occupations other than social work. The models are exactly the same as those for Hypothesis 4. If Hypothesis 5 is correct, expected percentage pay differences relative to white men will be larger for all groups (except perhaps Asians) in these occupations than in social work. The second set of regressions is run separately for each college-majority occupation with at least 1,000 observations. (Smaller samples had too few observations for smaller groups, and the 1980 sample was too small to run this analysis for that year.) The size of the expected pay gap in each occupation is ranked for each gender/race/ethnicity group in each time period. If Hypothesis 5 is correct, social work will have some of the smallest pay disparities.
Pay Levels
The test for Hypothesis 6, that social workers earn less than comparable employees in other occupations, runs regression analyses twice on the full sample for each year. In both, the dependent variable is the natural logarithm of annual earnings. In the first regression, the key independent variable is a dummy coded 1 for social workers and 0 for everyone else; in the second, it is a set of dummy variables for each occupation, with social work as the reference group. All models control for education, age, gender/race/ethnicity, state, and hours worked. Table 4 reports the social work coefficients in the first set of regressions, converted into percentage differences in expected pay, relative to comparable employees in the other college-majority occupations. If Hypothesis 6 is correct, the differences will all be negative. The second set of regressions will reveal how many occupations have higher expected pay.
These regressions implicitly assume that being a social worker has the same percentage impact on expected pay for each gender/race/ethnicity. A natural consequence of pay disparities being smaller in social work than in other occupations (Hypothesis 4), however, is that the expected pay disadvantage from choosing to be a social worker is smaller for women and for black and Latinx men than for white men (Hypothesis 7). The test runs the first set of regressions separately for each gender/race/ethnicity. If Hypothesis 7 is correct, the expected pay difference between social workers and those in other college-majority occupations will be smaller for women and for black and Latinx men than for white men.
The test for Hypothesis 8 begins by generating expected earnings for each person as a social worker and as an employee in other college-majority occupations. Separate regressions for social workers and other occupations for each gender/race/ethnicity (a total of 16 regressions per time period) allow the impact of age, education, location, and hours to vary by occupation and gender/race/ethnicity. Each person’s expected earnings from the two regressions become extra independent variables in the logit models for whether one becomes a social worker (reported in Table 2). Higher expected pay in social work should increase one’s probability of choosing that profession, and higher expected pay in other college-majority occupations should decrease it. If Hypothesis 8 is correct, controlling for expected pay should shrink the impact of being female, black, or Latinx on the probability of being a social worker.
Findings
Diversity
Social workers are increasingly and disproportionately female, black, and Latinx, consistent with Hypothesis 1. In 2010–2014, 80% of social workers were women, up from 58% in 1980 (Table 1). The white percentage dropped from 81% to 63%, while the black percentage rose from 13% to 21% and both the Latinx and Asian percentages doubled. In 2010–2014, half of social workers were white women, down somewhat from a peak of 55% in 2000. Black women were the second largest group (17%, double their share in 1980). White men were still the third largest group, but their share of social work jobs had dropped by two thirds, while Latinx women’s share has nearly quintupled and Asian women’s more than doubled. Latinx and black men’s representation has been relatively stable.
Representation of women is much higher in social work than in most college-majority occupations, consistent with Hypothesis 2. Only 47% of the employees in these other occupations were women in 2010–2014, compared to 80% in social work. Social work had the 8th highest percentage of female employees among the college-majority occupations in 1980, the 10th highest in 1990, and the 7th highest in 2000, in 2005–2009, and in 2010–2014.
Representation of blacks and Latinx is also much higher in social work than in most college-majority occupations. Blacks make up roughly 3 times as high a percentage of employees in social work as in the other occupations in all five periods. Compared to other college-majority occupations individually, social work had the very highest percentage who were black in three of the five periods and second or third highest in the other two. Representation of Latinx is about two thirds higher in social work than in other college-majority occupations in all five periods (e.g., 10.4% vs. 6.2% in 2010–2014). Social work also ranks first through third in the Latinx percentage of employees in all five periods.
In contrast, 78% of employees in the other college-majority occupations are white, about 10 percentage points higher than in social work. Social work was the least white college-majority occupation in 1980 and between the second- and fourth-least white occupation in the other periods. Asian representation in social work, however, is less than one third their representation in other college-majority occupations in recent years. Social work typically ranks among the bottom 20 college-majority occupations in representation of Asians.
Women, blacks, and Latinx remain more likely than white men to be social workers after controlling for age, education, and location, consistent with Hypothesis 3 (Table 2). In 1980, for instance, 2.0% of the white male college graduates in college-majority occupations were social workers. White women were 4.5 percentage points more likely than comparable white men to be social workers. Gaps were a little larger for Latinx and black men and even larger for Latinx and black women. Over time, the percentage of white men who were social workers dropped by over half, and the gender/racial/ethnic gaps all dropped substantially—but white women and black and Latinx men and women all remained more than twice as likely as comparable white men to be social workers in 2010–2014. Gaps were much smaller for Asian women, and Asian men were less likely than comparable white men to be social workers.
Pay Disparities
Female, black, and Latinx social workers earn less than white male social workers of the same age and educational attainment, working the same number of hours in the same state (Table 3). In 2010–2014, the expected pay differences were between 3% and 6%. Consistent with Hypothesis 4, however, all these pay disparities are markedly lower than in previous years. The gains are most impressive for white and Latinx women (both of whom have seen their pay gaps drop by more than two thirds since 1980) and for Asian women, whose expected earnings were one fifth lower than comparable white men’s in 1980 but equal in 2010–2014. Expected pay gaps for black men and women and for Latinx men have also dropped by half since 1980, though the patterns over time are more erratic.
Expected Pay Differences Relative to Comparable White Men in Social Work and Other College-Majority Occupations.
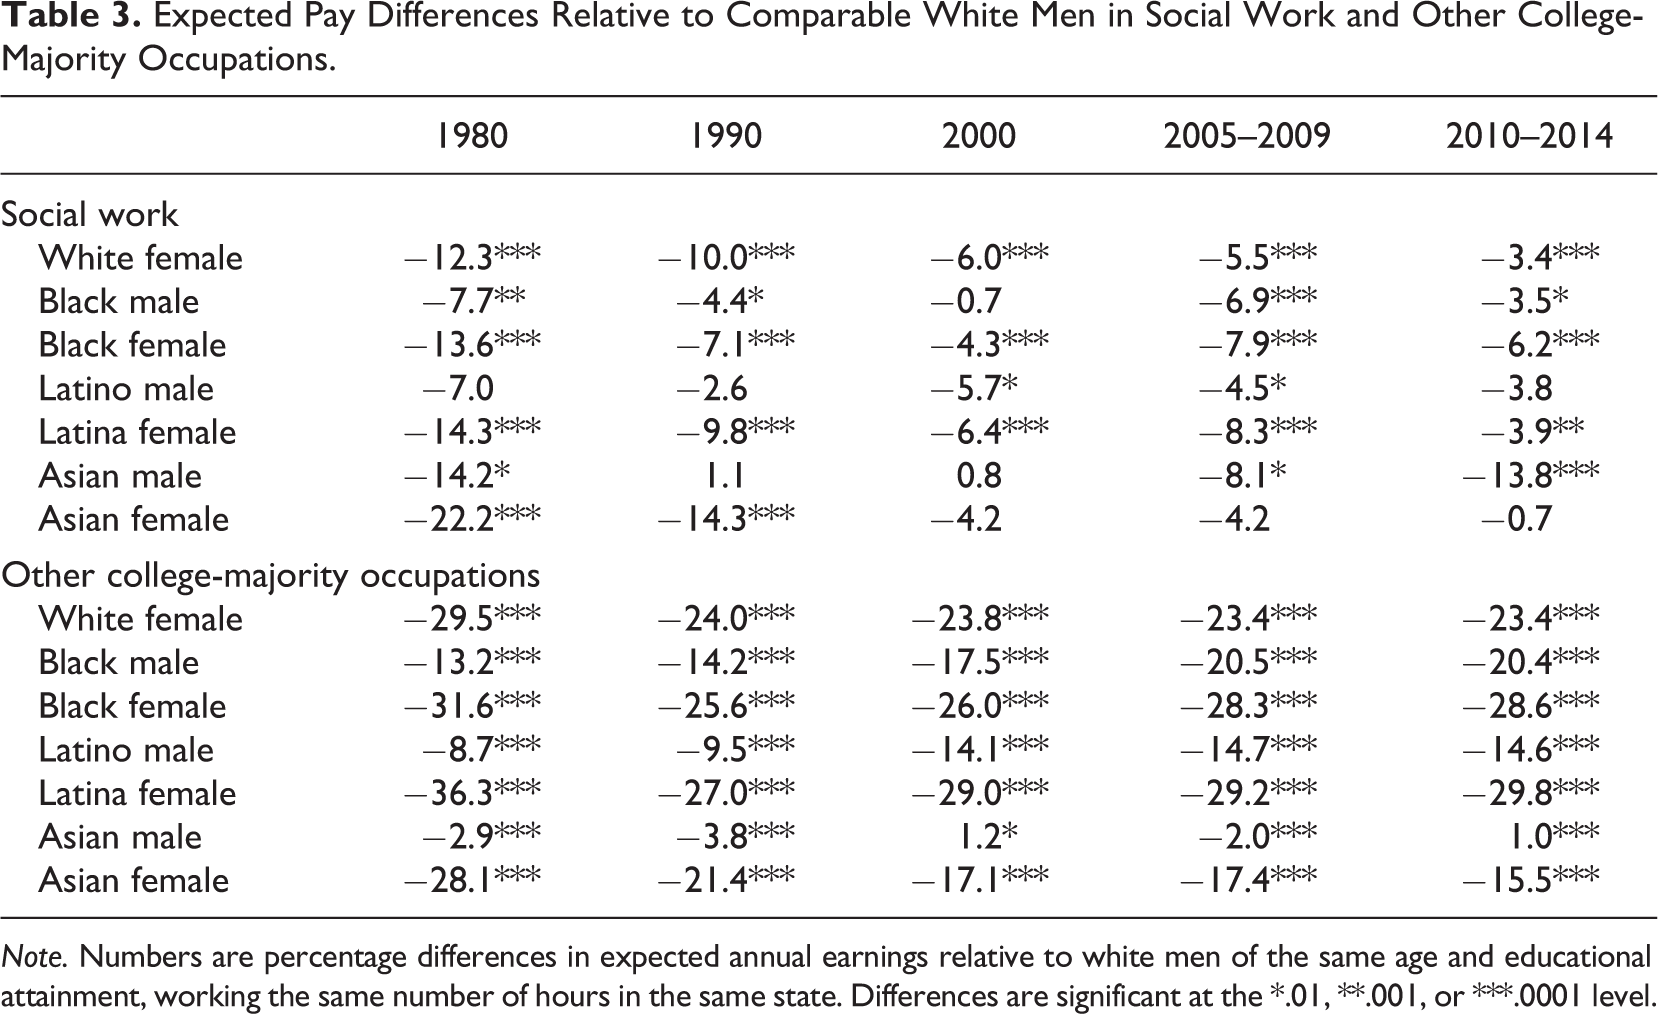
Note. Numbers are percentage differences in expected annual earnings relative to white men of the same age and educational attainment, working the same number of hours in the same state. Differences are significant at the *.01, **.001, or ***.0001 level.
Consistent with Hypothesis 5, pay disparities for women, blacks, and Latinx are much smaller in social work than in other college-majority occupations. Pay disadvantages relative to comparable white men are all at least 4 times as large as those in social work (15–20%, compared to 3–6%). Note, too, that pay disparities have narrowed much less in other college-majority occupations than in social work. Compared to each of the other 69 college-majority occupations with at least 1,000 observations in 2010–2014, pay disparities in social work relative to comparable white men were 3rd smallest for white women, 5th smallest for Asian women, 7th smallest for both black and Latinx women, 11th smallest for black men, and 15th smallest for Latinx men.
Pay Levels
Social workers earn less than comparable employees in other college-majority occupations, and the pay gap has widened since 1980. Consistent with Hypothesis 6, social workers made less than college graduates of the same gender/race/ethnicity, age, and educational level working the same number of hours in other college-majority occupations in every period (Table 4). The gap was 14% in 1980, jumped to 22% in 1990, and widened to 25% by 2010–2014. Compared to other college-majority occupations individually, social work paid comparable employees less than all but 3–8 occupations, depending on the year.
Expected Pay Differences Between Social Workers and College Graduates in Other College-Majority Occupations.
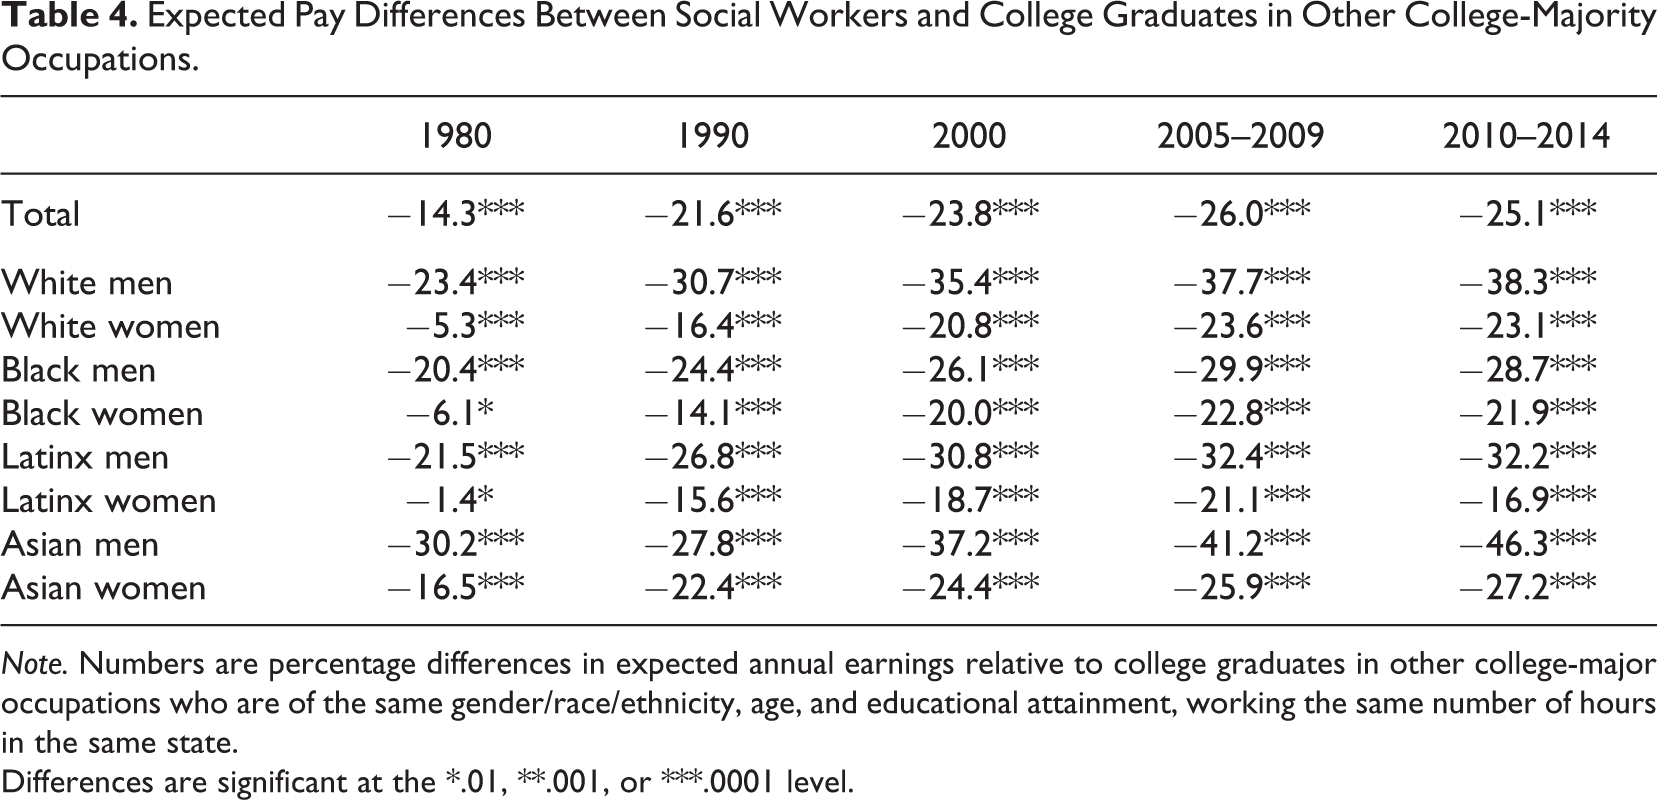
Note. Numbers are percentage differences in expected annual earnings relative to college graduates in other college-major occupations who are of the same gender/race/ethnicity, age, and educational attainment, working the same number of hours in the same state.
Differences are significant at the *.01, **.001, or ***.0001 level.
The pay disadvantage to choosing social work is much smaller for women and somewhat smaller for black and Latinx men than it is for white and Asian men, consistent with Hypothesis 7. In 1980, women earned nearly as much in social work as in other college-majority occupations: The pay gap was 5% for white women, 6% for black women, and 1% for Latinx women. Those pay gaps widened steadily up to 2005–2009, however, when it was over 20% for each group. White, black, and Latinx men already earned at least 20% less in social work than in alternative occupations in 1980. By 2010–2014, the pay disadvantage to choosing social work was about 30% for both black and Latinx men, nearly 40% for white men, and approaching 50% Asian men.
Asian and white men, the most underrepresented groups in social work, faced the biggest pay penalties for choosing social work; the groups with the highest representation (Latinx, black, and white women) faced the smallest pay penalties. The logit model underlying the second half of Table 2 indicates that the probability of choosing social work decreases with the size of the pay penalty and that differences in those penalties can explain more than half the overrepresentation of white women, blacks, and Latinx, consistent with Hypothesis 8. White women, for instance, were 2.4 percentage points more likely to be social workers than white men of the same age and educational attainment working the same number of hours in the same state; but they were 0.9 percentage points less likely than comparable white men facing the same pay penalty to choose social work. Overrepresentation of blacks and Latinx drops by about half when the model controls for how large a pay cut people expect from choosing social work. White women, blacks, and Latinx were still more willing than white men to accept a pay penalty to do social work, but differences between the first and second panels suggest that smaller pay penalties account for more of their overrepresentation in social work.
Conclusion
Social work has much to be proud of. The field’s social and economic justice missions have generated a highly diverse, reasonably equitably paid labor force. Consistent with previous research, women, blacks, and Latinx make up a steadily rising percentage of social workers, but they also make up a higher percentages than in almost any other profession throughout the past 35 years. Consistent with previous research, women, blacks, and Latinx still earn less than comparable white men in social work; however, pay disparities have fallen by half to two thirds since 1980, are only one fourth to one sixth as large as in other college-majority occupations as a group, and are among the smallest when compared to other occupations individually. Although progress toward pay equity for women has slowed substantially since 1990 in the economy as a whole, it continues in social work. For black and Latinx men, progress has stalled, but pay gaps have not widened as they have in other college-majority occupations as a group. These findings are much more positive than previous research.
These successes come at a cost, however. Social workers earn substantially less than comparable college graduates in other college-majority occupations, and the average pay disadvantage grew from 14% to 25% between 1980 and 2010–2014. The pay disadvantage ranges from 17% to 46%, but it is smaller for women and for black and Latinx men than for white and Asian men. These smaller pay disadvantages help explain the field’s workforce diversity: The overrepresentation of white women, blacks, and Latinx drops by half when the logit model adds expected earnings in social work and alternative occupations. These patterns suggest that success in raising social work pay could have unintended consequences for diversity and, perhaps, pay equity by attracting more white and Asian men into the field.
The findings rely to some extent on how census data identify social workers, which suggests that we should take both the good and bad news with a grain of salt. Respondents identify their own occupations and do not need specific educational requirements to classify themselves as social workers. One quarter of the self-identified social workers do not have bachelor’s degrees (these were dropped from the analysis), only one fifth of the college graduates majored in social work at the undergraduate level, and the census data cannot isolate licensed social workers or MSWs. Although the Census Bureau does basic checks on occupation, women, blacks, and Latinx may be more likely than white men in similar jobs to self-identify as social workers; this could overstate the field’s diversity. Since the highest paid social workers may be in management occupations, they will not show up as social workers in census data; this could bias estimates of social work pay downwards. Further, if white men are more likely to become managers, this analysis could overstate diversity and understate pay gaps.
A separate analysis of people who had earned bachelors of social work (BSWs), only one third of whom were currently classified as social workers, gives some sense of how a different definition might have affected the findings. Among college majors, social work has nearly the highest representation of women, blacks, and Latinx and nearly the lowest expected earnings (Lewis, 2017). About 13% of BSWs held management occupations, and thus were not classified as social workers in the main analysis. Differences from white men in probabilities of being managers were small for white women, black men, and Latinx men but about 6 percentage points for black and Latinx women.
Among the 46% of BSWs who worked as either social workers or managers, all groups earned 12–24% less than comparable white men. These pay gaps were twice as high (for white and black women), 3 times as high (for Latinx women) and 6 times as high (for black men) as when the sample was restricted to just social workers. (For Latinx men, including managers did not change the pay gap.) This suggests that leaving the social workers who became managers out of the main analysis badly understated pay disparities. On the other hand, over half of BSWs ended up in different occupations altogether, and this was much more likely for white men than for comparable white women, blacks, and Latinx. The census data cannot tell us whether the BSWs who became managers rose through social work or entirely different occupations, making it much more difficult to estimate how much identifying social workers who rose into management would have changed findings on diversity, pay equity, or pay. As better data become available, future research should address this question.
Can social work do anything about the low pay? As Barth (2003) notes, social work has difficulty enforcing boundaries and requiring particular credentials. Even in 2009–2014, 22% of self-identified social workers lacked a bachelor’s degree, and they only earned 10–20% less than BSWs. Social workers are nearly as likely to have undergraduate degrees in psychology and sociology as in social work, and all three groups earn basically the same amount, suggesting that employers find these majors to be acceptable substitutes for BSWs. Except in specific subfields where the profession can require specific credentials, social work lacks much market power to bargain for higher pay. Employers are willing to hire people with related skills, and the supply seems high enough to fill demand.
Footnotes
Declaration of Conflicting Interests
The author(s) declared no potential conflicts of interest with respect to the research, authorship, and/or publication of this article.
Funding
The author(s) received no financial support for the research, authorship, and/or publication of this article.