
Abstract
This systematic literature review investigates whether and how working-from-home (WFH) affects travel behavior in the working population, and then assesses whether the changes, if any, generate environmental, social, or economic benefits. We rely on a final sample of forty-eight peer-reviewed articles, selected following the Preferred Reporting Items for Systematic Reviews and Meta-Analyses (PRISMA) guidelines. Throughout the study, we distinguish between the pre-, during, and post-COVID-19 evidence. We find that there are many environmental, social, and economic benefits associated with WFH but attaining them is not straightforward, partly because current urban patterns were not created with WFH in mind and lifestyle adjustments can offset any gains associated with WFH. A decrease in overall travel distance is only accrued when most employees (in jobs that do not require face-to-face contact) work from home three or more times a week.
Introduction
Technological changes and recent practices induced by COVID-19 have altered people's work travel habits. More people are working from home. However, contemporary cities were not developed with working-from-home (WFH) arrangements in mind (Mualam, Israel, and Max 2022; Wulff and Newton 1999). In fact, the current urban form, including the organization of infrastructure and the distribution of people and services, largely reflect an expectation that most workers will travel to a work site at some distance from home, remain there for several hours, and then embark on a return trip to their residential area. This state of affairs affects not only work–life balance, but also productivity and environmental quality (Glackin and Moglia 2022; Hensher, Beck, and Balbontin 2021a).
At the height of the COVID-19 pandemic (March 2020 to May 2023), office occupancy rates and office-based work plummeted, which led to a reduction in motorized travel and a drop in air and noise pollution levels (Glackin and Moglia 2022; Hensher, Beck, and Balbontin 2021a). However, in a post-COVID-19 world, a shift from office-based work to WFH might also have counter-balancing outcomes, as workers may make residential location choices that influence commuting patterns. In some cases, they may choose to relocate farther from work, leading to longer but less frequent commutes (Jain, Currie, and Aston 2022). Overall, this might often result in more travel and more car dependency (Guerin 2021a; Zhou and Hagen 2006). People may move to lower-density exurban areas, which have larger properties with dedicated WFH space, but also fewer urban amenities such as shopping and leisure centers (Glackin, Moglia, and Newton 2022).
How can WFH arrangements contribute to achieving sustainable urban transitions? There is no definite answer yet because the research is too varied and fragmented. Therefore, it is crucial to synthesize the existing evidence on the impact of WFH on workers’ travel behavior and review this in relation to environmental, social, and economic sustainability benefits. This systematic literature review (SLR), which follows the Preferred Reporting Items for Systematic Reviews and Meta-Analyses (PRISMA) method (Bradbury-Jones et al. 2019), provides such a synthesis through a final sample of forty-eight peer-reviewed articles. Throughout the study, we specify whether the evidence relates to the periods before, during, and/or after the COVID-19 pandemic. More methodological details are provided in the next section, before proceeding to the analytical portion of the article.
A note on terminology. We employ WFH and teleworking interchangeably when referring to arguments that broadly encapsulate working in non-office-based environments. However, in some cases, the insights from the literature are specific to particular categories within WFH—such as flexible working or flex-time—in which case we also adopt the more specific terminology.
Methodology
As noted, we use the PRISMA methodology (Bradbury-Jones et al. 2019) to collect and review the evidence. This is a standardized approach in systematic literature reviews. It guides researchers on how to search for literature and how to report the findings. The method is described in detail below.
SLR Search Strategy
The article identification process was carried out between 15 August 2022 and 14 January 2023. Three databases were searched: Web of Science, Scopus, and Ebsohost. These were selected because of their well-established breadth and depth. The search concepts, terms, and strings that we employed are summarized in Table 1. Recognizing that small changes in the search terms can produce large differences in results, we refined the search terms based on an iterative process seeking to ensure a comprehensive selection of studies. The effectiveness of the search protocol was evaluated by adopting a gold-set testing process (Whiting et al. 2008). This involved iteratively testing the ability of our search to retrieve known articles that relate to our research question. In this manner, the search protocol was able to pick up a set of “golden papers.”
Search Concepts, Terms, and Strings.
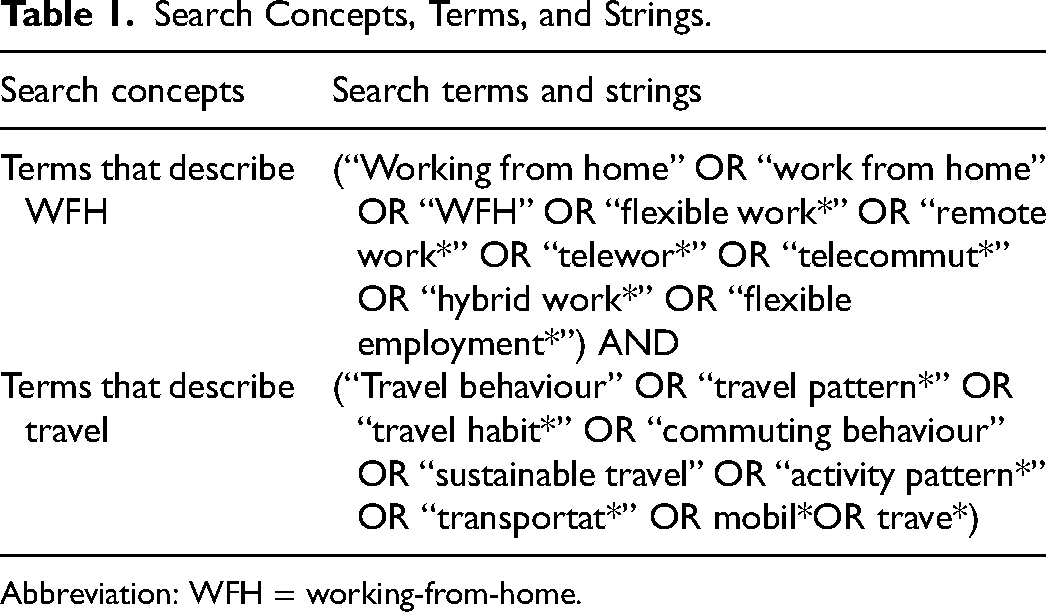
Abbreviation: WFH = working-from-home.
Timeframe
We included articles from 2000 to 2022 (inclusive). This timeframe is technologically comparable as it witnessed the widespread adoption of mobile phones and the emergence of videoconferencing. Also, this timeframe allowed us to include a sample of studies conducted before, during, and after COVID-19. 1 The articles in our database were categorized into before, during, and after COVID-19 groups based on the data they employed. For instance, if a paper was published in 2020 but relied on data from 2018, it was categorized as “before COVID-19.”
Screening Criteria
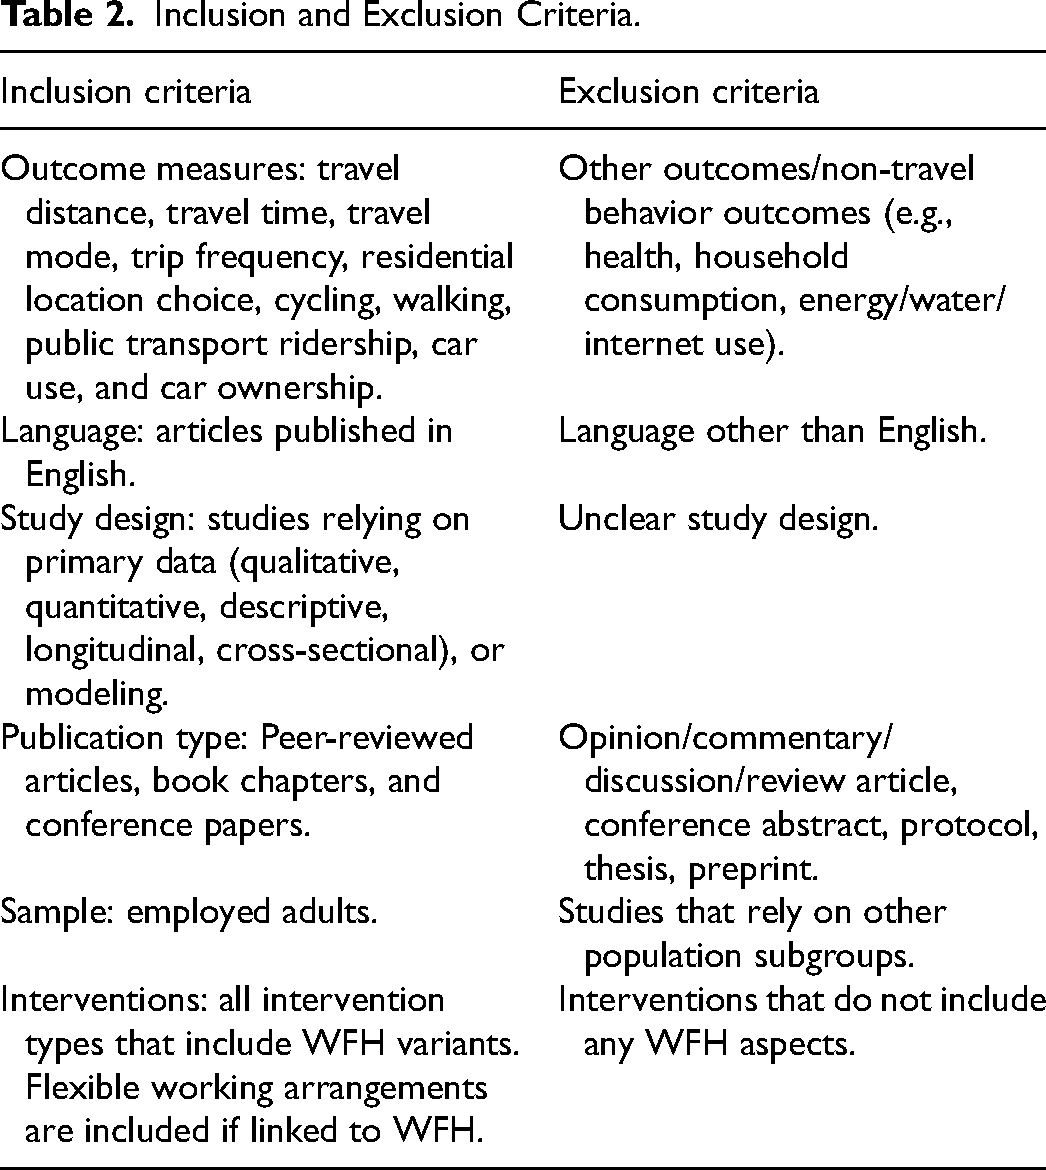
Table 2 lists inclusion and exclusion criteria. Following these criteria, two researchers separately screened articles by the title, and abstract using the Covidence software (Kellermeyer, Harnke, and Knight 2018). Then they compared notes and reached consensus over a small number of inconsistencies in judgment. The full texts of the short-listed articles were checked against the inclusion and exclusion criteria. Only studies that were relevant to the research questions were selected for inclusion in the dataset. Regarding the “Outcome measures” inclusion criterion, we included articles if they measured at least one of the travel-related behavioral outcomes listed in the table.
Inclusion and Exclusion Criteria.
Data Extraction
Article metadata was extracted into a Microsoft Excel file using the following checklist:
Author(s) name(s) and year of publication Study area or location Study objective and research questions Study design (cross-sectional, longitudinal, panel, scenario modeling) Sample sizes and sampling techniques Measure of outcome variables (e.g., travel distance, modal choice, trip departure time, car use, car ownership, number of work-related trips for work, etc.) The impact of WFH on travel behavior and factors considered Key findings Study strengths and limitations Conclusions and other relevant information for our research questions
Data Analysis
A thematic analysis was conducted—separately for each outcome (Popay et al. 2006). Four steps were applied to synthesize the data: (1) read the results of each study and extract relevant findings; (2) develop a preliminary synthesis by describing the studies and identifying patterns; (3) categorize studies by travel behavior outcome and organize factors linked to the outcomes; and (4) thematize items and explore the relationships of each factor within and among themes. The characteristics of the included studies were described and summarized in the tables and the figures (see “Description of Included Studies” section). Note that in this case, it was not possible to conduct a meta-analysis due to the diversity of measures used to estimate the outcome variable (travel behavior).
Final Database
Figure 1 depicts the PRISMA flow diagram. The initial search returned 428 publications (after removal of duplicates). After screening by title and abstract, eighty-one studies were included for full-text screening. Out of these, forty-eight studies met the final inclusion criteria, while thirty-three were excluded. The most common reasons for exclusion were (a) unclear research design and (b) unclear empirical methodology. Discussion papers and policy review documents were excluded as well.
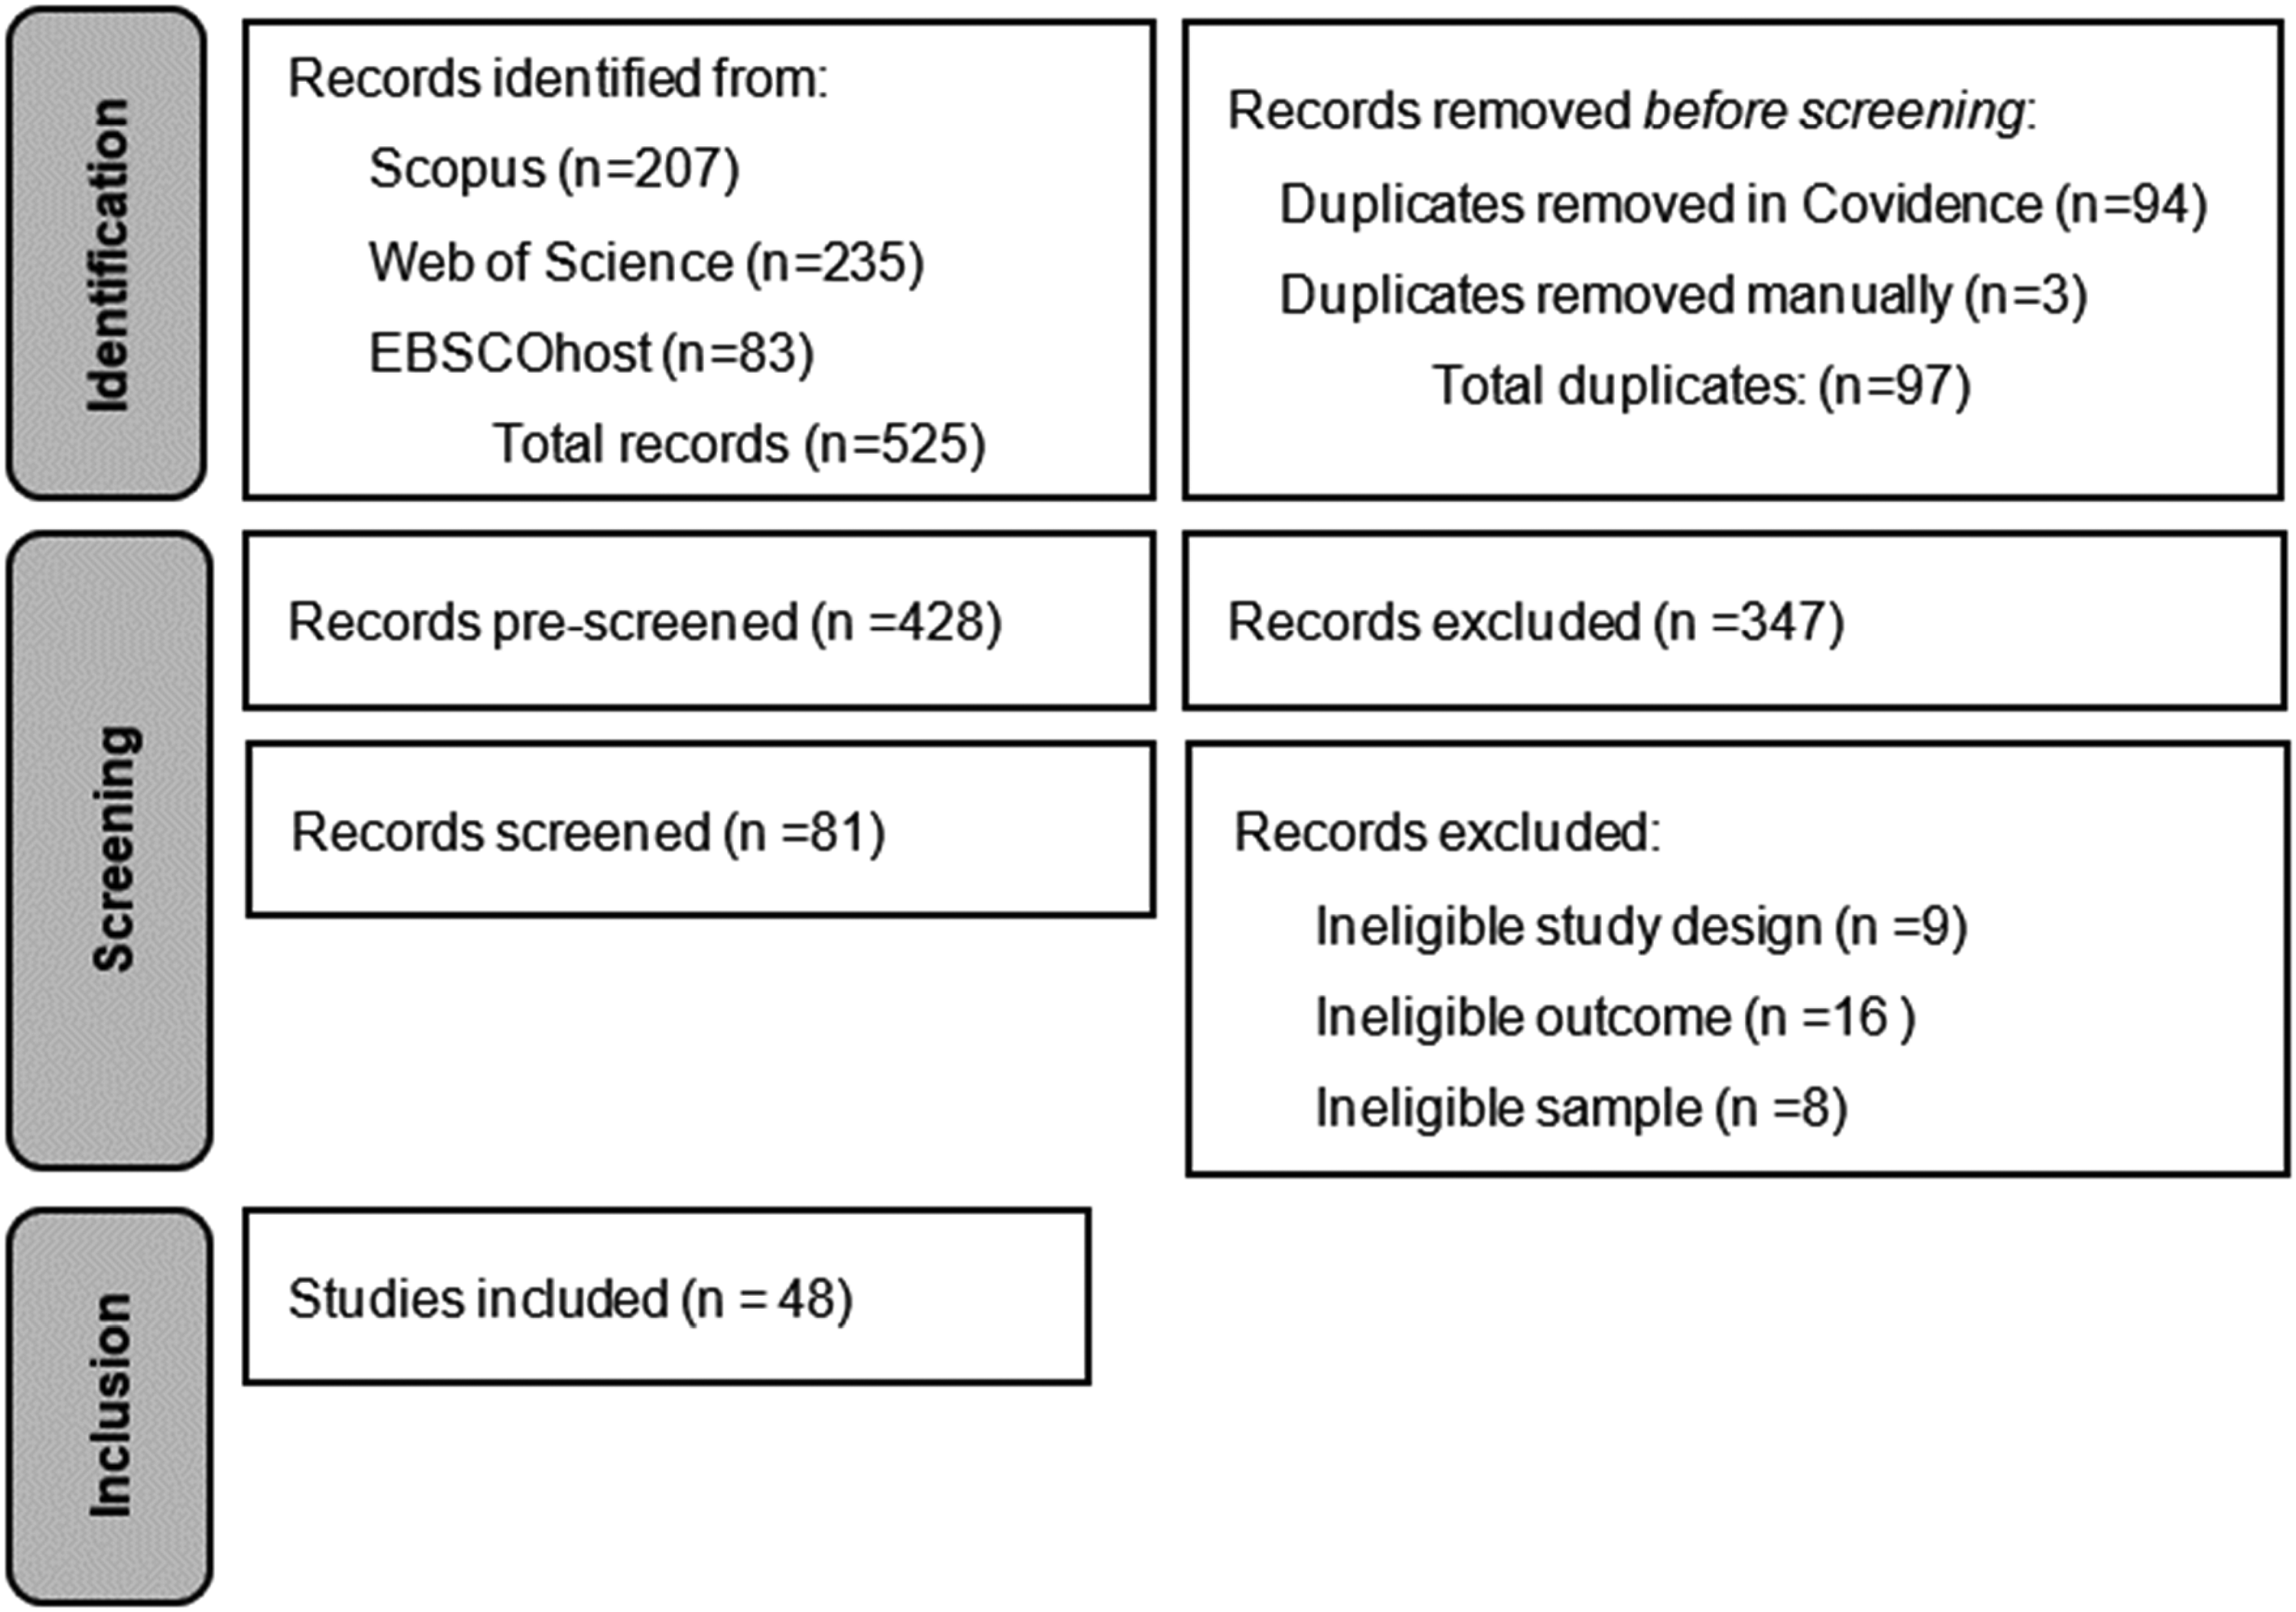
Preferred Reporting Items for Systematic Reviews and Meta-Analyses (PRISMA) flow diagram.
Description of Included Studies
Trendline of Studies
The plot in Figure 2 shows the number of publications by year (2000–2022). It is clear that:
Until 2017, the rate of WFH publications was consistently low, with just a few articles per year. Starting in 2017, there was an upward tick in WFH-related publications. The rate of WFH publications peaked in 2022.
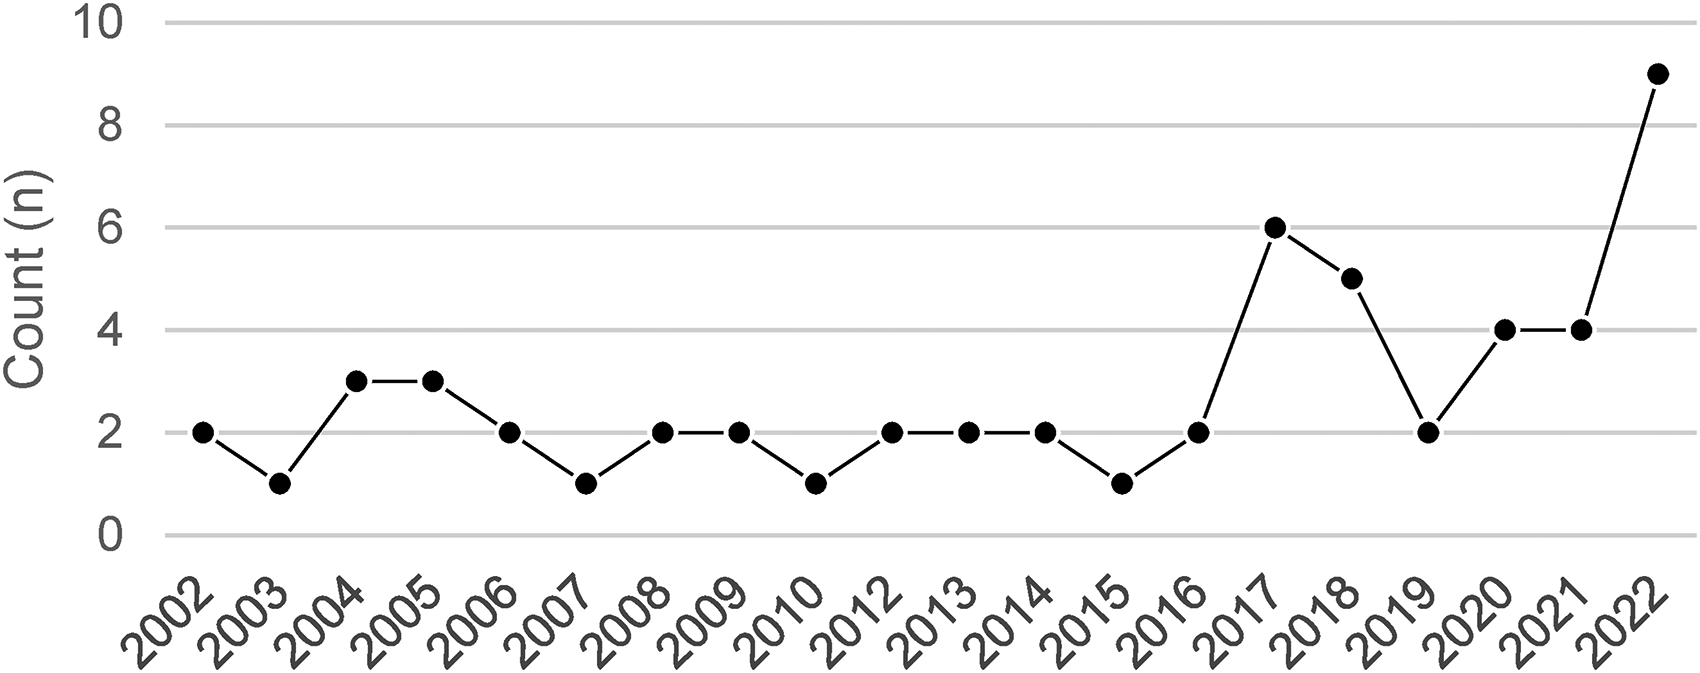
Number of published studies by year.
Many studies that appeared during the pandemic utilized empirical data collected before the COVID-19 outbreak. This suggests that the increase in WFH-related publications since 2017 reflects the pandemic only in part. Interest in WFH appears to have preceded the lockdowns by several years.
Study Settings
Most studies (84 percent) were set in wealthier regions, including North America (n = 18), Europe (n = 18), Australia (n = 7), and East Asia (n = 5). This means that the evidence is biased toward cities that have long been characterized by housing unaffordability and gentrification (Burke and Hulse 2010; Thackway et al. 2023). In addition, WFH might be popular among workers in more developed countries who have better access to Internet technologies and infrastructure. Furthermore, a prevalence of white-collar jobs in developed countries tends to promote WFH opportunities.
Dependent Variables
The included studies examined the following outcome measures (i.e., dependent variables):
Peak hour departure time
The definition of “peak hour” and “off-peak hour” varies across studies and country contexts. In our sample, a study from the US divided morning departure times as pre-peak (12:00 a.m. to 6:30 a.m.), peak (6:30 a.m. to 8:30 a.m.), and post-peak (8:30 a.m. to 12:00 p.m.) (Yang, Steiner, and Srinivasan 2016). Two studies from Canada defined the morning peak as the periods between 6:00 a.m. and 9:00 a.m. and 7:00 a.m. and 9:00 a.m., respectively, (Bussière and Lewis 2002), whereas in a Dutch study, the morning peak was from 7:00 a.m. to 9:00 a.m. and the afternoon peak from 4:00 p.m. to 6:00 p.m. (van der Loop, Willigers, and Haaijer 2019b).
Travel distance
This was measured as weekly travel distance, on a daily and/or annual basis, for work and non-work activities, and the combination of both.
Commuting distance
Typically, this was expressed as kilometers or miles of travel between home and work. Where work arrangements were flexible, it was measured as the frequency of work-related trips per week, month, or year (Melo and de Abreu Silva 2017; Zhu 2012).
Overall person/household travel distance
This is the sum of the total travel distance per household for work and non-work purposes by different modes. It was expressed as total travel for an individual/or a household by different modes such as car and public transport (Kim 2017; Kim, Choo, and Mokhtarian 2015). The travel distance has been explored in some studies, as teleworkers may relocate (thereby changing their one-way travel distance) or modify their travel frequency.
Non-work activities
These included shopping, education, recreation, and other activities unrelated to work. The travel required to reach them was measured in kilometers/miles or trip frequencies (Caldarola and Sorrell 2022; Cerqueira et al. 2020).
Travel mode choice was usually defined as the distance (km/miles) traveled per week, day, or year by modes (e.g., car, bicycle, and bus) (Dissanayake and Morikawa 2008). A few studies involving mode choice modeling employed statistical analysis techniques such as multinomial logistic regression to predict modal choice behavior among teleworkers. However, none of these considered WFH as a mode of commuting. Most mode choice studies only included traditional modes of travel such as private cars, public transport, cycling, and walking, ignoring novel modal choices, like teleworking. More broadly, the emerging literature on WFH appears to be poorly connected to the transport mode-choice literature as WFH is not (yet) considered as a commute mode.
Urban structure and residential location choice
These concepts were measured by housing type (e.g., single-family dwelling, apartment, etc.), characteristics of residential location, and distance to the workplace (Elldér 2017; Moos and Skaburskis 2007).
Independent Variables
The included studies controlled for some or all of the following variables:
Socio-demographic/economic characteristics
Age, gender, income, occupation, presence of children, educational status, household structure, and home ownership (Choo, Mokhtarian, and Salomon 2005; Kim, Choo, and Mokhtarian 2015; Zhu 2012).
Land-use characteristics
Population density, street patterns, public transport access, frequency of public transport services close to residence, number and density of jobs, density of roads, and density of train stations (Shabanpour et al. 2018; Zhu and Mason 2014).
Trip characteristics
Number of trips, travel time, travel distance, travel expenditure, trip timing (weekend vs. weekday), and number of vehicles per household (de Abreu e Silva and Melo 2017; Zhu and Mason 2014).
See the Supplemental Table for further details regarding the outcome and control variables used in each study included in this review.
Study Participants
Study participants included:
Individuals who worked from home, at least some of the time (de Abreu e Silva and Melo 2018b; Melo and de Abreu Silva 2017) and/or individuals who commuted to a workplace (Zhu and Mason 2014). And, Households with one or more members of WFH (de Abreu e Silva and Melo 2017; Kim 2017; Melo and de Abreu Silva 2017). Some studies considered WFH practices among the general population as well as related travel behavior practices (Conway et al. 2020; Javadinasr et al. 2022).
Different work arrangements were discussed in the reviewed studies, including WFH (part or all of the work being completed in the home setting), remote working (part of the work being completed away from the primary work location), telecommuting (using IT technology to work remotely and/or at home), and hybrid working (partly WFH or in a remote setting and partly working in an office). Teleworking was a commonly used term (Choo, Mokhtarian, and Salomon 2005; Kłopotek 2017; Sullivan 2003). In our study, we included studies where workers performed all or a substantial part of their paid or unpaid work from their homes, telework centers, co-working spaces, and other places away from the organization's own locations (Bloom et al. 2015; Choo, Mokhtarian, and Salomon 2005). Other varieties of WFH, including home-based businesses and overtime work, were not included in our study.
Study Methods
The methods employed in the included studies were primarily quantitative, regardless of the travel behavior being measured (Dissanayake and Morikawa 2008; Ellder 2020). Two studies assessed WFH in multiple cities across the globe(Balbontin et al. 2021; Matthews and Williams 2005). While the majority of the studies focused on a single city, some studies addressed the travel behavior of people with flexible work arrangements in multiple cities within the same country (Ellder 2020; Hensher, Beck, and Balbontin 2021a). Data sources included existing national household travel surveys. Importantly, many post-pandemic studies used purpose-built surveys to capture information about the travel implications of the pandemic (Caldarola and Sorrell 2022; Choo, Mokhtarian, and Salomon 2005; van der Loop, Haaijer, and Willigers 2019a; Zhu and Mason 2014). Two studies used scenario modeling based on simulations or other types of models to project the future impacts of WFH on travel behavior (Lila and Anjaneyulu 2017; Moeckel 2017). Most studies set in the post-COVID-19 period were based on modeling and prediction, with many drawing on hypothetical data. Qualitative studies based on interviews were in the minority (n = 2, both based on interviews) (Lim 2005; Lyons and Haddad 2008). Only one study used a mixed methods approach, combining quantitative and qualitative methods (Vaddadi et al. 2022).
Narrative Review of Included Studies
The impact of WFH on various travel behavior metrics, before, during, and after COVID-19, is summarized in Table 3. A detailed discussion of each metric follows. The discussion is based on the reviewed studies unless otherwise noted.
Impact of WFH on Various Travel Behavior Metrics, Before, During, and After the COVID-19 Pandemic.
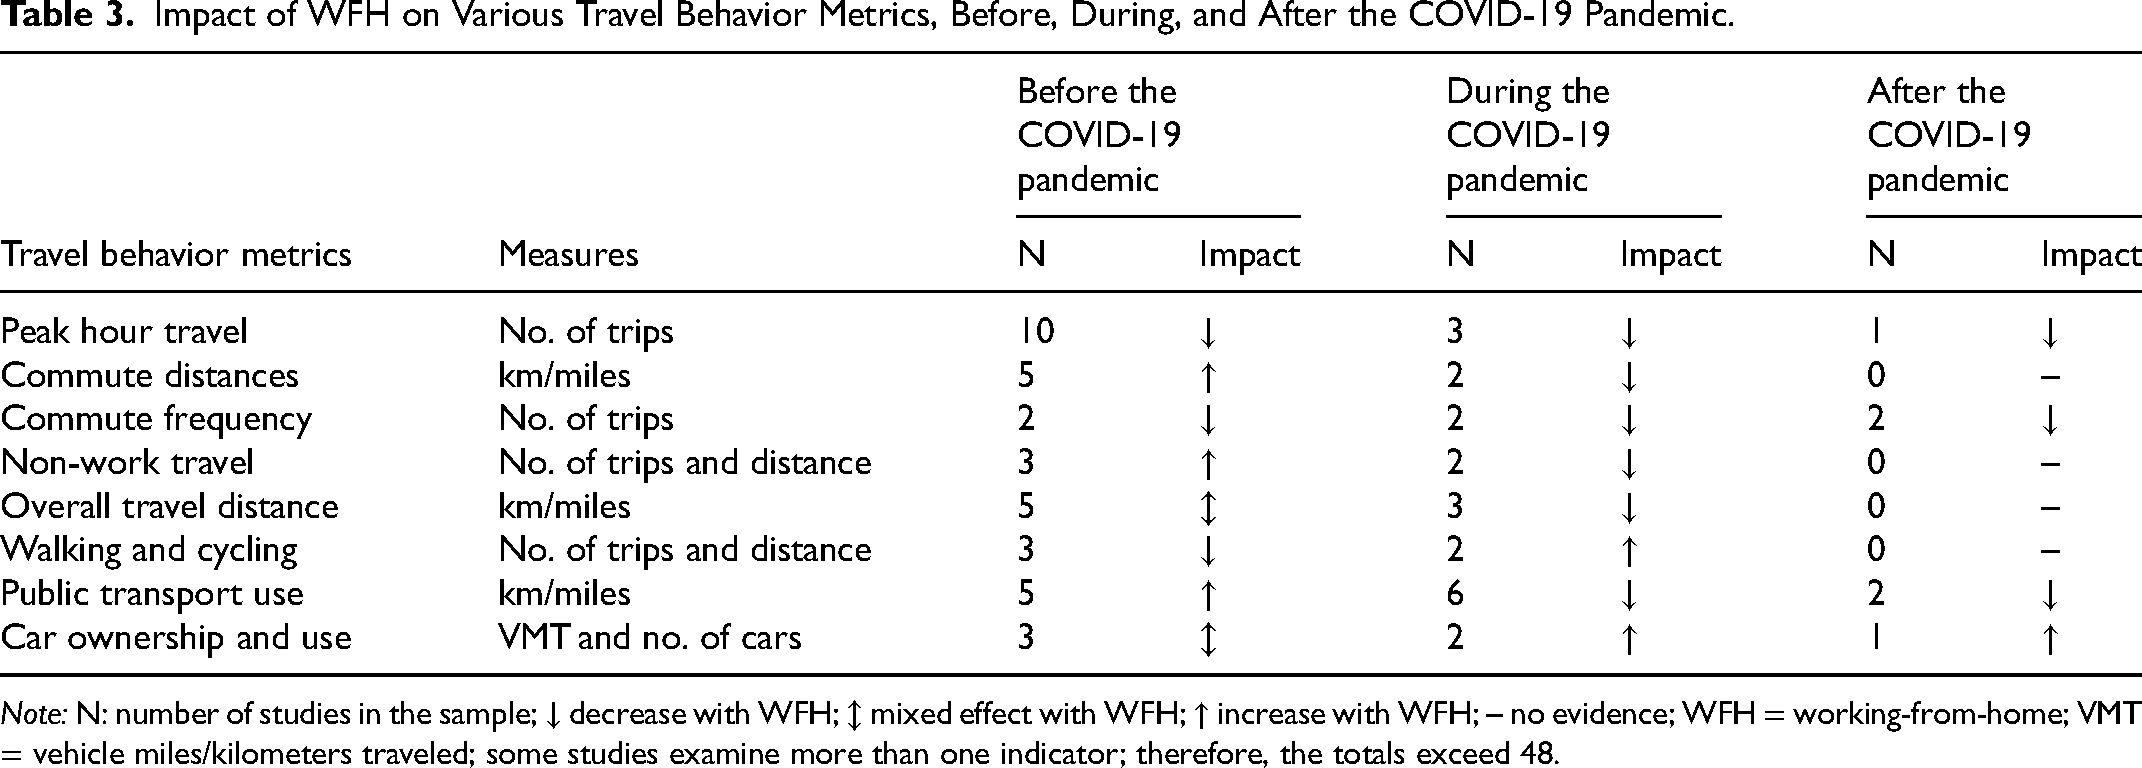
Note: N: number of studies in the sample; ↓ decrease with WFH; ↕ mixed effect with WFH; ↑ increase with WFH; – no evidence; WFH = working-from-home; VMT = vehicle miles/kilometers traveled; some studies examine more than one indicator; therefore, the totals exceed 48.
Peak Hour Travel
Studies typically defined “flexible working” in terms of schedule rather than location. Some studies considered the total avoidance of travel during business hours. The synthesized evidence for all three periods showed that workers with flexible schedules (by day or week) tended to postpone the morning peak hour commute to later in the day (Bussière and Lewis 2002; Ellder 2020; He 2013; van der Loop, Willigers, and Haaijer 2019b; Shaz and Corpuz 2009). This resulted in a spreading out of peak-hour traffic. A reduction in peak-hour travel was more pronounced during the COVID-19 pandemic period (Campisi et al. 2022b), possibly because of the strict lockdowns implemented in many countries. Compared with workers with fixed work schedules, workers with flexible work arrangements were less likely to travel during rush hour (He 2013).
A Dutch study using 2000–2016 data found that when individuals worked from home and avoided peak-hour travel, travel delays were reduced. Specifically, the study reported a reduction of 20 min during the morning peak, 12 min during the afternoon peak, and 10 min over the entire day for each person with flexible work arrangements (van der Loop, Willigers, and Haaijer 2019b). Full-time WFH has a higher impact on the daily congestion average compared to part-time WFH (Ellder 2020; van der Loop, Willigers, and Haaijer 2019b).
Overall, studies found that WFH for at least two to three days resulted in a substantial reduction in peak-hour travel. This was highlighted in studies that used data from the pandemic era but even after COVID-19 restrictions eased, peak hour travel and congestion did not reach pre-pandemic levels, as many people continued WFH/hybrid working. These trends may have been reversed in the post-pandemic period, but studies are too limited to substantiate this trend, and the norms around WFH behavior are likely still evolving.
Studies found that, among people with flexible work arrangements, the propensity to travel during the peak hour was influenced by the worker's age, gender, ethnicity, race, and income (Lachapelle, Tanguay, and Neumark-Gaudet 2018; Shaz and Corpuz 2009; Yang, Steiner, and Srinivasan 2016). For instance, teleworkers who were female, older, less educated, poorer, and carless were less likely to travel during the peak (Ellder 2020). Meanwhile, full-time teleworkers with children were more likely to travel during the morning peak (Lachapelle, Tanguay, and Neumark-Gaudet 2018). 2 This is because parents need to drop off and/or pick up children at school, which indirectly impacts their work start/end time. Even though professionals and managers were shown to have the most flexibility, they were still the ones most likely to travel during rush hours (Yang, Steiner, and Srinivasan 2016). Also, a more flexible work schedule may translate into scheduling personal appointments such as banking, doctor's visits, and suchlike in the early morning or evening.
Travel Distance
Several measures were used to assess travel distance in the reviewed studies. The choice of a specific measure depends on the study's research objective, data availability, and level of detail needed. Very few of the reviewed studies used travel time to measure how long workers were traveling for different activities. Most studies used the distance traveled for work and non-work activities on a daily, weekly, monthly, or yearly basis, or the one-way commuting length.
Travel distance (i.e., length) was typically measured in miles or kilometers. This was derived from respondent-reported distances, network measurements, or calculations by professionals. Typically, these calculations determined the distance from the home centroid to the workplace or other activity locations. Travel duration or travel time was measured in minutes and included the total time spent on a trip, covering both the time spent in travel and any waiting times (Hensher, Beck, and Balbontin 2021a).
Travel time as a measure of distance was used in two studies, which found that teleworking was associated with a reduction in the overall travel time but not the total amount of travel distance (Elldér 2017; Melo and de Abreu Silva 2017). From a behavior change perspective, distance and time are related, but are not synonymous. Individuals may have a better understanding of travel time, rather than distance, and may also be more responsive to variations in time, rather than distance. For instance, peak and off-peak travel differ in terms of time, but not necessarily in terms of distance.
One-way commuting distance
In the pre-pandemic period, one-way weekly and daily commute distances were higher among people who worked from home compared to those who worked in their office (Cerqueira et al. 2020; Melo and de Abreu Silva 2017; Mokhtarian, Collantes, and Gertz 2004; Zhu 2012). Most studies reported one-way weekly and daily commuting distances to be higher among workers who WFH for part of the day or part of the week compared to workers who worked from a conventional workplace. This suggests that WFH was associated with more remote residential locations (Beck and Hensher 2022), which led to concerns that it could potentially contribute to more sprawl and greater travel distances overall (Elldér 2017; Zhu 2013). However, the causal direction was not clear in these studies. It may have been that people who already lived in remote locations were more likely to choose to telework, which means that WFH did not cause longer distances between homes and workplaces. However, it was known that individuals who work from home the most, (i.e., three or more days per week) had the lowest weekly commuting distances (Ellder 2020; Melo and de Abreu Silva 2017).
Most studies controlled for different socio-economic, demographic, and environmental variables when assessing the impact of different work arrangements on the overall daily and weekly commuting distance. It was found that weekly commuting distance tended to be longer for: males; workers from high-income households; workers with higher education; parents; drivers; managers, and professionals; workers in the construction, transport, financial, real estate, and energy sectors; workers who had recently moved residence; and workers living in rural locations (Melo and de Abreu Silva 2017). Studies consistently reported that younger and educated men had longer one-way, daily, and weekly, commute distances compared to older people and workers with less education (Caldarola and Sorrell 2022; Zhu 2012; Zhu and Mason 2014). Meanwhile, employees who lived in denser, mixed, compact, and transit-rich urban areas reported shorter travel times/distances to work (Milakis et al. 2008; Stead, Marshall, and Research 2001; Zahabi et al. 2012).
During the COVID-19 pandemic, daily and weekly commute distances substantially declined for everyone as employees did not travel to work as often (Hensher, Beck, and Balbontin 2021a). There were no post-COVID-19 studies of commuting distances. Anecdotally, return to office work/policies would suggest an increase relative to pandemic-era distances.
Non-work travel
Several studies compared the daily and weekly travel distances for non-work activities among office-based workers and workers who telecommuted (Cerqueira et al. 2020; Zhu 2012). In the period before the COVID-19 pandemic, WFH was associated with more frequent and longer daily and weekly non-work-related trips on no-commute days (Cerqueira et al. 2020; Zhu 2012), possibly because teleworkers tended to live in areas farther from their workplace and with lower population and service density (Cerqueira et al. 2020; Hostettler Macias, Ravalet, and Rérat 2022; Zhu 2012).
Also, destinations on WFH days were more equally distributed among all directions around the home (Zhu and Mason 2014). Perhaps people were using the time saved from commuting to partake in activities such as hiking or shopping which could not be easily combined with work travel (Wöhner 2022; Zhu 2012). After controlling for different socio-economic and environmental variables, most studies highlighted that female teleworkers and parents made more non-work-related trips than male teleworkers, reflecting the gendered division of household tasks in most cultures (Cerqueira et al. 2020; Zhu and Mason 2014). In contrast, older adults, lower-income earners, and those who lived farther from a city center tended to make fewer non-work-related trips compared to those living closer to the city center and/or higher-income earners (de Abreu e Silva and Melo 2018a). This suggests that housing unaffordability may result in the suburban dispersion of low-income workers, in search of cheaper accommodation. At the height of the pandemic, some non-work-related travel (e.g., to restaurants or schools) was eliminated due to government-mandated closures of facilities; however, changes in shopping-related trips (especially grocery shopping) were minimal because this was considered as an essential activity (Rafiq et al. 2022).
Overall travel distance
Evidence related to overall travel distance among teleworkers was mixed, with most studies comparing telecommuting households to non-telecommuting households (Kim 2017; Mokhtarian, Collantes, and Gertz 2004; Zhu 2012). In a study set in Sweden, the overall daily travel distance of telecommuters decreased relative to non-telecommuters (Ellder 2020). At the same time, it increased in studies set elsewhere (Kim 2017; Zhu 2012; Zhu and Mason 2014). A study by Mokhtarian et al. (2004) found that telecommuters’ one-way travel distance to work is longer than that of general commuters. But another study found the opposite: on average, telecommuters’ distance to work was about 7.1 km shorter than that of full-time office workers (Kim 2017).
Weekly travel distance displayed mixed patterns as well. While weekly travel distance grew in some studies (Caldarola and Sorrell 2022; Cerqueira et al. 2020), it decreased when travel time was used as a measure (Melo and de Abreu Silva 2017). Some studies that measured the annual travel distance reported that it decreased, with no reference to full or part-time teleworkers (Choo, Mokhtarian, and Salomon 2005). The mixed pattern of travel distance could potentially be attributed to environmental, socioeconomic, and other trip-related factors (Ellder 2020). For example, one study showed that the overall weekly travel distance decreased with distance from the nearest city center and with higher density and land-use mix (Ellder 2020).
In reference to the COVID-19 pandemic, most studies (except Choo, Mokhtarian, and Salomon 2005) concluded that, before the pandemic hit, WFH was not associated with substantially less travel overall. In some places, it was even associated with more travel. For example, a US-based study found that on average teleworkers traveled 61 km more each day compared with workers who commuted to a workplace (Zhu and Mason 2014).
Teleworkers in developed countries traveled more than their peers in developing countries, perhaps due to lower car ownership rates in the latter (Caldarola and Sorrell 2022). Even in developed countries, there were variations depending on the residential context, the amount of WFH that was performed, the number of household members that worked from home, and their socio-demographic characteristics (Kim, Choo, and Mokhtarian 2015; Zhu and Mason 2014). An increase in the number of people who worked from home was associated with a reduction in the overall travel distance, and vice versa; this may have affected road congestion and air pollution levels (de Abreu e Silva and Melo 2017; Shabanpour et al. 2018).
A sharp decline in travel and mobility was experienced during COVID-19 (Caldarola and Sorrell 2022). One US-based study reported on average a 30 percent reduction in work-related trips, a 20 percent reduction in non-work trips, and a 6-person-miles reduction in travel per person per day compared to the period before the pandemic (Rafiq et al. 2022). These trends may have been reversed in the post-pandemic period, but no studies are available to confirm this hypothesis.
In the studies reviewed here, there was no evidence concerning the impact of full-time versus part-time work on the daily, weekly, monthly, or yearly travel among teleworkers. One study noted that none of the participating part-day teleworkers made more trips or traveled farther than full-day teleworkers (Ellder 2020; Shabanpour et al. 2018). This might have been because part-day teleworkers commuted to some extent, perhaps to a co-working space, a coffee shop, or a branch office located in a different city. However, this type of travel differs from the commute trips to the regular workplace. Hybrid work adds an additional layer of complexity, and the overall impact is influenced by a combination of factors including commuting distance, travel modes, and individual choices of workspaces during non-working hours. Studies stressed the importance of understanding telework as a diversified coping strategy for organizing the spatio-temporality of everyday travel (Ellder 2020).
In sum, the impact of WFH on overall travel distance varies and the evidence is inconclusive. Part of the problem lies with methodological differences across studies. Differences are evident in sample sizes, analytical approaches, measurement types (daily versus multiday travel, travel modes and purposes), and work arrangements considered (full vs. part-time telework or hybrid work). At the very minimum, consistency in the measurement of the distance variable is needed to improve our understanding of potential reductions or increases in overall travel distance when workers have the opportunity to WFH.
Commute Frequency
This metric relates to the commute distances, but it is distinct, as trips vary in duration and length. The studies included in this review have generally found that WFH is associated with fewer but longer commuting trips. The relationship holds in all three eras—but it was particularly strong during the COVID-19 pandemic as many people were forced to stay home (Beck and Hensher 2022; Hensher, Beck, and Balbontin 2021a). In settings where the proportion of people with WFH increased from 25 percent to 75 percent, the average number of weekly commuting trips decreased from 2.1 to 0.6 trips per person (Hensher, Beck, and Wei 2021b).
Walking and Cycling
Before the pandemic, WFH was associated with greater use of non-motorized modes (Lachapelle, Tanguay, and Neumark-Gaudet 2018), and full-day teleworkers were more likely to use active modes of travel than part-day teleworkers (Ellder 2020). The time freed up by the commute was perhaps being used to walk and cycle more. COVID-19 intensified this trend (Campisi et al. 2022b; Ellder 2020; Hensher, Beck, and Balbontin 2021a). In Argentina, the active travel mode share increased from 11 percent to 32 percent (Balbontin et al. 2021) whereas in Australia this share increased from 8 percent to 12 percent (Balbontin et al. 2021). Governments that imposed WFH, social distancing, and other forms of isolation still encouraged people to engage in physical activity outdoors to maintain physical health and relieve the psychological stress of the pandemic. Many people at the time began taking shorter trips around their residential areas (Wang and Ozbilen 2020). These trends may be sustained after the COVID-19 pandemic. Compared to part-time teleworkers, those who work full-time are more likely to use active modes of travel (Ellder 2020).
Public Transport Use
The evidence linking flexible work arrangements and public transport use was limited. However, it appeared that teleworkers workers were more likely to ride public transport for their commuting trips on the days they traveled to their workplace compared to workers who commuted five days a week (Campisi et al. 2022b; de Abreu e Silva and Melo 2018b). This might be because workers with flexible work arrangements are not constrained by time and the opportunity to start late and finish early supports public transport use (public transport being slower than the private car). The opportunity to work while traveling also increases public transport use among workers with flexible work arrangements (WFH for part of the day) compared to workers who are required to travel to a workplace and follow a traditional schedule. Finally, as a fixed route/fixed schedule mode, public transport is perhaps seen as more suitable for (a) long-distance commuting, which can be stressful by car, 3 and (b) non-work-related travel by highly flexible people, who can work anywhere and are not constrained by schedules.
The COVID-19 outbreak introduced major fears of contamination in enclosed environments, prompting a substantial decline in public transport use (Beck and Hensher 2022; Hensher et al. 2022). For example, a study set in Australia reported that monthly trips on public transport fell by 80 percent and suggested that this was in part due to fear of contagion but also owed to an increased prevalence of WFH (Beck and Hensher 2022). But for those who worked outside the home and could not drive, transit remained an important means of mobility even during the pandemic period (Parker et al. 2021).
While the COVID-19 pandemic caused all types of travel to initially fall across many different travel work arrangements, the declines in travel by transit were greater among higher-income workers (Brough, Freedman, and Phillips 2021; Jiao and Azimian 2021). Wealthier and more educated neighborhoods lost more transit riders (Brough, Freedman, and Phillips 2021). Other factors that contributed to low public transport use during the pandemic included shrinkages in public transport services, restrictions on the maximum number of people on board, a general fear of COVID-19 infection, and a failure of public transport systems to properly adapt to a modified business environment (Campisi et al. 2022a).
As the pandemic is coming to an end, public transport demand is recovering; however, some researchers estimate that the share of transit commuters will likely remain lower than before the COVID-19 outbreak (Conway et al. 2020; Javadinasr et al. 2021). There will likely be inertia here as many communities are still living with COVID-19, as of this writing (Huang, Loo, and Axhausen 2023).
Car Ownership and Use
While teleworkers may have used public transport more than the general population, the car was still their primary mode in the period before the pandemic (de Abreu e Silva and Melo 2018a; Glogger, Zängler, and Karg 2008; Javadinasr et al. 2021). Tasks such as transporting children to school and shopping were mostly completed by car (de Abreu e Silva and Melo 2017; Zhu and Mason 2014). Also, it is the case that when one household member takes up WFH, this frees up his or her car which can then be used by other household members (Guerin 2021b). The COVID-19 pandemic strengthened the role of private cars in cities (Meena 2020; Zannat et al. 2021). In some places, car use kept growing even after the lockdowns were lifted (Javadinasr et al. 2022), due to the higher risk of catching the virus on public transport and the outward population move mentioned earlier.
However, the relationship between car ownership/use and residential location is complex, and there is self-selection at play, meaning that more car-dependent households are more likely to choose living in remote areas (Guerin 2021b). Most studies reviewed here controlled for trip characteristics in predicting mode choice, particularly car ownership and use. Controls included the number of trips per day, travel time, travel distance, trip timing (weekend vs. weekday), and number of vehicles per household. All of these were shown to have a positive association with car use (de Abreu e Silva and Melo 2017; Zhu and Mason 2014). One study found that even during the pandemic, the correlation between the number of cars per adult in a household and the probability of commuting by car as a driver remained (Hensher, Beck, and Balbontin 2021a).
Sustainability Implications of WFH
The section discusses the above literature findings in relation to environmental, social, and economic sustainability implications.
Environmental Sustainability
Travel behaviors of people WFH have clear implications for aggregate and local traffic flows, with impacts on transport pollutants and greenhouse gas emissions. To the extent that reduced peak hour travel is associated with better-flowing traffic, greenhouse gas emissions are reduced through greater efficiency in fuel combustion. More efficient combustion and, in some cases, reduced overall travel also have air quality impacts. From an environmental perspective, WFH can thus constitute a policy option for cities and regions struggling with air pollution, as well as congestion (Shabanpour et al. 2018). However, if travel (and traffic) is more spread throughout the day, rather than concentrated in a few peaks, the frequency and timing of public transport will need to change. Increasing off-peak public transport service might incentivize the uptake of more sustainable modes of travel among those working from home. However, this comes with higher financial costs, which may only be palatable to the public if combined with other strategies to reduce car-based travel. An unintended consequence of WFH may be the phenomenon of induced demand whereby reductions in congestion induce new car trips, thus negating initial gains in environmental sustainability.
While WFH may suppress mobility (i.e., the number of trips taken), any remaining commutes may become longer; people who work from home live up to 75 percent farther from their jobs on average. This is not ideal in terms of air quality, especially if those who work from home rely on a private car. Typically, longer commutes are found where the urban environment is characterized by sprawl. Strategies to densify cities while providing affordable housing next to major employment centers can enable shorter commutes for those with occupations that are amenable to WFH. In addition to longer commutes, WFH is sometimes found to result in longer, more frequent, and more car-based trips for non-work purposes (Kitou and Horvath 2006; Zhou and Hagen 2006). The impact depends on the proximity of the teleworker's home to schools, retail outlets, and other essential destinations (Thakuriah et al. 2012). For WFH to benefit the environment, easy access to non-work activities must be present. This is not a short-term solution and is further complicated by income inequalities which affect the quality and density of amenities that can be sustained in different locations.
Social Sustainability
Travel distance varies across the working population, with younger workers, female workers, and working mothers tending to travel more each day. WFH, particularly when combined with relocation to more spacious homes in remote and underserviced places, may further exacerbate travel inequalities at the societal level. Inequalities may grow at the intra-household level too, if relocation is driven by the needs or desires of only one household member (Einstein et al. 2023). For example, in a traditional family household, relocation may benefit the male partner by providing space for a home-office but lead to more travel related to house chores and childcare for the female partner. Another aspect to consider is that, while the studies in our sample focused on travel behavior, WFH could also lead to more stress among parents and other caretakers (Xiao et al. 2021).
For some groups, including rural workers, women with small children, and people with disabilities, WFH might be the only option (Ameri et al. 2022). On the positive side, WFH may mean, in locations that are already rich in amenities, greater utilization (and market potential for) local services. Rather than accessing services and amenities around the place of work or en route to/from work, people may engage more with their locality. This may enhance community well-being and public health.
Economic Sustainability
Off-peak travel can have tangible benefits for individual, household, and government budgets. Congestion is an externality with societal economic costs. By avoiding excessive work commutes, individuals can save on car maintenance, workplace parking, toll, and insurance costs, and free up time for leisure or work (Elldér 2017; Hensher, Beck, and Balbontin 2021a). A study from Europe estimated that people could save 178 Euros and 2 to 14 h per week on average if they travelled off-peak (Bieser et al. 2021; Glogger, Zängler, and Karg 2008).
The time and money formerly wasted sitting in traffic can be used for productive or recreational activities. Finally, off-peak travel helps cities “sweat their assets”—that is, make more efficient use of the existing road infrastructure networks. On the other hand, if commute-related travel is spread throughout the day, rather than concentrated into a few peaks, and if demand for public transport declines, this may reduce government revenue from public transport, potentially undermining its financial viability. Further, if workers move to the exurbs en masse if given the opportunity to WFH, businesses such as restaurants and shops may follow them. This might spur more private car use, ultimately resulting in higher infrastructure costs for all modes. Policymakers and planners should be proactive in responding to these shifts.
Another implication of WFH is a potential growth in active travel for non-work activities among teleworkers when compared to office-based workers. This may lower public health expenditures, as active travel is known to promote good health (Besser and Dannenberg 2005) and reduce the risk of premature death (Davis et al. 2005). While we did not examine the comparable costs of WFH, some studies in this review concluded that it increases productivity and job satisfaction (Criscuolo et al. 2020; Moglia, Hopkins, and Bardoel 2021).
Conclusion
This systematic literature review of travel behavior before, during, and after the COVID-19 pandemic shows that there can be environmental, social, and economic benefits associated with WFH. Reductions in peak-hour travel and in the number of commuting trips positively impact air quality and reduce greenhouse gas emissions (Akbari and Hopkins 2019; Shabanpour et al. 2018). The social benefits of WFH include a better work–life balance and more time for exercise, recreation, and community engagement. WFH can bring about economic benefits to individuals and households in the form of savings on fuel, parking, tolls, and car maintenance costs. While beneficial from a household perspective, large-scale WFH may also have implications for local government finances or economic activities that sustain other employment (Vij et al. 2021). Finally, WFH can enable a better flow of traffic, thus reducing congestion costs and road investment costs. Crucially, the latter impact depends on the scale of the adoption of WFH and the extent to which WFH generates alternative mode choice decisions.
However, our review also shows that attaining these benefits is not straightforward, partly because current urban patterns were not created with WFH in mind. Greater social acceptance of WFH in the post-COVID period will likely generate a step-change toward more permanent adoption of WFH as a preferred mode of organizing (some types of) employment. However, to sustain and scale up the sustainability impacts arising from WFH changes to transport and land-use planning and investment patterns will be needed. Existing plans should be updated based on flexible principles that go beyond the classic mono- or poly-centric city models.
Flexibility implies a high level of responsiveness on the part of the public sector. New working and living hubs might crop up in unexpected locations, which might then need to be quickly provided with urban amenities such as parks, shops, schools, surgeries, and eateries. Transport systems that are designed to satisfy the peak hour travel demand must adapt to teleworkers’ travel behavior, which is lower and distributed throughout the day and the week (Caldarola and Sorrell 2022).
There is a risk that lifestyle adjustments offset any gains associated with WFH. For example, those who work from home frequently may relocate to take advantage of cheaper housing prices in outer suburbs, which can then lead to longer commutes and non-work-related travel.
Overall, WFH cannot effectively act as a sustainability enabler without being accompanied by wider urban developmental strategies. The evidence from our review suggests that individuals with WFH arrangements tend to have longer commuting distances and live in larger dwellings compared to those working out of their workplace. It remains unclear whether people adopt WFH to avoid long commutes or if workers relocate to more distant places after being given the opportunity to WFH. In the latter scenario, WFH would be the cause of further urban sprawl and automobility. Either way, planning practices such as the 15-minute city (Moreno et al. 2021) or Transit-Oriented Development (Pojani and Stead 2018) would be desirable. A denser and more compact urban form should be accompanied by provisions for affordable housing in locations that work for different WFH groups (Board 2023).
Implications for Policy and Practice
Much land-use and transport planning practice remains centered around traditional ways of working and commuting (Mualam, Israel, and Max 2022). To harness WFH's environmental, social, and economic sustainability potential, urban planning will need to adapt and change. Several policy options, listed below, could assist cities in their efforts to embrace WFH:
Adapting public transport service. During the preparation of transport plans, planners should consider (a) reductions in commute-related travel, (b) shifts in travel hours, and (c) increases in walking and cycling due to WFH. To accommodate these changes, public transport services may need to be more distributed throughout the day rather than concentrated in the commute peaks. Public transport networks may need to extend to outer suburbs, perhaps in the form of feeder buses. Further, public transport funding may need to be reallocated to providing better infrastructure for walking and cycling in order to accommodate a growing demand for these travel modes. Supply of housing and amenities aligned with WFH practices. As people move to new, sometimes more remote, locations to take up WFH (Mualam, Israel, and Max 2022), pressure on regional and ex-urban housing markets is expected to increase (Nygaard and Parkinson 2021). To avoid this outcome, planning agencies may need to (a) introduce policies that promote compact, mixed-use development and (b) provide affordable housing options within the existing urban footprint. Designing more spacious apartments and establishing telework centers in cities would support WFH practices and promote urban sustainability. Integrated housing and transport planning in regions and ex-urbs. New housing development needs to be coupled with transport options, amenities, and flexible work infrastructure to shift people away from cars, provide more equal WFH opportunities, and narrow existing socioeconomic divides. Mixed and flexible zoning in city centers to allow for the adaptive reuse of empty office spaces. Financial implications. Reduced commuting will affect local infrastructure expenditure. Furthermore, higher digital services and technology investments might be needed (e.g., broadband and Wi-Fi access).
Directions for Future Research
Further research is needed to identify the long-term impact of residential location choices on the frequency of travel, both for work- and non-work-related activities. Importantly, the study found a considerable lack of in-depth qualitative research around teleworkers’ travel behaviors. It is not clear how much WFH shapes how and when people travel to work, or whether WFH might be considered a travel mode choice in its own right, and a sustainable one at that. We recommend that WFH be considered as a commuting mode-choice and explicitly treated as such in future research studies. 4 Other re-conceptualizations of WFH are possible too. For instance, WFH may be considered as a sustainable lifestyle choice (as opposed to a practical or employer-driven solution). Research that provides an in-depth understanding around the mechanisms and dynamics that are observed at the macro-scale is still needed. Studies should help to uncover the WFH circumstances and/or social practices that catalyze or undermine sustainable mobility outcomes.
Supplemental Material
sj-docx-1-jpl-10.1177_08854122241259414 - Supplemental material for Sustainability Implications of Working-From-Home (WFH): A Systematic Review of the Travel Behavior Literature
Supplemental material, sj-docx-1-jpl-10.1177_08854122241259414 for Sustainability Implications of Working-From-Home (WFH): A Systematic Review of the Travel Behavior Literature by Tmnit Hailu Halefom, Magnus Moglia, Christian (Andi) Nygaard and Dorina Pojani in Journal of Planning Literature
Footnotes
Acknowledgments
The authors would like to acknowledge the Swinburne University of Technology, and the Australian Housing and Urban Research Institute (AHURI) for their financial support (stipend and research support of the primary author).
Declaration of Conflicting Interests
The author(s) declared no potential conflicts of interest with respect to the research, authorship, and/or publication of this article.
Funding
The author(s) received no financial support for the research, authorship, and/or publication of this article.
Supplemental Material
Supplemental material for this article is available online.
Notes
Author Biographies
References
Supplementary Material
Please find the following supplemental material available below.
For Open Access articles published under a Creative Commons License, all supplemental material carries the same license as the article it is associated with.
For non-Open Access articles published, all supplemental material carries a non-exclusive license, and permission requests for re-use of supplemental material or any part of supplemental material shall be sent directly to the copyright owner as specified in the copyright notice associated with the article.