
Abstract
Background
Misinterpretations of the p-value in null-hypothesis statistical testing are common. We aimed to determine the implications of observed p-values in critical care randomized controlled trials (RCTs).
Methods
We included three cohorts of published RCTs: Adult-RCTs reporting a mortality outcome, Pediatric-RCTs reporting a mortality outcome, and recent Consecutive-RCTs reporting p-value ≤.10 in six higher-impact journals. We recorded descriptive information from RCTs. Reverse Bayesian implications of obtained p-values were calculated, reported as percentages with inter-quartile ranges.
Results
Obtained p-value was ≤.005 in 11/216 (5.1%) Adult-RCTs, 2/120 (1.7%) Pediatric-RCTs, and 37/90 (41.1%) Consecutive-RCTs. An obtained p-value .05–.0051 had high False Positive Rates; in Adult-RCTs, minimum (assuming prior probability of the alternative hypothesis was 50%) and realistic (assuming prior probability of the alternative hypothesis was 10%) False Positive Rates were 16.7% [11.2, 21.8] and 64.3% [53.2, 71.4]. An obtained p-value ≤.005 had lower False Positive Rates; in Adult-RCTs the realistic False Positive Rate was 7.7% [7.7, 16.0]. The realistic probability of the alternative hypothesis for obtained p-value .05–.0051 (ie, Positive Predictive Value) was 28.0% [24.1, 34.8], 30.6% [27.7, 48.5], 29.3% [24.3, 41.0], and 32.7% [24.1, 43.5] for Adult-RCTs, Pediatric-RCTs, Consecutive-RCTs primary and secondary outcome, respectively. The maximum Positive Predictive Value for p-value category .05–.0051 was median 77.8%, 79.8%, 78.8%, and 81.4% respectively. To have maximum or realistic Positive Predictive Value >90% or >80%, RCTs needed to have obtained p-value ≤.005. The credibility of p-value .05–.0051 findings were easy to challenge, and the credibility to rule-out an effect with p-value >.05 to .10 was low. The probability that a replication study would obtain p-value ≤.05 did not approach 90% unless the obtained p-value was ≤.005.
Conclusions
Unless the obtained p-value was ≤.005, the False Positive Rate was high, and the Positive Predictive Value and probability of replication of “statistically significant” findings were low.
Keywords
In 2005 Ioannidis claimed “most published research findings are false,” pointing out that “the high rate of nonreplication… is a consequence of the convenient, yet ill-founded strategy of claiming conclusive research findings solely on the basis of a single study assessed by formal statistical significance, typically for a p-value less than .05.” 1 (p0696) In 1999 Goodman discussed the “p-value fallacy… the illusion that conclusions can be produced with certain “error rates’ without consideration of information from outside the experiment [ie, biological plausibility and prior evidence]….” 2 (p995) The p-value is the probability of observing the experimental data or more extreme data under the assumption that the null hypothesis (Ho) is correct. 3 Misinterpretations of the p-value as used in null-hypothesis statistical testing (NHST) are common, including that the p-value is the probability the Ho is true (rather, it assumes the Ho is true), that chance alone produced the observed association (rather, it assumes chance was operating alone), or that if you reject Ho because P ≤ .05, the chance you are in error is 5% (rather, this chance is much higher). 3 The only way to determine hypotheses probabilities is by using Bayesian inference methods. 6 Table 1 gives definitions of terms and methods used in this study.
Glossary of Terminology and Methods Used.

Bayes theorem links the posterior probability of the alternative hypothesis H1, (Pr[H1]│data) to the prior Pr(H1) using the Bayes Factor (BF), the probability of the observed data given the alternative hypothesis H1 divided by the probability of the observed data given the null hypothesis (Ho), that is Pr(data│H1)/Pr(data│Ho). 7 Formally, the Posterior Odds of H1 = BF X Prior Odds of H1, that is: Pr(H1│data)/Pr(Ho│data) = BF X Pr(H1)/Pr(Ho). 12 Bayesian inference has been criticized because the Prior can be subjective (although this is not necessarily so), informed by researchers’ beliefs, scientific consensus, and evidence from similar research questions in the same field. 13 Approaches to help resolve this subjectivity “problem” have been suggested that involve so-called “reversing of the Bayesian argument”, including: one can convert the observed p-value to a minimum BF (the strongest possible evidence against Ho given the data obtained), calculate the Prior Pr(H1) necessary for the observed p-value to indicate a desired false positive rate (FPR), or calculate the minimum FPR given a specified Prior Pr(H1).7,14 The approach is based on the fact that “it is entirely justifiable to “flip” Bayes's Theorem around;” 12 (p4) “the basic idea is to invert Bayes’ theorem: a specified posterior is combined with the data to obtain the Reverse-Bayes prior, which is then used for further inference,” 12 (p21) eg, this “allows the assessment of new findings [ie, the data] on the basis of whether the resulting prior is reasonable in the light of existing knowledge [ie, prior evidence].” 12 (p2)
We aimed to describe the implications of observed p-values in published critical care randomized controlled trials (RCTs) in order to demonstrate the importance of the p-value fallacy. We find that, in three cohorts of published RCTs, only those RCTs that obtained a p-value ≤.005 might be considered reliable findings.
Materials and Methods
Included Randomized Trials
As only publicly available published data was recorded, this study did not require ethics board approval.
First, we examined the cohort of 216 human adult multicenter RCTs reviewed by others [“Adult-RCTs”]. 17 We included all 57 RCTs that obtained p-value ≤.10. For Analysis of Credibility (see below) we included another 14 RCTs that obtained p-value .11–.20.
Second, we searched the cohort of human pediatric RCTs at https://picutrials.net using search words “mortality” or “multicenter.’ 18 We examined the abstracts (and full text if necessary) to include any RCT with a reported obtained p-value for a mortality outcome [“Pediatric-RCTs”]. Of 120 eligible RCTs, we included all 25 RCTs that obtained a p-value ≤.10. For Analysis of Credibility we included another 13 RCTs that obtained p-value .11–.20.
Third, we screened the title and abstract of all publications in 6 journals (NEJM, JAMA, Critical Care, Critical Care Medicine, Pediatric Critical Care Medicine, and Intensive Care Medicine) starting backwards from January 2019 for eligibility, until 15 publications were included from each journal. We used a detailed study instruction manual to guide screening and data collection (Supplemental Material 1). Eligibility was defined as: topic involves solely or predominantly (>80%) critically ill patients; RCT comparing groups with respect to some interventional exposure to find an outcome effect size with an explicitly reported p-value; and full publication. We excluded studies if the primary outcome had p-value ≥.10, or an exact p-value for the primary outcome was not reported (often because only a “less than” p-value was provided). This resulted in 90 “Consecutive-RCTs.”
From each included study we obtained descriptive information, more detailed for the Consecutive-RCTs, and calculated outcomes as described in the detailed instruction manual (see Supplemental Material 1). We recorded the category of primary outcome; study size; study outcomes; effects sizes (ES); power calculation numbers if reported; and the obtained p-value. In the Consecutive-RCTs we also recorded the main secondary outcome and associated information as above. When an ES was not reported, we calculated this based on the reported values in the published study.
Outcomes
First, we described the categorization of obtained p-values into 1) ≤.005, 2) .0051 to .05, and 3) .051 to .10. This was done because there have been calls to lower the threshold for “statistical significance” to p ≤ .005.19,20 A two-sided p-value .05 corresponds to a BF in favor of H1 ranging from 2.5 to 3.4 “under reasonable assumptions about H1”, which is “weak to very weak” evidence. 19 (p7) A two-sided p-value .005 corresponds to a BF in favor of H1 ranging from 14 to 26, which is “substantial to strong evidence.” 19 (p7) Regardless of power, with a prior Pr(H1) 10% and p-value threshold .05 the FPR is >33%; reducing the p-value threshold to .005 “would reduce this minimum FPR to 5%… over a wide range of statistical powers.” 19 (p7) The false negative rate does not increase if sample sizes are increased to keep power constant; to maintain “80% power would require an increase in sample sizes of about 70%.” 19 (p7)
Second, we calculated reverse Bayesian argument values suggested by Colquhoun, assuming study power was ∼80%, based on the evidence provided by the experiment (ie, the observed p-value), and using the online calculator.8,9 1) The likelihood ratio of H1/Ho is the relative likelihood of two hypotheses (ie, a BF). 2) The prior Pr(H1) required to have a FPR (the probability that a result which is “statistically significant” at a specified p-value is a false positive result) of 5%. 3) The minimum FPR, assuming a prior Pr(H1) 50% (ie, equipoise). 4) The realistic FPR, assuming a prior Pr(H1) 10%.
Third, we calculated the reverse Bayesian argument values suggested by Berger et al. based on the evidence provided by the experiment (ie, the observed p-value).10,11 1) The Bayes Factor Bound (BFB) is an upper bound on the BF (ie, the strongest case for the H1 relative to the Ho, given the data obtained). 2) The highest possible posterior Pr(H1│data), PrU(H1│obtained p), assuming the prior Pr(H1) 50% (ie, equipoise). 3) The realistic posterior Pr(H1│data), PrR(H1│obtained p), assuming the prior Pr(H1) 10%. These Pr(H1│p) can be thought of as positive predictive values (PPV) of the statistically significant finding.
Fourth, we calculated the reverse Bayesian argument values suggested by Matthews, called “Analysis of Credibility.”15,16 This determined whether the observed data provided Bayesian credible evidence for the H1 of a nonzero effect. The range of prior effect sizes (critical prior interval, CPI) were calculated which, when combined with the likelihood (based on the obtained 95% CI of effect size in the study), lead to a posterior range of effect sizes that just excluded no effect at the Bayesian 95% credibility level. 1) For obtained p ≤ .05, the skepticism limit (SL) was calculated; if prior evidence supported (a lower bound of) effect sizes ≥SL, the study provided credible evidence for a nonzero effect (ie, was enough to defeat the skepticism CPI limit). 2) For obtained p > .05, the advocacy limit (AL) was calculated; if prior evidence supported effect sizes lying wholly within the advocacy CPI (from no effect to AL), the study provided credible evidence of a nonzero effect (despite statistical non-significance in the particular study).
Fifth, we determined the implications of the obtained p-values for a replication study.21,22 1) The 80% P-interval, ie, the 10th and 90th percentile of expected replication p-values given by a replication study using the same sample size. 2) The probability that a replication study using the same sample size would obtain a p ≤ .05.
Statistics
We presented descriptive results using counts and percentages, median, interquartile range [IQR], and range (minimum to maximum) as appropriate. We explored predictors of p-value category using univariate and multiple variable logistic regressions for each cohort of RCTs. The possible predictors for univariate analyses were pre-specified: field of sepsis (the most common category for Adult-RCTs and Pediatric-RCTs) or respiratory (the most common category for Consecutive-RCTs), mortality as primary outcome, study year 2011 to 2019 (for Adult-RCTs and Pediatric-RCTs), multicenter study or number of centers (>20 for Adult-RCTs, >10 for Pediatric-RCTs), number of patients, mortality in control group (for Adult-RCTs and Pediatric-RCTs), study RR (for studies with p ≤ .10 in Adult-RCTs, p ≤ .20 in Pediatric-RCTs, and with categorical outcome in Consecutive-RCTs), and higher mortality in intervention group (for Adult-RCTs with p ≤ .05). For the Consecutive-RCTs we added study continent of Europe (47.8% of included studies), higher impact journal (NEJM or JAMA), species non-human-animal (NHA), and standardized mean difference (d; in studies with continuous outcomes). In the multiple regressions variables were included if their p-value in the univariate regression was <.10 (a common yet somewhat arbitrary method used for exploratory analyses). We planned to force into the multiple regressions “multicenter study” (for Pediatric-RCTs and Consecutive-RCTs), and NHA (for Consecutive-RCTs). We considered p ≤ .05 as statistically suggestive in the multiple regressions.
Results
The 216 Adult-RCTs and 120 Pediatric-RCTs are described in E- Tables 1 and 2 (Supplemental Material 2). We screened 269 studies in 6 journals, and after exclusions (E- Table 3, Supplemental Material 2) included 90 Consecutive-RCTs (21 [23%] in NHA) described in E- Table 4 (Supplemental Material 2).
P-Value Categories Obtained in the Cohorts of Critical Care RCTs.
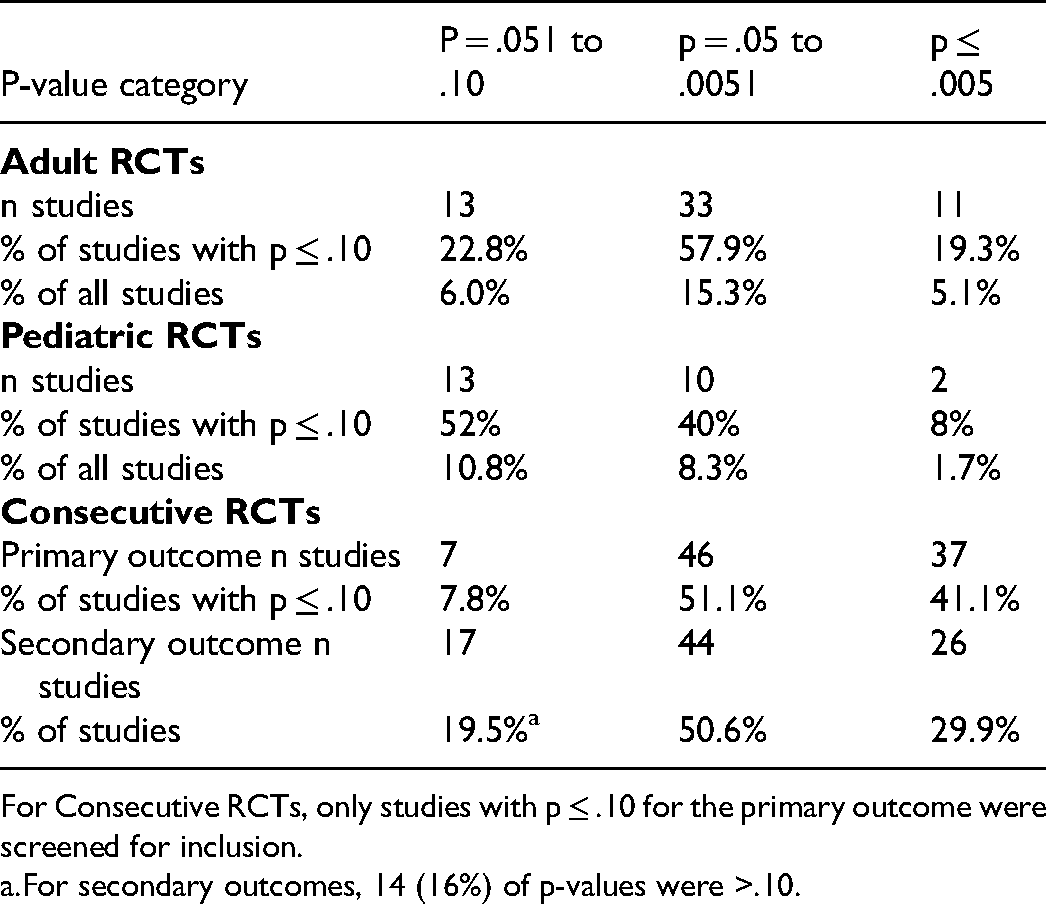
For Consecutive RCTs, only studies with p ≤ .10 for the primary outcome were screened for inclusion.
For secondary outcomes, 14 (16%) of p-values were >.10.
Reverse Bayesian Implications of the Obtained p-Values ≤.10 in Adult RCTs in the Field of Critical Care Research.
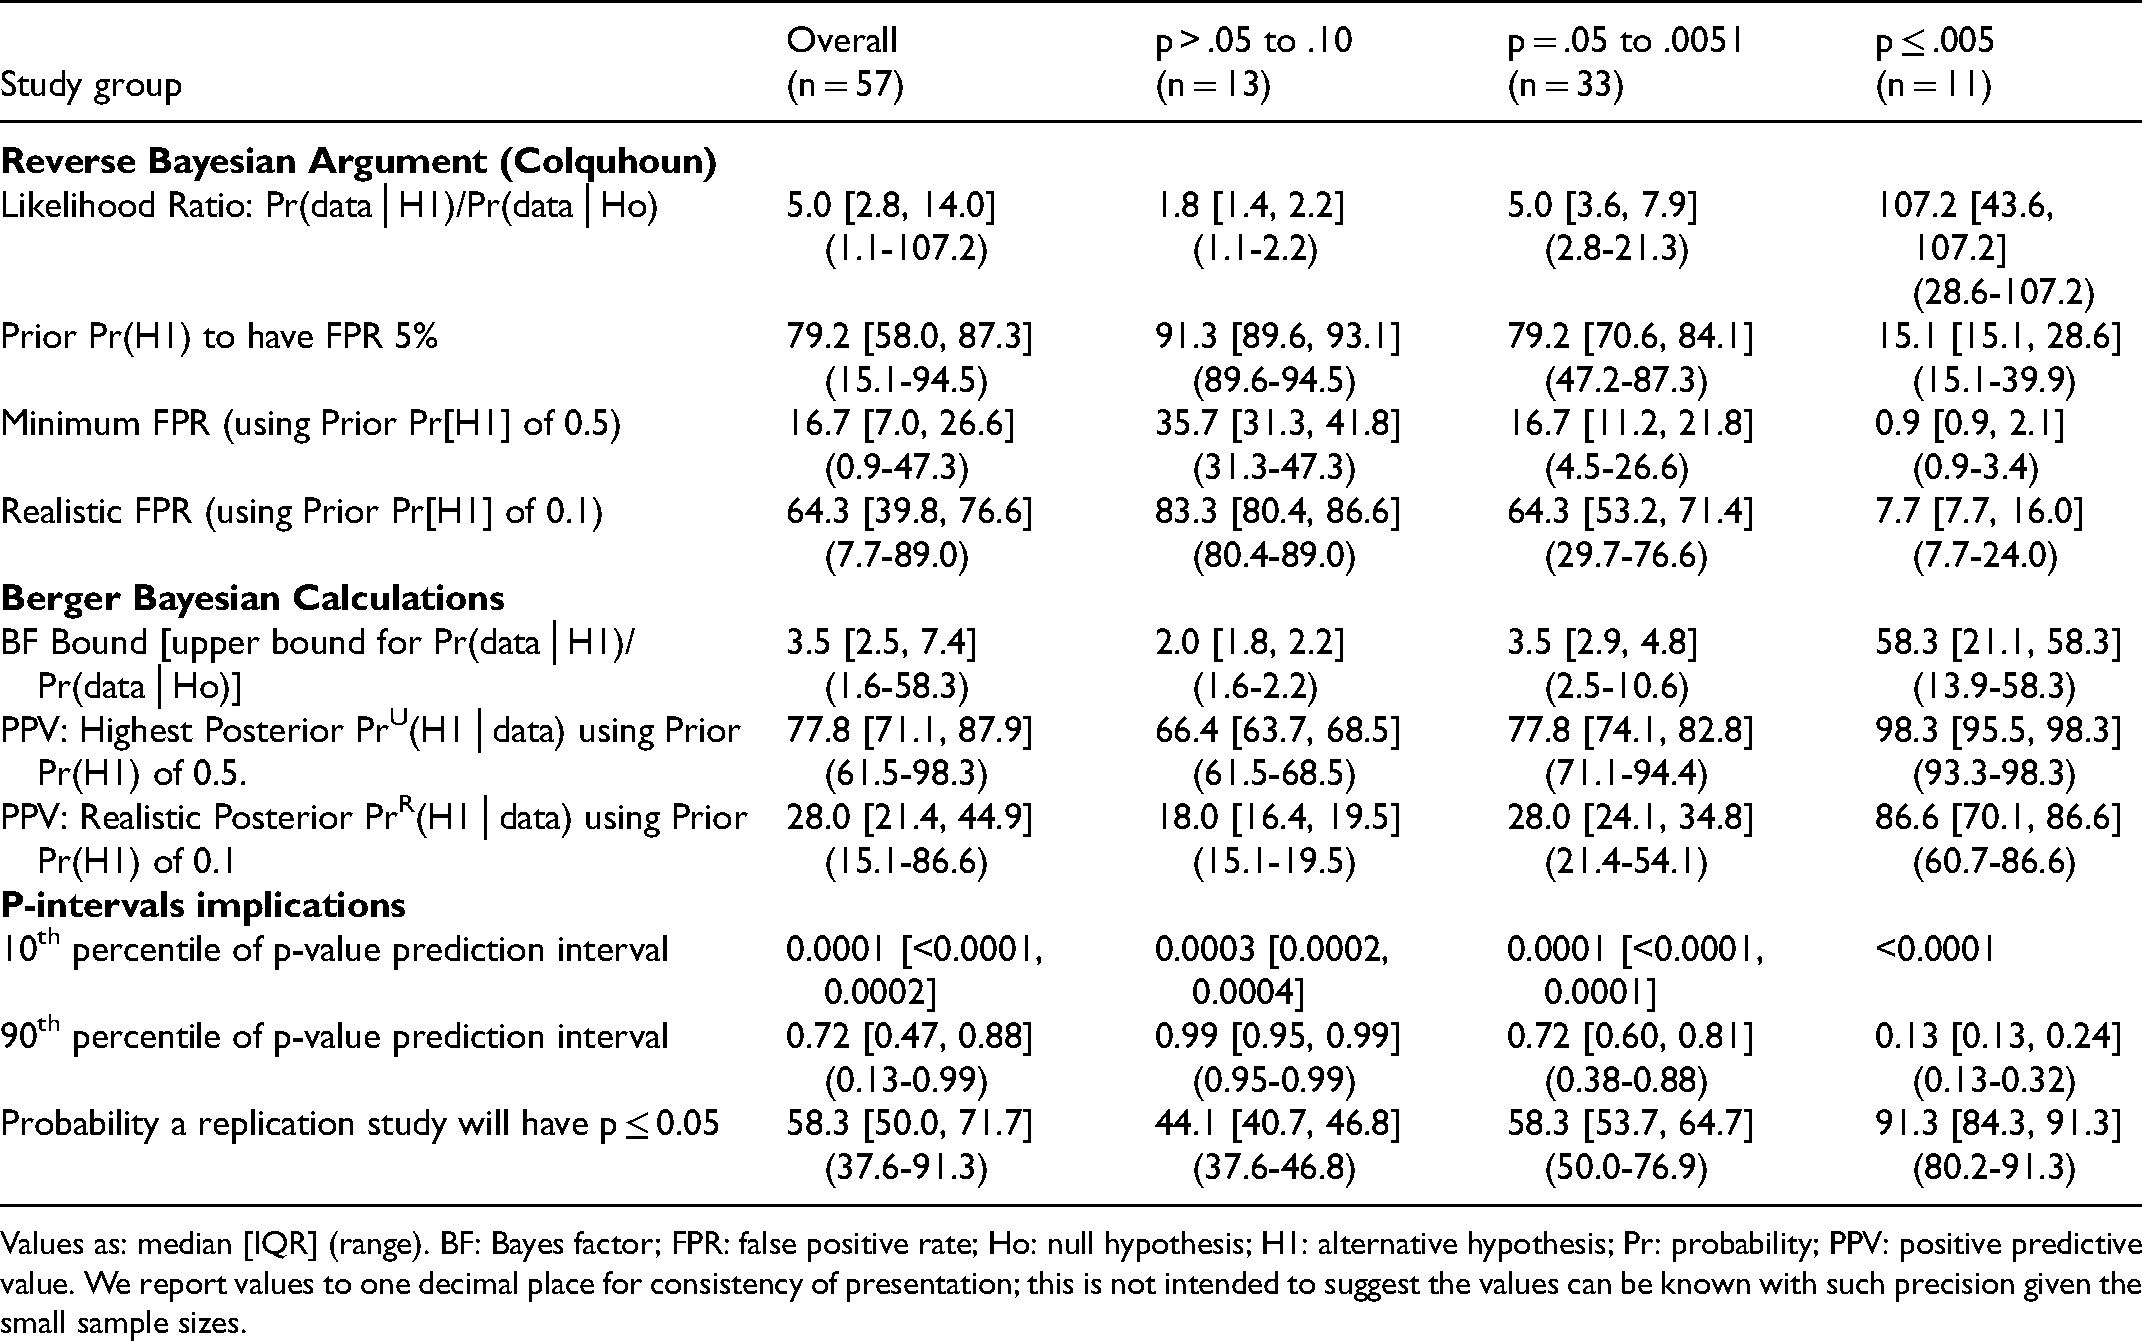
Values as: median [IQR] (range). BF: Bayes factor; FPR: false positive rate; Ho: null hypothesis; H1: alternative hypothesis; Pr: probability; PPV: positive predictive value. We report values to one decimal place for consistency of presentation; this is not intended to suggest the values can be known with such precision given the small sample sizes.
Reverse Bayesian Implications of the Obtained p-Values ≤0.10 in Pediatric RCTs in the Field of Critical Care Research.
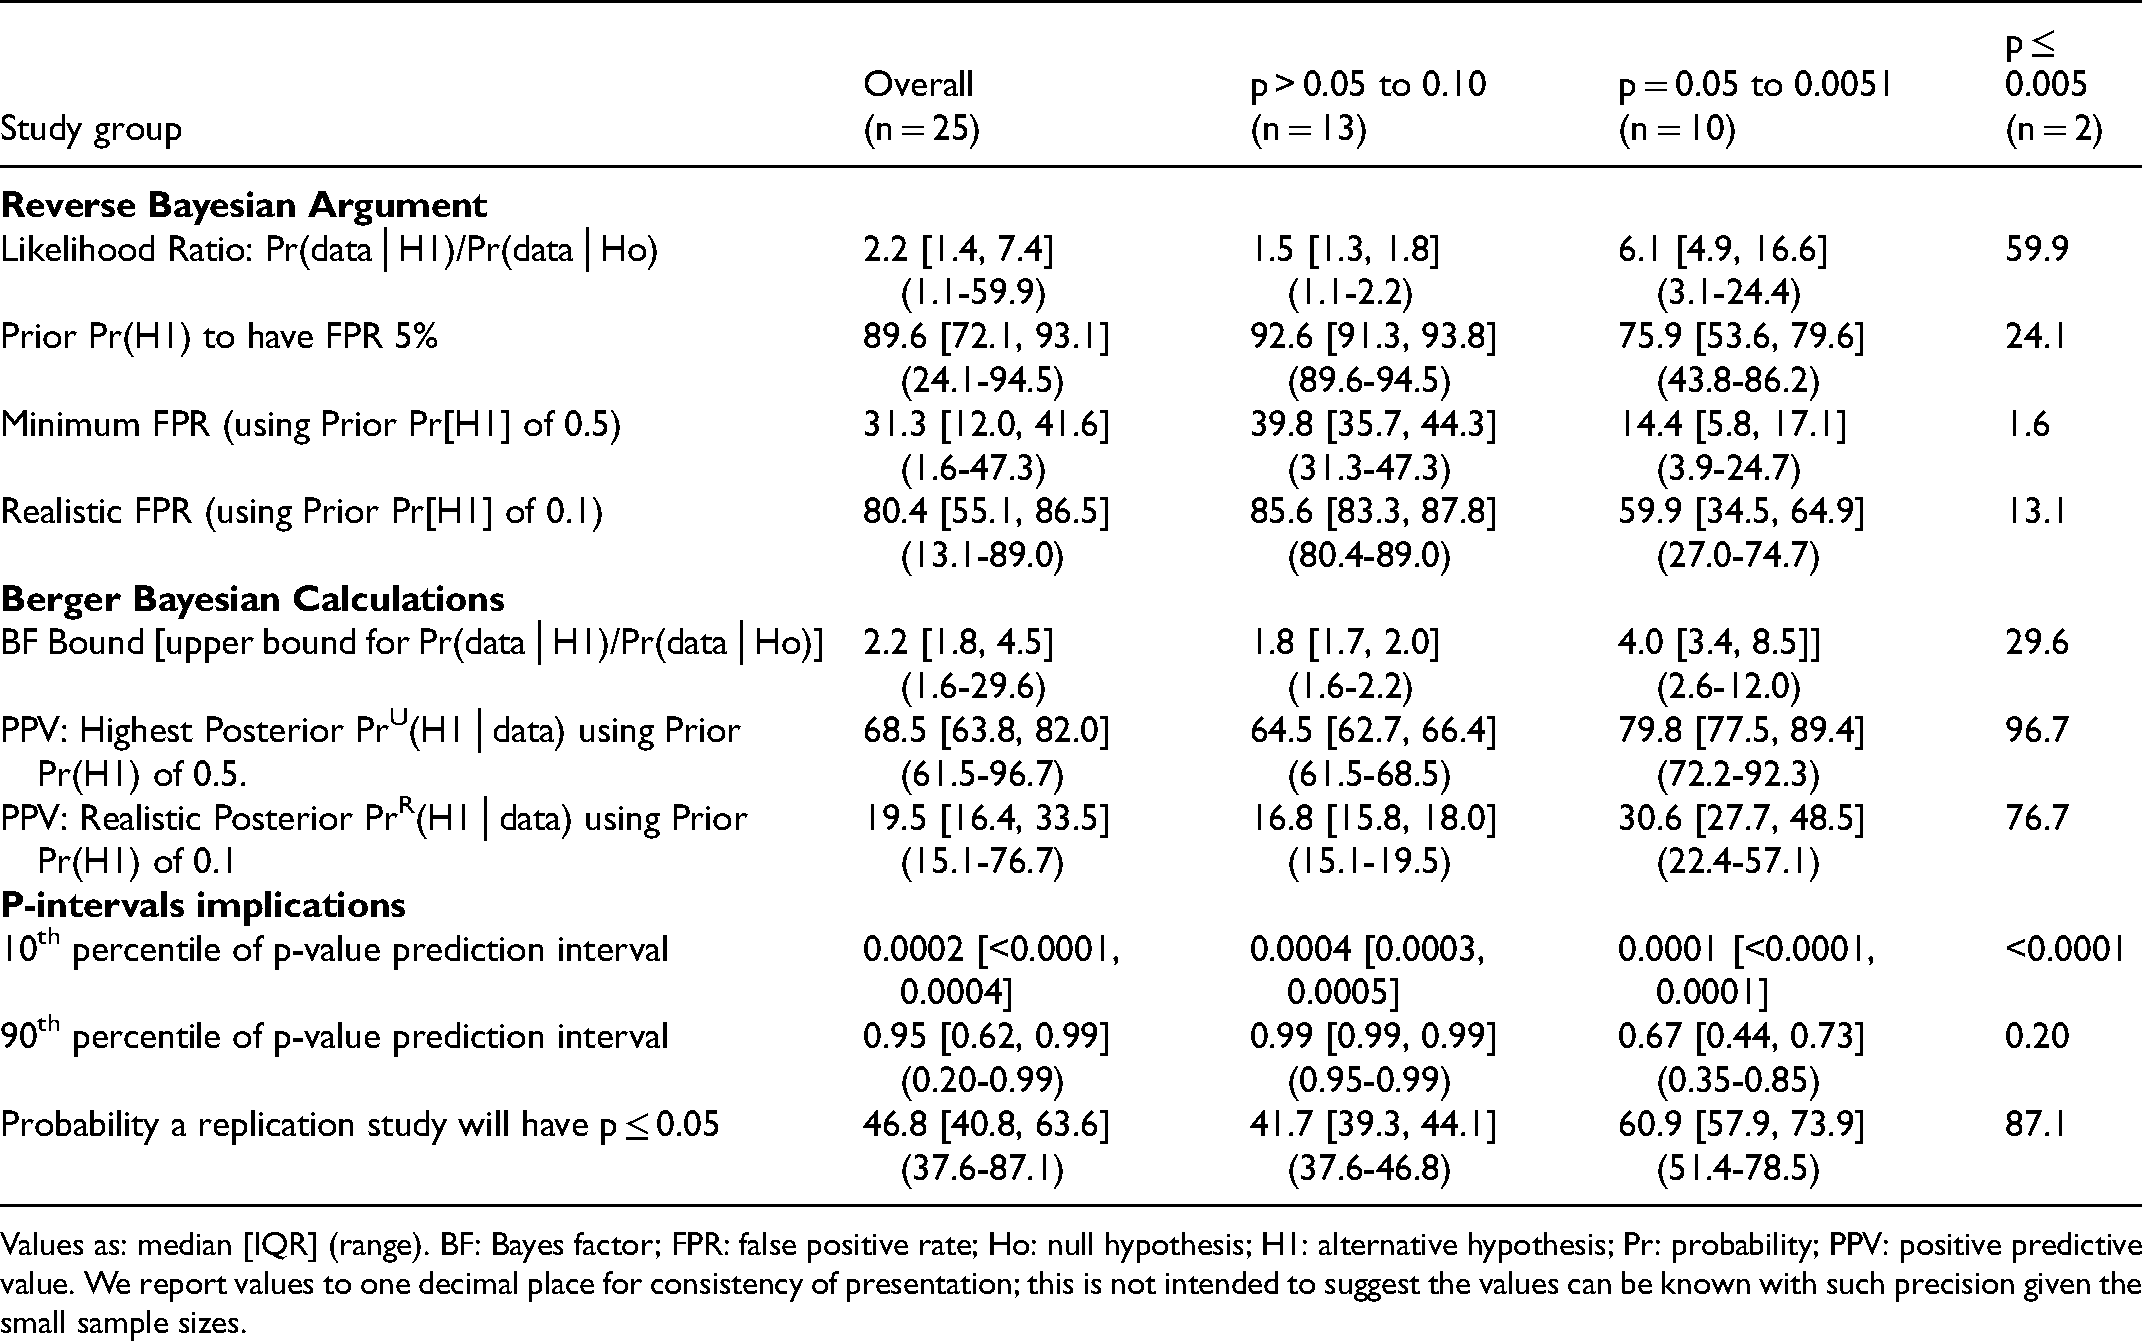
Values as: median [IQR] (range). BF: Bayes factor; FPR: false positive rate; Ho: null hypothesis; H1: alternative hypothesis; Pr: probability; PPV: positive predictive value. We report values to one decimal place for consistency of presentation; this is not intended to suggest the values can be known with such precision given the small sample sizes.
Outcome: P-Value Categories
The obtained p-value was ≤.005 in 11/216 (5.1%) of Adult-RCTs, 2/120 (1.7%) of Pediatric-RCTs, and 37/90 (41.1%) of Consecutive-RCTs (that were screened to have a p-value ≤.10) (Table 2). Of RCTs having p-value ≤.05, the proportions that had p-value ≤.005 were 25%, 17%, and 45% respectively.
There were no consistent predictors of p-value category in Adult-RCTs, Pediatric-RCTs, and Consecutive-RCTs [E- Tables 5–7, Supplemental Material 2]. Factors consistently not associated with p-value category included field of study, multicenter or number of centers, number of patients, study year, and for Consecutive-RCTs, high-impact journal, NHA subjects, and observed ES.
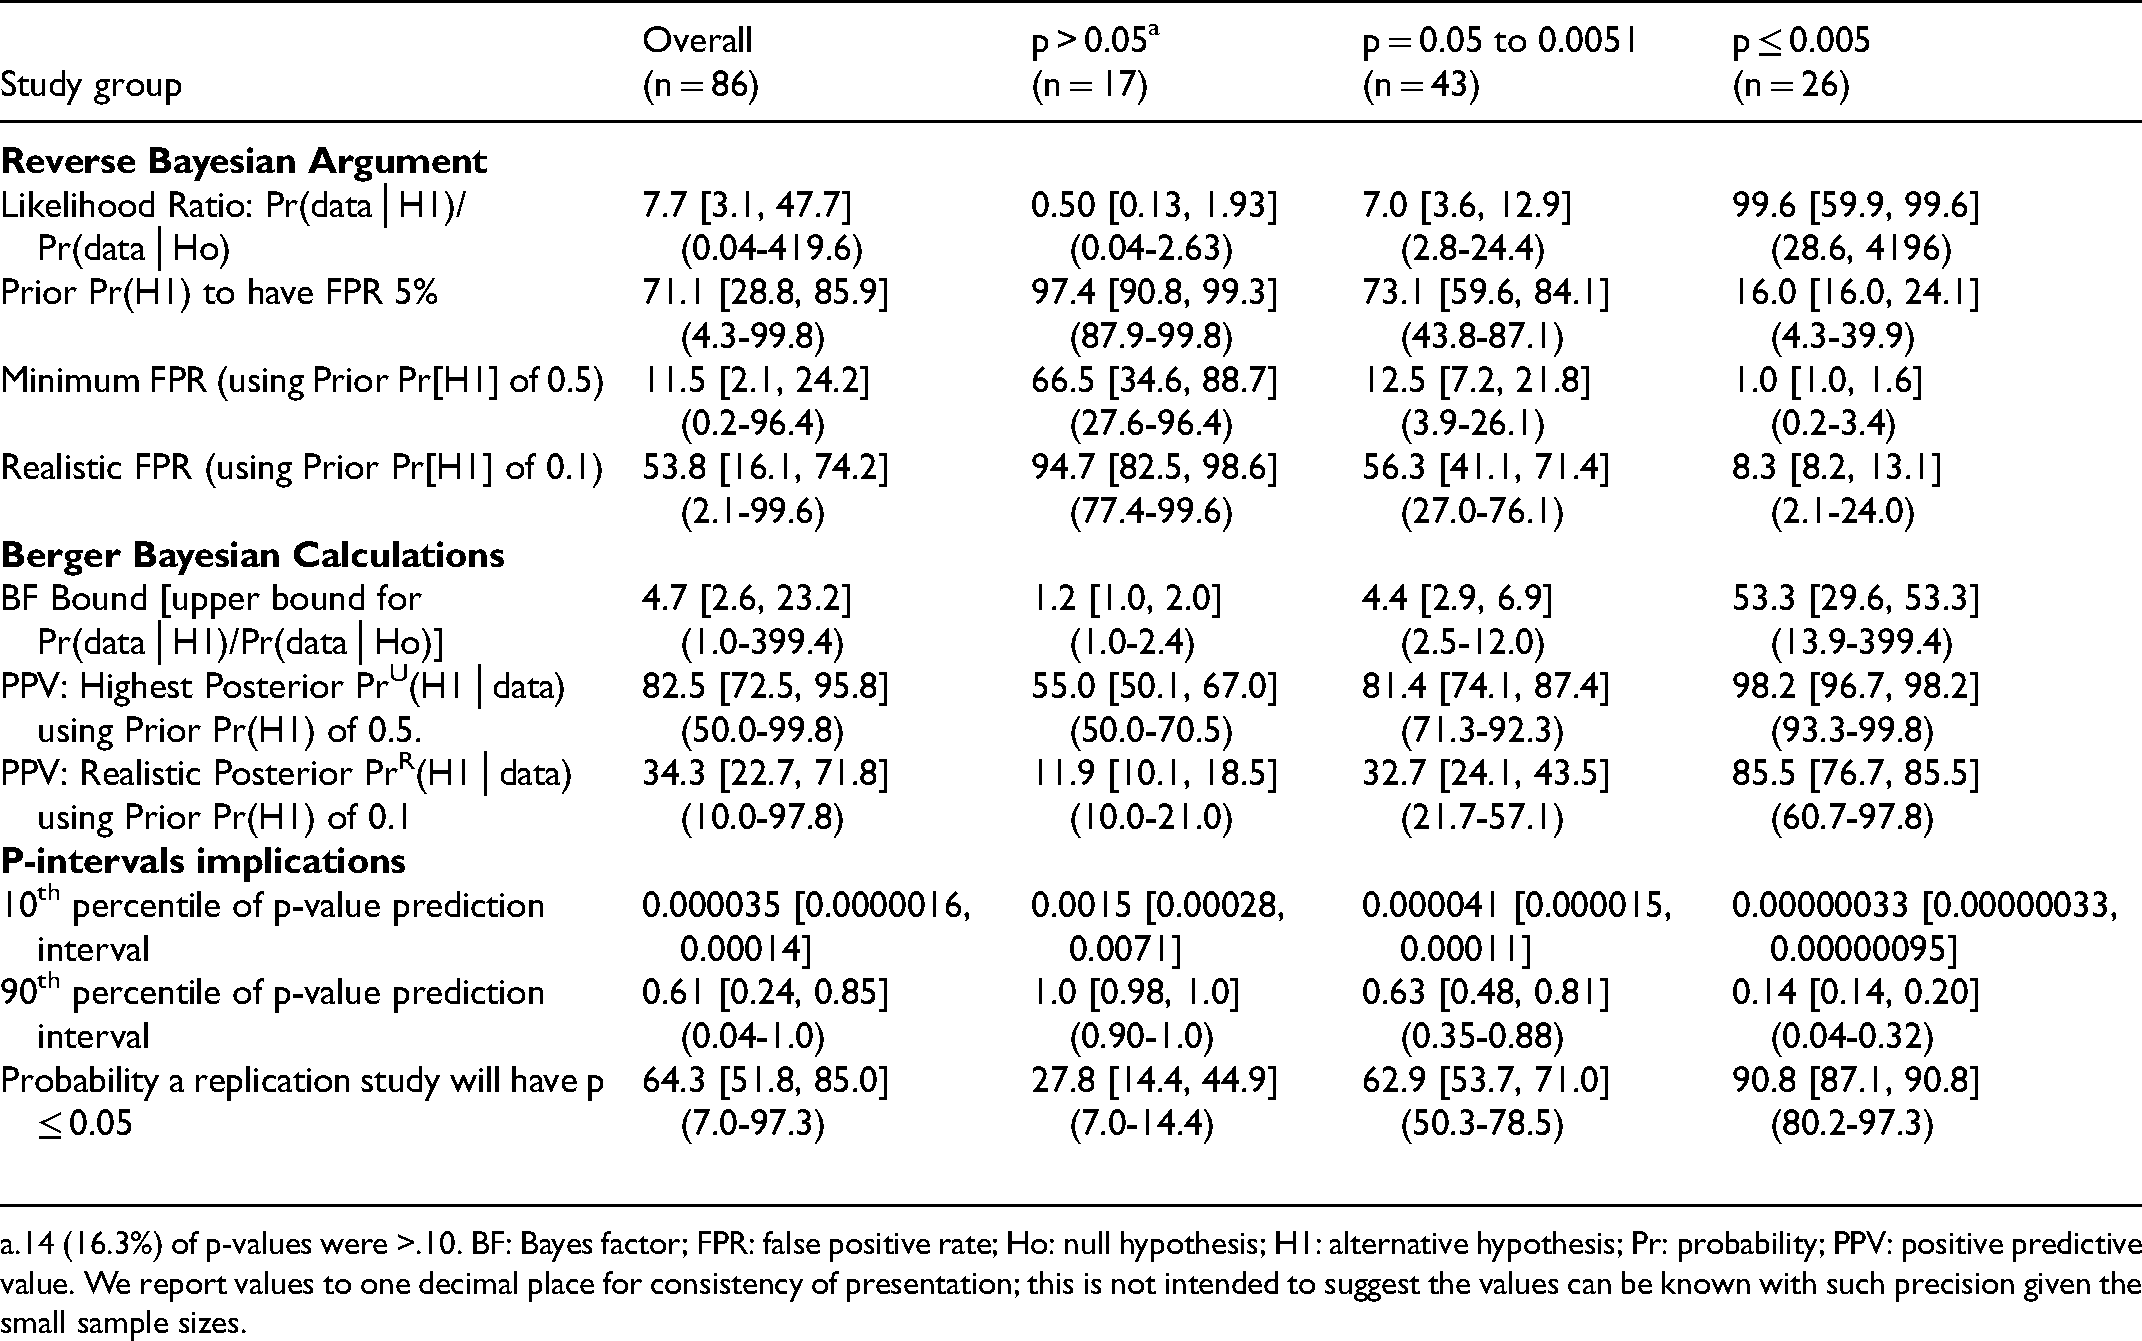
Reverse Bayesian Implications of the Obtained p-Values ≤ 0.10 for Primary Outcomes in Consecutive RCTs Recently Published in the Field of Critical Care Research.
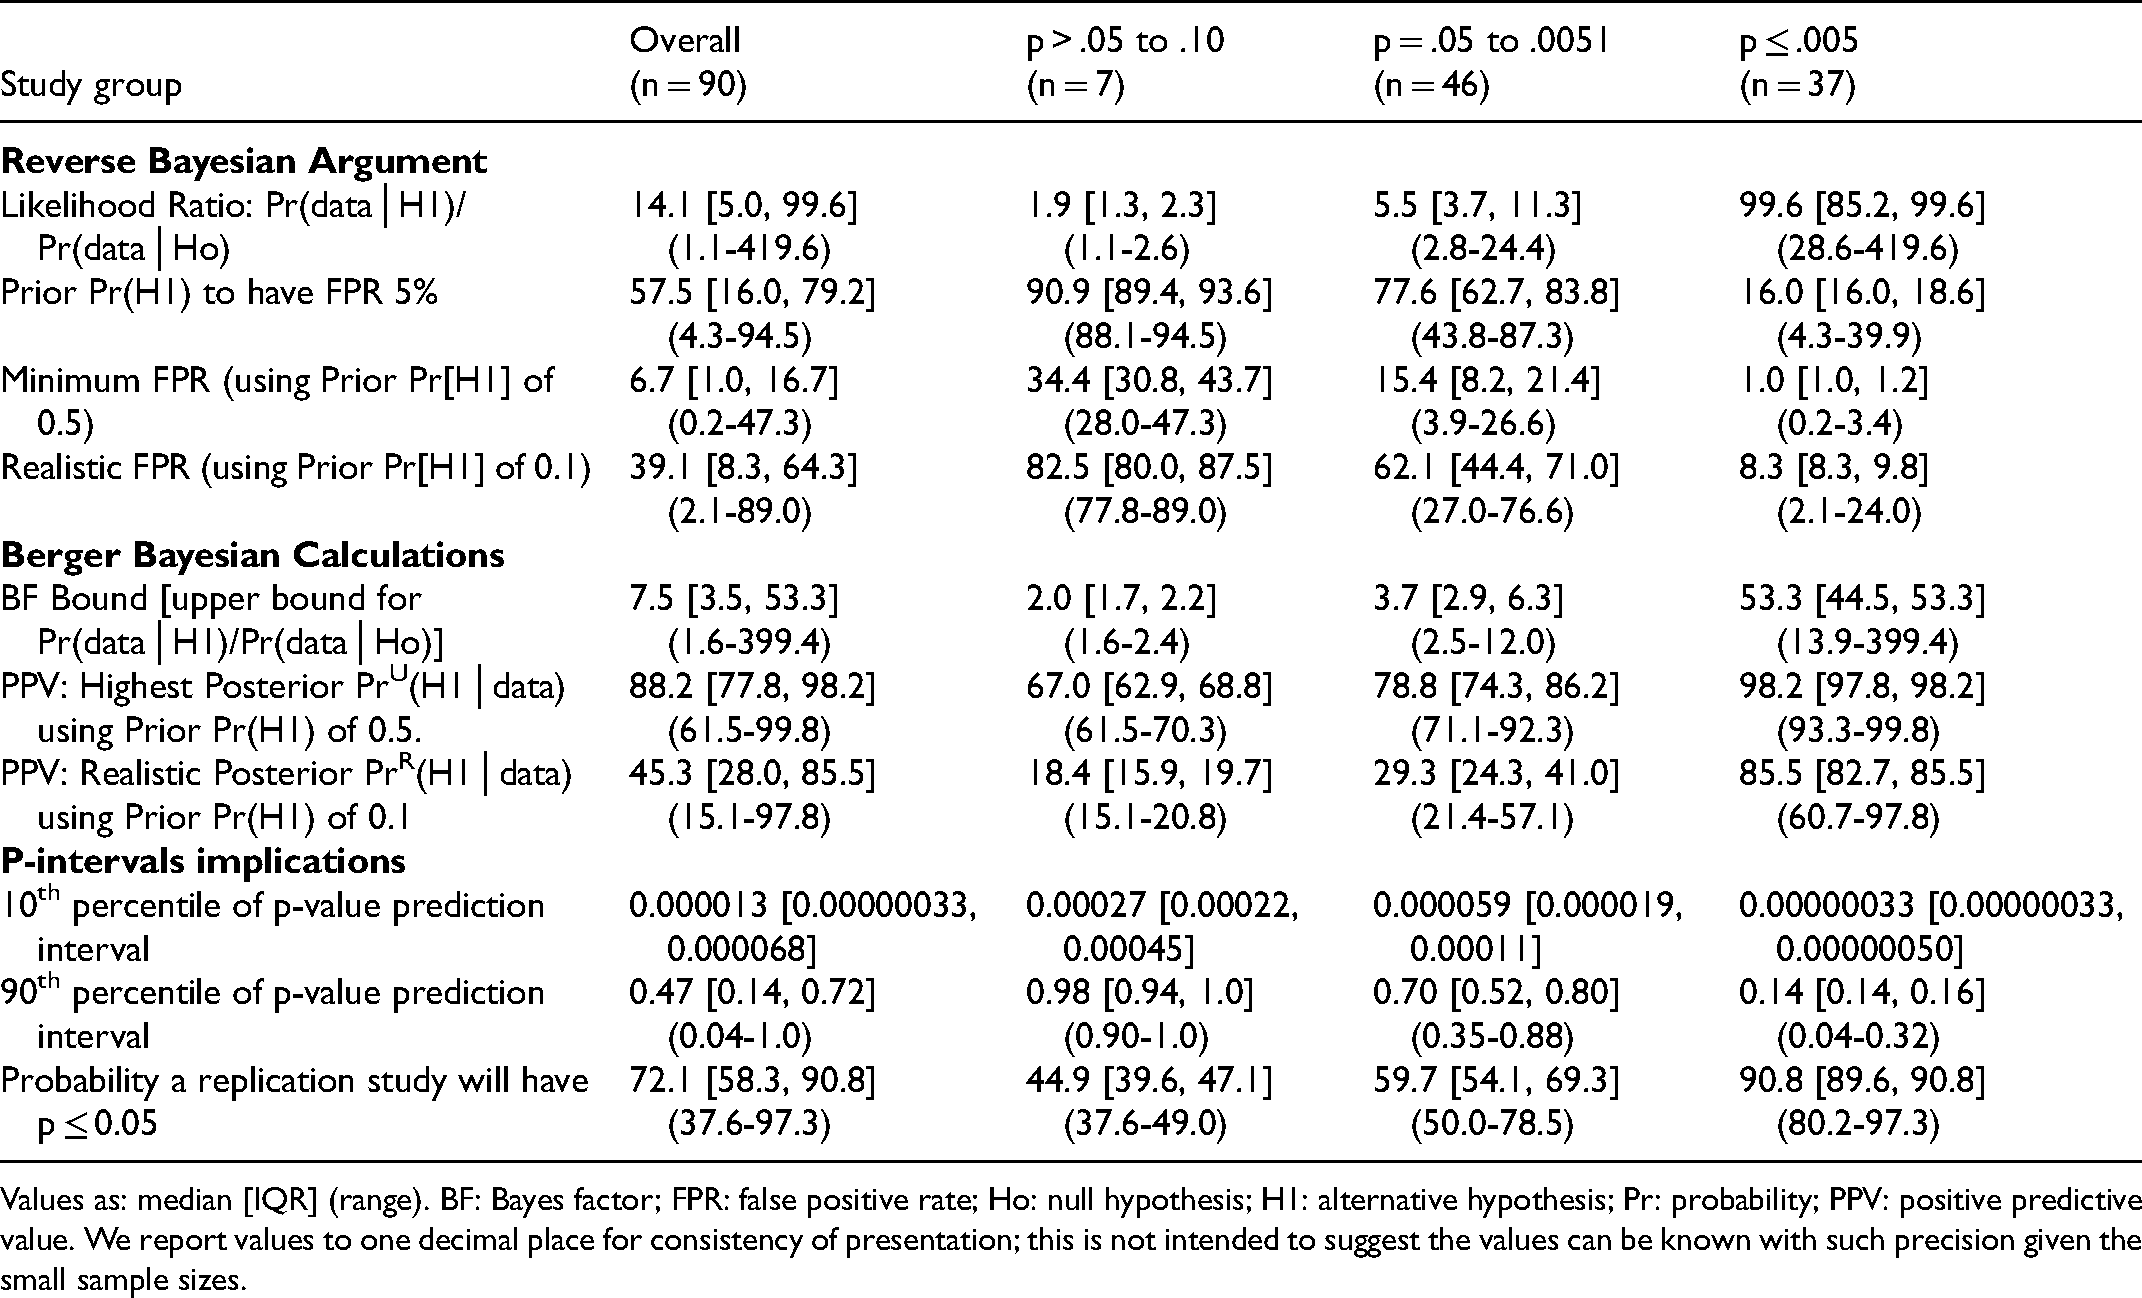
Values as: median [IQR] (range). BF: Bayes factor; FPR: false positive rate; Ho: null hypothesis; H1: alternative hypothesis; Pr: probability; PPV: positive predictive value. We report values to one decimal place for consistency of presentation; this is not intended to suggest the values can be known with such precision given the small sample sizes.
Bayesian Analysis of Credibility Results for the Critical Care RCTs Cohorts.
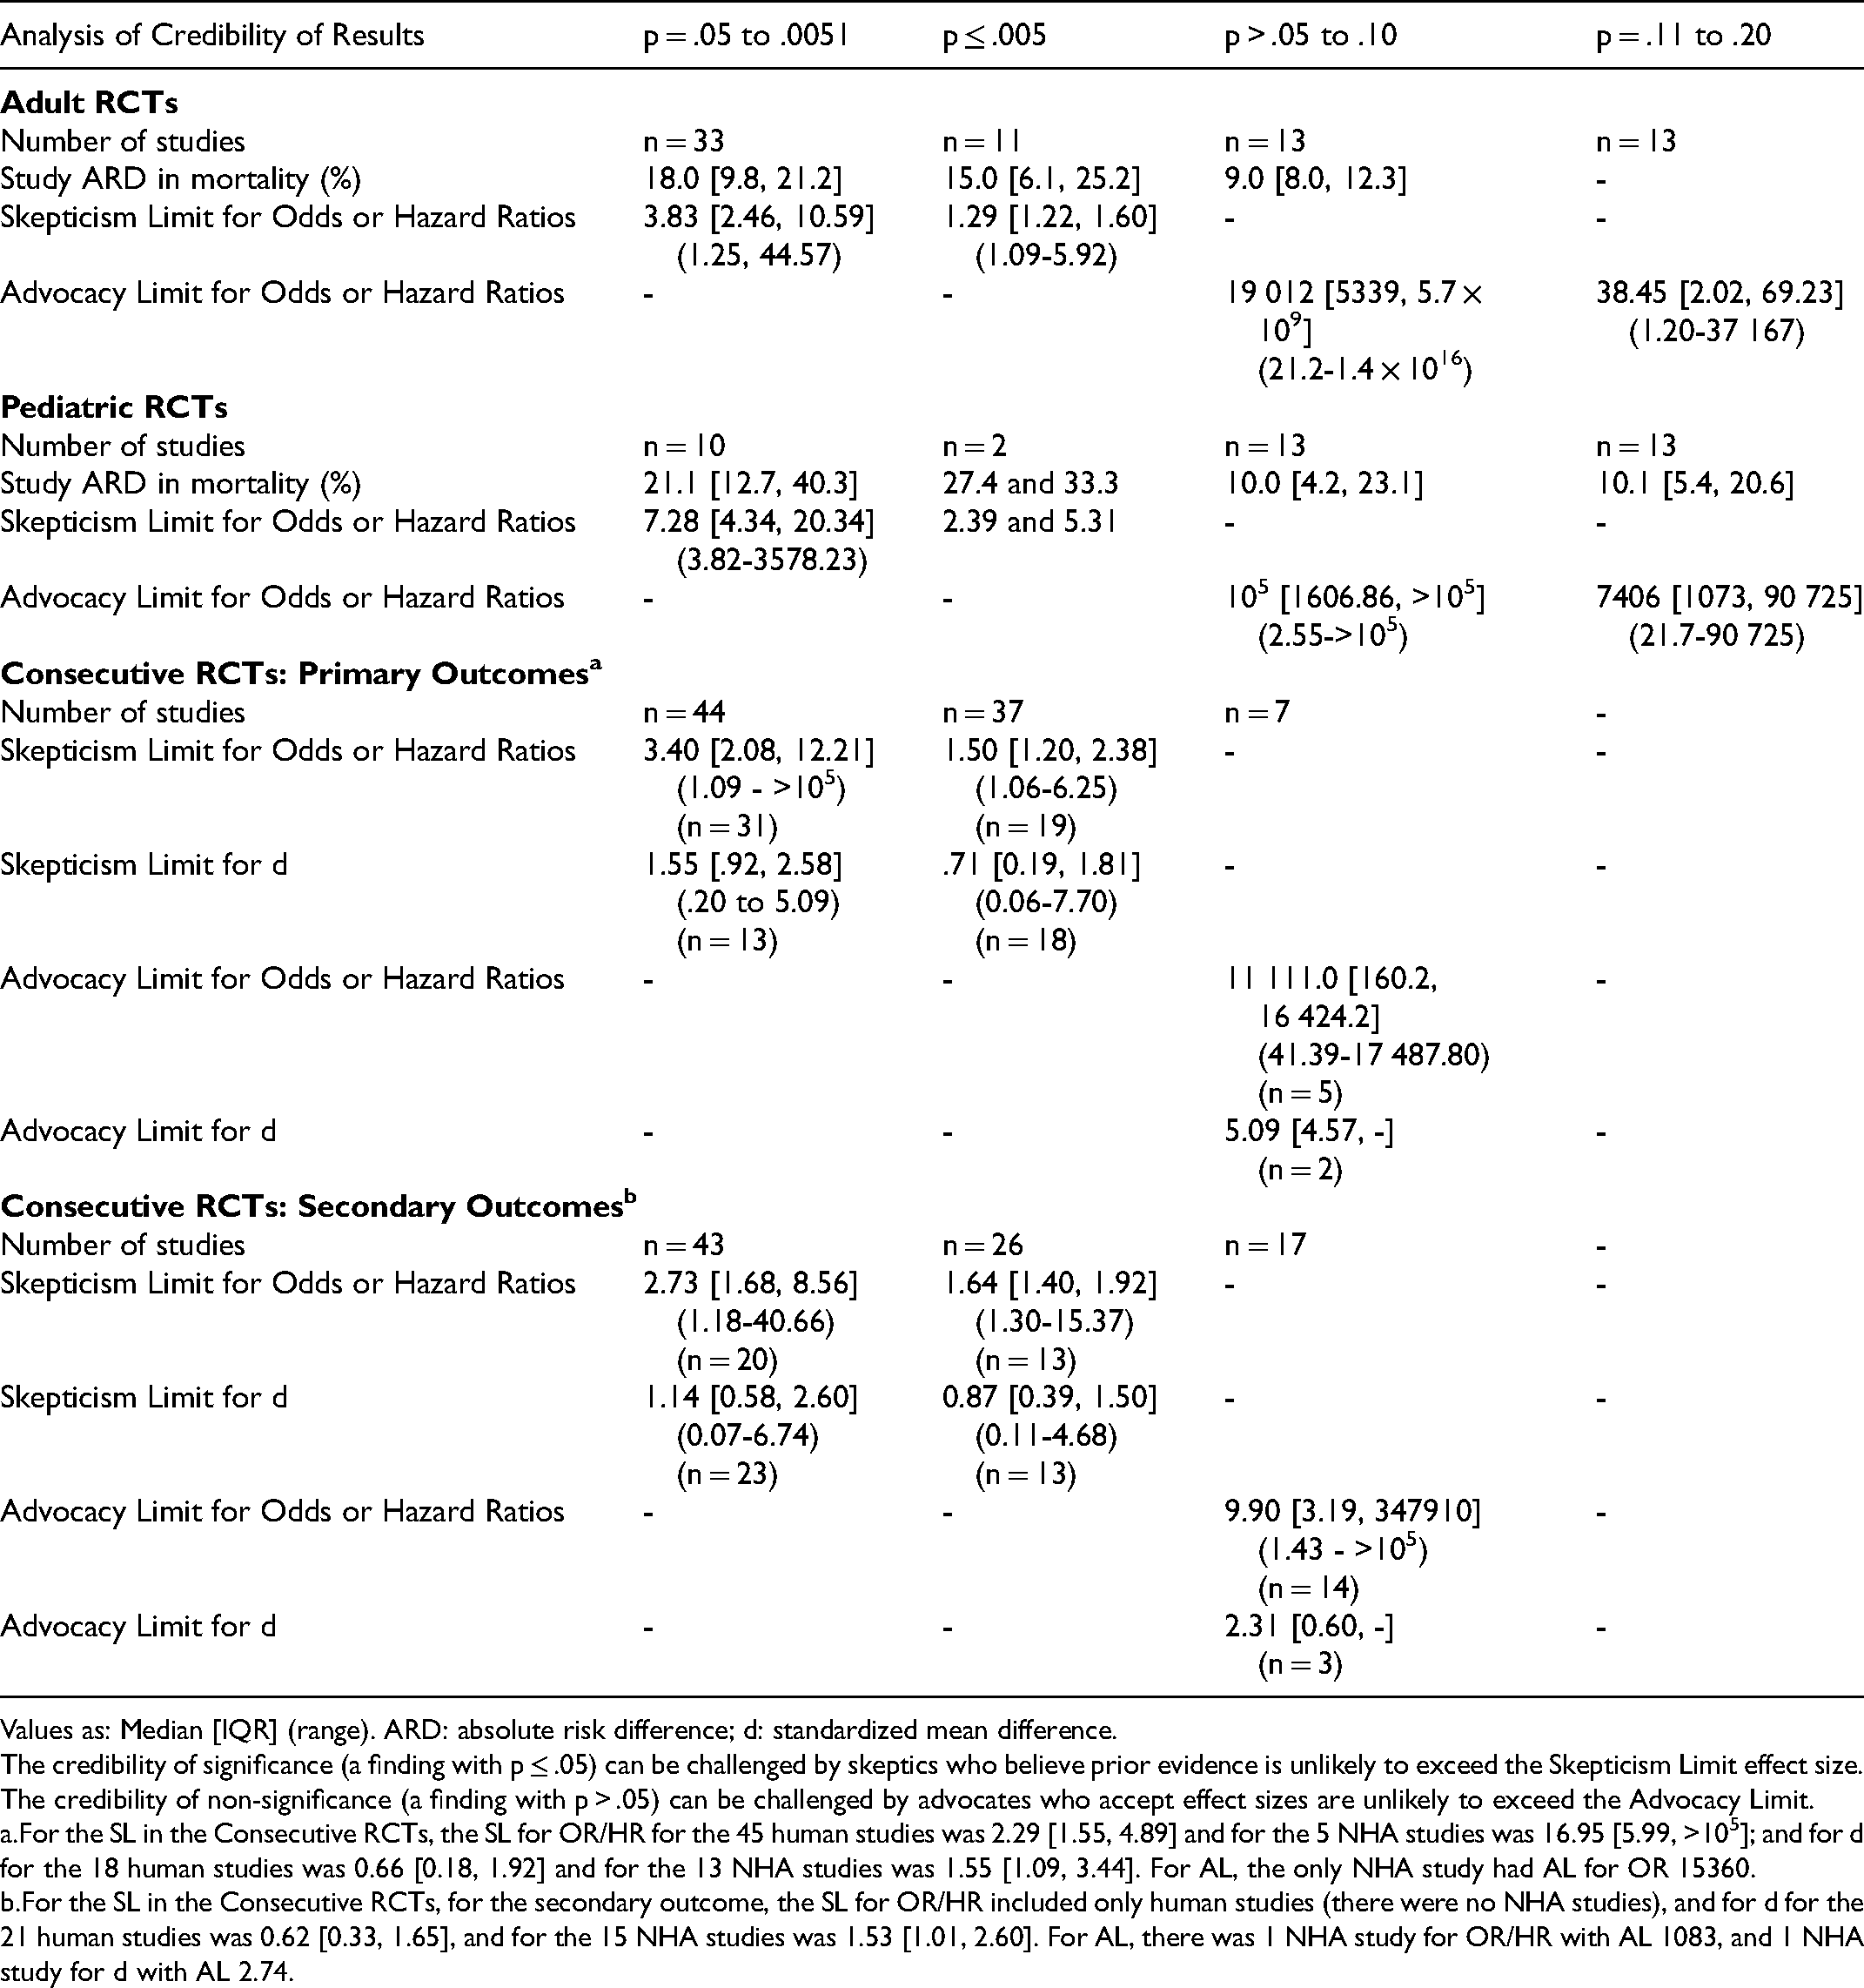
Values as: Median [IQR] (range). ARD: absolute risk difference; d: standardized mean difference.
The credibility of significance (a finding with p ≤ .05) can be challenged by skeptics who believe prior evidence is unlikely to exceed the Skepticism Limit effect size. The credibility of non-significance (a finding with p > .05) can be challenged by advocates who accept effect sizes are unlikely to exceed the Advocacy Limit.
For the SL in the Consecutive RCTs, the SL for OR/HR for the 45 human studies was 2.29 [1.55, 4.89] and for the 5 NHA studies was 16.95 [5.99, >105]; and for d for the 18 human studies was 0.66 [0.18, 1.92] and for the 13 NHA studies was 1.55 [1.09, 3.44]. For AL, the only NHA study had AL for OR 15360.
For the SL in the Consecutive RCTs, for the secondary outcome, the SL for OR/HR included only human studies (there were no NHA studies), and for d for the 21 human studies was 0.62 [0.33, 1.65], and for the 15 NHA studies was 1.53 [1.01, 2.60]. For AL, there was 1 NHA study for OR/HR with AL 1083, and 1 NHA study for d with AL 2.74.
Outcome: Reverse Bayesian Implications
Reverse Bayesian implications according to Colquhoun were similar for all cohorts of RCTs (Tables 3–6). As expected, the likelihood ratio increased, and the prior Pr(H1) necessary to have a FPR of 5%, minimum FPR, and realistic FPR decreased as the p-value category was more stringent. An obtained p-value .051–.10 did not reflect a “trend” to statistical significance; for example, in Adult-RCTs, the likelihood ratio was 1.8 [1.4, 22], prior Pr(H1) to have a FPR of 5% was 91.3% [89.6, 93.1], the minimum and realistic FPR were 35.7% [31.3, 41.8] and 83.3% [80.4, 86.6] (Table 2). An obtained p-value .05–.0051 had high FPR; for example, in Adult-RCTs, minimum and realistic FPR of 16.7% [11.2, 21.8] and 64.3% [53.2, 71.4] respectively. Only having an obtained p-value ≤.005 had high likelihood ratio and low FPR (eg, in Adult-RCTs the realistic FPR was 7.7% [7.7, 16.0]).
Reverse Bayesian Implications of the Obtained p-Values for Secondary Outcomes in Consecutive RCTs Recently Published in the Field of Critical Care Research.
14 (16.3%) of p-values were >.10. BF: Bayes factor; FPR: false positive rate; Ho: null hypothesis; H1: alternative hypothesis; Pr: probability; PPV: positive predictive value. We report values to one decimal place for consistency of presentation; this is not intended to suggest the values can be known with such precision given the small sample sizes.
Reverse Bayesian implications according to Berger et al. were also similar for all cohorts of RCTs (Tables 3–6). As expected, the BF and PPVs (PrU[H1│p] and PrR[H1│p]) increased as the p-value category was more stringent. The BF was not large until the p-value category was ≤.005. The realistic PrR(H1│p) for p-value category of .05–.0051 was 28.0% [24.1, 34.8], 30.6% [27.7, 48.5], 29.3% [24.3, 41.0], and 32.7% [24.1, 43.5] for the Adult-RCTs, Pediatric-RCTs, Consecutive-RCTs primary and secondary outcomes, respectively. The highest PrU(H1│p) for p-value category .05–.0051 was a median of 77.8%, 79.8%, 78.8%, and 81.4% respectively. To have a PrU(H1│p) >90% or PrR(H1│p) >80%, RCTs needed to have obtained a p-value ≤.005.
Reverse Bayesian implications according to Matthews are given in Table 7. The credibility of significance (p ≤ .05) can be challenged by skeptics who believe prior evidence is likely not to exceed effect size SL.15,16 The credibility of non-significance (p > .05) can be challenged by advocates who accept effect sizes are unlikely to exceed AL.15,16 Results were similar in all cohorts of RCTs, even more concerning in Pediatric-RCTs and NHA-Consecutive-RCTs (Table 7). Except for p ≤ .005, the credibility of “statistically significant” findings were easy to challenge; for example, in Adult-RCTs with obtained p = .05–.0051 it was unlikely that prior evidence suggested the OR was likely to be >3.83 prior to the study. For p-values >.05 to .10, the credibility to rule out an effect was surprisingly low; for example, in Adult-RCTs if prior evidence could suggest an OR anywhere between 1 to >5000, the credibility was challenged. Once p-value was .11–.20 the AL was much lower, but still could be challenged for half the Adult-RCTs if prior evidence suggested an OR not outside of 1 to 38.
Outcome: Replication Study Implications
As expected, the 90th percentile of replication p-value decreased, and the probability a replication RCT would have p ≤ .05 increased as the p-value category became more stringent. When the obtained p-value was .05–.0051, for Adult-RCTs, Pediatric-RCTs, Consecutive-RCTs for primary and secondary outcome, 10% of replication p-values (ie, the 90th percentile of replication p-values) were expected to be p≥.72 [.60, .81], .67 [.44, .73], .70 [.52, .80], and .63 [.48, .81] respectively. When the obtained p-value was ≤.005, these values were p≥.13 [.13, .24], .20, .14 [.14, .16], and .14 [.14, .20] respectively. The probability that a replication study would obtain a p-value ≤.05 did not approach 90% unless the obtained p-value was ≤.005 (Tables 3–6).
Examples:
Some examples of applying these methods to high-profile individual trials (three with obtained p-value ≤.05, and three with obtained p-value >.05) are shown in Supplemental Material 3.
Discussion
We examined three representative cohorts of critical care RCTs in order to demonstrate the meaning of obtained p-values. Our main findings include the following. First, most RCTs did not obtain a p ≤ .005, not even most studies that obtained p ≤ .05. Second, the obtained p-value category was not predicted by the field of study, study decade, number of centers, number of patients, or study ES (except for Pediatric-RCTs, which may have suffered from the “winner's curse,"’ 23 suggesting the p-value distributions were a general phenomenon in the field of critical care research. Third, unless obtained p ≤ .005, the FPR of a finding was surprisingly high, and the PPV and probability of replication of “statistically significant” findings were surprisingly low. This was even more marked when a realistic prior Pr(H1) was assumed. As one example, in Adult-RCTs with an obtained p = .05–.0051, the median prior Pr(H1) necessary to obtain a FPR of 5% was 79.2%, and the minimum and realistic FPR were 16.7% and 64.3%; with an obtained p ≤ .005 the median realistic FPR was 7.7%. In order to have an upper PPV >90% or realistic PPV >80%, RCTs needed to obtain a p ≤ .005. Fourth, the Bayesian credibility of statistically significant and non-significant results were easy to challenge, but much less so with obtained p ≤ .005; this was even more marked for Consecutive-NHA-RCTs. Overall, the findings suggest that most statistically significant and non-significant results from critical care RCTs should be reassessed as they often require implausible prior support and/or are not robustly credible.
Recent suggestions to improve reporting of p-values in published research include the methods we used here. 5 Colquhoun suggested reporting, given the obtained p-value, the prior Pr(H1) necessary to produce a specified desired FPR, and the minimum or realistic FPR; the discussion section of publications could then be used to argue whether the prior determined or used was plausible.8,9 Berger et al. suggested reporting the answer to two main questions: The Strength of Evidence Question (how strongly does the evidence from the data favor H1 relative to Ho), answered by reporting the BFB; and The More Likely Hypothesis Question (how likely is it that there is truly an effect of the treatment as opposed to no effect), answered by reporting the final posterior Pr(H1│p), which depends on defending the prior Pr(H1) used in that calculation.10,11 Held developed a “nomogram for p values” based on Berger's method. 14 Matthews’ suggested to report and defend the SL or AL in an Analysis of Credibility.15,16 Many have suggested to consider p ≤ .005 as “statistically significant”, and p-values .05 to .0051 as “suggestive” (perhaps warranting further investigation).19,20 We demonstrated that RCTs that obtained p ≤ .005 had much higher BF and PPV, and much lower FPR, better approaching what is generally considered acceptable evidence for an effect.
Our choice of Prior Pr(H1) may be criticized. The minimum Pr(H1) used was 50%, defensible as reflecting clinical equipoise that justifies blinding and randomization. 26 The realistic Pr(H1) used was 10%, defensible for several reasons. First, ≤10% has been suggested as a realistic estimate of the proportion of interventions tested in a clinical field that prove to be useful.1,18 Second, systematic reviews of adult and pediatric critical care RCTs consistently find that ≤10% of tested interventions are useful.17,18,27 Third, reviews of translation from results in NHA to human RCTs consistently find that <10% of very promising interventions are found useful.28,29 Fourth, interventions thought to be successful in human critical care RCTs often turn out to have been false positive findings.17,27,30 Fifth, others calculating reverse Bayesian implications of obtained p-values have similarly used this as a reasonable estimate. 34 Sixth, the findings mentioned above are based on published RCTs, and due to publication bias, it is likely these overestimate Pr(H1). Finally, this was meant to be what we consider a plausible example, and regardless of this choice our main point remains - interpretation of RCT findings requires the attempt to defend a chosen prior Pr(H1) in order to produce a desired FPR or desired posterior Pr(H1│data). In addition, incremental and replication research (as opposed to the search for novel findings) is a priority in order to provide the evidence for the choice of a higher Pr(H1).
Our results are compatible with studies in the field of critical care RCTs that reported a low fragility-index [defined as the minimum number of reversals in outcome that need to occur for the result to be no longer statistically significant] was common. 35 The fragility-index has an almost perfect negative correlation with the obtained p-value, and can be said to simply be “repackaging of the p-value”. 39 (p348) Arguably, explicitly stating the reverse Bayesian implications of obtained p-values is a better way to demonstrate the fragility of findings in the research field.
This study has limitations. First, we did not consider study biases that can inflate the obtained p-value. Potential sources of bias include anything that produces greater flexibility in study designs, definitions, outcomes, and analytic modes, eg, data dredging (multiple testing, p-hacking), changed data preprocessing parameters, and changed statistical analytical methods or outcomes, sometimes influenced by financial and other interests and prejudices.1, 40 Biases may have been fewer in the multicenter mortality outcome Adult-RCTs that still demonstrated our main findings. Since bias would further reduce the Prior Pr(H1), our results can be considered a conservative minimum estimate. Second, we did not include non-RCTs, nor non-mortality outcomes for the Adult-RCTs and Pediatric-RCTs. Non-RCTs and often less objective non-mortality outcomes provide more flexibility for bias to influence results.40,41,44,45 Non-mortality outcomes in the Consecutive-RCTs were included, with similar results. This suggests that our results can again be considered a conservative minimum estimate. Third, our results only reflect already described mathematical implications of p-values. This was our aim: we demonstrated the necessarily mathematical implications of p-values obtained in representative cohorts of RCTs, finding that p ≤ .05 is a poor standard to adjudicate the “statistical significance” of findings. As many critical care clinicians may not be familiar with these reverse Bayesian implications of p-values and confidence intervals, we hope that demonstration using real-world RCTs can make the need for revised research standards clearer, leading to necessary change in research methods and reporting. In addition, the methods we used can easily be applied to any individual RCT of interest to a clinician (see detailed description in Supplemental Material 1) in order to determine the credibility of the findings. Specifically, the clinician should focus on whether the prior Pr(H1) necessary to produce a desired FPR is defensible [using Colquhoun's online calculator], whether the PPV of a finding is based on a realistic prior Pr(H1) [using our online calculator based on Berger's BFB], whether the final posterior Pr(H1│p) that would convince is based on a defensible prior Pr(H1) [using Held's published nomogram], and/or whether the SL (or AL for non-significant findings) is credible [using our online calculator based on Matthews’ formulas]. Based on our findings, we believe that results in most of these RCTs will be found to be less certain than clinicians believe. Examples of application to a few high-profile individual RCTs is provided in Supplemental Material 3.
This study has several strengths. First, we included three cohorts of RCTs in critical care to demonstrate generalizability. Second, we used a detailed case report form manual for data recording and calculations. Third, we used methods suggested to demonstrate the implications of obtained p-values. To our knowledge, this is the first study in the critical care research field to report detailed reverse Bayesian implications of p-values.
Conclusions
We examined three representative cohorts of critical care RCTs in order to demonstrate the often-misinterpreted meaning of obtained p-values. We suggest that to improve interpretation of obtained p-values in RCTs reverse Bayesian implications should be reported in the results section, argument to support the assumed prior Pr(H1) should be a focus of the discussion section, and an obtained p-value ≤.005 should be used to claim statistical significance.
Supplemental Material
sj-docx-1-jic-10.1177_08850666211053793 - Supplemental material for Reverse Bayesian Implications of p-Values Reported in Critical Care Randomized Trials
Supplemental material, sj-docx-1-jic-10.1177_08850666211053793 for Reverse Bayesian Implications of p-Values Reported in Critical Care Randomized Trials by Sarah Nostedt and Ari R. Joffe in Journal of Intensive Care Medicine
Supplemental Material
sj-docx-2-jic-10.1177_08850666211053793 - Supplemental material for Reverse Bayesian Implications of p-Values Reported in Critical Care Randomized Trials
Supplemental material, sj-docx-2-jic-10.1177_08850666211053793 for Reverse Bayesian Implications of p-Values Reported in Critical Care Randomized Trials by Sarah Nostedt and Ari R. Joffe in Journal of Intensive Care Medicine
Supplemental Material
sj-docx-3-jic-10.1177_08850666211053793 - Supplemental material for Reverse Bayesian Implications of p-Values Reported in Critical Care Randomized Trials
Supplemental material, sj-docx-3-jic-10.1177_08850666211053793 for Reverse Bayesian Implications of p-Values Reported in Critical Care Randomized Trials by Sarah Nostedt and Ari R. Joffe in Journal of Intensive Care Medicine
Supplemental Material
sj-xlsx-4-jic-10.1177_08850666211053793 - Supplemental material for Reverse Bayesian Implications of p-Values Reported in Critical Care Randomized Trials
Supplemental material, sj-xlsx-4-jic-10.1177_08850666211053793 for Reverse Bayesian Implications of p-Values Reported in Critical Care Randomized Trials by Sarah Nostedt and Ari R. Joffe in Journal of Intensive Care Medicine
Footnotes
Author Contributions
SN and ARJ contributed to conception and design of the work, acquisition, analysis and interpretation of the data, and substantial critical revisions of the manuscript for important intellectual content, have approved the submitted version, and have participated sufficiently in the work to take public responsibility for the content. ARJ wrote the first draft of the article.
Financial Disclosure
This work was supported by a Department of Pediatrics Resident Research Grant awarded to SN. The funding agency had no role in design and conduct of the study; collection, analysis or interpretation of the data; preparation, writing, review, or approval of the manuscript; or the decision to submit the manuscript for publication.
Availability of Data and Materials
The dataset used and/or analyzed during the current study is available at the following: Joffe, A. R. (2021, September 29). Reverse Bayesian Implications of p-values. Retrieved from osf.io/zmjya.
Declaration of Conflicting Interests
The author(s) declared no potential conflicts of interest with respect to the research, authorship, and/or publication of this article.
Funding
The author(s) disclosed receipt of the following financial support for the research, authorship, and/or publication of this article: This work was supported by the University of Alberta, Department of Pediatrics (grant number Resident Research Grant).
Ethical Approval
Not applicable, because this article does not contain any studies with human or animal subjects.
Supplemental material
Supplemental material for this article is available online.
References
Supplementary Material
Please find the following supplemental material available below.
For Open Access articles published under a Creative Commons License, all supplemental material carries the same license as the article it is associated with.
For non-Open Access articles published, all supplemental material carries a non-exclusive license, and permission requests for re-use of supplemental material or any part of supplemental material shall be sent directly to the copyright owner as specified in the copyright notice associated with the article.