
Abstract
The rate of adolescents presenting with anorexia nervosa (AN) is increasing. Medically unstable adolescents are admitted to the hospital for nutrition restoration. A lack of global consensus on appropriate refeeding practices of malnourished patients has resulted in inconsistent refeeding practices. Refeeding hypophosphatemia (RH) is the most common complication associated with refeeding the malnourished patient. This review sought to identify the range of refeeding rates adopted globally and the implication that total energy intake and malnutrition may have on RH while refeeding adolescents with anorexia nervosa. Studies were identified by a systematic electronic search of medical databases from 1980 to September 2012. Seventeen publications were identified, including 6 chart reviews, 1 observational study, and 10 case reports, with a total of 1039 subjects. The average refeeding energy intake was 1186 kcal/d, ranging from 125–1900 kcal/d, with a mean percentage median body mass index (% mBMI) of 78%. The average incidence rate of RH was 14%. A significant correlation between malnutrition (% mBMI) and post-refeeding phosphate was identified (R 2 = 0.6, P = .01). This review highlights the disparity in refeeding rates adopted internationally in treating malnourished adolescents with anorexia nervosa. Based on this review, the severity of malnutrition seems to be a marker for the development of RH more so than total energy intake.
Implications and Contribution
This review highlights the disparity in refeeding rates adopted internationally while refeeding malnourished adolescents with anorexia nervosa. The data within this review distinguish the importance of malnutrition (<80% median body mass index) as a marker for post-refeeding phosphate nadir and, to a lesser extent, the impact that total energy intake (kcal/kg and kcal/d) has on refeeding hypophosphatemia.
Introduction
The prevalence of anorexia nervosa (AN) seems to be stable in the adult population but is becoming increasingly problematic in children and adolescents 1 ; individuals are presenting at an earlier age, reportedly as young as 8 years. 2 Young AN patients present at a lower percentage of ideal body weight and lose weight more rapidly than their older counterparts. 3 Bradycardic, hypotensive, and underweight adolescents with AN are admitted to the hospital for nutrition restoration to elicit weight gain while under close cardiovascular and biochemical monitoring. 4 -6 Insufficient research in the field of refeeding the malnourished patient has resulted in a lack of consensus and ambivalence about an appropriate initial refeeding intake, and consequently, refeeding practices remain inconsistent. 7 Table 1 highlights this disparity, with global refeeding practices ranging from 5–40 kcal/d. This equates to 150–1200 kcal/d in a 30-kg adolescent.
Recommended Refeeding Guidelines for Malnourished Patients With Anorexia Nervosa.
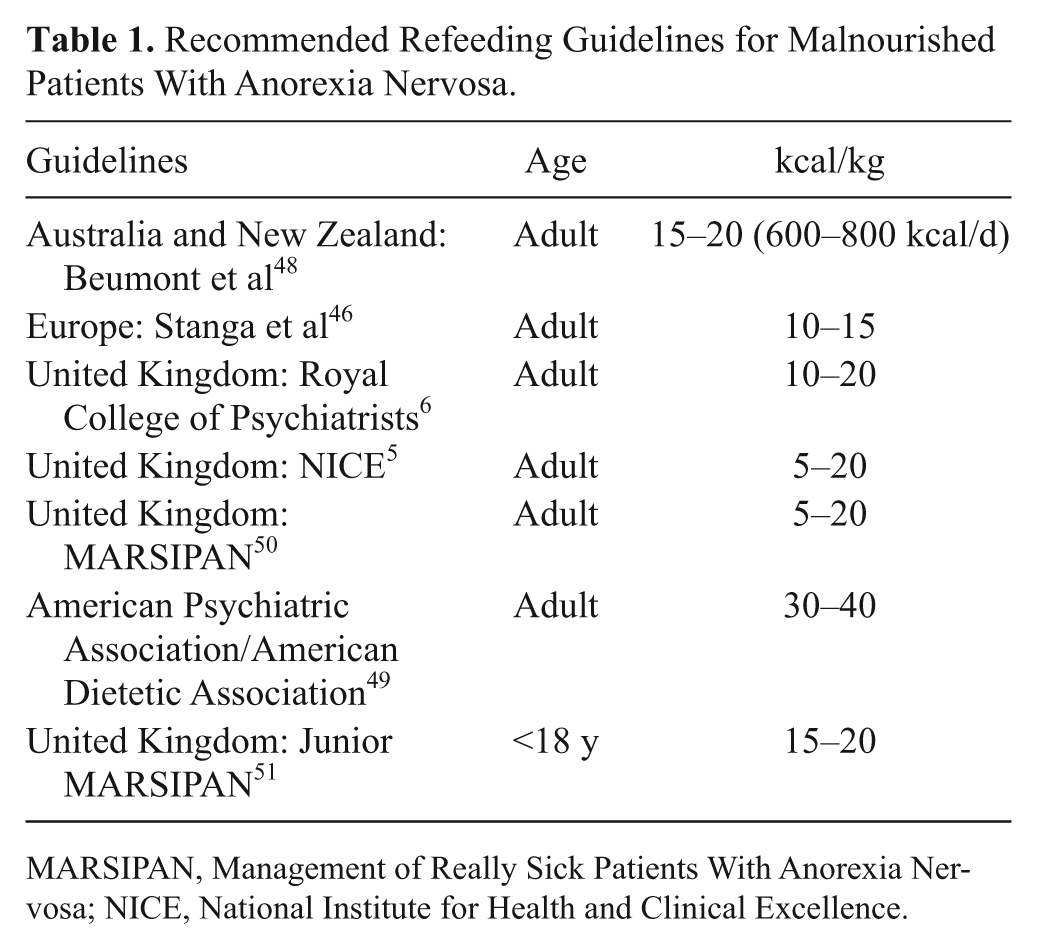
MARSIPAN, Management of Really Sick Patients With Anorexia Nervosa; NICE, National Institute for Health and Clinical Excellence.
Physiological adaptations that occur during malnutrition include depletion of fat and fat-free mass, which subsequently reduces resting energy expenditure 8,9 ; cardiovascular alterations 10,11 ; and the metabolic adaptation to starvation—the ability to function in a hypometabolic state. 12,13 As a result of these adaptations, it is common practice to begin with low-energy intake and increase slowly to avoid refeeding hypophosphatemia (RH); however, initiating very low energy intakes can have a deleterious effects on weight gain, 14 which may exacerbate cardiac abnormalities, as correction of cardiac anomalies is improved with weight gain. 15,16
Refeeding the Malnourished
Considerations prior to the initiation of refeeding include rate of weight loss prior to refeeding, 17 -19 the extent of malnutrition, 19,20 method of refeeding (enteral vs parenteral), 21,22 carbohydrate load, 23,24 and the rate at which nutrition is introduced. 25,26 The rate at which nutrition is introduced has received much attention and tends to be the focal point of refeeding guidelines. 5,6,27 It is unclear as to how the recommended refeeding guidelines outlined in Table 1 were ascertained and seem to be based on clinical experience and lack scientific evidence. 28 It has been postulated that reducing the total energy intake will reduce the carbohydrate intake, subsequently lessening the insulin surge that drives the electrolyte disturbances, especially hosphate. 18,23
Refeeding Hypophosphatemia
Even at advanced stages of starvation, the biochemical presentation is often unremarkable. This is the result of physiological adaptations to promote a hematological homeostasis by increased renal tubular reabsorption of phosphate, potassium, and calcium; tissue and bone breakdown, further supplementing serum phosphate, magnesium, and calcium levels; and dehydration, which can mask true serum electrolyte levels. 17,18
Phosphate and thiamine are essential for glucose metabolism and are rapidly used during the refeeding process. The shift to glucose metabolism during refeeding results in a high demand for the production of phosphorylated intermediates for glycolysis, the Krebs cycle, and the electron transport chain to form adenosine triphosphate and 2,3-diphosphoglycerate, resulting in a reduction in serum phosphate levels. 29,30 This increased utilization of phosphate and subsequent reduction in serum levels can lead to arrhythmias, seizures, cardiac failure, respiratory failure, rhabdomyolysis, coma, and sudden death—collectively known as the refeeding syndrome, a physiological phenomenon that occurs while refeeding the undernourished patient, a process driven by insulin. 17,18,31 RH is the most consistently reported biochemical disturbance seen in the refeeding syndrome. 32
This review sought to gauge the range of refeeding rates adopted globally and the implication that total energy intake and malnutrition may have on RH while refeeding malnourished adolescents with AN.
Method
Search Strategy
Relevant studies were identified through electronic searches of medical publication databases, including MEDLINE, EMBASE, and CINAHL, from 1980 to September 2012 in both English and non–English-language studies. Keywords in the search strategy included hypophosphatemia and anorexia nervosa, as well as refeeding and anorexia nervosa. The reference lists of all retrieved relevant studies were then searched to identify other potential studies.
Inclusion Criteria
Because of the limited data in this field, studies were included if they contained all of the following: diagnoses of AN (restrictive and/or binge-purge types) based on the fourth edition of the Diagnostic and Statistical Manual of Mental Disorders, 33 <20 years old, anthropometric recordings, energy intake during the refeeding process, and post-refeeding serum phosphate levels.
Exclusion Criteria
Studies were excluded if prophylactic phosphate was administered at the start of refeeding. RH in malnourished adolescents on intensive care units and posttransplant (bone marrow, renal, and liver) and oncology patients were excluded, as hypophosphatemia could be due to the result of a drug-biochemical interaction.
Results
Study Selection
Of the 91 titles identified, 37 were included for full-text review, including 6 chart reviews and 1 observational study, all of which were selected for review; also selected were 10 case reports with a total of 1039 subjects. Many publications were excluded due to a lack of information on nutrition intake. Other studies that were not specifically related to RH in AN were excluded—in particular, intensive care and posttransplant patients—due to the drug-biochemical interactions. The upper age limit was 20 years and the lowest recorded was 10 years old. Table 2 represents the 6 chart reviews and 1 observational study, and Table 3 represents the 10 case reports. Authors in tables are ordered chronologically from earliest publication date to most recent.
Chart Reviews: Energy Intake and Incidence of Refeeding Hypophosphatemia (RH) in Adolescents With Anorexia Nervosa.
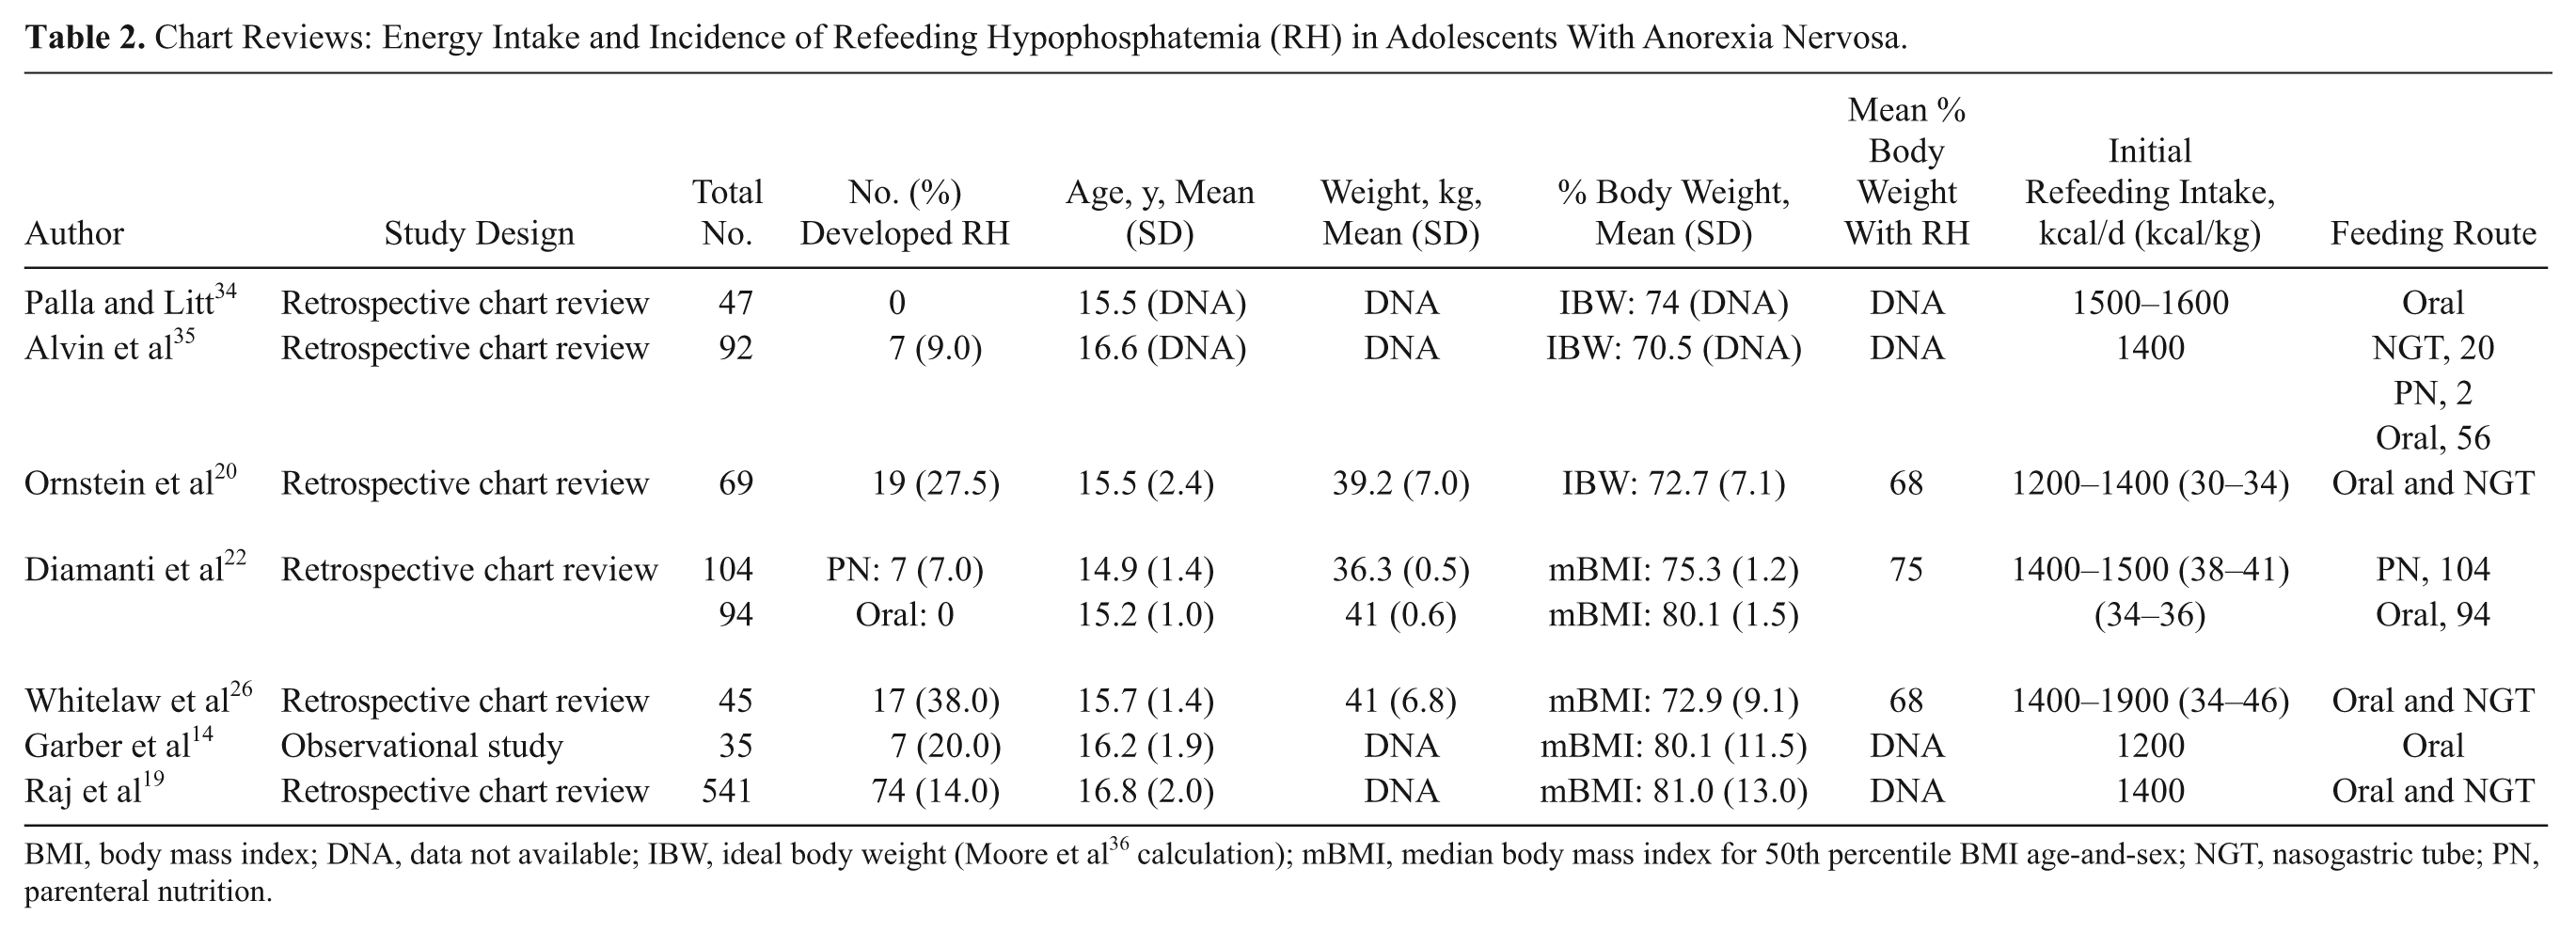
BMI, body mass index; DNA, data not available; IBW, ideal body weight (Moore et al 36 calculation); mBMI, median body mass index for 50th percentile BMI age-and-sex; NGT, nasogastric tube; PN, parenteral nutrition.
Case Reports: Energy Intake and Post-Refeeding Serum Phosphate in Adolescents With Anorexia Nervosa.
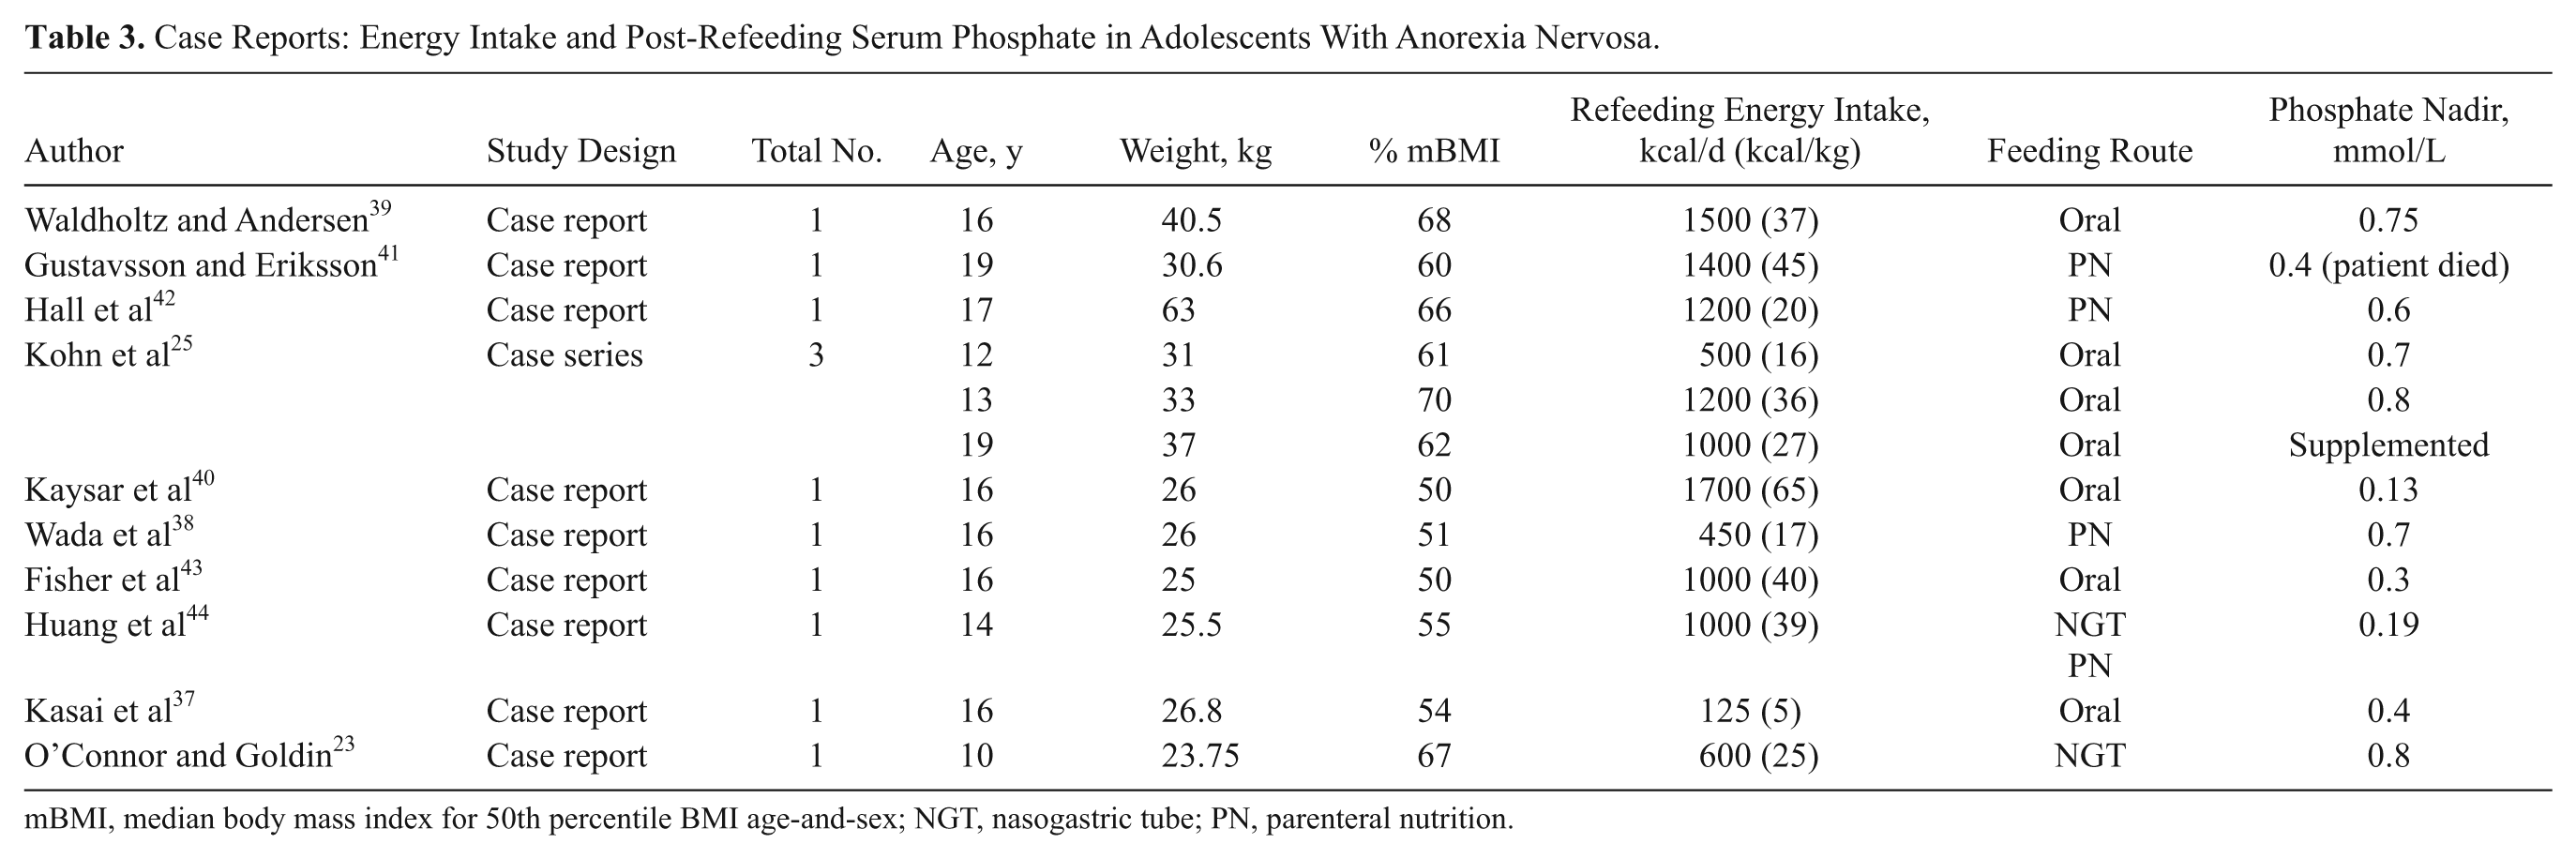
mBMI, median body mass index for 50th percentile BMI age-and-sex; NGT, nasogastric tube; PN, parenteral nutrition.
The majority of subjects’ baseline serum phosphate levels were within normal ranges prior to refeeding (1–1.8 mmol/L). Post-refeeding serum phosphate levels were obtained within 48 hours of commencing refeeding and ranged from 0.2–1.1 mmol/L. The mean post-refeeding phosphate levels in the chart/observational reviews and case reports were 0.65 mmol/L and 0.54 mmol/L, respectively. Most authors in this review deemed an episode of hypophosphatemia below 0.9 mmol/L, which is the lower serum reference range for adolescents. Of the 1039 adolescents identified in the chart/observational studies, 131 developed RH (<0.9 mmol/L). The incidence of RH in the chart/observational reviews ranged from 0%–38%, with an average incidence of 14%.
The chart/observational studies report an average initial refeeding intake of 1500 kcal/d (38 kcal/kg), ranging from 1200–1900 kcal/d (30–48 kcal/kg). Most articles increased calorie intake by 200–300 kcal/d until estimated requirements for weight gain were met. Three of the 7 studies 22,34,35 used the method by Moore et al 36 to calculate % ideal body weight (IBW). The other 4 studies used weight for age, height, and sex as % mBMI (percentage median body mass index for age-and-sex) 14,19,26 or using the National Center for Health Statistics growth charts, 20 which ranged from 70.5%–81% with a weighted mean of 77.9%. The chart reviews that recorded weight ranged from 36.3–41 kg, with a mean of 39.25 kg.
The case reports had an average initial refeeding intake of 972 kcal/d (31 kcal/kg), ranging from 125–1700 kcal/d (5–65 kcal/kg). The % mBMI was calculated for all the case reports on admission weight and ranged from 50%–70% (mean of 59% mBMI). The average % mBMI and initial refeeding intake on admission to the ward for both chart reviews and case report were 68% and 1186 kcal/d (33 kcal/kg), respectively.
A Pearson’s correlation analysis was performed to test for a relationship between malnutrition as % mBMI and post-RH. Only observational studies that provided specific information on initial refeeding intake and IBW for those individuals who developed RH were included in the analysis: Orstein et al 20 (n = 19, mean 68% mBMI, 0.8 mmol/L phosphate nadir), Diamanti et al 22 (n = 7, mean 75% mBMI, 0.8 mmol/L phosphate nadir), and Whitelaw et al 26 (n = 17, mean 68.4% mBMI, 0.9 mmol/L phosphate nadir). All case reports were included in the analysis (n = 11). A positive correlation (R 2 = 0.6, P = .01) was found between malnutrition (% mBMI) and post-refeeding phosphate nadir (mmol/L), suggesting that % mBMI may be correlated to post-refeeding serum phosphate levels. Figure 1 highlights the lower the calculated % mBMI, the lower the post-refeeding serum phosphate.
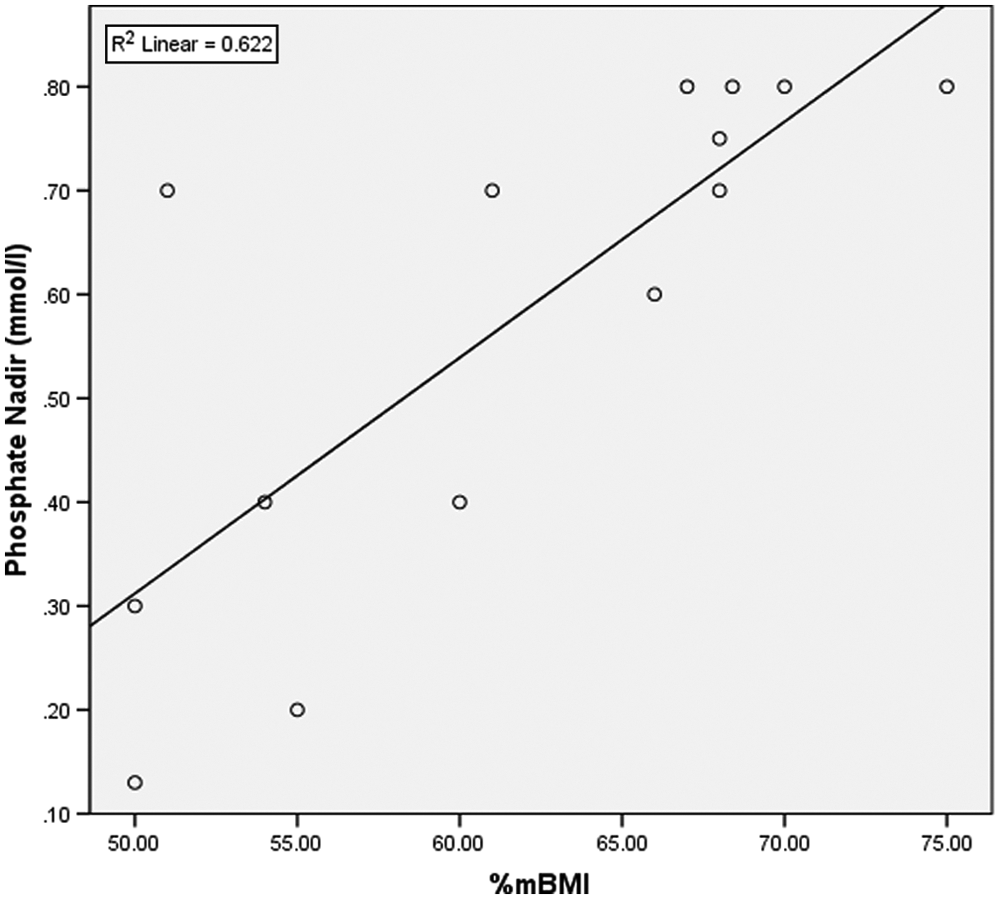
Relationship between malnutrition (% median body mass index [mBMI]) and post-refeeding serum phosphate level (mmol/L), with data from chart reviews and case reports. Pearson correlation between the sum of % mBMI on admission and sum of post-refeeding serum phosphate – R 2 linear = 0.6 (P = .01).
Most patients (79%) were fed orally or enterally, and 21% were fed parenterally. The rate of parenteral feeding is much higher than expected in this cohort of patients. If we remove the chart review by Diamanti et al, 22 whose preference was to use parenteral nutrition (PN), then the incidence of PN reduces to an expected rate of 1.5%.
Palla and Litt 34 categorized hypophosphatemia as
Whitelaw et al 26 had the highest initial refeeding intakes (1900 kcal/d) of all the chart reviews and in turn had the highest incidence of RH (38%) in adolescents with a mean mBMI of 73%.
Kasai et al, 37 Kohn et al, 25 Wada et al, 38 and O’Connor and Goldin 23 documented the lowest initial refeeding intakes of 125–600 kcal/d (5–25 kcal/kg) in individual adolescents with very low weights, between 51% and 67% mBMI. Regardless of these low refeeding rates, RH (post-refeeding serum phosphate, 0.4–0.8 mmol/L) and cardiovascular anomalies were observed. Conversely, Waldholtz and Andersen 39 and Kaysar et al 40 reported RH (0.75 mmol/L and 0.13 mmol/L, respectively) at much higher initial refeeding intakes of 1500 kcal/d and 1700 kcal/d in very low-weight adolescents with 68% mBMI and 50% mBMI, respectively.
A Pearson’s correlation analysis was performed to test for a relationship between initial refeeding intake and corresponding post-refeeding serum phosphate nadir. Only the chart and observational studies that provided specific information to initial refeeding intake and ideal body weight on those individuals who developed RH were included in the analysis (n = 43). All case reports were included in the analysis (n = 11). In this review, a correlation could not be found between refeeding rate (kcal/d) and RH (mmol/L) (r = 0.21, P = .7).
Discussion
The vast range in refeeding rates identified in this review (125–1900 kcal/d) may be fuelled by the unpredictable presentation of RH coupled with insufficient interventional research in the area of refeeding malnourished patients, which has hindered the development of comprehensive global refeeding guidelines. Table 1 outlines professional organizations’ published refeeding guidelines in adults and adolescents with AN. A noticeable difference can be seen in refeeding rates adopted by proposed guidelines in Europe and Australia vs North America; the European and Australian guidelines commence refeeding more conservatively than their American colleagues, 5–20 kcal/kg 45 -48 and 30–40 kcal/kg, 49 respectively. The recommended refeeding guidelines were based on clinical experience rather than scientific evidence. 28
The overriding principle behind these recommended non–research-based refeeding guidelines is the pathophysiology of refeeding the malnourished patient and the notion that limiting the total energy intake may reduce the insulin surge, which in turn will suppress the rapid intracellular movement of glucose, fluid, and electrolytes, particularly phosphate, 17,18,23 therefore reducing the risk of RH.
Energy Intake and RH
The data report that RH occurs in malnourished adolescents who commence a range of energy intakes (125–1900 kcal/d), which lessens the possibility of a direct link between total energy intake and RH. Energy intakes as low as 125 kcal/d reduced serum phosphate to 0.4 mmol/L 37 ; similarly, energy intakes as high as 1900 kcal/d 26 also reduced phosphate levels in malnourished adolescents with AN. This is further highlighted by the insignificant Pearson’s correlation result.
This irregularity in post-refeeding serum phosphate and total energy intake challenges our physiological understanding of RH in malnourished patients. RH is supposedly driven by insulin, 17 and insulin secretion is directly proportional to glucose consumption, 52 and therefore you would expect the greater energy intake to cause the greatest reduction in post-refeeding serum phosphate.
Of all the chart/observational studies and case reports, Whitelaw et al 26 commenced the highest refeeding rates at 1900 kcal/d. Whitelaw et al also reported the highest incidence of RH, affecting 38% of adolescents; no recorded clinical manifestations of hypophosphatemia were reported. Furthermore, they encouraged additional intake of dairy products to increase dietary phosphate intake. This highlights the potential benefit of prophylactic nutrition supplementation while promoting rapid weight restoration and reversal of the complications associated with severe RH.
The paradoxical presentation of RH in malnourished adolescents who have commenced both high and low refeeding rates further adds to the perplexity of this physiological phenomenon and suggests that RH may not be entirely correlated to energy intake. The inconsistent presentation of RH, which occurs at varying energy intakes in malnourished adolescents with AN, implies that other contributing factors are at play.
Malnutrition and RH
Many studies have reported that the refeeding phosphate nadir is directly proportional to % IBW. 20,25,26 Garber et al 14 aimed to commence refeeding at 1400 kcal/d (actual mean intake 1200 kcal) in patients who were 80% mBMI. Serum phosphate reduced only marginally from normal range (1–1.8 mmol/L) to a mean value of 0.9 mmol/L. Alvin et al 35 also commenced refeeding at 1400 kcal in adolescents at a much lower mean mBMI of 70%, which elicited a larger mean reduction in serum phosphate from normal range to 0.5 mmol/L.
Furthermore, case reports by Fisher et al, 43 Huang et al, 44 and Gustavsson and Eriksson 41 had the lowest recorded % mBMI (49%, 55%, and 56%, respectively) and equally had the lowest reported post-refeeding serum phosphate levels (0.3, 0.19, and 0.4 mmol/L, respectively); refeeding commenced at 1000–1400 kcal/d.
Finally, Diamanti et al 22 reported RH (7%) in the PN refeeding group, but the PN group had a significantly lower level mBMI than the oral group (75.3% vs 80.1% [P = .001], respectively), which could account for the higher rate of RH in the PN group. They conclude that PN was associated with a higher complication rate than oral treatment alone, but all complications resolved. It is important to highlight that PN has been associated with higher risks of developing RH. 21,53,54
A Pearson’s correlation reports a close correlation between % mBMI and post-refeeding serum phosphate (R 2 = 0.6, P = 0.01). The lower the patient’s % mBMI, the lower the post-refeeding serum phosphate. The Junior MARSIPAN (Management of Really Sick Patients With Anorexia Nervosa) guidelines 51 state that those malnourished adolescents who are <70% mBMI pose a significantly higher risk of developing refeeding complications and warrant particular close monitoring during refeeding. The severity of RH seems to correlate with decreasing % mBMI but can occur at both high and low initial refeeding intakes.
Energy Requirements in Malnourished Patients
Although this review suggests that energy intake may not play such an important role in the development of RH, it is essential to consider the altered metabolic state of adolescents with AN. 8,55
A necessary consideration while establishing a refeeding rate is that malnourished patients with AN exist in a hypometabolic state as a consequence of physiological adaptations of malnutrition described earlier. 56 -58 Therefore, it is unnecessary to commence excessively high energy intakes to elicit weight gain 59,60 as inappropriate high refeeding rates may or may not increase the risk of RH but are likely to reduce the individual’s capacity to adhere to a meal plan and therefore potentially increase the need for a nasogastric tube. 61
A review by Cuerda et al 59 measured resting energy expenditure in female adolescents using indirect calorimetry. They found that resting energy expenditure equates to an estimated 32 kcal/kg. Of importance, Cuerda et al and Van Wymelbeke et al 62 highlight that resting energy expenditure rises as fat and fat-free mass increase. Energy intake should gradually be increased, ensuring 0.5- to 1-kg/wk weight gain. 6,49
In summary, this systematic review represents a comprehensive comparison of data from chart/observational reviews and case reports with data on total energy intake, % mBMI, and hypophosphatemia in adolescents with AN.
This review highlights the disparity in refeeding rates adopted internationally to treat malnourished adolescents with AN. The inconsistencies in refeeding practices may be driven by the unpredictable presentation of RH coupled with inadequate interventional studies.
The severity of RH seems to correlate with decreasing % mBMI but does not seem to be influenced by total energy intake. However, it is unnecessary to commence very high refeeding rates, as adolescents with AN exist in a hypometabolic state and weight gain can be achieved by meeting suppressed energy requirements. 59,60,62
Inconsistent global refeeding practices are unlikely to improve until a well-designed interventional study is performed that compares the physiological impact of different energy intakes at very low % mBMI.
Limitations
This is a secondary data analysis; the chart and observational data analyzed in this review have been extrapolated from summative data and therefore provide only an overview of the true energy intakes, IBW, and phosphate nadir.
Bias of over- and underreporting of RH should be limited, assuming compiled data are consecutive as reported in the chart reviews. However, the fact that such a chart review was instigated may imply an increase of RH that prompted further investigations. This is especially pertinent as the retrospective chart reviews included admission only over the previous year, which could overestimate the incidence of RH in adolescents with AN. A lack of information in articles regarding rate of weight loss prior to refeeding and nutrition composition of meal plans also limits the findings in this review. Finally, a lack of consensus from authors on what was deemed an episode of hypophosphatemia limited an accurate measure of incidence rates.
Footnotes
Financial disclosure: None declared.
This article originally appeared online on March 4, 2013.