
Abstract
Introduction and Objective
Epilepsy is one of the most common brain diseases during childhood and adolescence. Atrophy in different brain areas is possible during epilepsy. This study aimed to verify whether cerebellar volume differences could be detected by volume analysis using magnetic resonance imaging (MRI) in children with epilepsy.
Method
In this retrospective study, 41 children (3.1-18.8 years) with epilepsy of unknown etiology were included (duration of epilepsy 1.9 ± 3 years). A cranial MRI with a volumetric 3-dimensional, T1-weighted sequence was used for volume analysis. The MRIs of 26 patients with headache (5.3-17.1 years) were analyzed for comparison. A volume analysis of the cerebellum was performed using region-based morphometry. Total cerebellar volume, total white and gray matter volume, and 48 regional lobules (L), separated into white and gray matter, were calculated. Cerebellar volumes are presented in relative ratios as the volume fraction of cerebellar volume to total intracranial volume: CV/TIV.
Results
The ratio of overall white matter volume was significantly lower in the case group (23.93 × 10⁻³, P = .039). A significantly lower ratio of regional white matter volume was detected in LV right (P = .031) and left (P = .014), in LVIIIB right (P = .011) and left (P = .019), and in LVIIIA left (P = .009).
Conclusion
Our results emphasize that volume analysis of the total cerebellar volume alone is insufficient to characterize cerebellar differences in children with epilepsy. Rather, in specific cerebellar region volume analysis using region-based morphometry, children with epilepsy showed significantly lower regional volumes of lobules, which are important for sensorimotor function (LV, LVIII) and higher cognitive function (crus I).
Keywords
Introduction
Epilepsy is known to cause volume differences in the cerebral structures.1–4 For example, regional volume reduction in the hippocampus is a common pathologic substrate of mesial temporal lobe epilepsy. 5 In addition, extrahippocampal differences in the thalamus, neocortex, cortex, and pallidum can be detected in mesial temporal lobe epilepsy.6–8
Recently, brain volume studies in adult patients with epilepsy have suggested that volume differences occur not only regionally in the cerebrum but also in the cerebellum. Several authors have associated epilepsy with volume differences in different regional areas of the cerebellum and have concluded that it is not sufficient to consider the cerebellum as an entirety.9–11 In addition to the sensorimotor network, the cerebellum is also involved in other neural networks such as the cognitive network, where it has regulatory roles for executive function, behavior, and language.12–14 Other studies have shown that there appear to be changes in the neurocognitive networks in epilepsy. In particular, epilepsy of unknown etiology can be characterized by disturbances in different corticosubcortical networks and does not have a structural or genetic focus as a triggering lesion.15,16 However, it is largely unknown how the pattern, consistency, and cause of these disturbances are associated with changes in the volume of regional areas in the gray and white matter of the cerebrum, especially in the cerebellum.17,18
Automated sequencing by region-based morphometry (RBM) is an even more accurate method for volumetry of very small areas. 19 Using the Computational Anatomy Toolbox software (CAT12, http://www.neuro.uni-jena.de/cat), the analysis of data sets of volumetric MRI sequences is very precise 20 and provides an analysis of a priori–defined regions. Region-based morphometry can be used to analyze the cerebellum in its entirety, as well as regional areas of gray and white matter in the regional lobules, using the parcellation by Larsell. 21 Very small areas can be precisely measured. 22 Well-known studies, such as the ENIGMA cross-sectional study, have mainly analyzed the entire volume of the cerebrum or specific regions thereby. 23
Data on volume differences in the cerebellum, especially in children and adolescents with epilepsy, are available to a limited extent. Moreover, the data are heterogeneous. Currently, only 2 studies have been conducted on patients aged up to 18 years.24,25 Both studies reported cerebellar volume reduction, considering the cerebellum to be an entity without subdivisions. In contrast to these studies, we used region-based morphometry within CAT12 for volume analysis of T1-weighted magnetic resonance imaging (MRI) volume data sets.
Our aim was to identify and quantify volume differences of the cerebellum in its entirety and in regional areas of the gray and white matter more precisely, with a focus on children and adolescents with epilepsy of unknown etiology. Assuming that there is a negative effect of volume differences in separate areas of the cerebellum in correlation with sensorimotor abilities and cognitive function, one focus of our work was to evaluate the influence of clinical factors, such as sex, age at disease onset, epilepsy duration, number of antiepileptic drugs, seizure frequency, classification, and average Intelligence Quotient (IQ) score. In addition, an analysis of the relationship between regional cerebellar volume and specific cognitive deficits may further improve our understanding of the role of the cerebellum in cognitive networks. We hypothesized that epilepsy of unknown etiology in children and adolescents causes lower cerebellar volume in the regional gray and white matter areas. Such a regional lower volume in the cerebellum and possibly associated neuronal loss may be associated with sensorimotor and cognitive deficits. Therefore, we aimed to clarify whether the quantification of regional cerebellar areas using region-based morphometry could be a diagnostic and prognostic biomarker. 26
Methods
Participants
A total of 41 patients with epilepsy of unknown etiology were enrolled in this study. Epilepsy of unknown cause was the inclusion criterion; a structural, genetic, metabolic, systemic, immune-mediated, or infectious cause of epilepsy; a history of hypoxic encephalopathy or traumatic brain injury; an intraventricular shunt system; and MRI scans with significant motion artifacts were exclusion criteria for the case group. In the control group, we included only neurologically inconspicuous children with a completely normal MRI of the head, who reported headache or simple migraine in their clinical history. Any abnormality in the clinical report or in the written MRI results was considered as an exclusion criterion.
The case group included 16 girls and 25 boys with a mean age of 10.5 years (range of 3.1-18.8 years with a standard deviation [SD] of 4.3 years). Based on the number of antiepileptic drugs administered at the time of the MRI examination, the case group was divided into subgroups A and B. A total of 31 patients (75.6%) received only 1 antiepileptic drug and were included in subgroup A. The 10 patients (24.4%) taking more than 1 antiepileptic drug were included in subgroup B.
The control group included neurologically inconspicuous children and adolescents with headaches or those who fulfilled the International Classification of Headache Disorders (ICHD) of migraine with and without aura and had no pathologic findings on cranial MRI examination (n = 26). These were 15 girls and 11 boys with a mean age of 12.2 years (range of 5.3-17.1 years and with SD of 3.6 years). The demographic data of the participants in the case and control groups are presented in Table 1. The clinical characteristics of the patient groups are presented in Table 2.
Demographic Data of the Case Group with Subgroup A and B, and Control Group.a
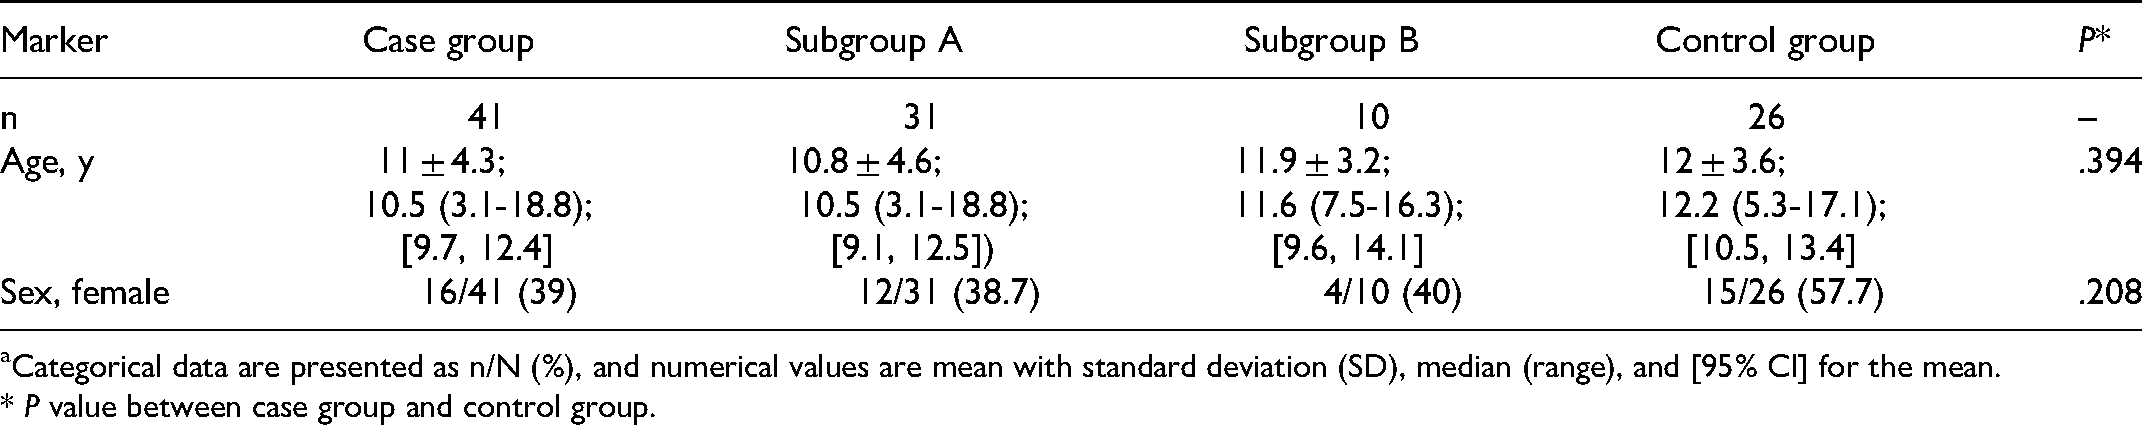
Categorical data are presented as n/N (%), and numerical values are mean with standard deviation (SD), median (range), and [95% CI] for the mean.
* P value between case group and control group.
Clinical Characteristics of the Case Group. a
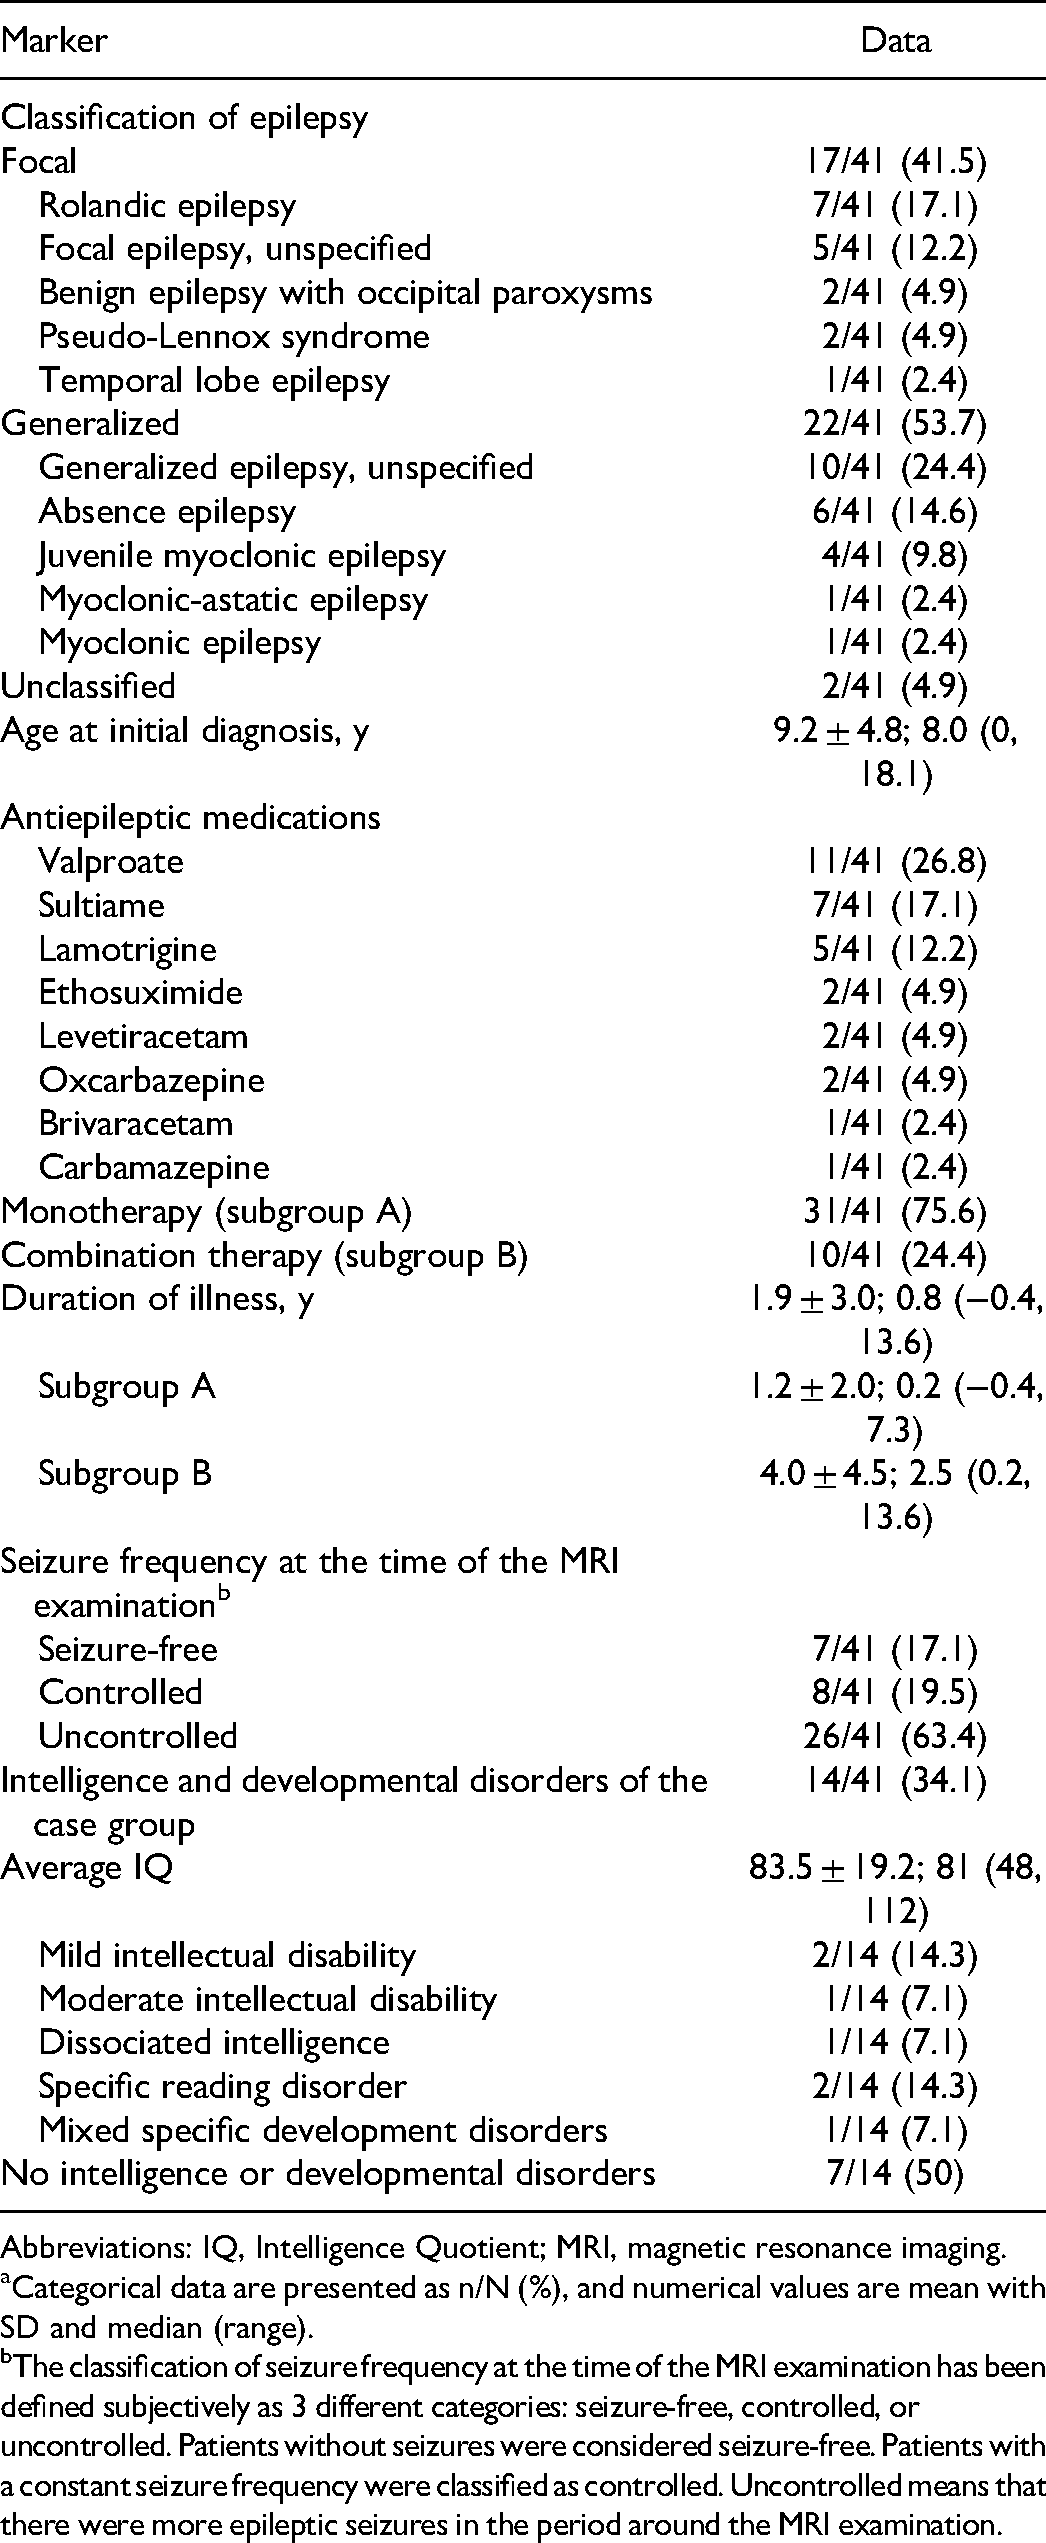
Abbreviations: IQ, Intelligence Quotient; MRI, magnetic resonance imaging.
Categorical data are presented as n/N (%), and numerical values are mean with SD and median (range).
The classification of seizure frequency at the time of the MRI examination has been defined subjectively as 3 different categories: seizure-free, controlled, or uncontrolled. Patients without seizures were considered seizure-free. Patients with a constant seizure frequency were classified as controlled. Uncontrolled means that there were more epileptic seizures in the period around the MRI examination.
The custodial parents of all study participants provided informed consent for MRI examination. This study was approved by our institutional review board (registration number: 2020-1782-Data). All procedures performed in this study involving human participants were in accordance with the ethical standards of the institutional and national research committees and with the 1964 Helsinki Declaration and its later amendments, or comparable ethical standards.
Cognitive Assessment
IQ was determined in 14 of the 41 children examined. The average IQ was used as a measure of patients’ cognitive performance. IQ was determined using the Wechsler Preschool and Primary Scale of Intelligence (WPPSI) for children aged 2-7 years and the Wechsler Intelligence Scale for Children (WISC) for children and adolescents aged 7-19 years. The average IQ allowed for a comparison of the test scores between the study participants. An IQ below 70 indicates mild intellectual disability. An IQ between 35 and 49 corresponds to moderate intellectual disability, whereas an IQ below 35 corresponds to severe intellectual disability.
MR Data Acquisition
MRI images were acquired using either 1.5- or 3-tesla (T) MRI scanners (Siemens, Erlangen, Germany) in 8- or 16-channel head coils. A total of 67 MRI examinations of 67 participants in the case and control groups were performed. The imaging protocol included high-resolution T1-weighted, 3-dimensional, Fourier-transformed acquisitions requiring magnetization-prepared 180° radiofrequency pulses and rapid gradient-echo (MPRAGE) sampling in all cases. The sequence parameters for MPRAGE were approximately identical for all scanners (time of repetition [TR] 2400 ms in 1 T and 2300 ms in 3 T; time of echo [TE] 3.66 ms in 1 T and 3.06 ms in 3 T, time of acquisition [TA] 07:39 min in 1 T and 04:32 min in 3 T; and slice thickness of 1.0 mm for both).
Region-Based Morphometry
Volume analysis was performed using Computational Anatomic Toolbox 12 (CAT12) for statistical parametric mapping (SPM). 19 Region-based morphometry of the cerebellum was performed. The Cobra atlas of the Computational Brain Anatomy Laboratory of the Douglas Mental Health University Institute (Montreal, Canada), which contains high-resolution images of the cerebellum, 27 was used. First, all images stored as Digital Imaging and Communications in Medicine (DICOM) data were transformed using SPM, version 12, in MATLAB, version R2017b (MathWorks, Natick, MA). The converted image data were normalized, segmented, and quality controlled. Finally, the local gray and white matter values within the cerebellar regions defined by the Cobra Atlas were averaged and used for statistical analysis using SPSS software.
Twelve cerebellar areas were defined for the right and left hemisphere (L I + II, L III, L IV, L V, L VI, C I, C II, L VIIB, L VIIIA, L VIIIB, L IX, and L X) using the Cobra Atlas. Gray and white matter volumes were calculated for each defined area. Accordingly, 48 individual subregions were used for comparison. Mean values within a region of interest are expressed in milliliters. Because of the different skull sizes of the children, there was variance in cerebellar volume within the groups, which was minimized by correcting for total intracranial volume (TIV). The total intracranial volume is the sum of the volumes of all individual structures in the brain parenchyma. Accordingly, we calculated the volume fraction of the total and regional cerebellar volume (CV) relative to the total intracranial volume and CV/TIV volume fractions. For this purpose, the absolute values of the respective cerebellar volume were divided by the corresponding total intracranial volume. The resulting CV/TIV volume fraction values did not have units.
Statistical Analysis
Statistical analyses were performed using the statistical program IBM SPSS Statistics for Mac, version 26 (IBM Corp, Armonk, NY). The distribution of descriptive data is presented by the absolute and relative frequencies as well as the mean, SD, and 95% confidence interval (CI).
To compare the mean age of the case and control groups, a t test was applied for independent samples. The χ2 test was used for the nominally scaled variable of sex.
Volume analyses were performed using generalized estimating equations. The findings in the case group, subgroup A, and subgroup B were compared with those in the control group. CV/TIV volume fraction was used as the dependent variable. The variables cerebellar volume, group membership, and their combination were chosen as interaction factors. Results are presented using mean differences, 95% CIs, and P values.
The influence of clinical parameters on the total cerebellar volume in the case group was analyzed using multivariate linear regression analysis. For this purpose, the total cerebellar volume (in milliliters) was used as the dependent variable.
The overall significance level was set at P <.05.
Results
Cerebellar Measures Comparing Case and Reference Group
In the following, the volumes indicated are always the volume fraction CV/TIV without unity in the corresponding areas of the cerebellum.
There were no significant differences in the ratio of total cerebellar or total cerebellar gray matter volume between the case and control groups or between the subgroups and control group.
The total cerebellar white matter showed significant differences in mean volume between the case group and the control group (−1.49 × 10⁻³ [−2.91 × 10⁻³; −0.07 × 10⁻³], P = .039) and comparing subgroup A to the control group (−1.80 × 10⁻³ [–3.34 × 10⁻³; −0.26 × 10⁻³], P = .022). There was no significant difference in the mean cerebellar white matter volume between the subgroup B and the control group.
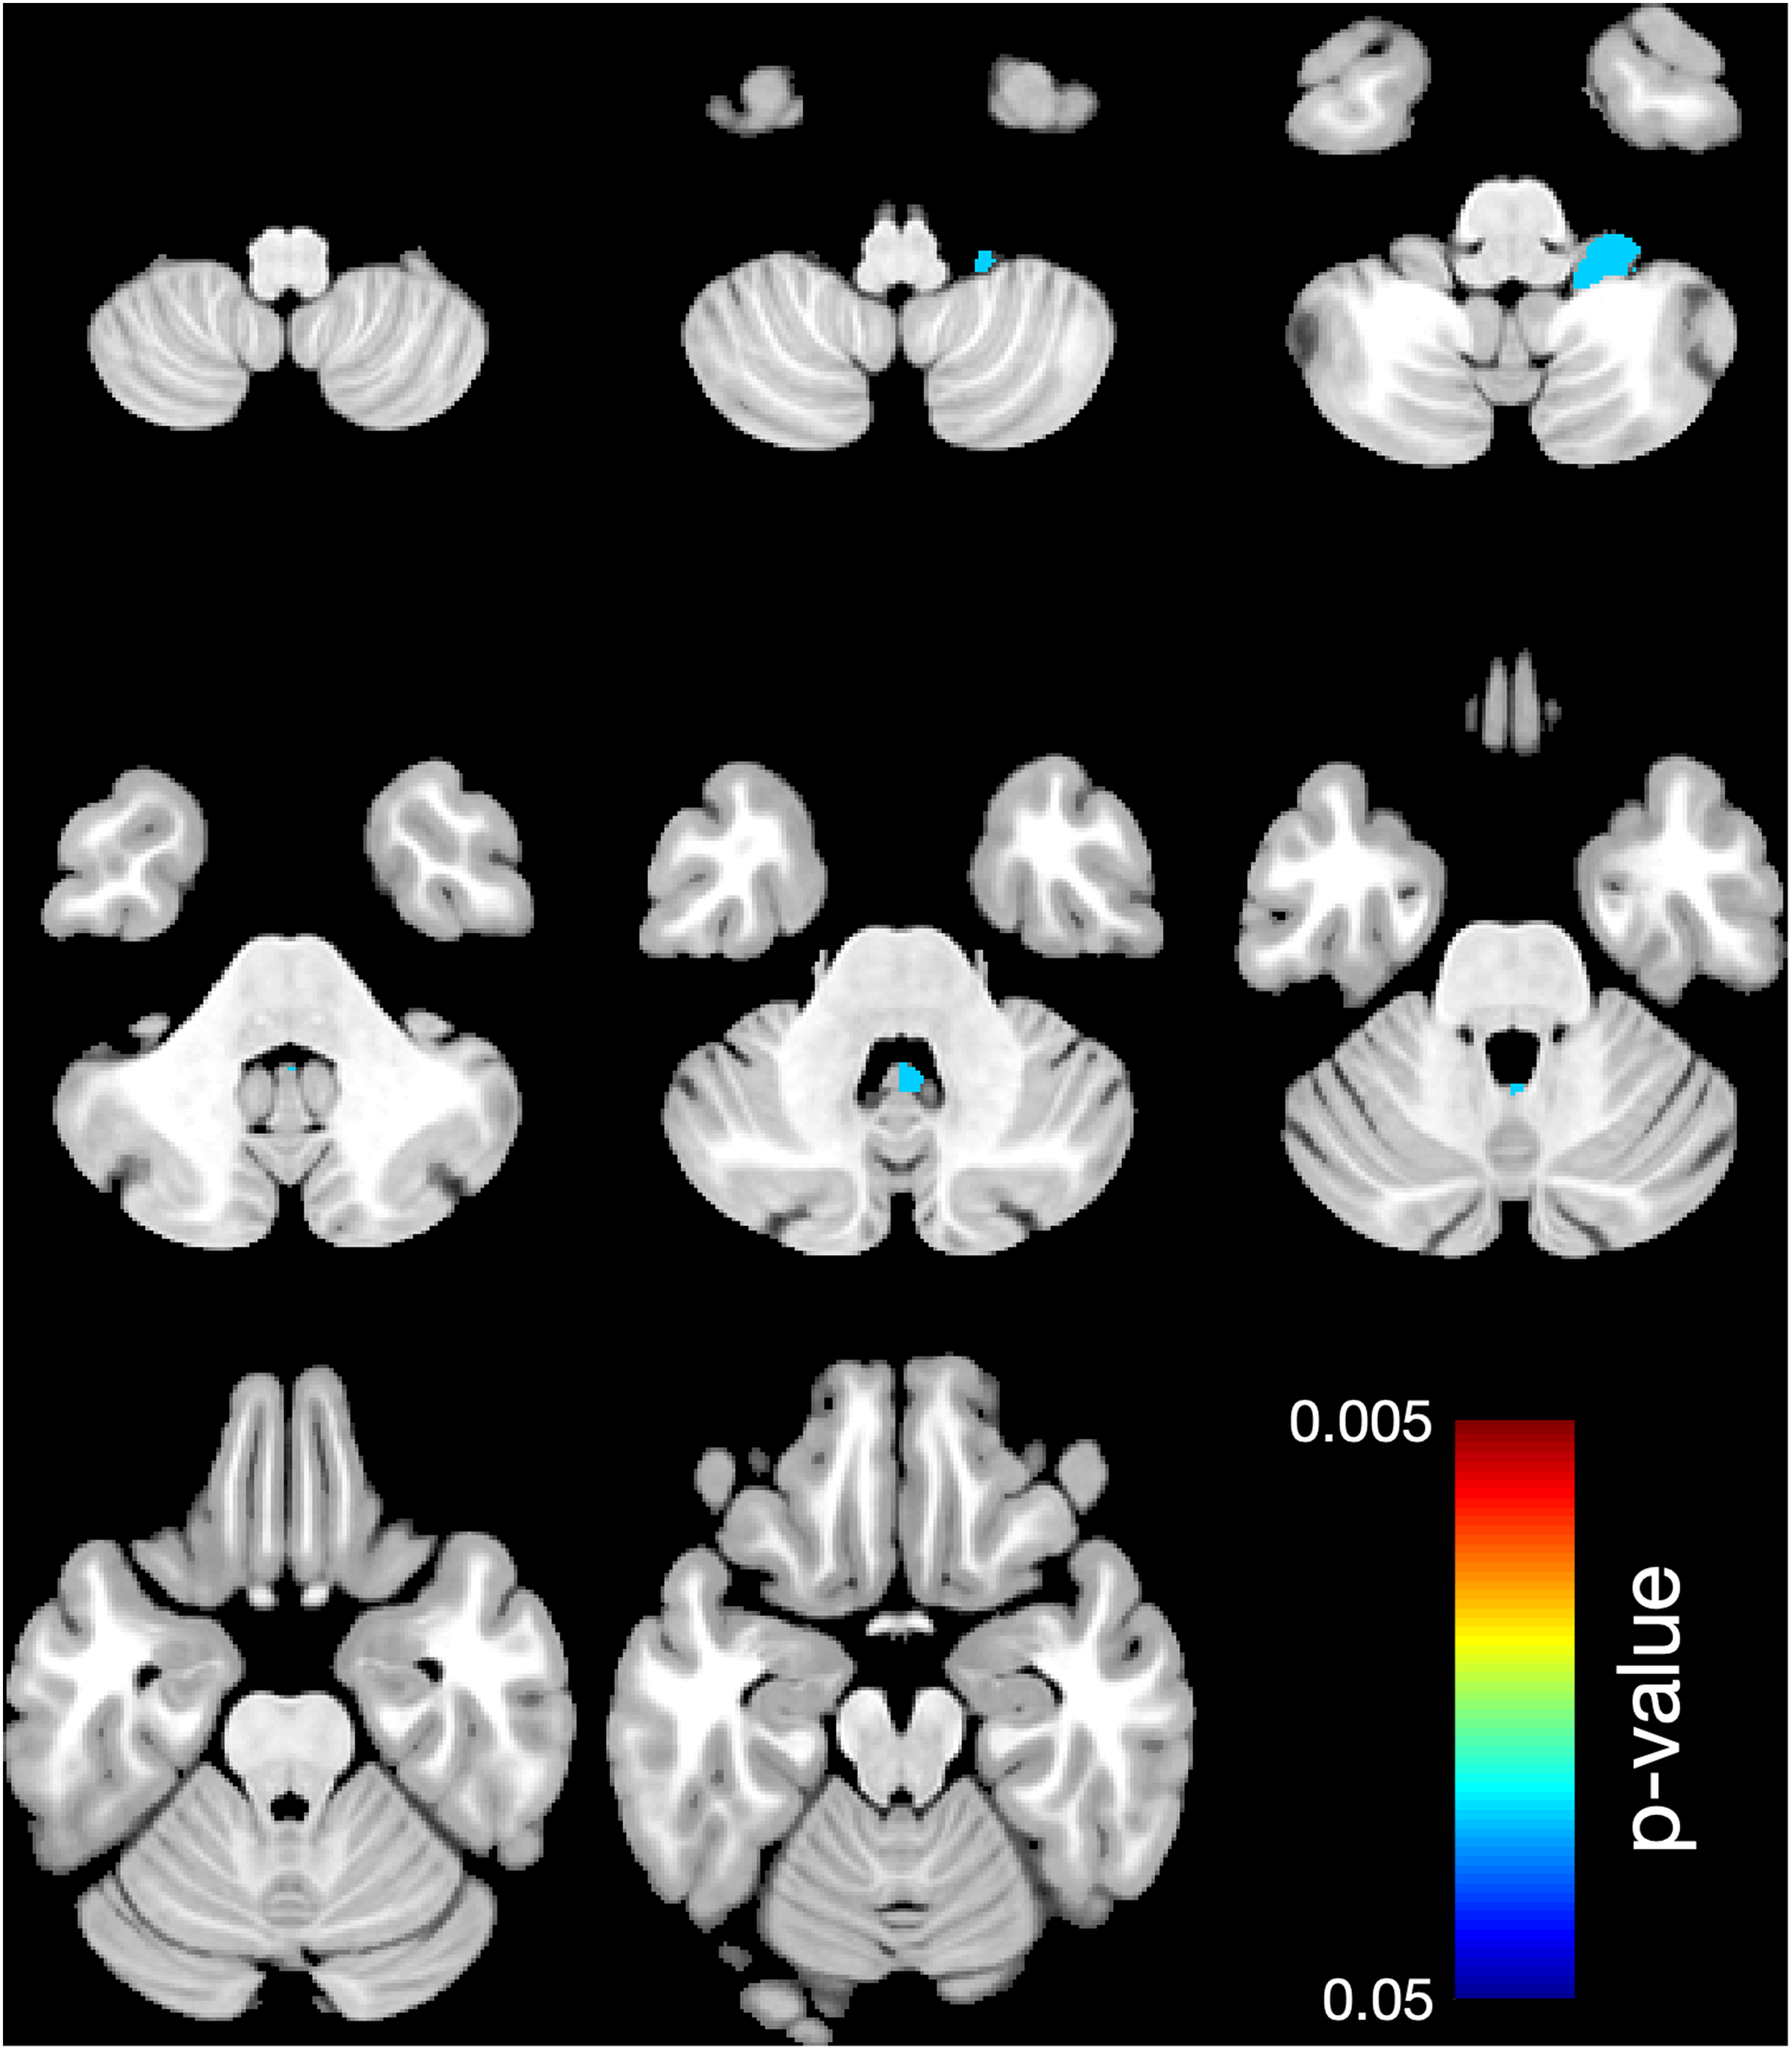
Looking at the regional cerebellar lobules, white matter showed significantly lower mean volume in 5 areas (right L V, P = .031 and left L V, P = .014; L VIIIA, P = .009, and L VIIIB, P = .011, as well as L VIIIB, P = .019) comparing the case group to the control group (Table 3 and Figure 1), and in 6 areas (right L V, P = .03, and left L V, P = .002; left C I, P = .018; left L VIIIA, P = .004; right L VIIIB, P = .017, and left L VIIIB, P = .008) comparing subgroup A to the control group (Table 4, Figure 2) and in 1 area (right L X, P = .024) comparing subgroup B to the control group (Table 5, Figure 3).
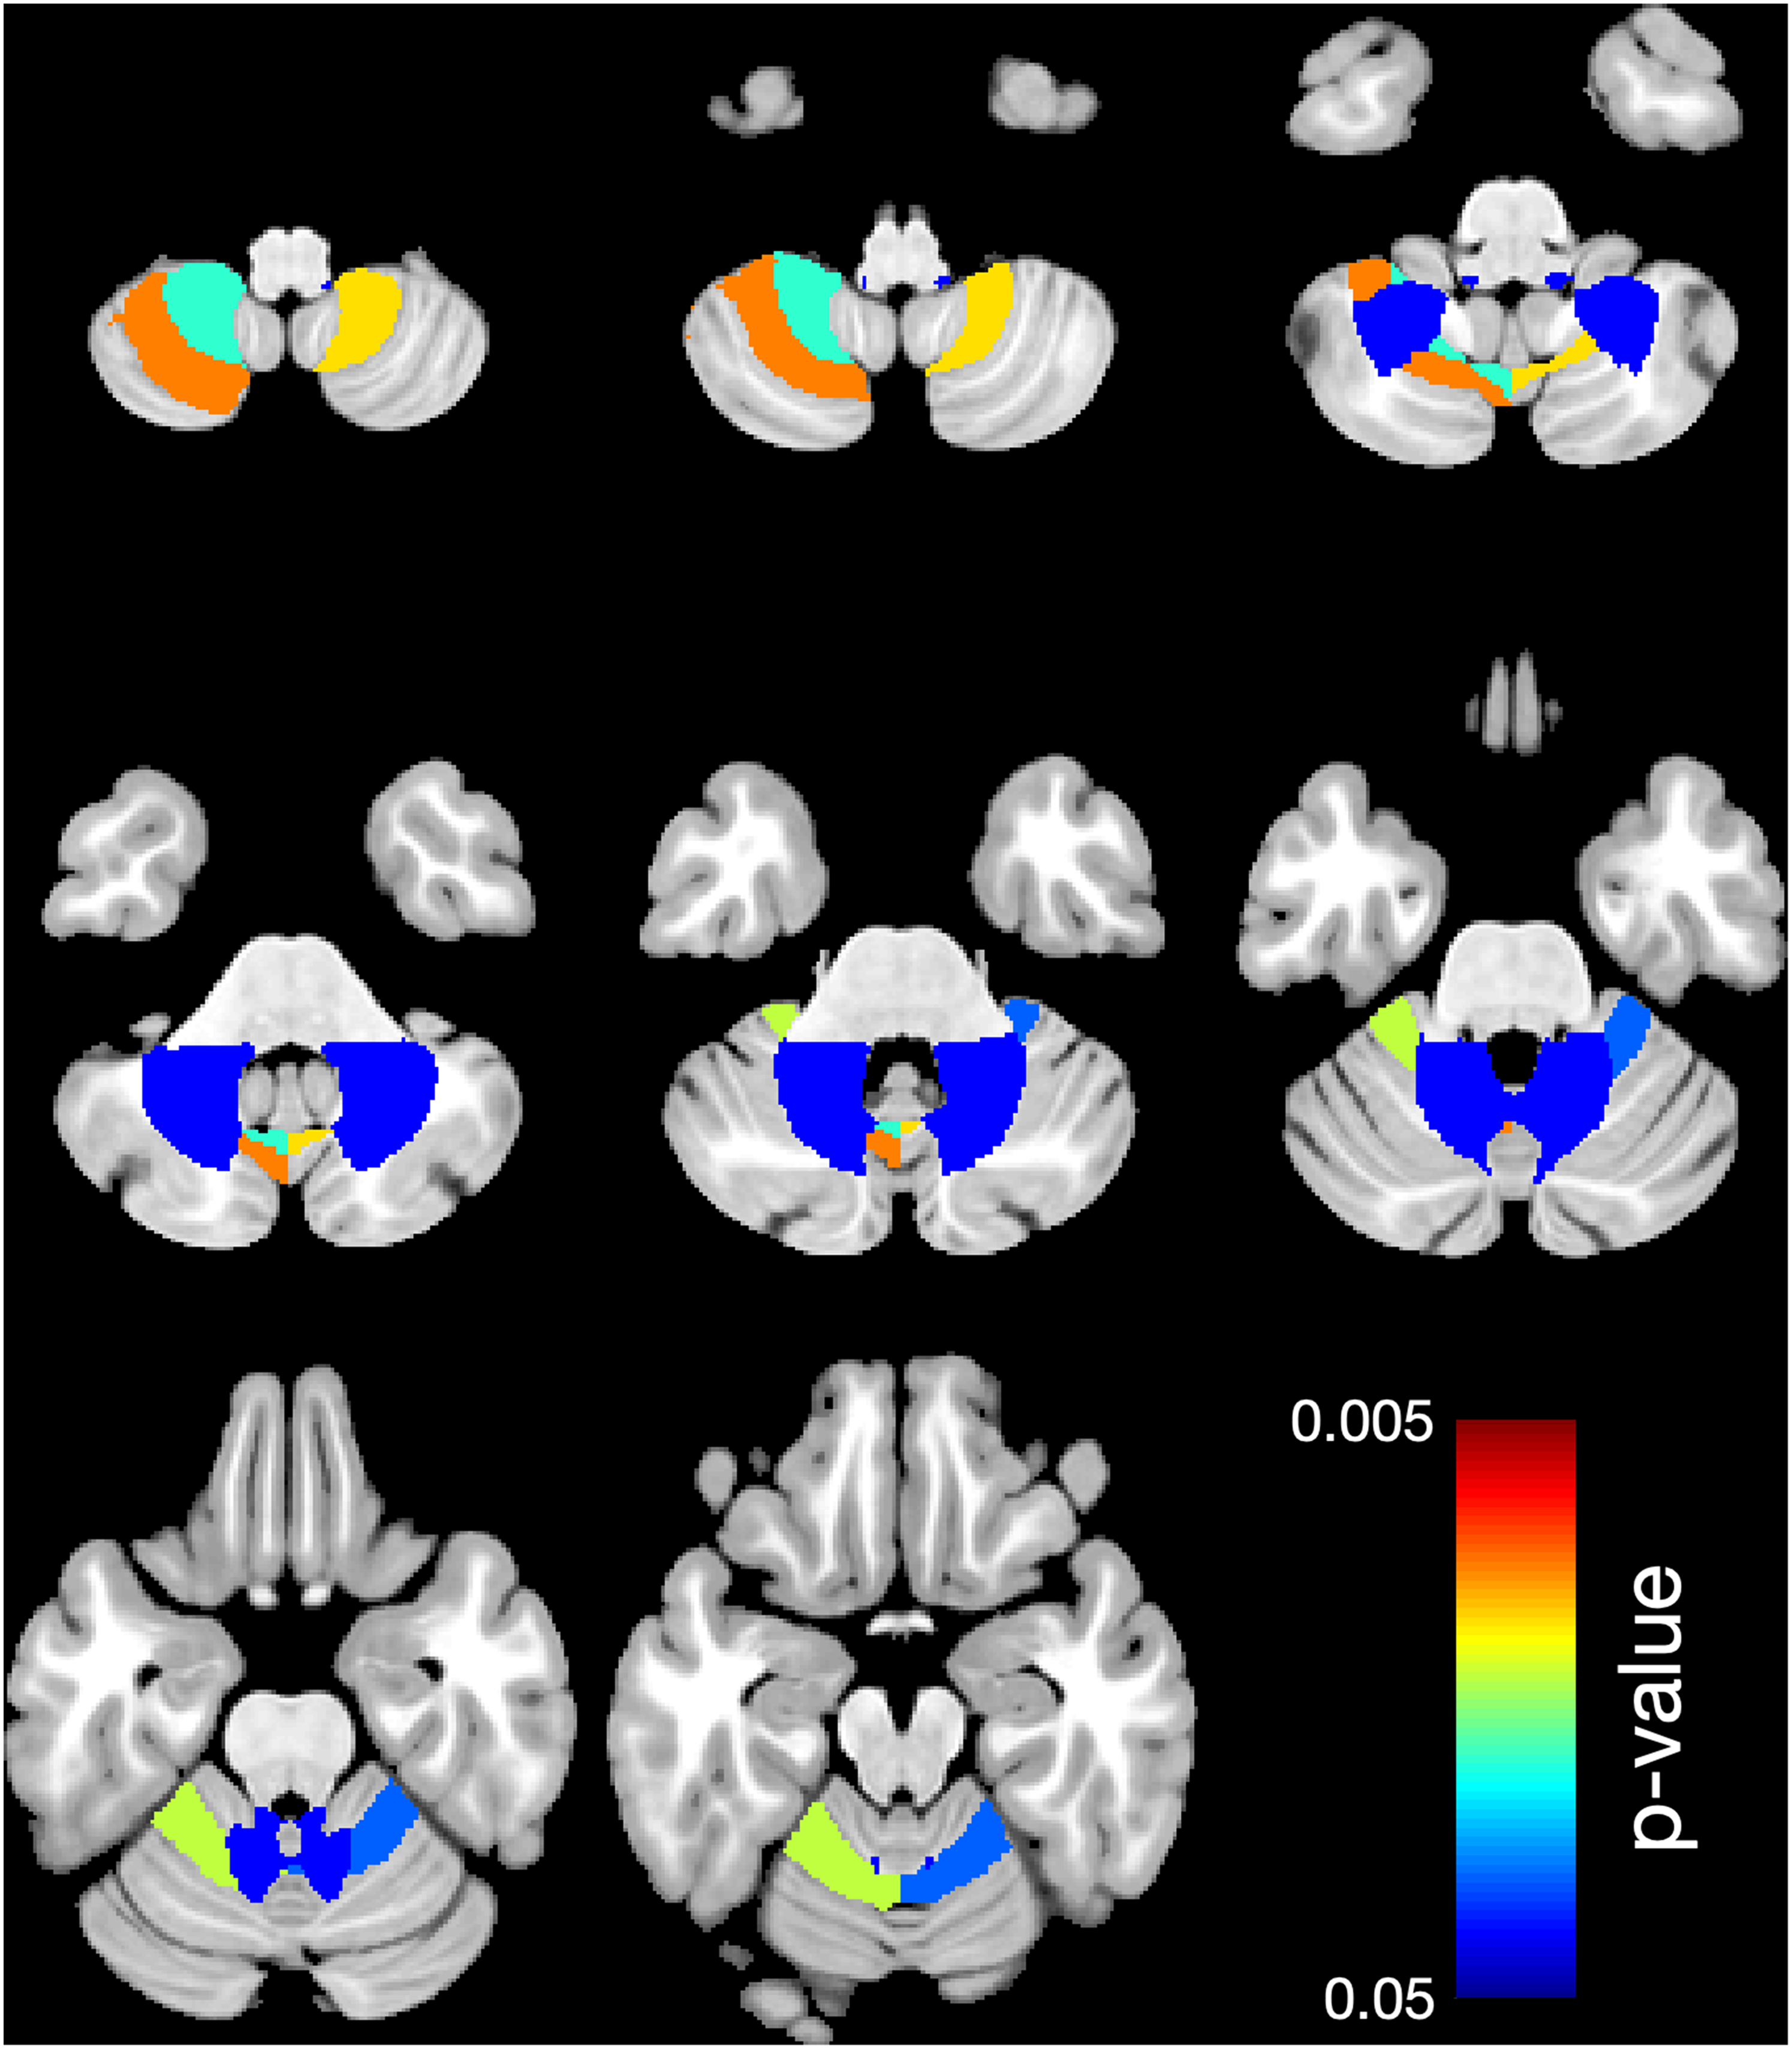
Region-based morphometry. Significantly lower volume of regional white matter (WM) in 5 cerebellar lobules: right L V, left L V, left L VIIIA, right L VIIIB, left L VIIIB comparing the case group to the control group. Colors represent the areas where the volume is lower. The right side of the brain is shown on the right side.
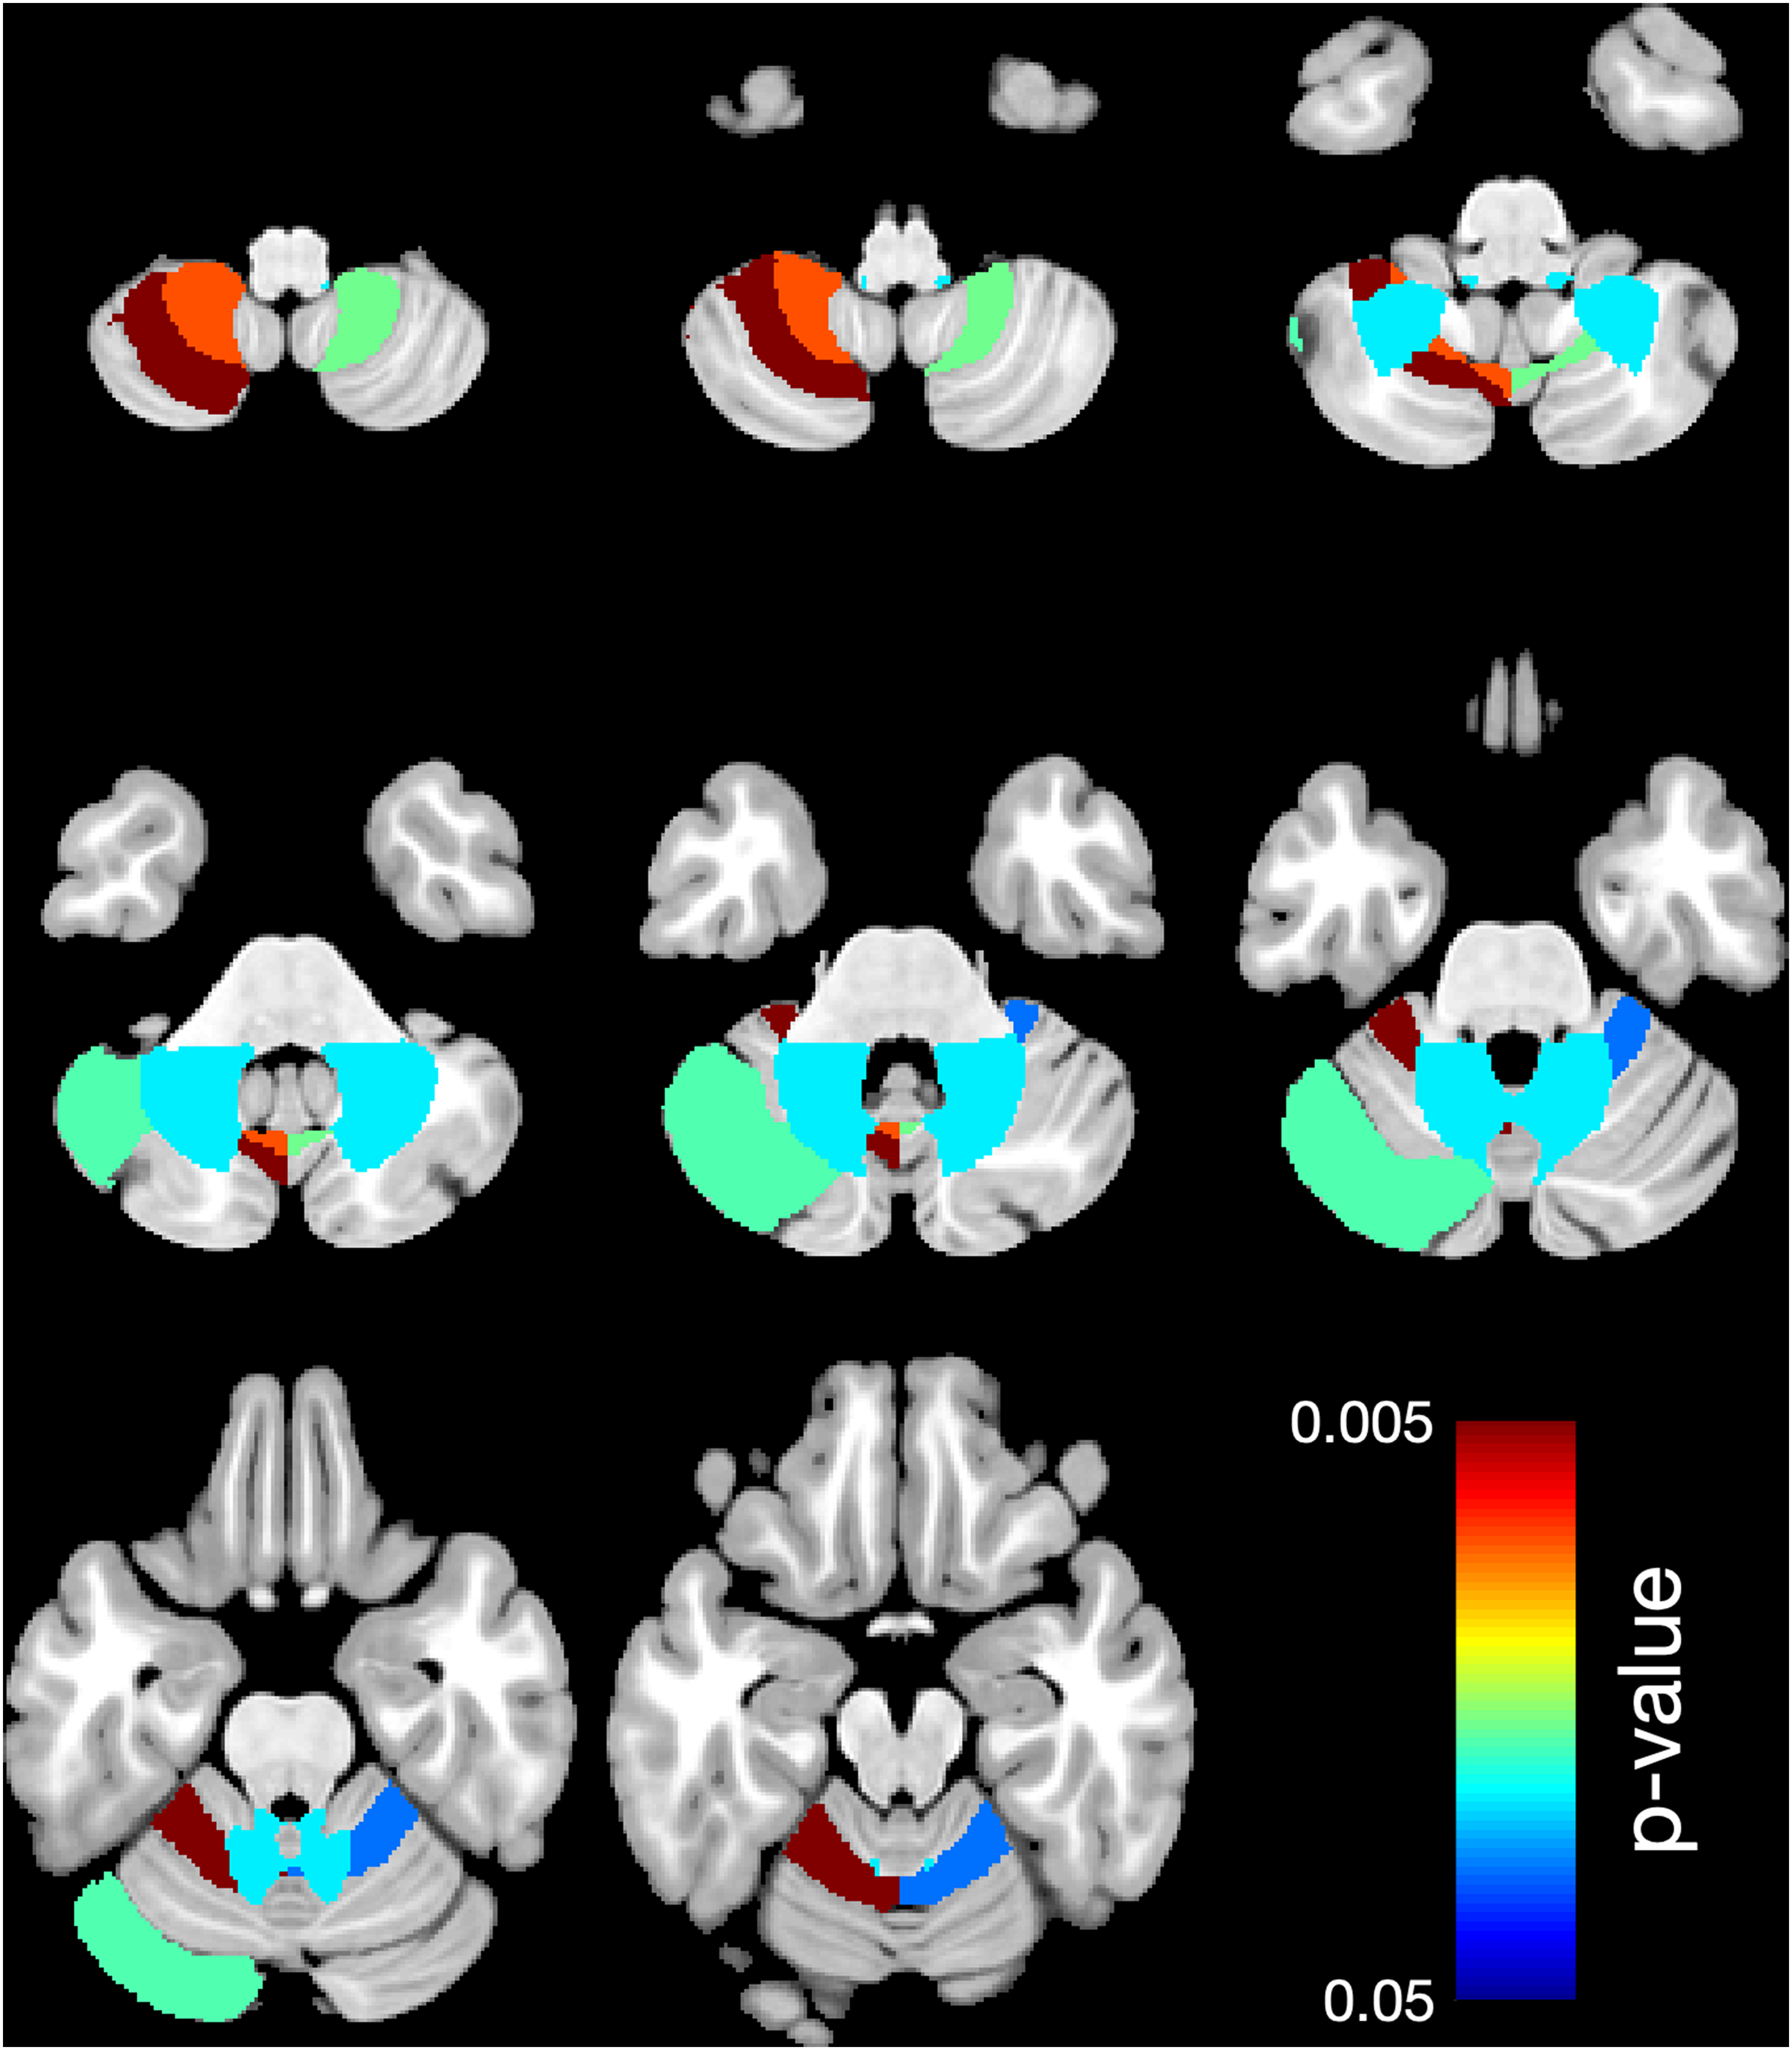
Region-based morphometry. Significantly lower volume of regional white matter (WM) in 6 areas: right L V, left L V, left C I, left L VIIIA, right L VIIIB, left L VIIIB comparing the subgroup A (1 antiseizure medication) to the control group. Colors represent the areas where the volume is lower. The right side of the brain is shown on the right side.
Region-based morphometry. Significant lower volume of regional white matter (WM) in 1 area: right L X, comparing the subgroup B (more than 1 antiseizure medication) to the control group. Colors represent the areas where the volume is lower. The right side of the brain is shown on the right side.
Ratio of CV/TIV Volume Fraction in Regional White Matter (WM): Significantly Lower Volume of Regional Lobules of the Case Group Compared With the Control Group.
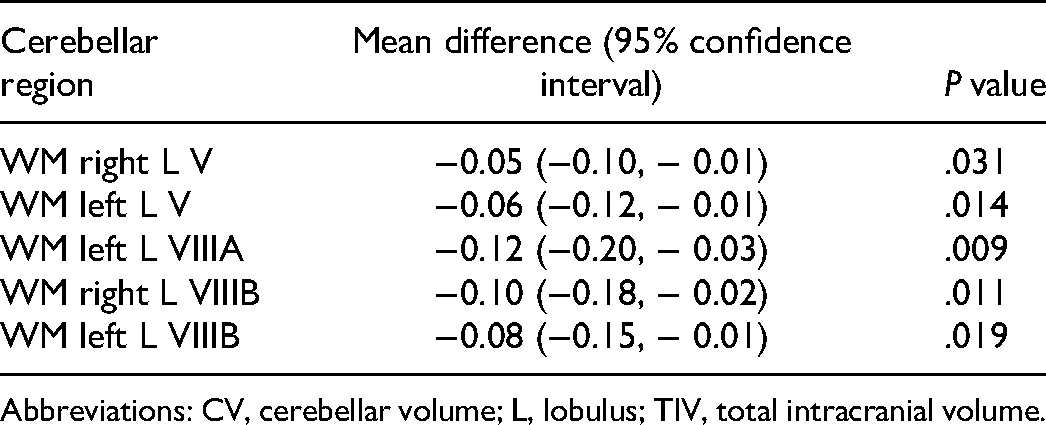
Abbreviations: CV, cerebellar volume; L, lobulus; TIV, total intracranial volume.
Ratio of CV/TIV Volume Fraction in Regional White Matter (WM): Significantly Lower Volume of Regional Lobules of the Subgroup A Compared to the Control Group.
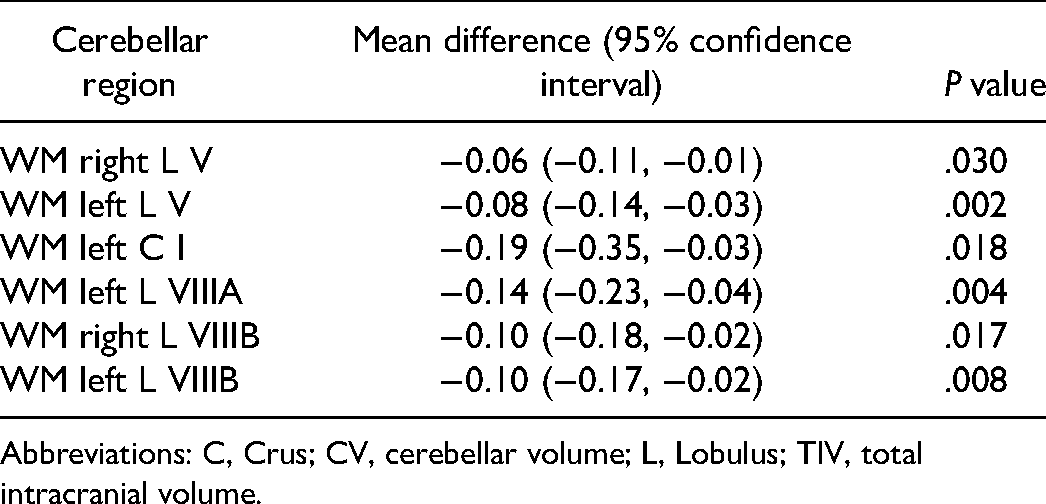
Abbreviations: C, Crus; CV, cerebellar volume; L, Lobulus; TIV, total intracranial volume.
Ratio of CV/TIV Volume Fraction in Regional White Matter (WM): Significantly Lower Volume of Regional Lobules of the Subgroup B Compared to the Control Group.
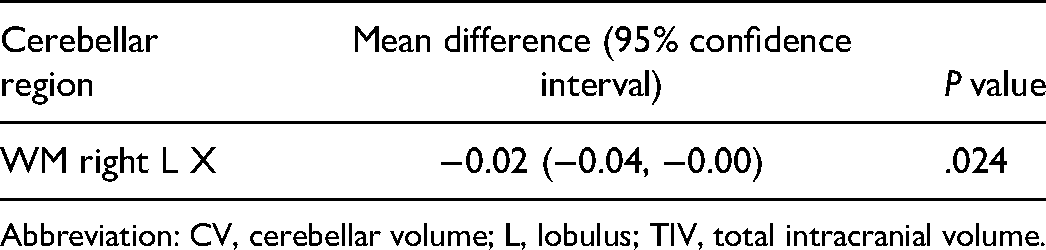
Abbreviation: CV, cerebellar volume; L, lobulus; TIV, total intracranial volume.
Looking at regional cerebellar lobules, gray matter showed significantly greater mean volume in 2 areas (right L X, P = .049, and left L VIIIB, P = .026) comparing subgroup B to control group.
Differences in Demographic and Clinical Parameters
There was no significant association between sex, age at disease onset, duration of epilepsy, number of antiepileptic drugs, seizure frequency at the time of MRI examination, classification, and IQ in multiple regression analysis with cerebellar volume in the case group.
Lower IQ scores were associated with smaller cerebellar volumes. Three patients had an IQ <70, which was defined as intellectual disability.
Discussion
For the first time, region-based morphometry allowed us to accurately determine the volume of the entire cerebellum, gray matter, white matter, and regional lobules in patients aged <18 years. 19 For this purpose, we calculated the volume of the regional lobules of both the white and gray matter.
We could not demonstrate a significant association between cerebellar volume and various demographic and clinical data, such as sex, age at disease onset, epilepsy duration, number of antiepileptic drugs, and seizure frequency at the time of MRI examination and classification.
However, based on the results of our study, the white matter volume of the regional lobules of the cerebellum appears to be significantly lower in children and adolescents with epilepsy of unknown etiology.
Furthermore, we showed that the overall white matter of the cerebellum in children and adolescents with epilepsy of unknown etiology has a significantly lower volume than that in neurologically inconspicuous children. This is in accordance with the results of previous studies.28–31 However, it should be noted that all these studies involved adult patients with epilepsy almost exclusively. To our knowledge, there are no studies on children with epilepsy that explicitly evaluate separate lobules on MRI using region-based morphometry. It should be kept in mind that it is quite possible that the effect demonstrated in this work is not due to epilepsy alone but may also be due to antiseizure medications (ASMs). 32 To our knowledge, no targeted studies of the cerebellum in children with epilepsy have been performed on this aspect either.
In our analysis of total cerebellar white matter volume in the 2 subgroups of children with epilepsy of unknown etiology, only the group of children with 1 ASM showed a significantly lower volume compared with the control group. The subgroup with children receiving more than 1 ASM did not show significant volume differences. A possible explanation is that the small number of cases in subgroup B may have biased the result.
We calculated the CV/TIV volume ratio, 33 thereby eliminating age- or sex-related volume differences in the cerebellum and making the results comparable. 34 This is important because of age-related differences in the absolute volume of the brain between children and adolescents. 35 In addition, several studies have demonstrated that men have a larger total cerebellar volume than women.36–38
For the first time, we used differentiated region-based morphometry analysis of the white matter in each lobule of the cerebellum and were able to detect a significant regional lower volume of the sensorimotor area (LV, LVIII A, and B), which is located partially in the anterior lobus, 39 and in areas of the posterior lobe (crus I), which is involved in higher cognitive functions. 40 Figure 4 shows a supplemental schematic representation based on the Cobra atlas that summarizes our results in the context of the anatomy of the different lobules of the cerebellum.
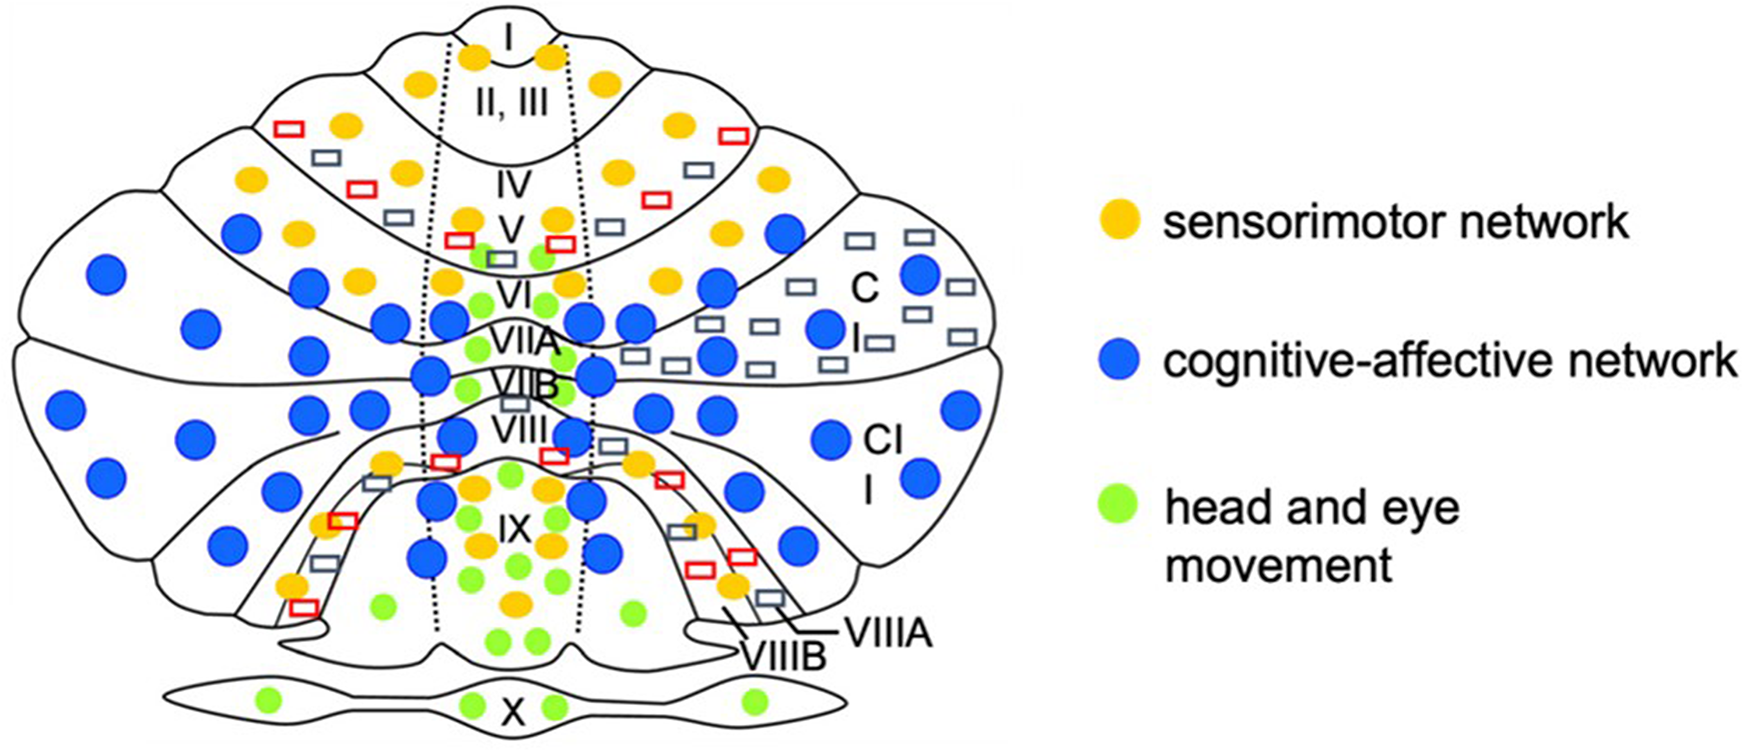
Supplemental schematic map of the cerebellum based on the Cobra atlas: the figure shows schematically the cerebellar areas I to X in the right and left hemisphere as well as in the cerebellar vermis. The networks are assigned to the corresponding cerebellar areas by the distribution of the different colored points. Areas with significant white matter volume reduction are marked by red (significant white matter [WM] volume reduction in the case group) and gray (significant WM volume reduction in the subgroup A) rectangles. The right side shows the anatomical right side of the cerebellum.
Sensorimotor function is detected in the neural network of the anterior lobe. 41 Thus, the main task of the anterior cerebellar lobe seems to be the integration of multisensory information in this complex neuronal system and sending the information back to the cerebral cortex.42,43 In the sensorimotor sector, the cerebellum mediates the implementation of internal models by integrating predictions about the consequences of a movement with sensory feedback. Through this integration, motor behavior can be precisely adjusted.44,45
Higher cognitive task categories, which are processed in the posterior lobe of the cerebellum, include functions of language, verbal working memory, spatial tasks, and executive functions, such as planning, abstract reasoning, and emotional processing.46,47 Recently, Bareš et al summarized findings on the functions of the cerebellum in the cognitive network in a consensus study. 48 He pointed out that the cerebellum is involved in virtually every cerebral process requiring feedback and fine-tuning.
Based on these data, we believe that epilepsy of unknown etiology affects sensorimotor and cognitive cerebellar areas via the tight functional connection across the corticopontocerebellar and cerebellothalamocortical loops between the cerebellum and the supratentorial motor, paralimbic, and association cortices. 48
If a reduction of white matter were the consequence of epilepsy, our data would suggest that pathologic overactivation of cerebral structures, for example, by pathomechanisms such as oxidative stress, would lead to a degeneration of important neurons of the cerebellar system, thus leading to secondary cerebellar symptoms such as ataxia, coordination, and eye movement disorders. Accordingly, cerebellar lobule volumetry could be a sensitive screening parameter that encourages the treating physician to specifically check cerebellar function.
However, if a reduction of afferent cerebellar neurons or white matter into the cerebrum causes or promotes epilepsy, MR volumetry would, on the one hand, have prognostic value regarding seizure control. On the other hand, these results could also be used to therapeutically influence epilepsy by stimulating specific cerebellar structures.
This assumption is also supported by the knowledge of specific cerebellar syndromes.49,50 Thus, structural lesions in circumscribed areas of the cerebellum lead to specific patterns of damage. Accordingly, cognitive deficits with impairment of executive function, visual-spatial processing, language deficits, and affective dysregulation are defined as Schmahmann syndrome. 51 However, given the complexity of the functional and structural connectivity of neuronal networks, further prospective studies are needed to improve our understanding of the causes and effects of volume differences in regional cerebellar lobules.
In addition, many patients with epilepsy have been reported to be more affected by comorbidities as the duration of the disease increases. These additional limitations, such as cognitive deficits, burden many affected patients.52–54 Thus, approximately 75% of adult patients with epilepsy have an average IQ, whereas 90% of the normal population have an average IQ.55,56 In addition, specific learning disabilities in reading, writing, and mathematics are more common in epilepsy than in the normal population.57–59 The correlation between average IQ and cerebellar volume also proved to be nonsignificant in our study, but the tendencies were recognizable. The IQ of the case group was 83.5, which was lower than the average population IQ of 100. 60
Regarding the clinical application of our findings, it is conceivable that cognitive and sensorimotor deficits could already be suspected at an early stage of epilepsy based on the primary cranial MRI examination with region-based morphometry volumetry.
This knowledge about a potential or, until then, not concretely perceived deficit, could possibly be helpful to specifically support affected children. 61 Moreover, it is conceivable that detectable volume changes could be an early indicator of later cognitive deficits or a predictor of epilepsy persistence later in life.
Currently, volumetry of the cerebellum with sequencing of individual lobules requires a large number of personnel and time. Additionally, separate software solutions are required for postprocessing in addition to the regular picture archiving and communication system (PACS). In the future, it would be helpful to develop tools that are easy to use and integrate into PACS.
Limitations of the present study include the small number of patients in the case and control groups, the retrospective approach, the heterogeneous sequence selection of 1.5- and 3-T devices, and the selection of the control group of children with headache and migraine. Patients with migraine or headache may exhibit volume differences.62–64 In addition, a longitudinal study of children and adolescents with epilepsy over a longer period would be interesting to better understand time-related associations during antiepileptic drug therapy. Therefore, a larger prospective study with more patients and the use of only a single 3-T MRI with identical sequence selection, possibly in a multicenter study approach, would be preferable. In our study, only one-third of children with epilepsy were given an IQ assessment. It can be assumed that no IQ test was carried out for many children because they attended mainstream school without a special educational support certificate. No testing was performed in these cases. Therefore, in a subsequent prospective study, IQ assessment of all study participants should be performed to achieve higher statistical power.
Conclusion
Because of different regional functions of the cerebellum, an analysis of the total cerebellar volume alone does not seem to be sufficient. A highly differentiated volume analysis, paying particular attention to a separated analysis of white and gray matter volumes of the individual lobules, is required. Findings could contribute to a better understanding of the complex functions and interrelationships of the neuronal networks of the cerebellum in pediatric patients with epilepsy of unknown etiology.
Footnotes
Author Contributions
KG planned the project, contributed to acquisition, analysis, and interpretation, drafted the manuscript and approved the final version for publications. LL collected data and performed data analysis, critically reviewed the manuscript and approved the final version for publications. PCK, SG, HdV, UB, HJM assisted with data analysis, critically reviewed the manuscript and approved the final version for publications. CG performed data analysis and supervised data collection.
Declaration of Conflicting Interests
The author(s) declared no potential conflicts of interest with respect to the research, authorship, and/or publication of this article.
Funding
The author(s) received no financial support for the research, authorship, and/or publication of this article.
Ethical Approval
The Ethics Committee of the Friedrich Schiller University Jena at the Faculty of Medicine gave its consent for the collection, analysis and publication of the retrospectively collected and anonymized data for this non-interventional study (approval no. 2020-1782-data).