
Abstract
Background:
Physicians in Canada are disproportionately concentrated in urban centers, with rural regions facing significant gaps in specialist care. The geo-spatial characteristics of Interventional Radiology (IR) in Canada have not been systematically studied. This study examines the distribution of Canadian Association of Interventional Radiology (CAIR) members and the sociodemographic characteristics of the populations they serve.
Methods:
A list of active members of the Canadian Association of IR (CAIR) was obtained in May 2025. Data from the Canadian Census was used to gather census division (CD)-level information on population size and demographics including data on ethnicity, income, education, employment, and income. CDs were grouped and compared between those with access to IR care and those without, compared between top and bottom quartiles for each population characteristic, and mapped.
Results:
Of 293 CDs in Canada, only 48 (19.6%) had at least one CAIR IR, leaving 31.6% of the national population without local access. CAIR IRs were strongly clustered in high-population CDs, with Toronto, Vancouver, and Montreal alone accounting for 56.5% of IRs. CDs with CAIR IRs had significantly higher mean populations (527 322 vs 47 675; P < .001), median incomes ($82 760 vs $75 821; P = .002), and educational attainment (31% vs 16%; P < .001). Conversely, CDs with higher proportions of the population being Indigenous were less likely to have CAIR IRs (5% vs 14%; P < .001).
Conclusion:
CAIR member IRs are disproportionately concentrated in large urban centers, leaving substantial geographic disparities. Addressing this maldistribution will require coordinated strategies, including outreach models, telehealth integration, and national workforce planning.
Introduction
It is well established that physicians are disproportionately concentrated in urban and suburban areas compared to rural regions—a disparity that becomes even more pronounced among medical specialists. 1 In Canada, this divide is particularly stark: while 18% of the population lives in rural areas, only 7.1% of physicians (12.5% family medicine and 1.9% specialists) practice there.2,3 There is evidence showing that non-family medicine specialists tend to work in urban settings, a trend that has only been exacerbated by the continued rise in medical specialization.4,5
Rural Canadian communities are often characterized by smaller populations, lower median incomes, reduced employment rates, and fewer residents with a post-secondary education.6,7 These areas also have a higher proportion of Indigenous populations.6,7 According to Statistics Canada, individuals living in rural regions experience poorer health outcomes compared to those in urban centers.8,9 Socioeconomic status can be a barrier to accessing specialist care, with difficulties in access to specialists in Canada existing for those living in rural regions and with lower income. 10 Higher education and income levels are positively correlated with healthy aging and improved health outcomes. 11
Despite the higher burden of chronic disease and associated mortality in rural communities, access to specialist care remains limited. 12 In the U.S., for example, rural areas have 31% fewer medical specialists per capita than urban centers. This shortage contributes to elevated rates of preventable hospitalizations and a 23% higher annual mortality rate. 13
Ahmad et al investigated geospatial and socioeconomic disparities in access to Interventional Radiology (IR) services in the United States. 14 They found that Interventional Radiologists (IRs) are predominantly located in counties with higher populations, greater median household incomes, and higher education levels. Notably, nearly one-third (31.2%) of the U.S. population lacked access to IR services within their own county. 14 Although it is not expected that every citizen has access to IR in their own county, acknowledging the geospatial disparities can help facilitate development of care pathways, such as centralization of care, to reduce the inequitable access to IR.
IR is a subspecialty that provides minimally invasive, image-guided procedures that intersect with nearly all areas of medicine and surgery. These procedures are associated with cost savings and shorter hospital stays.15-17 Yet public awareness of IR remains limited; only 40% of people recognize it as a distinct medical specialty. 18
We hypothesize that Interventional Radiologists in the Canadian Association of Interventional Radiology (CAIR) member database are maldistributed such that rural regions face geographic limitations in their access to these CAIR members. While IR services can be provided by non-CAIR members, studying the distribution of CAIR members and the characteristics of those populations is essential as their absence in certain regions may provide insight into gaps in access to CAIR member IR services.
Methods
Publicly available epidemiological data was obtained through open access and freedom of information. No institutional review board was required to obtain datasets used for analysis.
Data Source
A list of active staff physician members of the CAIR was obtained from CAIR in May 2025. This list included the postal code of the residence of active CAIR members. Adopting a similar methodology to the paper by Ahmad et al 14 where analysis of the distribution of IRs by counties was completed, data on Census Divisions (CDs) was obtained as CDs are provincially legislated areas that are intermediates between provinces and municipalities and are a comparative equivalent to counties. 19 Furthermore, CDs are an amalgamation of municipalities that inform resource allocation which is congruent with the goals of this study. Using a publicly available postal code conversion file, the postal codes of IRs place of residence were converted to the corresponding CD.
The population characteristics for CDs were obtained via publicly available files from Statistics Canada. Specifically, the following information was obtained: the total population, poverty rate, median household income, percent of population that is Indigenous, percent of population that are visible minorities, employment rate, and percent with a bachelor’s degree. This data was accrued by Statistics Canada as part of the 2021 Canadian Census. Cartographic boundary files were obtained via Statistics Canada, providing geographic representations of CDs for mapping purposes.
Analytical Techniques
In anticipation for skewed distributions of IRs, multiple methods of analysis were conducted:
(1) the odds ratios were calculated for each population variable listed above between the number of IRs in the 75th percentile and above and the 25th percentile and below, 95% confidence intervals were calculated to determine statistical significance
(2) the population characteristics listed above for CDs with and without IRs were pooled and compared. Statistically significant differences between the groups was determined via t-test assuming unequal variance, with a P-value of <.05 being used as statistically significant
(3) the number of CDs with 5 or more IRs, 2 to 4 IRs, 1 IR, and 0 IRs were determined and then grouped to assess for trends in their associations with the above listed population variables; these were assessed for statistical significance via Pearson correlation coefficient. The strength of the correlation was described as ±1 being perfect, ±0.80 to 0.99 as very strong, ±0.60 to 0.79 as moderate, ±0.3 to 0.69 as fair, ±0.1 to 0.29 as poor, and ±0.09 to 0 as none. 20
Quantum Geographic Information System (version 3.34.3-Prizren) was utilized to map the number of IRs per CD. A manual gradient was utilized to display a heat map of the number of IRs per CD to create relatively equal number of CDs per non-zero interval. These intervals are the same as those used to analyze the trends in the means of population variables described above.
Results
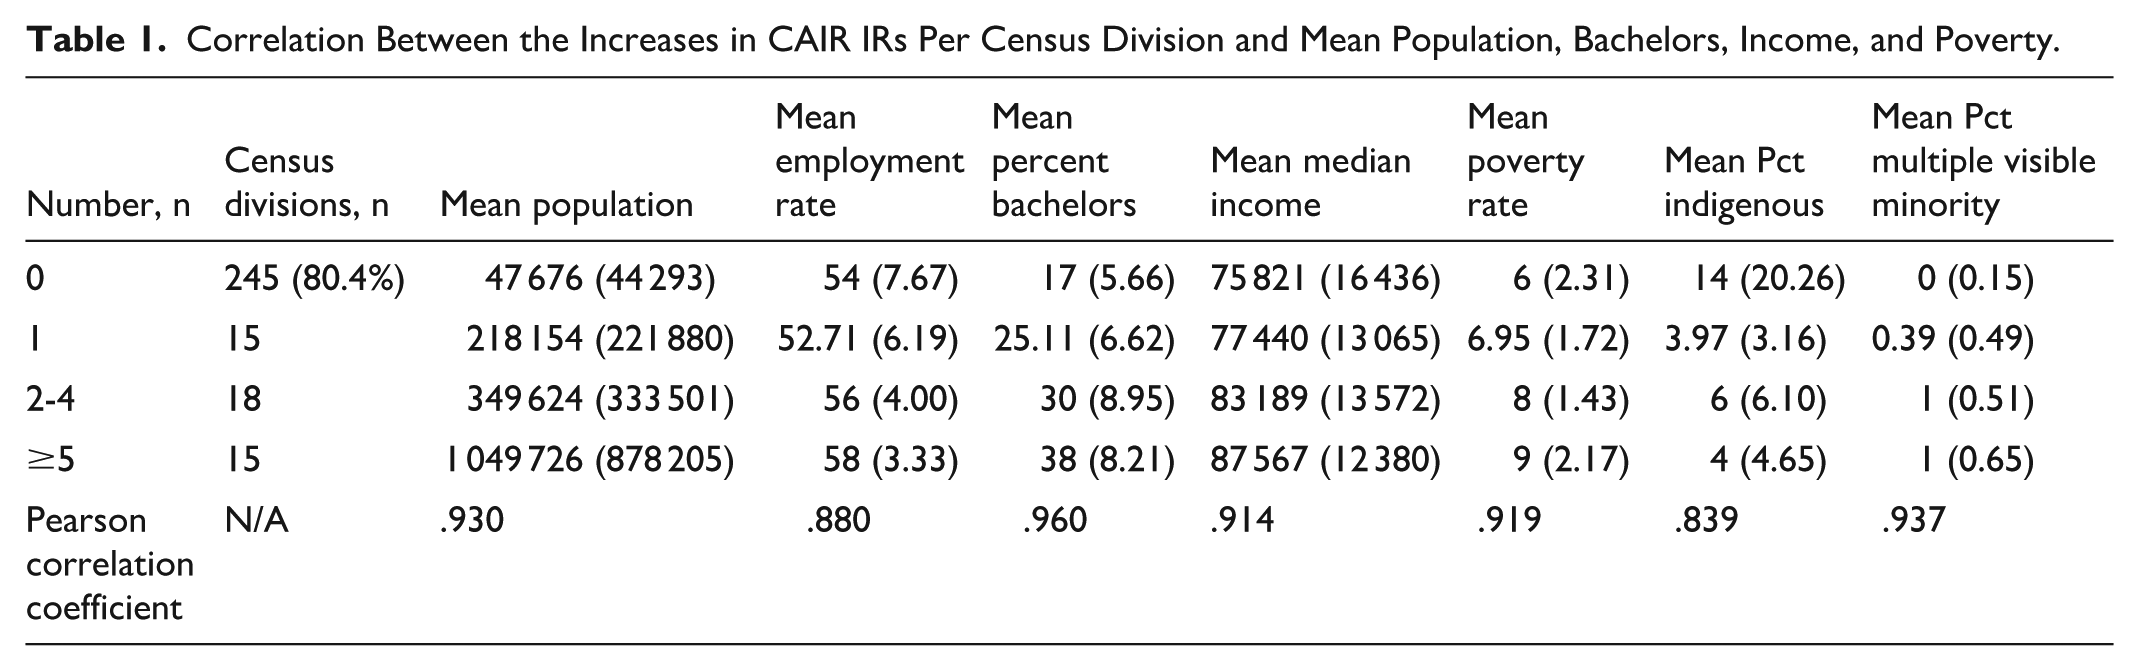
As per the CAIR membership database, there are 200 total IRs practicing in Canada; giving an CAIR member IR-to-population ratio of 0.54/100 000. CAIR IRs are practicing in 19.6% of CDs in Canada (48 of 293). CDs without CAIR IRs comprise 31.6% of the total Canadian population. There is only one CAIR member IR practicing in 15 CDs (Table 1).
Correlation Between the Increases in CAIR IRs Per Census Division and Mean Population, Bachelors, Income, and Poverty.
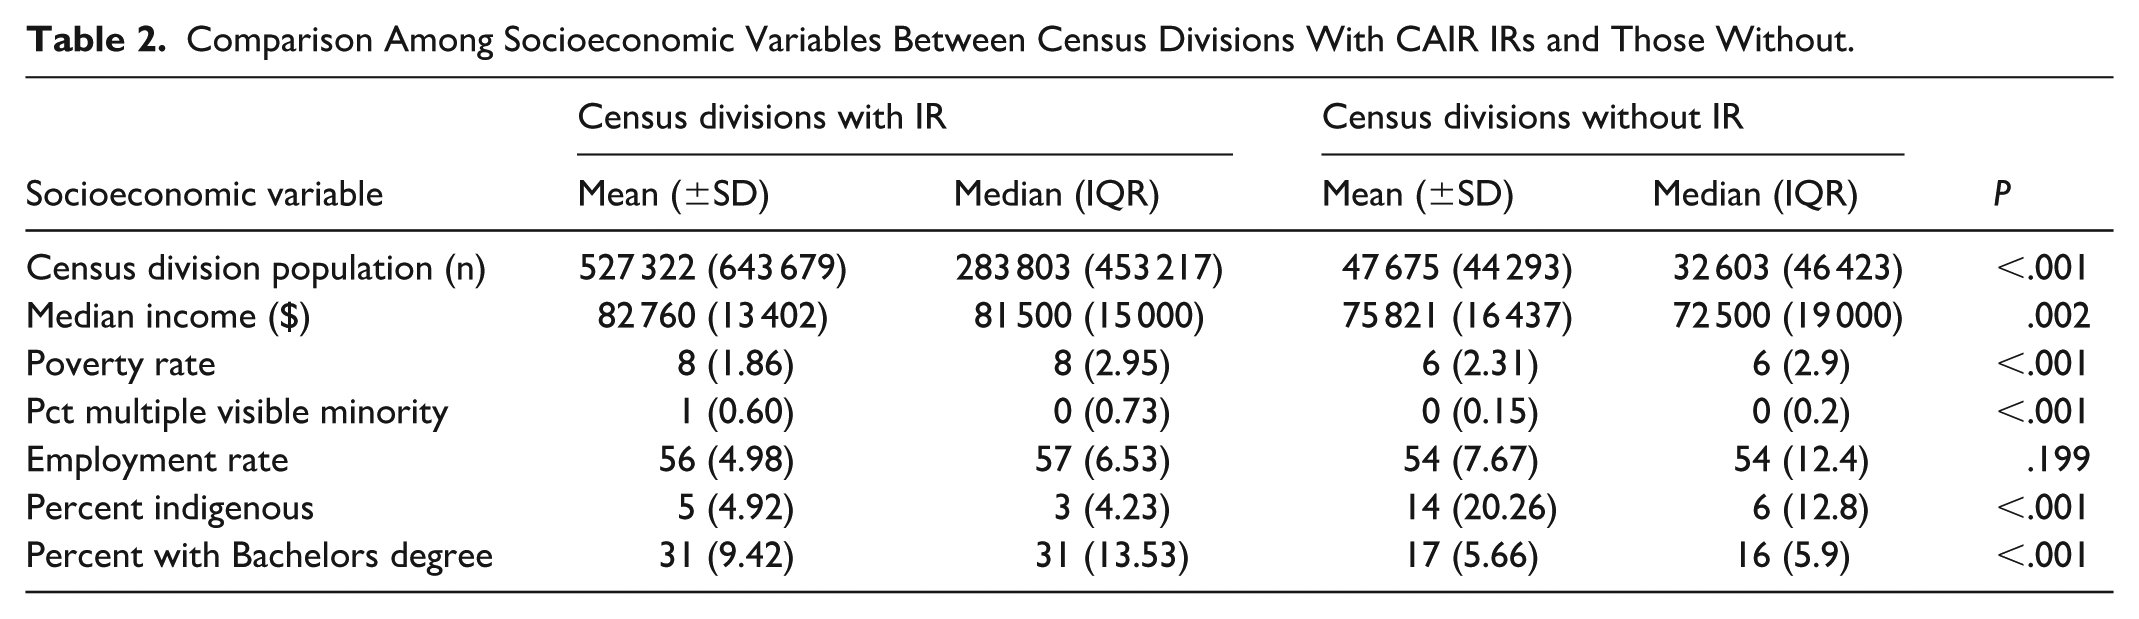
CDs with CAIR IRs have a mean population of 527 322 which is higher than the mean population of 47 675 of those without CAIR IRs (P < .001) (Table 2). The mean CAIR member IR-to-population ratio of CDs with IRs is 1.41/100 000. Poverty rates in CDs with CAIR IRs is 8% compared to 6% in those without (P < .001). The mean percentage of the population that is Indigenous in CDs without CAIR IRs is 14%, compared to a mean percent of the population that is Indigenous of 5% in CDs with CAIR IRs (P < .001). The mean percent of the population with a bachelor’s degree is greater at 31% in CDs with CAIR IRs than in those without at 16% (P < .001). The mean of the median incomes for all the CDs with a CAIR IR compared to the mean of those without a CAIR IR were 82 760 and 75 821 (P = .002). The standard deviations of the population, poverty rate, mean percent of the population that is Indigenous, mean percent of the population with a bachelor’s degree, and the mean median income comparing those with and without CAIR IRs overlap, suggesting significant variability in the data. Mean percentage of the population that is multiple visible minorities is significantly greater in CDs with CAIR IRs (1%) compared to those without (0%; P < .001). Employment rate in CDs with CAIR member IRs is 56% compared to 54% in those without, this difference is not statistically significant.
Comparison Among Socioeconomic Variables Between Census Divisions With CAIR IRs and Those Without.
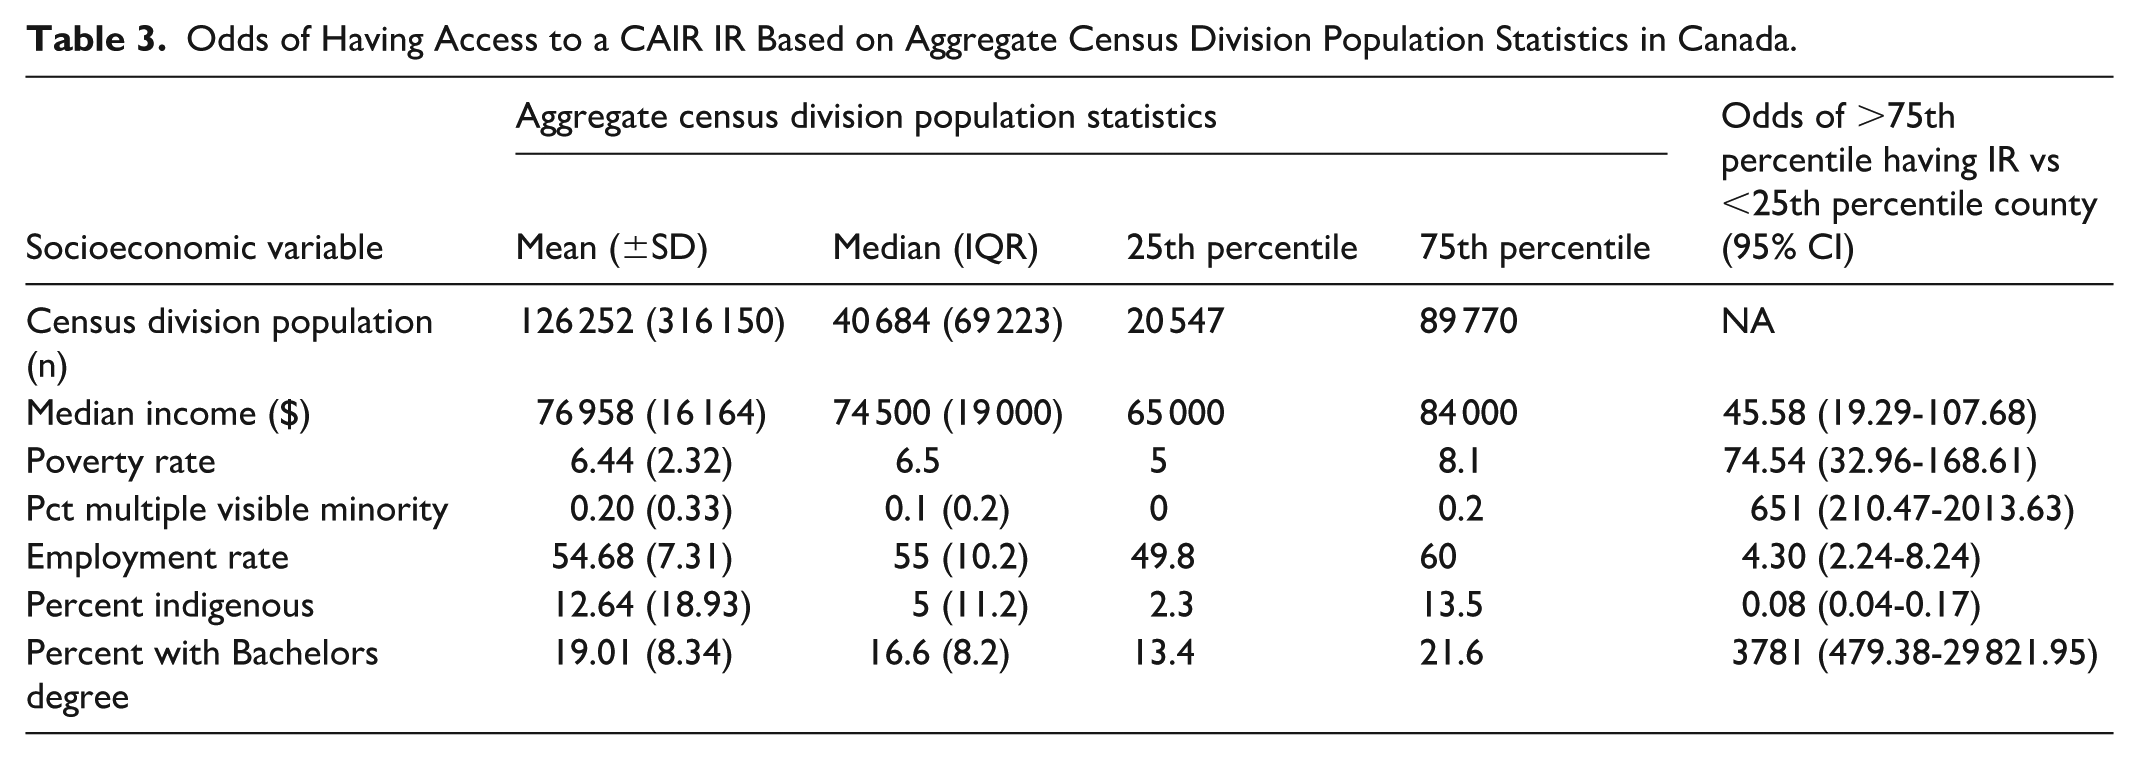
There are no CAIR member IRs practicing in CDs in the 25th percentile or below for population size. 93.5% of CAIR IRs practice in CDs in the top 75th percentile for population (Table 3). The CD with the lowest population with at least 1 CAIR IR is 33 044. CDs with a median income of 84 000 or more are more likely than CDs with median income of 65 000 or lower to have a CAIR IR, with odds of 45.58. Interestingly, CDs that had a higher poverty rate (75th percentile of 8.1% or higher), have 74.54 times higher odds than CDs with a lower poverty rate (25th percentile of 5% or lower). Similarly, the odds of CDs with percentage of the population being multiple visible minorities of 0.2% or higher are 651 times higher than the odds of those with a percent of 0 to have a CAIR IR. CDs with an Indigenous population of 13.5% or higher are less likely to have a CAIR IR than those with an Indigenous population of 2.3% or lower, with odds of 0.08. Finally, the odds of CD populations with a least 21.6% having a bachelor’s degree having a CAIR IR is 3781 times higher than the odds of CDs with 13.4% or less of the population having a bachelor’s degree.
Odds of Having Access to a CAIR IR Based on Aggregate Census Division Population Statistics in Canada.
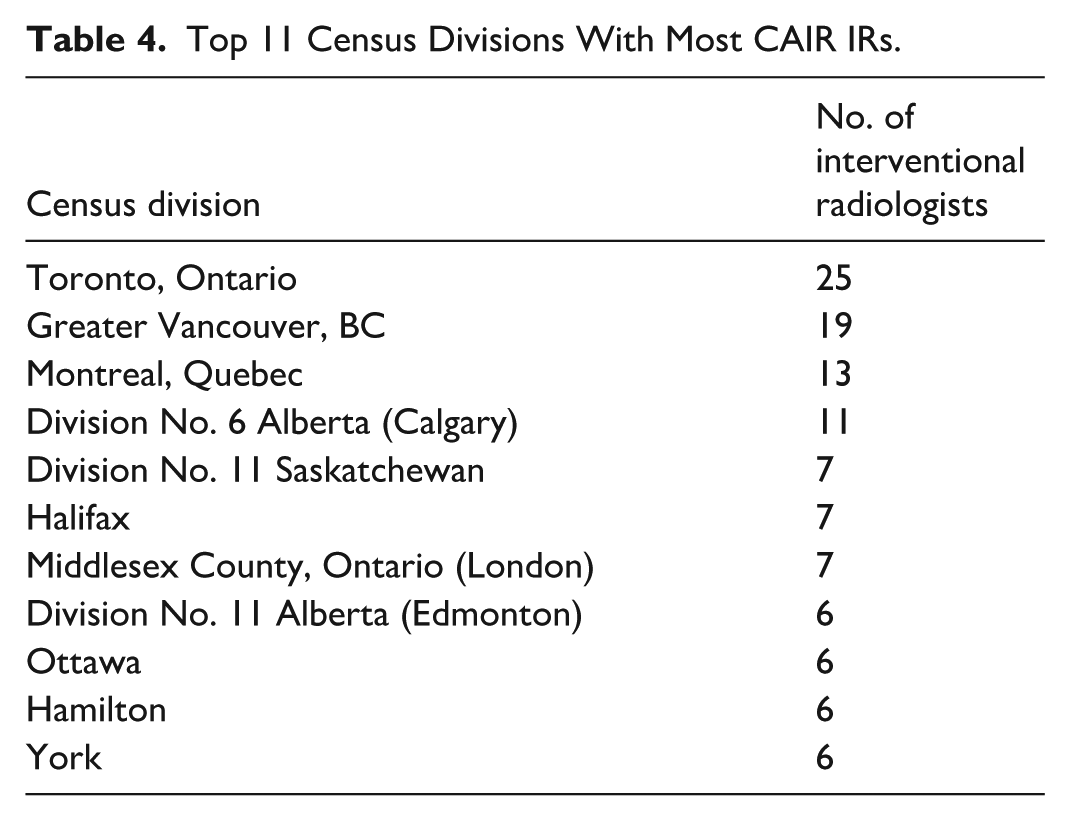
The CDs with the most CAIR IRs are Toronto, Greater Vancouver, and Montreal which are also the 3 CDs with the highest populations in the country (Table 4). The top 11 CDs listed account for 56.5% of the CAIR IRs in Canada despite only accounting for 39.3% of Canada’s population. Mean CAIR member IR-to-population ratio for these top 11 CDs is 0.97 CAIR IR per 100 000 people.
Top 11 Census Divisions With Most CAIR IRs.
A very strong positive correlation is demonstrated between increasing population size and number of CAIR IRs (r = .930). Very strong correlation is shown between increasing employment rate and number of CAIR IRs (r = .880). Very strong correlation is shown between percent of CD with bachelor’s degree and number of CAIR IRs (r = .960). Very Strong correlations are shown with increasing mean median income (r = .914), mean poverty rate (r = .919), and percent multiple visible minority (r = .937). A very strong correlation is shown between decreasing percent of the population that is Indigenous and increasing number of CAIR IRs (r = .839).
Mapping of CAIR member IRs by CD is shown in Figure 1. This shows data consistent with above analyses as large swaths of the country are without CAIR IRs, with CAIR IRs predominantly being clustered in large urban centers.
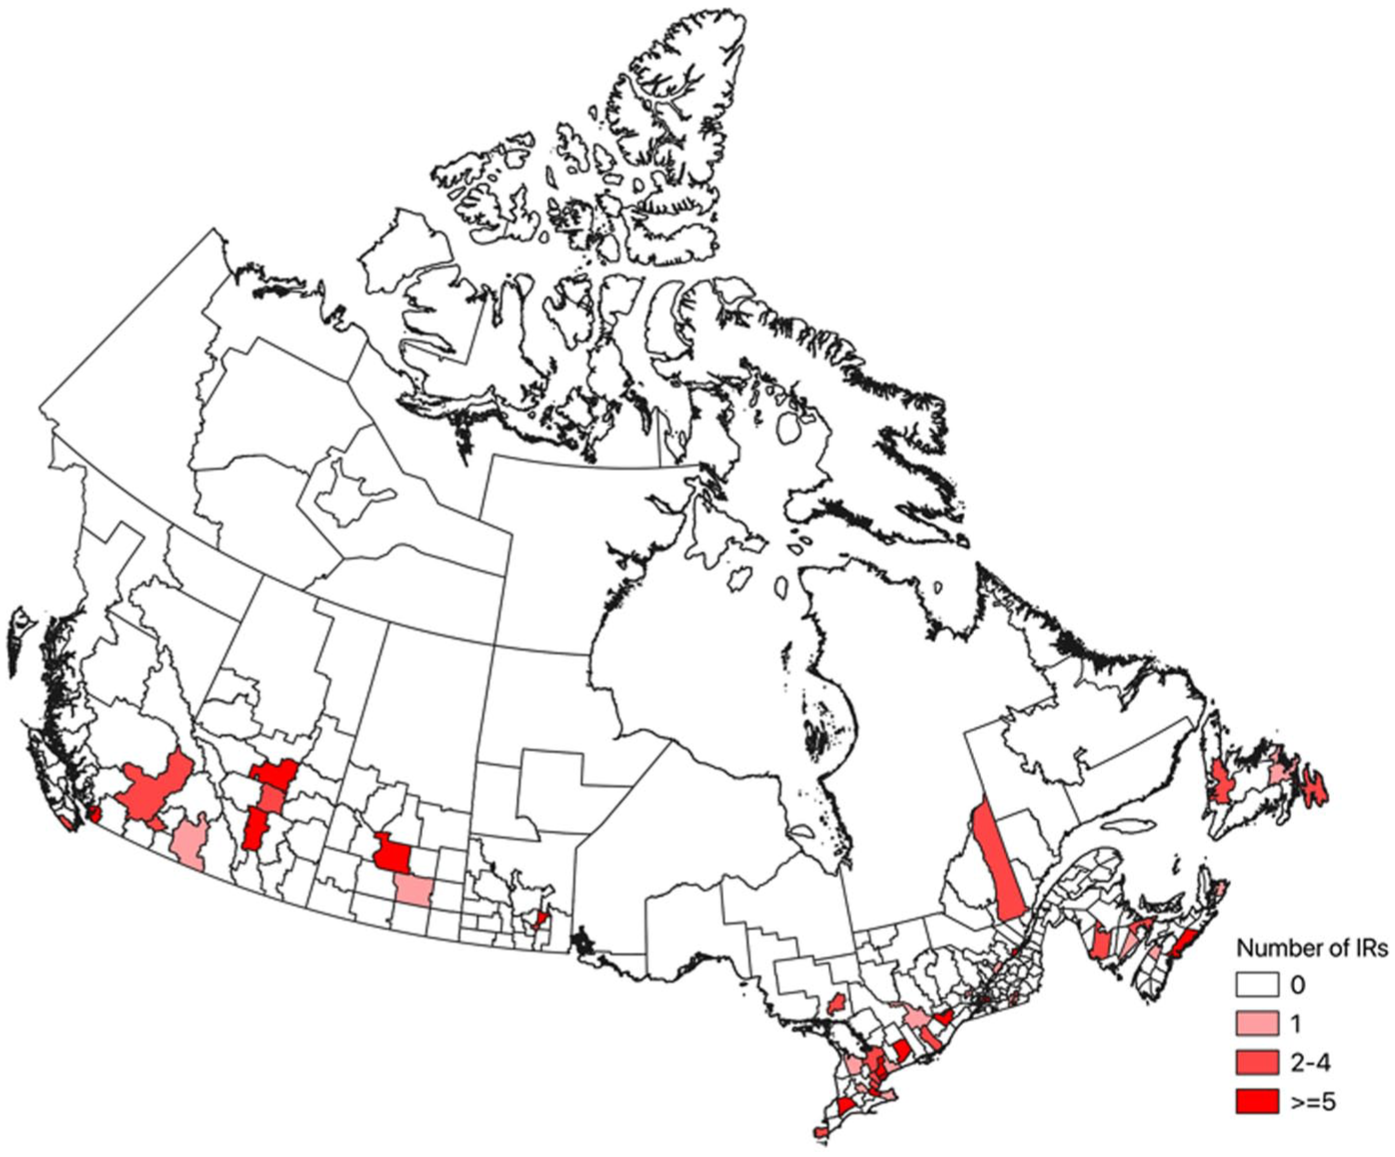
National map of CAIR IRs based on census data.
Discussion
The findings of this study demonstrate that staff IRs from the CAIR membership are asymmetrically distributed across Canada, tending to be present in large population centers. There are also associations between more IRs being present in CDs with higher median incomes, fewer Indigenous peoples, and higher educational attainment. However, the high degree of variability in the characteristics of the CDs confounds the statistical significance of the trends.
These findings of this study parallel those from the United States. 14 The sampled groups of IRs were grouped in urban areas with higher population densities, greater median incomes, and fewer Indigenous peoples or Native Americans. The regional disparities in both Canada and the US have over 30% of their respective populations lacking local access to an IR, despite strong patient preference for minimally invasive care. 18 In addition to patient preferences, cost efficiency is essential. IR has shown to provide cost-saving procedures compared to their non-IR alternatives for the treatment of uterine fibroids, liver cancer, renal tumors, benign prostatic hyperplasia, and peripheral arterial disease.7,21,22 Given the fact that there are both patient and financial motivators to expand IR services, measures must be taken to further analyze and address these gaps in care.
Interestingly, unlike in the US, in Canada CAIR IRs tend to be located in regions with higher poverty rates. Though this may be explained by higher poverty rates being in large urban centers as the average population size for the CDs in the top 75%-ile for poverty rate is 269 788 and thought to be related to higher cost of living. 23 Furthermore, this analysis noted a large region of the country without CAIR IRs, being the Northern Territories. The Northern Territories face substantial inequities in access to healthcare in all realms, likely related to expansive geographic distribution of populations, geographic remoteness leading to challenges with recruitment and retention, and lack of investment. 24
When assessing IR availability in Ontario, Canada, a 2025 study found that of the respondent Radiology Departments, 66% had a formal IR department and of those with an IR department, 30% did not offer on-call coverage. 25 These deficits in coverage are in spite of increasing year-over-year demand with the primary barrier to IR coverage being shortage of physicians. Similar challenges in rural Diagnostic Radiology have been documented by Davidson et al, where it was noted that the number of radiologists practising in urban areas has grown by 24% in urban areas and only 5% in rural areas. 26 They cited several issues as leading to this maldistribution including limited intra-professional support, greater on-call burdens, insufficient imaging infrastructure, minimal exposure to rural practice during training, and under-representation of trainees from rural and remote backgrounds. 26
In 2017, a joint Society of Interventional Radiology and American College of Radiology task force conducted a survey which gives insight into rationale for IRs not practicing in rural regions. 13 Identified barriers included reluctance to perform Diagnostic Radiology (56.2%), hesitancy to work in rural areas (48.8%), inadequate case complexity (68%), and low case volumes (66%). 13
Low awareness of IR among referring clinicians, especially family physicians, may contribute to low case volumes in smaller communities by leading to under-referrals and missed opportunities for patient care. 27 A survey in Ontario revealed that while 71% of family physicians were open to referring directly to IR, most referrals still come through subspecialists. 27 To improve rural access, IRs must actively engage family physicians through educational initiatives such as grand rounds, seminars, and local outreach. These direct referrals would likely require comprehensive disease management rather than procedure-specific interventions. However, this would still require investment into other collaborating specialist services to ensure patients have the correct procedure available to them, and not just an IR procedure.
This maldistribution of specialists is not unique to IR. Similar disparities have been identified in other specialties in Canada, including General Surgery, Gastroenterology, Obstetrics and Gynecology, and Dermatology.4,28-31 Various strategies having been employed to address this. For example, a Urology study in Iowa successfully addressed the shortage of rural urologists through a network of visiting consultants and outreach clinics. 32 This model could be adapted for IR in Canada by developing a provincial or national network of visiting IR consultants and outreach services. Implementing this would require collaboration between IRs, health authorities, and government agencies.
Teleradiology has proven effective in addressing diagnostic backlogs nationwide and can be extended to IR via virtual consultations—an approach widely adopted during the COVID-19 pandemic.33,34 Telehealth improves exposure to IRs for both patients and referring physicians, but limitations remain. Access to telemedicine correlates with income levels, and individuals with limited technological literacy or device access may be excluded.35,36
While expanding IR services to all rural centers may not be practical due to infrastructure, workforce limitations, and case number limitations a centralized model of service delivery could help bridge the gap. For example, there remains a necessity for complex IR cases to occur at large centers where multiple subspecialists and trained ancillary staff are equipped to handle standard and complicated post-procedural courses. High equipment costs, inventory management, and retention of specialized staff (technologists and nurses) remain key challenges that necessitate the maintenance of existing large, highly specialized centers to which patients are transferred to. In Ontario, such a model exists in the form of CritiCall where smaller centers can transfer patients requiring more intensive procedures to larger centers that have the staff, equipment, and capabilities. However, patient transfers are expensive, with a report estimating a $25 000 cost from Iqaluit to Ottawa for a single CT and another estimating medical transportations costing over $600 million in 2021 for federal Non-insured Health Benefits for Status Indigenous Canadians.26,37
Measuring access to IR is a vital first step in addressing care disparities. Standardized metrics will allow us to better understand access barriers and target interventions accordingly. By prioritizing equity, IR can extend its reach and offer high-quality care to marginalized groups. A unified, coordinated vision for IR, spanning provincial and national boundaries, will be necessary to improve access for vulnerable populations.
That said, this study was limited by the relatively small sample size and reliance on voluntarily submitted data from the CAIR database. The dataset includes 200 IRs; of note, not all IRs are CAIR members. Moreover, the database lacks verification of active practice status and board certification, and it does not specify the services provided by each physician. IR encompasses many procedures from simple to complex and thus many interventional procedures may be performed by non-dedicated IRs. National societal definition of what defines an interventional radiologist may be of benefit (ie, board certification). Access was defined solely by the presence of an IR within a patient’s CD of residence, without accounting for the types of procedures offered. As such, certain IR services may be even less accessible than reported. A more comprehensive and standardized national IR registry would enhance future research, allowing for better assessment of how race, education, and rurality intersect with IR care delivery.
In conclusion, an analysis of the CAIR membership database suggests that the IR workforce in Canada, as in the U.S., is small and unevenly distributed, favoring higher-income and more densely populated areas. This study underscores the importance of addressing inequities in IR access and calls for further research into the social determinants of healthcare distribution.
Footnotes
Funding
The authors received no financial support for the research, authorship, and/or publication of this article.
Declaration of Conflicting Interests
The authors declared no potential conflicts of interest with respect to the research, authorship, and/or publication of this article.