
Abstract
Introduction:
This study aimed to determine the positive predictive value (PPV) of magnetic resonance imaging–transrectal ultrasound (MRI-TRUS) machine fusion prostate biopsies, and to identify factors associated with a positive biopsy.
Methods:
With ethics approval, we retrospectively evaluated all MRI-TRUS machine fusion prostate biopsies at our institution from September 2022 to April 2025. True positive clinically significant prostate cancers (csPCa) were defined as Gleason ≥7. PPVs were calculated overall and for PI-RADS 3, 4 and 5 categories. A generalized linear mixed model (GLMM) was created evaluating the following factors as fixed effects: PI-RADS category; prostate-specific antigen (PSA) density (<0.10, 0.10-0.15, ≥0.15 ng/mL2); lesion size (<7, 7-15, ≥15 mm); lesion location (peripheral vs transition zone); ultrasound correlate (present/absent); prostate size (<60 vs ≥60 mL); interval from MRI to biopsy (<6 months or not); and biopsy operator (2 radiologists). Referring urologist (n = 19) and reporting radiologist (n = 8) were included as random effects.
Results:
372 patients (mean age, 67 ± 7 years) with 529 lesions underwent biopsy. The overall PPV was 314/529 (59.4%). For PI-RADS 3 to 5, PPVs were 32/72 (44.4%), 123/243 (50.6%), and 159/214 (74.3%), respectively. In GLMM analysis, PI-RADS 5 versus 3 (OR 3.6, 95% CI, 1.7-7.4), PSA density ≥0.15 ng/mL2 (OR 2.2, 95% CI, 1.2-3.8), and presence of an ultrasound correlate (OR 2.7, 95% CI, 1.7-4.2) were associated with true positive biopsies. Small lesion size <7 mm was associated with a false positive biopsy (OR 0.4, 95% CI, 0.2-0.8).
Conclusion:
The yield of fusion prostate biopsies at our institution is high. PI-RADS 5, PSA density ≥0.15 ng/mL2, and an ultrasound correlate at biopsy were associated with csPCa, whereas sub-7 mm lesions were negatively associated with csPCa.
Introduction
Excluding skin cancer, prostate cancer is the most common cancer and the third leading cause of cancer-related death among Canadian males. 1 In males with suspected prostate cancer, incorporating multiparametric prostate MRI in the diagnostic pathway is now the standard of care in North American2,3 and European 4 guidelines, and has been shown to result in a higher detection rate of clinically significant prostate cancer. 5 The standard for acquisition and reporting of prostate MRI is the American College of Radiology Prostate Imaging Reporting and Data System (PI-RADS) v2.1. 6 Lesions detected on prostate MRI are categorized from 1 to 5, which correspond to increasing levels of suspicion for clinically significant prostate carcinoma (csPCa). PI-RADS 3 to 5 lesions are of intermediate, high, and very high suspicion for csPCa, respectively, and typically require targeted biopsy for further evaluation.
Targeted biopsy of a PI-RADS 3 to 5 lesion can be performed by the operator using anatomic landmarks and mentally planning where the area of interest is (termed cognitive fusion). 7 Alternatively, specialized software and hardware can be used to register MR images with real-time images of the transrectal US (MRI-US machine fusion). Studies have shown that MRI-TRUS machine fusion biopsy outperforms cognitive fusion 8 and traditional sextant biopsy, 9 including two level 1 evidence studies.10,11
In response to this emerging evidence, our center initiated a machine fusion prostate biopsy service in September 2022. The primary objective of this study was to determine the positive predictive value (PPV) of machine fusion prostate biopsies, to assess the yield and to provide feedback to biopsy operators, radiologists reporting MRI, and referring urologists. Because PPV is impacted by the prevalence of disease and other biases, a secondary objective was to identify factors which impact the likelihood of a true positive machine fusion biopsy (ie, positive for csPCa). We hypothesized that in a multivariable model, higher prostate-specific antigen (PSA) density, higher PI-RADS score, larger lesion size, smaller prostate, and peripheral zone lesions would be independently associated with more true positives, while other factors would not significantly alter the likelihood of a true positive biopsy.
Methods
Study Design and Cohort
This HIPAA-compliant retrospective study was performed with approval from our institutional Research Ethics Board, who waived the need for patient consent. The study was conducted at the Queen Elizabeth II Health Sciences Centre, a tertiary care academic center in Halifax, Nova Scotia, Canada, and is reported according to STARD guidelines. 12 Consecutive patients who underwent MRI prostate and TRUS-MRI machine fusion biopsy at our institution between September 2022 and April 2025 were included. Exclusion criteria were patients with MRIs performed at outside institutions, suboptimal MR image quality, and technically inadequate fusion biopsy (such as failure in image registration or probe tracking equipment).
Prostate MRI Protocols
Prostate MRIs were performed on 1.5 T (Siemens Magnetom Sola) and 3 T (GE Discovery 750 and Siemens Magnetom Vida) magnets. MR imaging protocols were compliant with PI-RADS v2.1 6 and Canadian Association of Radiology (CAR) 7 technical specifications. Our institution switched to a biparametric MRI (bpMRI) protocol in 2023, reserving dynamic contrast-enhanced images for patients with pelvic hardware which may degrade image quality, such as a hip arthroplasty. However, patients with a PI-RADS 3 lesion detected in the peripheral zone were recalled for dynamic contrast-enhanced images, similar to what is done elsewhere in Canada. 13 If contrast-enhanced imaging was required, this was performed prior to biopsy. Prostate MRIs were reported by 8 board-certified, fellowship-trained abdominal radiologists in accordance with PI-RADS v2.1 and CAR standards.6,7
Machine Fusion Biopsy Technique
MRI-TRUS machine fusion prostate biopsies were performed at the request of the referring urologist using the DynaCAD – UroNav system (Philips Healthcare, Andover, MA, USA). UroNav uses a free hand approach where the transrectal US probe is tracked electromagnetically in real time. Fusion biopsies were performed by 2 radiologists (MRB and AFC) experienced with sextant and cognitive fusion prostate biopsies and trained in the DynaCAD – UroNav machine fusion technique. The two radiologists segmented the prostate on axial T2-weighted MR and TRUS images before and during the procedure, respectively, and the two segmented volumes were fused using elastic registration. Machine fusion biopsies were performed with TRUS guidance, local anesthesia, and antibiotic prophylaxis. A few days prior to the procedure, patients were screened by a nurse for any risk factors of urosepsis, such as immune compromise, diabetes, or antibiotic resistance; patients that screened positive were administered an additional antibiotic (tobramycin, 2 mg/kg up to 200 mg) intramuscularly 1 hour prior to the procedure.
At least four 18-gauge core biopsies were acquired of each PI-RADS 3 to 5 lesion identified on MRI. An additional biopsy was acquired if samples were fragmented or short. During the procedure, note was made whether the target had a sonographic correlate on TRUS images. Concurrent sextant biopsy was offered to patients if this had not been performed in the past year, including all biopsy-naïve patients.
Data Collection
Data were collected by two students (KK, BT). Patient data elements were age and most recent serum PSA at the time of biopsy. MRI data included referring urologist, date of examination, and reported prostate volume. For each target, the size, location (peripheral zone or transition/central zone), PI-RADS score, and reporting radiologist were recorded. Biopsy data included the date of the procedure, operator, and for each target, the presence of an ultrasound correlate and histological results.
Definition of True and False Positives
Histology reports were used as the gold standard in this study. A true positive biopsy for csPCa was defined as International Society of Urological Pathology (ISUP) Grade Group >1 (corresponding to Gleason score ≥7). An ISUP Grade Group of 1 (Gleason score ≤6) was considered a false positive. PPVs were derived according to the equation PPV = TP/(TP + FP).
Statistical Analysis
PPVs were calculated for the cohort as a whole and for PI-RADS 3 to 5 subgroups, with 95% confidence intervals. PPVs for the following subgroups were also obtained: referring urologist (n = 19); reporting radiologist (n = 8); PSA density (<0.10, 0.10-0.15, ≥0.15 ng/mL2), based on previously proposed thresholds14,15; lesion size (<7, 7-15, ≥15 mm); lesion location (peripheral zone vs transition zone); ultrasound correlate at TRUS (present/absent); prostate size (<60 vs ≥60 mL); interval from MRI to biopsy (<6 months or not); and biopsy operator (2 radiologists). PPVs amongst subgroups were compared using Fisher’s exact or chi-square tests. The Bonferroni correction was applied to a significance level of .05 and 10 comparison tests, corresponding to an adjusted significance level of .005.
To evaluate which factors impact PPV in a multivariable fashion, a generalized linear mixed model (GLMM) was performed, predicting positive biopsy with these factors as fixed effects and reporting radiologist and referring urologist as random effects. The model was constructed by a biostatistician (MA) using R version 4.4.0. 16
Results
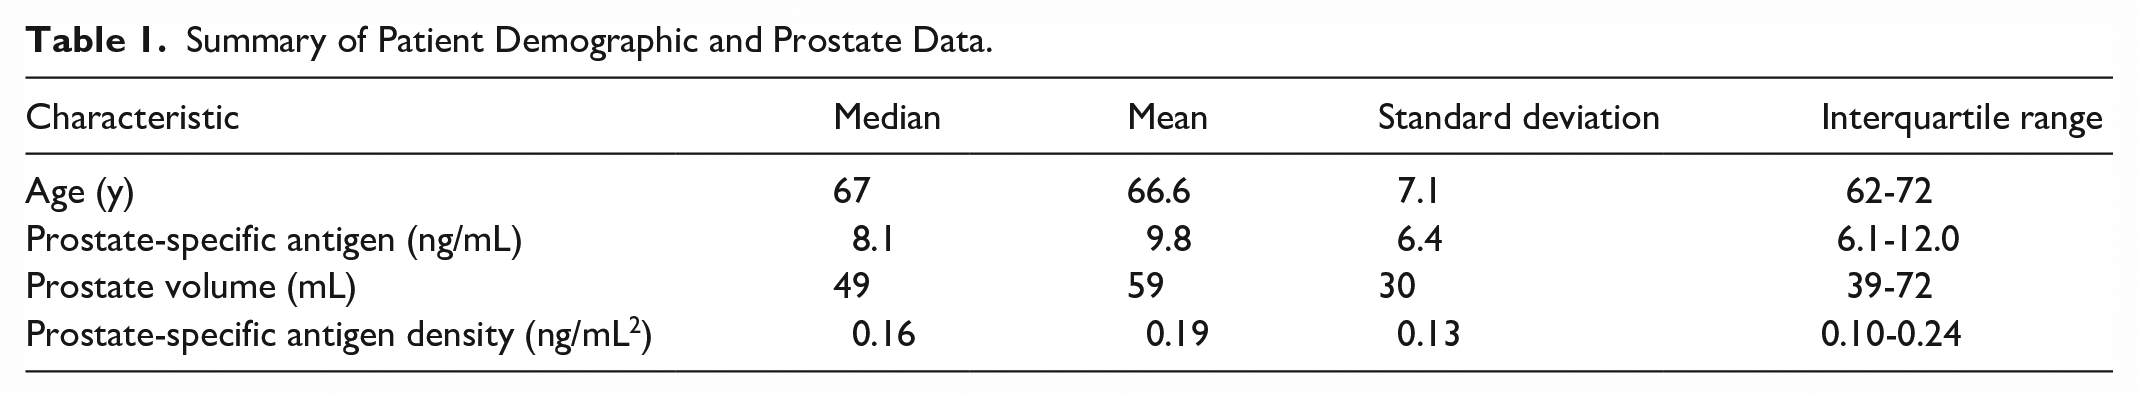
Shown in Figure 1 is a flowchart of the study cohort. Following exclusion of 20 patients, there were 372 patients with 529 PI-RADS 3 to 5 lesions included in the study. One hundred and seventeen patients had multiple lesions. A summary of patient demographic and prostate data is provided in Table 1. The mean age was 67 ± 7 years (interquartile range, 62-72 years). The mean PSA was 9.8 ± 6 ng/mL (interquartile range, 6.1-12.0 ng/mL), the mean prostate volume was 59 ± 30 mL (interquartile range, 39-72 mL), and the mean PSA density was 0.19 ± 0.13 ng/mL2 (interquartile range, 0.10-0.24 ng/mL2).
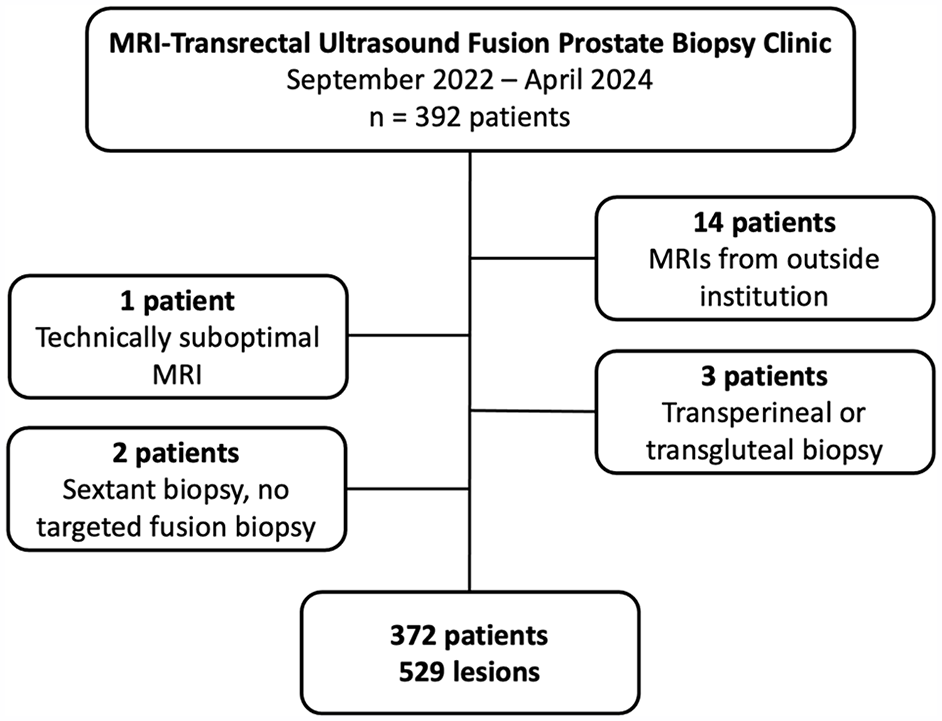
Patient flowchart.
Summary of Patient Demographic and Prostate Data.
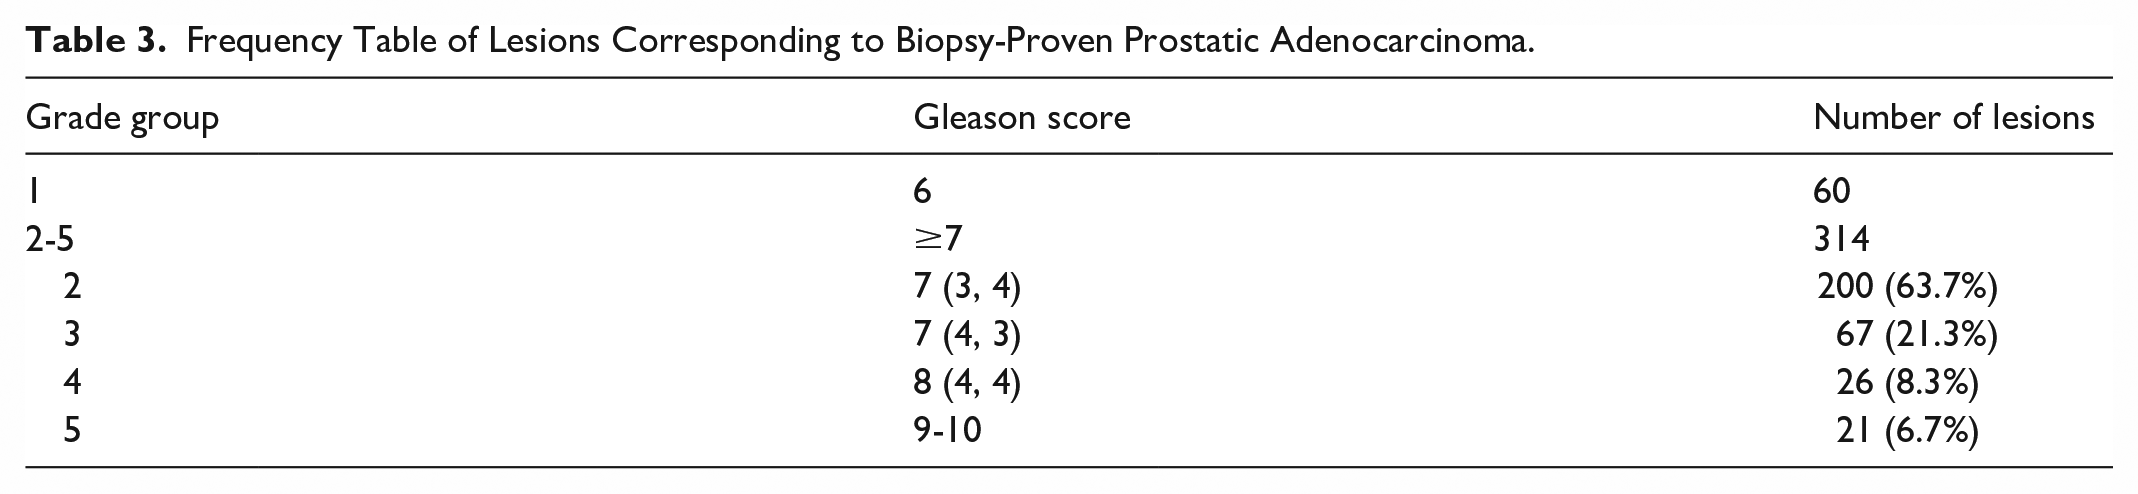
Shown in Table 2 is a summary of PPVs according to the various subgroups, with results from the univariate analysis. The overall PPV was 314/529 (59.4%, 95% CI, 55.2%-63.5%). PPVs for PI-RADS 3 to 5 lesions were as follows, respectively: 32/72 (44.4%, 95% CI, 33.0%-55.9%), 123/243 (50.6%, 95% CI, 44.3%-56.9%), and 160/214 (74.3%, 95% CI, 68.4%-80.2%), respectively (P < .0001). Significant differences in proportion of true positives were found with reporting radiologist (P = .002), PSA density (P < .0001), lesion size (P < .0001), presence of an ultrasound correlate (P < .0001), and prostate size (P = .0002). There was no association with referring urologist (P = .19), lesion location (P = .41), time interval between MRI and biopsy (P = .01), or biopsy operator (P = .72). Shown in Table 3 is a frequency table of biopsy-proven lesions with prostatic adenocarcinoma according to Grade group.
Positive Predictive Value (PPV) According to Various Subgroups.
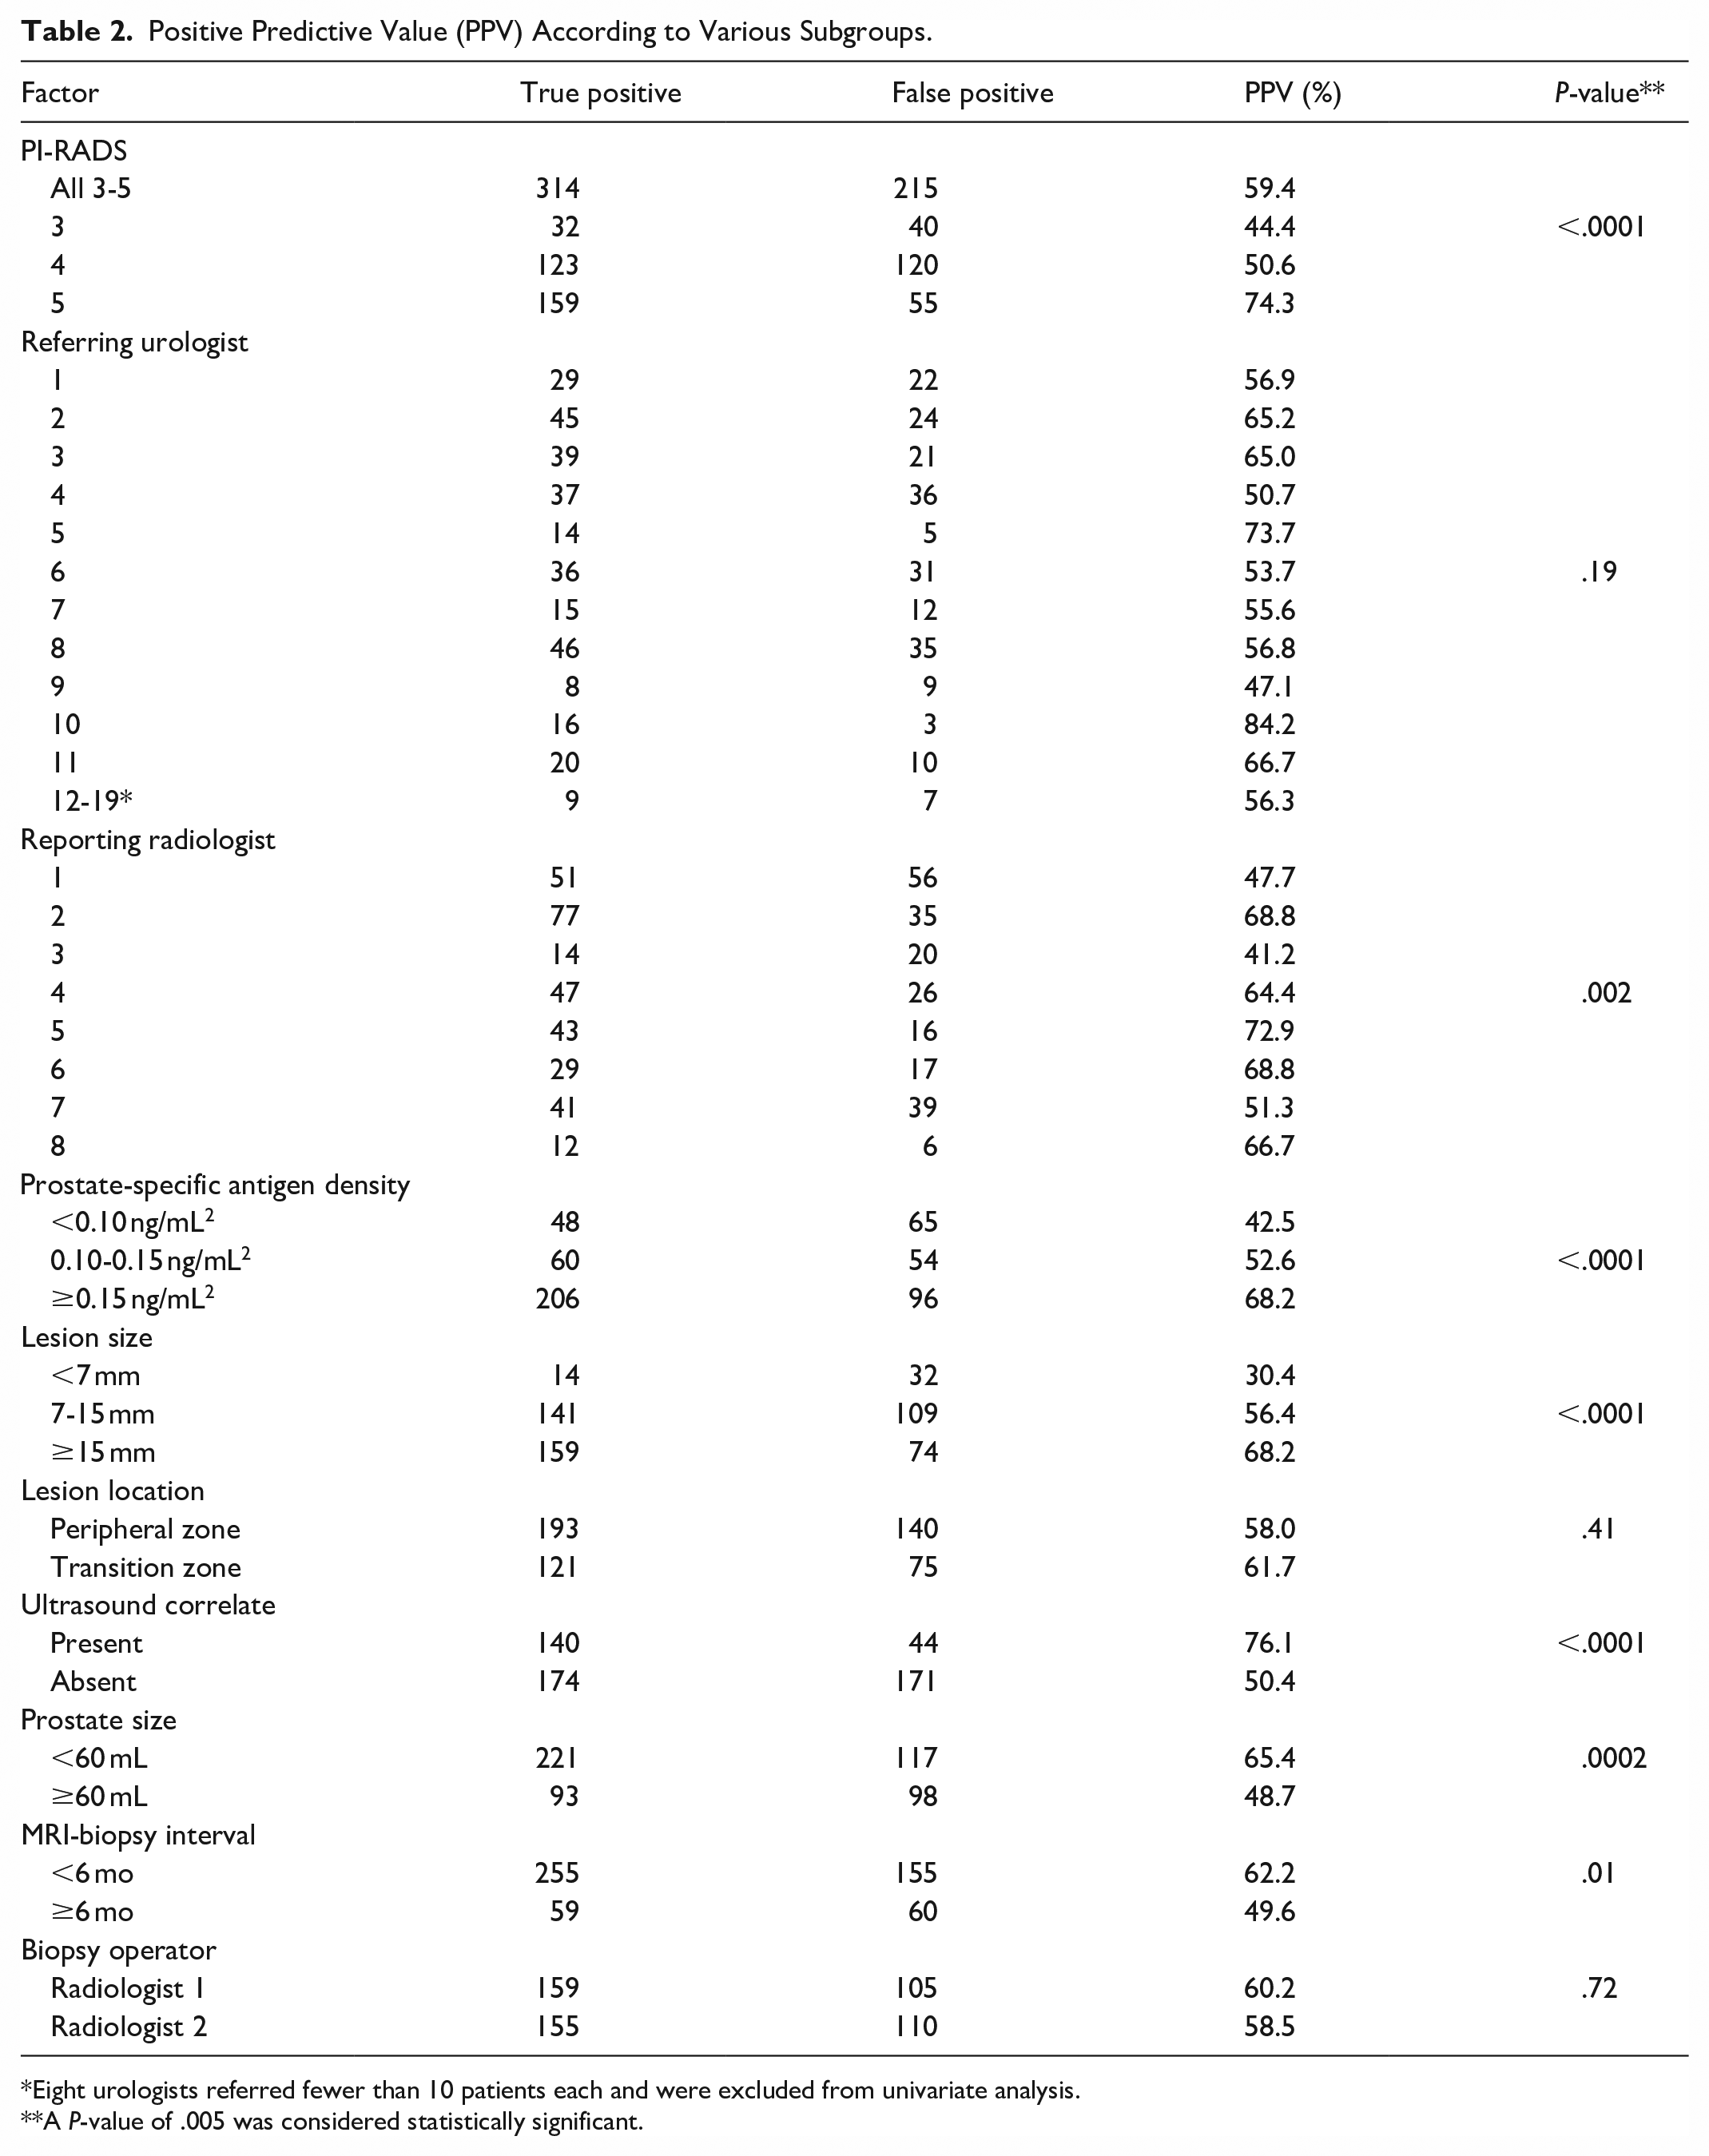
Eight urologists referred fewer than 10 patients each and were excluded from univariate analysis.
A P-value of .005 was considered statistically significant.
Frequency Table of Lesions Corresponding to Biopsy-Proven Prostatic Adenocarcinoma.
Shown in Figure 2 is a forest plot of the GLMM analysis. Factors that were associated with a true positive biopsy were PI-RADS 5 versus 3 (OR 3.56, 95% CI, 1.70-7.43), PSA density ≥0.15 ng/mL2 (OR 2.17, 95% CI, 1.23-3.81), and presence of an ultrasound correlate (OR 2.66, 95% CI, 1.70-4.17). A lesion less than 7 mm was associated with a false positive biopsy (OR 0.39, 95% CI, 0.19-0.81). Other factors were not associated with a different likelihood of true positive biopsy. The variances for reporting radiologist and referring urologist were 0.15 and 0.01, respectively, indicating minimal and negligible effect from these two factors, respectively.
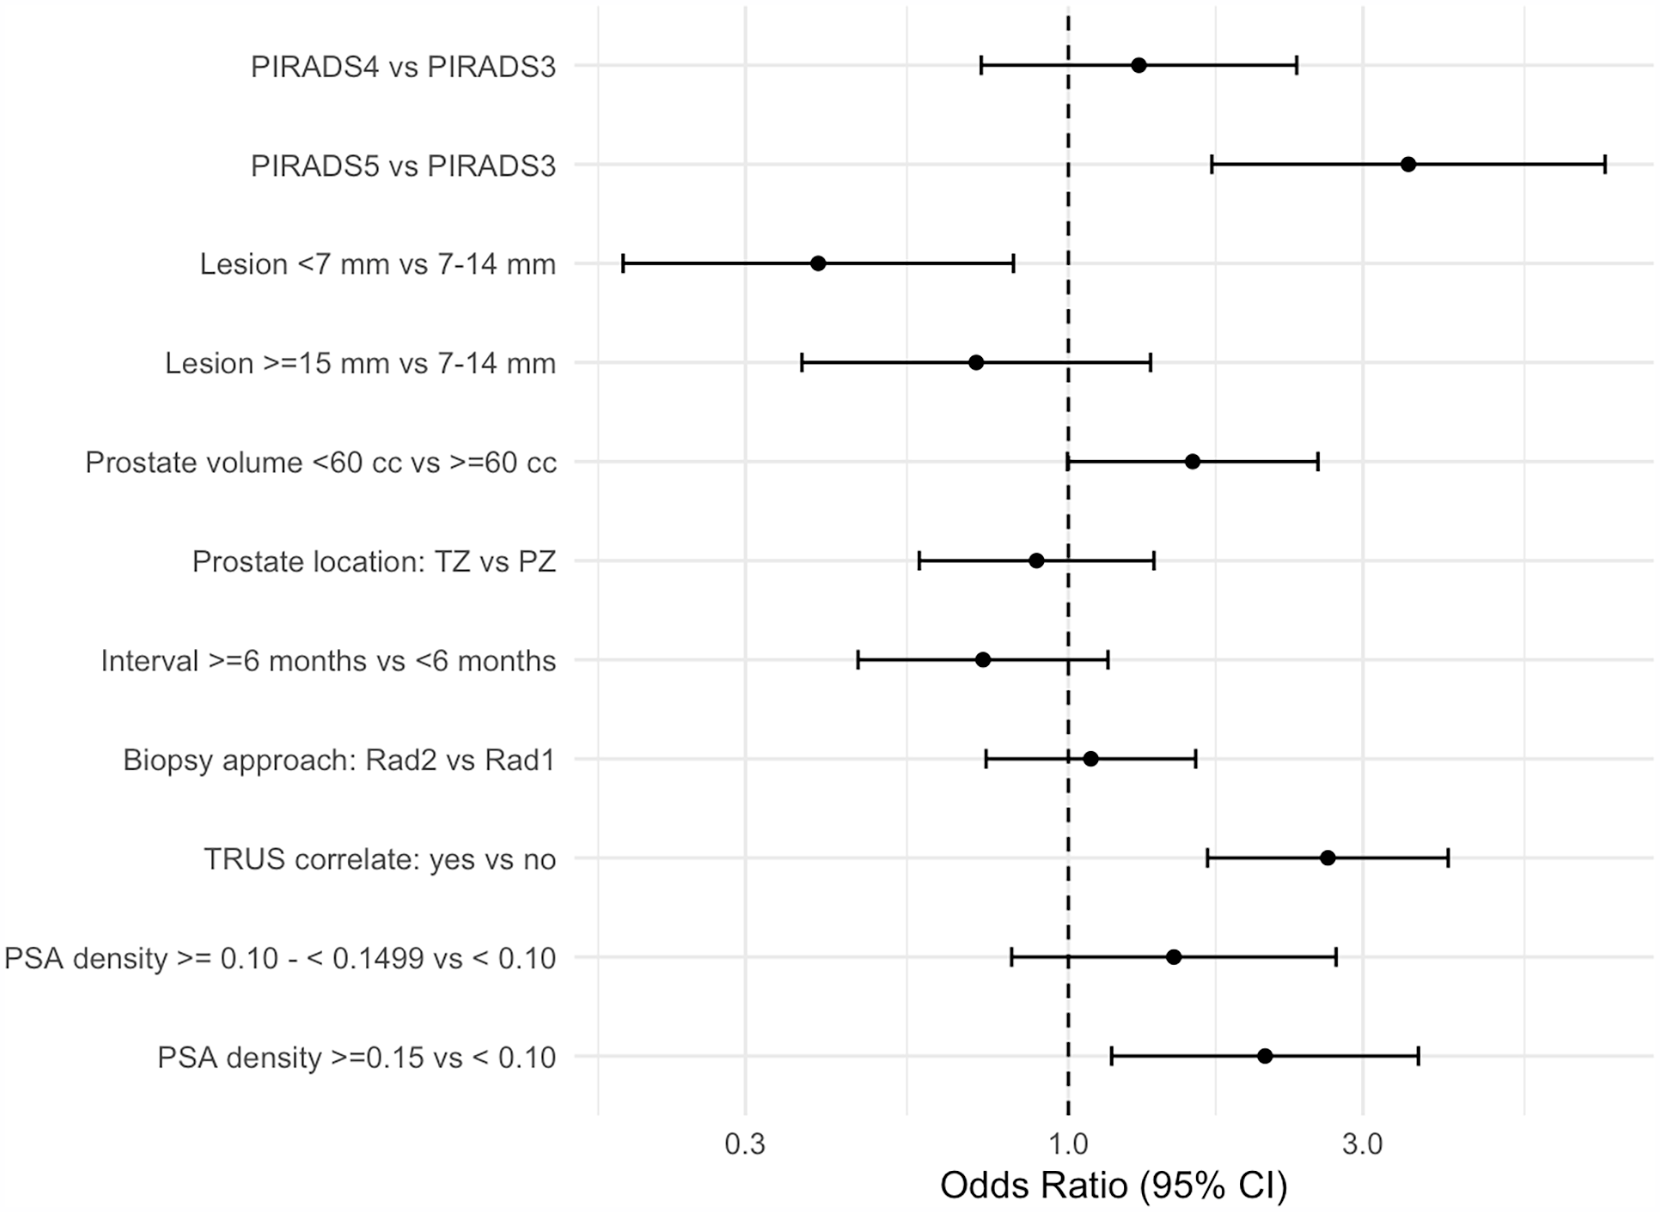
Forest plot of the generalized linear mixed model predicting a positive prostate biopsy.a
Discussion
Our study found that the diagnostic yield of MRI-TRUS machine fusion prostate biopsies at our institution is quite high at 59.4%. Although the univariate analysis showed substantial differences in PPVs amongst different subgroups, the GLMM analysis showed that most factors were not associated with differences in csPCa. Factors which were associated with a higher yield at biopsy were PI-RADS 5 score, elevated PSA density, and presence of an ultrasound correlate at TRUS; small lesion size was associated with a lower yield at biopsy. PI-RADS 4 score, referring urologist, reporting radiologist, prostate size, biopsy operator, and MRI-biopsy interval were not associated with a difference in csPCa.
Although the PPV for PI-RADS 5 lesions in our study (74.3%) is similar to other studies, our PPVs for PI-RADS 3 (44.4%) and 4 (50.6%) lesions are generally higher.17 -19 In a study by the Society of Abdominal Radiology Prostate Cancer Disease-focused Panel, the PPVs were assessed across 26 centers using a mixed-model logistic regression to account for differences across centers and patient clustering. 17 This study estimated PPVs for PI-RADS 3 to 5 respectively as follows: 15% (95% CI, 11-19); 39% (95% CI, 34-45), and 72% (95% CI, 66-77). 17 In a prospective study evaluating biparametric prostate MRI, PPVs for csPCa (as defined in this study) were 21.5%, 54.5%, and 81.4%. 18 In a study from Ottawa using both biparametric and multiparametric MRI, Schieda et al found PPVs of 16.1%, 35.1%, and 56.1% for PI-RADS 3 to 5, respectively. 19 Finally, a 2021 systematic review and meta-analysis found PPVs of 13% (95% CI, 10%-17%), 40% (95% CI, 34%-46%), and 69% (95% CI, 65%-73%) for PI-RADS 3 to 5, respectively. 20
The reasons why the PPV of PI-RADS 3 and 4 lesions biopsied at our institution are higher than the published literature are unclear and require further investigation. A few possible reasons may account for this discrepancy. First, because a proportion of our population lacks access to a primary care provider, this may result in decreased screening for prostate cancer and later presentations. However, the median/mean PSA in our cohort are comparable to other studies,17,19 as is the breakdown of Grade group for true positive biopsies (Table 3). For example, in the study by Westphalen et al, the median PSA was 6.6 ng/mL (8.1 ng/mL in our study), and of 1698 PI-RADS 3 to 5 lesions, there were 950 (55.9%), 393 (23.1%), 206 (12.1%), and 149 (8.8%) classified as Grade group 2 to 5, respectively. 17 A second potential reason is that the policy at our institution is to only accept prostate MRI requisitions from urologists; this is similar to other sites in Canada (eg, Edmonton) but not others (eg, Vancouver; personal communication, Dr. Chris Fung and Dr. Silvia Chang, April 5, 2025). Only accepting referrals for prostate MRI from urologists may result in an elevated pre-test probability of disease, thereby increasing the PPV. Third, referrals for TRUS-MRI fusion biopsy are another potential source of selection bias, as not all urologists refer patients with PI-RADS 3 lesions for biopsy. Fourth, our group of 8 reporting radiologists is a relatively homogeneous group, with similar expertise and experience, and standardized protocols and reporting templates. Lastly, it is possible that reporting radiologists are under-calling lesions at prostate MRI; this would elevate the PPV at the expense of a lower negative predictive value, which was not assessed by this study.
In addition to PI-RADS 5 lesions and a PSA density ≥0.15 ng/mL2, our study found additional factors associated with csPCa at machine fusion biopsy. There was a lower yield with sub-7 mm lesions, which may reflect more false positives on MRI, and/or imprecision in segmentation, registration, or tracking, which can contribute to missing a target; the UroNav system has a reported registration/tracking error of 2 to 3 mm. 21 In contrast to our hypothesis, a smaller prostate was not associated with a higher likelihood of csPCa (OR, 1.57; 95% CI, 0.98-2.51). Larger prostates have been associated with lower PPVs at biopsy 22 ; with fusion biopsy, a larger prostate will have greater compression and deformation at TRUS, which can lead to less accurate registration with MRI. Finally, we found that the presence of an US correlate was associated with a higher yield at biopsy. Although conventional US does not have a role in the diagnosis of prostate cancer, in our experience, many lesions identified at MRI are evident at TRUS. This simplifies the registration process, and likely improves targeting accuracy. A recent multicentered prospective study found that microultrasonography-guided biopsy was noninferior to MRI fusion-guided biopsy. 23
Our study had limitations, including its retrospective and single-center study design. In our region, approximately 10% to 15% of the population lacks a primary care provider; although this situation is not unique in Canada, our results may not be generalizable to other regions or healthcare systems. PPVs are impacted by the prevalence of disease; as such, our results are susceptible to selection biases, such as urologist referral patterns for both prostate MRI and MRI-TRUS machine fusion biopsy.
In conclusion, the diagnostic yield of MRI-TRUS machine fusion prostate biopsies at our institution is high. Factors which are associated with csPCa include a PI-RADS 5 score, elevated PSA density, and presence of an ultrasound correlate at TRUS. A small lesion is negatively associated with csPCa. These factors are important to consider when referring a patient for biopsy and for operators performing machine fusion biopsy. Our results reinforce MRI-TRUS machine fusion as an excellent technique for detection of csPCa.
Footnotes
Ethical Considerations
IRB approval was obtained for this work.
Funding
The author(s) received no financial support for the research, authorship, and/or publication of this article.
Declaration of Conflicting Interests
The author(s) declared no potential conflicts of interest with respect to the research, authorship, and/or publication of this article.