
Abstract
This is a visual representation of the abstract.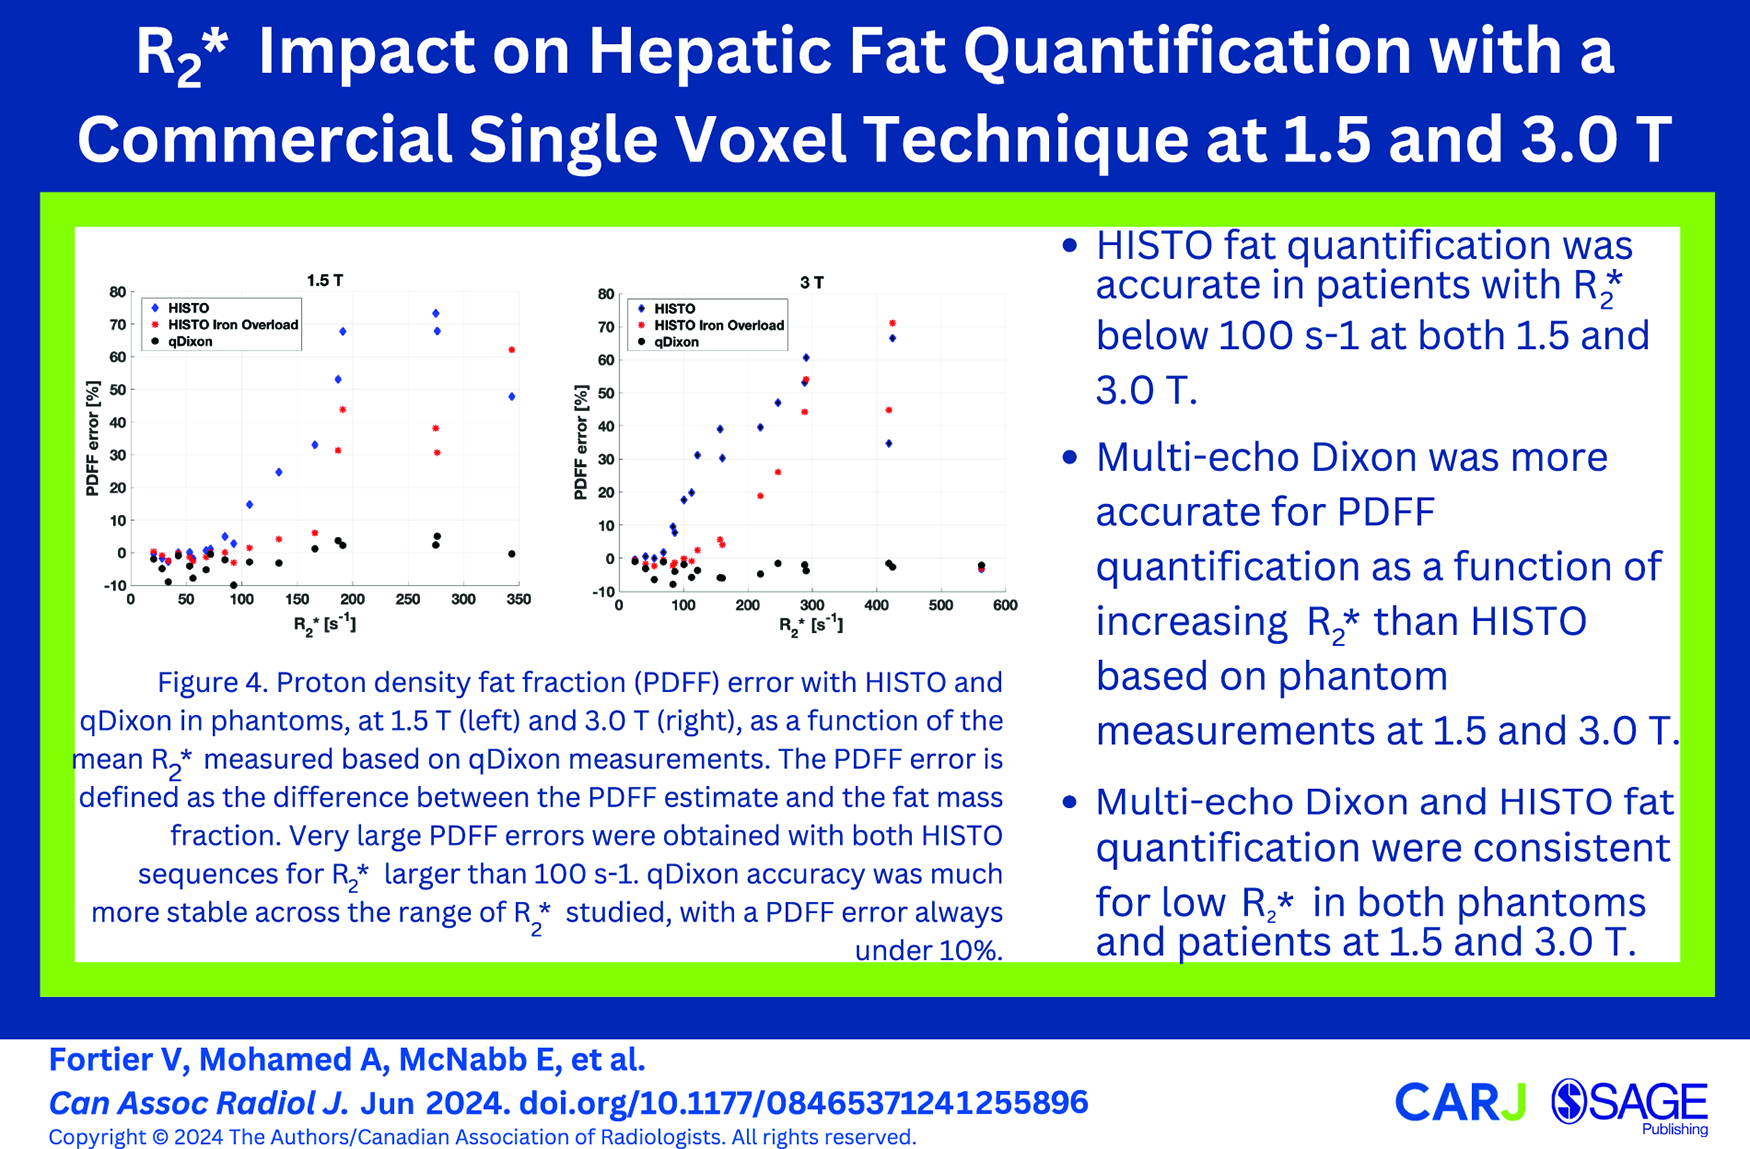
Keywords
Introduction
Steatotic liver disease (SLD) 1 is a liver condition characterized by abnormal fat accumulation in more than 5% of hepatocytes.2,3 Histopathological analysis of tissue samples obtained by percutaneous biopsy is the historical gold standard to quantify hepatic fat. However, it is subject to sampling error in heterogeneous hepatic fat.
Multiple non-invasive methods have been developed to evaluate SLD such as transient elastography and ultrasound. 4 The current non-invasive gold-standard is magnetic resonance (MR)-based multi-echo Dixon. This technique measures the proton density fat fraction (PDFF), corresponding to the ratio of the fat protons signal to the signal of water and fat protons. 5 PDFF has shown excellent correlation with fat content from biopsies.2,3 However, Dixon-based techniques are limited by fat-water swaps, where the fat signal is incorrectly assigned to the water signal and vice versa, leading to inaccurate quantification. 6 A previous study investigated the prevalence of fat-water swaps and showed that 8% of cases suffered from fat-water swaps at 3.0 T. 7
MR spectroscopy (MRS) measures the chemical composition of fat and is an alternative method to multi-echo Dixon PDFF. 2 However, MRS techniques offer limited spatial coverage and are sensitive to T2-signal decay, leading to inaccurate quantification. 8 Nonetheless, MRS is useful for fat quantification as it does not suffer from fat-water swaps.
The high speed T2-corrected multi-echo (HISTO) technique has been proposed to address some of the limitations of MRS approaches. 9 HISTO is an MRS technique that enables fat quantification from a single breath-hold and includes a correction for T2-signal decay. 8 HISTO is commercially available, and studies have demonstrated its accuracy for hepatic fat quantification at 1.5 T.8-10
HISTO fat quantification accuracy has also been demonstrated at 3.0 T in fat-water phantoms. 11 Its accuracy at 3.0 T has also been investigated in a few clinical indications. Fat fractions estimated with HISTO and Dixon were notably consistent with a strong positive correlation in thigh muscles. 12 A study performed in liver also demonstrated consistent results between HISTO and Dixon for hepatic fat quantification. 13
Hepatic fat quantification from HISTO, however, requires further investigation since iron accumulation can decrease its accuracy. Different conditions can lead to iron accumulation in liver, such as hereditary haemochromatosis and repeated blood transfusions. 14 Fat and iron can also simultaneously accumulate in the liver. Notably, previous studies have shown that up to a third of patients with non-alcoholic fatty liver disease also had elevated iron content, which has been related to adverse outcomes.15,16 Iron accumulation increases both R2 and R2* relaxation rates, which can bias the fat quantification. 8 R2 and R2* increase with field strength, thus leading to a higher potential for bias at 3.0 T. While a previous study performed at 1.5 T has shown accurate fat quantification with HISTO in the presence of an iron-based agent in phantoms, 8 this has not been demonstrated at 3.0 T. Therefore, the objectives of this work were to validate the commercial HISTO fat quantification accuracy at 3.0 T using multi-echo Dixon as the reference method, to establish its robustness to R2* variations, and to compare the results to measurements performed at 1.5 T.
Methods
Phantom
Fat-water phantoms were designed to mimic a range of liver fat and iron content, using a diluted fat-water emulsion with an R2* modulator.17-19 The phantoms were based on a commercial safflower oil emulsion (Microlipid, Nestle Inc.) with 50% fat mass by volume. This emulsion is stable in its liquid form at room temperature, has a controlled fat content, and its fat resonances are consistent with those measured in vivo in the liver. 20 Additionally, it has shown good correlation between fat mass fractions and PDFF estimates in a previous study. 21 The phantom design is described in Supplemental Materials and is illustrated in Figure 1.
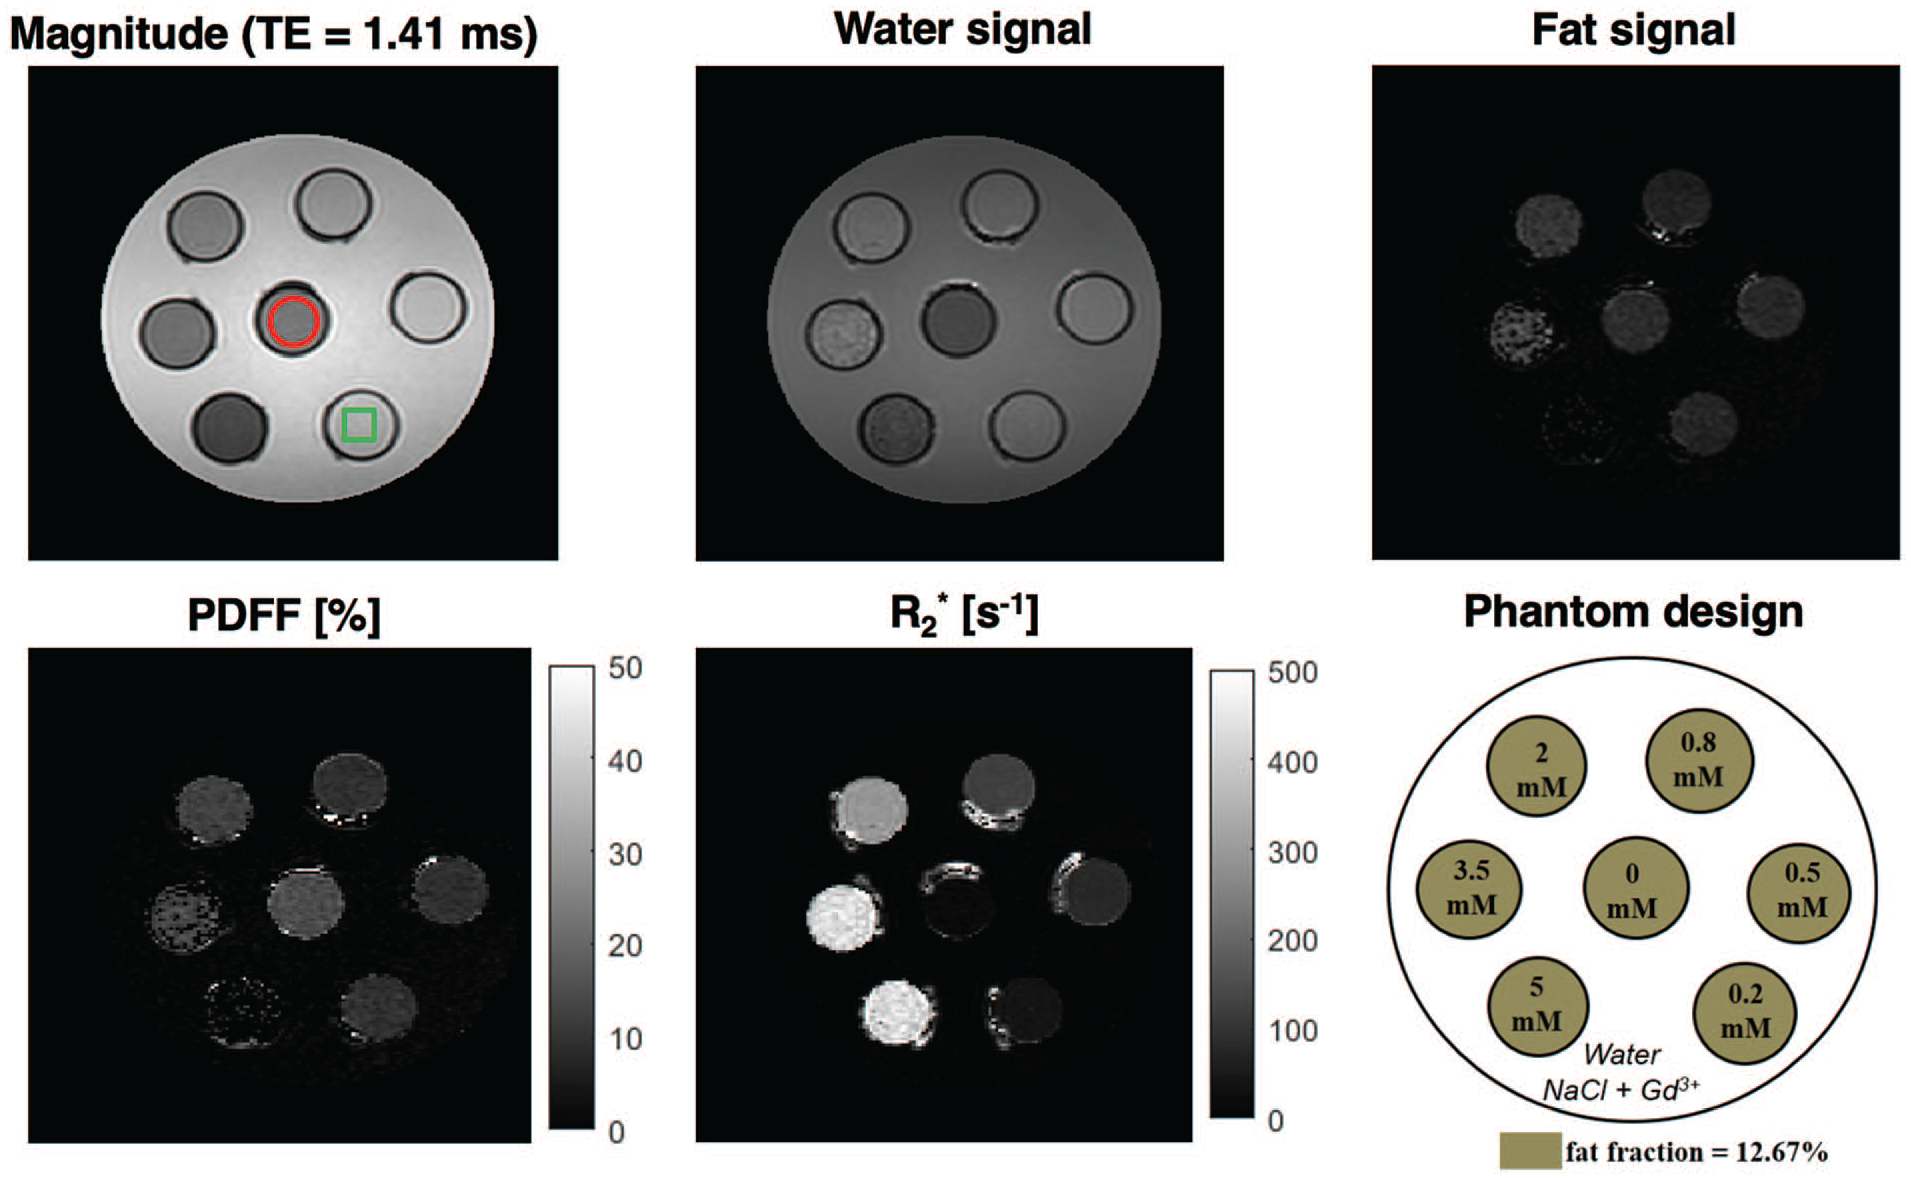
Example images and maps obtained with qDixon at 3.0 T for the phantom with one of the 4 fat fractions (fat mass fraction = 12.67%) used in this work. The schematic of the phantom is shown on the lower right panel, where each vial corresponds to a different [MnCl2]. Note the variations in fat signal and PDFF with increasing [MnCl2] (increasing R2*). The red circle in the top left panel shows an example of the ROI that was used in all phantom vials for qDixon PDFF and R2* measurements. The green square in the same panel illustrates typical placement of the HISTO voxel for data acquisition in phantom vials. The signal distortions visible around the vials are caused by the ink used to identify the graduations on the centrifuge tubes and were avoided in ROI placement.
Phantoms were scanned using 2 MRI scanners, 1.5 T (Siemens Aera, software VE11C) and 3.0 T (Siemens Skyra, software VE11C). The standard 20-channel head coil provided by the vendor was used. Phantoms were stored in the scanner room for 24 hours before imaging and temperature was measured in the large water compartment before and after imaging.
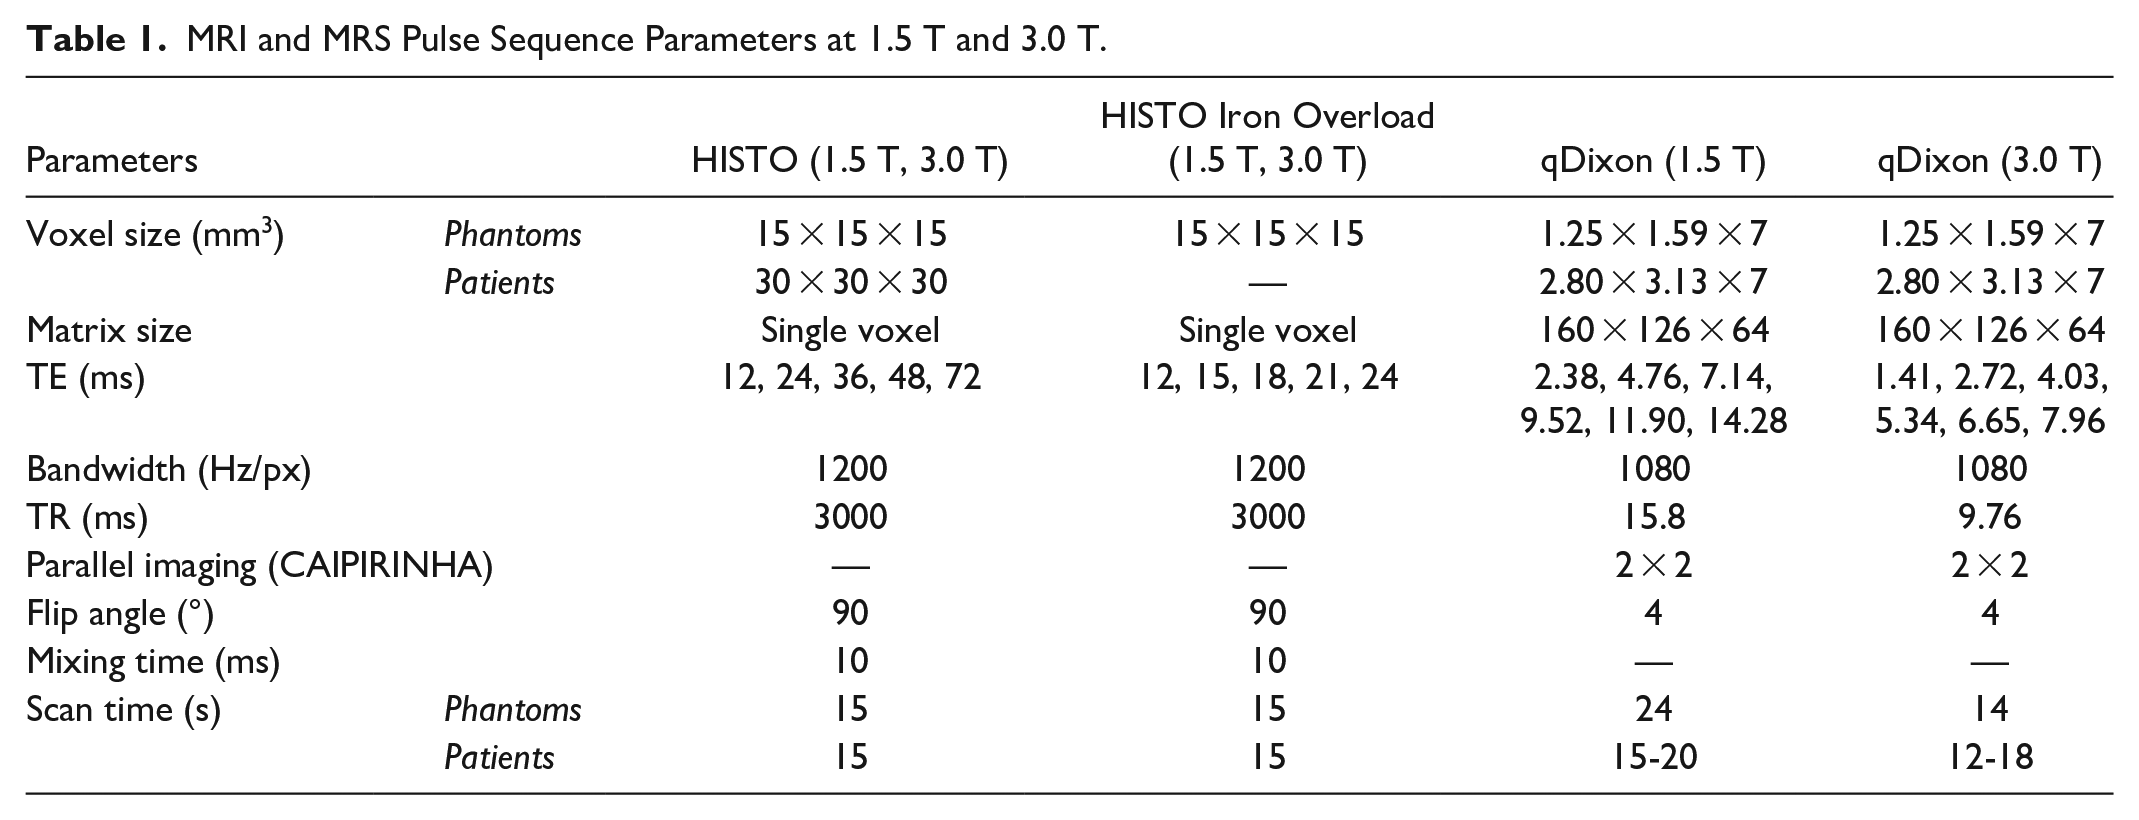
Phantoms were scanned with 3 different commercial sequences: 2 HISTO sequences performed for each vial, and 1 multi-echo Dixon sequence (qDixon). The HISTO sequences used different echo times (TEs). The first sequence was performed with the default TEs, 8 while the second used shorter TEs, specifically designed to measure fat content in the presence of iron. This technique, known as HISTO Iron Overload, is provided by the vendor as an alternative in instances where iron overload is suspected. Table 1 details the parameters of these sequences.
MRI and MRS Pulse Sequence Parameters at 1.5 T and 3.0 T.
Quantitative measurements were obtained using the vendor’s automatic post-processing tools (Liver Lab, Siemens Healthineers). PDFF and R2* maps were automatically generated for qDixon using a signal model that includes a single R2* and a multi-resonances fat spectrum. PDFF estimates were obtained automatically for HISTO, along with water and fat R2.
The PDFF accuracy for HISTO and qDixon was evaluated at both field strengths. Circular regions of interest (ROI) with an area of 2.5 cm2 were drawn in each vial using RadiAnt (Medixant, Poznan, Poland, https://www.radiantviewer.com) on the middle slice of qDixon datasets. The mean and standard deviation of the PDFF and R2* were measured within all ROIs. R2* variations were examined as a function of [MnCl2] adjusted for the water volume ([MnCl2]water), which assumes that MnCl2 is only dissolved in the water phase of the emulsion. 22 A robust linear regression using bi-square weight 23 (Matlab function “robustfit” with the option “bisquare”) was performed between R2* and [MnCl2]water using software implemented in MATLAB (R2019a, The MathWorks, Natick, MA). The PDFF accuracy was investigated as a function of R2*. Variations of HISTO water R2 were also evaluated as a function of [MnCl2]water, as detailed in Supplemental Materials.
Patient Study
A retrospective review of consecutive abdominal MRI examinations was performed under the approval of the local Research Ethics Board (REB). Written informed consent for participants was waived. Inclusion criteria were defined as any abdominal MRI exams performed in adults (age ≥18 years old), for which HISTO and qDixon were acquired. Exams were performed between July and September 2020 at 1.5 T, and between May and August 2020 at 3.0 T, using the same 2 scanners as for the phantoms. All exams with qDixon fat-water swaps were excluded.
A combination of a vendor-provided 18-channel phased array coil and a 32-channel spine coil was used. HISTO and qDixon were each acquired during a single inspiration breath hold. Sequences’ parameters are described in Table 1. The HISTO single voxel was positioned in the liver tissue, avoiding blood vessels.
Quantitative measurements were obtained using the vendor-provided automatic post-processing, as for the phantom. HISTO PDFF was compared to the mean qDixon PDFF estimated over the whole liver, 13 obtained using the vendor-provided automated liver segmentation tool. The whole liver mean R2* from qDixon and the fat and water R2 from HISTO were also recorded.
Statistical analysis was performed using Matlab. Bland-Altman plots were generated to compare PDFF measurements from both techniques at both field strengths. Bias was tested using a one sample, two-tailed t-test. P-values <.05 were considered statistically significant.
Results
Phantom
R2* was linear with [MnCl2]water for vials with low fat fractions and/or low [MnCl2]. In vials with large fat fraction and large [MnCl2], the mean R2* deviated from the expected linear behaviour as a function of [MnCl2]water at both field strengths (Figure 2). This suggested a failure of qDixon for very large R2*. These vials were excluded from further data analysis. Six vials were excluded at both field strengths, corresponding to the 3 largest [MnCl2] for a fat fraction of 38.81%, the 2 largest [MnCl2] for a fat fraction of 25.60%, and the largest [MnCl2] for a fat fraction of 12.67%. After exclusion, a range of R2* from 5 to 350 s−1 was measured at 1.5 T, and from 5 to 550 s−1 at 3.0 T. An R2* relaxivity for MnCl2 of 66 s−1/mM was measured at 1.5 T, and of 103 s−1/mM at 3.0 T (R2 = 0.87 for both regressions).
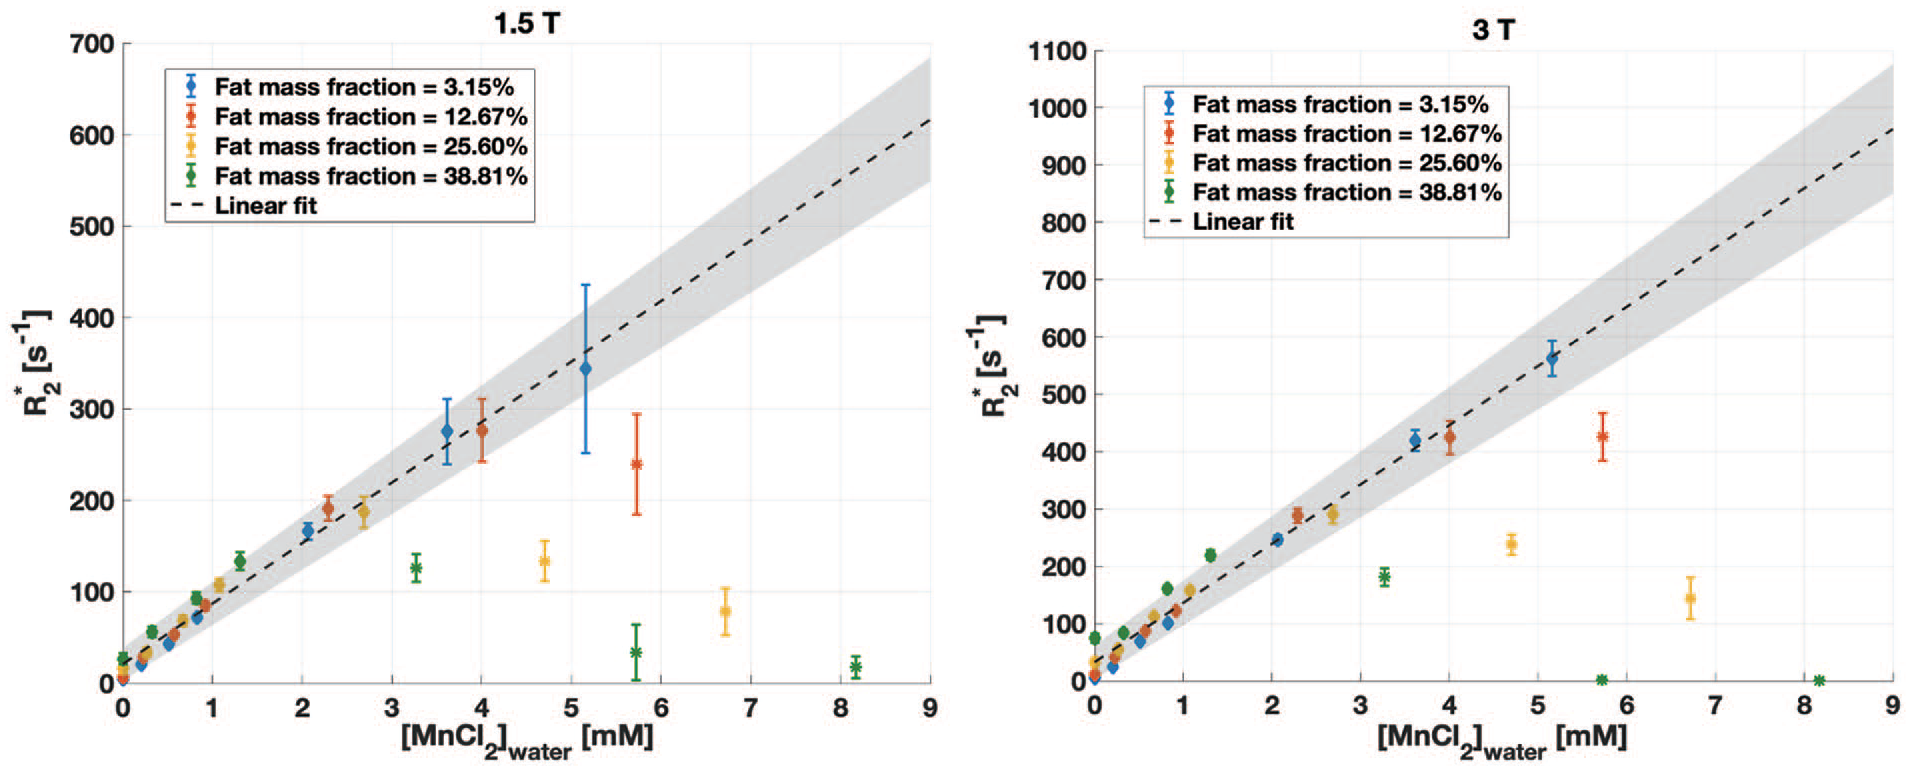
R2* in phantoms from qDixon as a function of the [MnCl2]water for all fat mass fractions, at 1.5 T (left) and 3.0 T (right), showing the mean ± standard deviation measured in circular regions of interest. The variation is linear in vials with lower fat content and/or lower [MnCl2]water, but deviates from this trend for high fat content and [MnCl2]water because of the inaccurate estimate of R2*. Vials shown with a star marker (*) were excluded from the data analysis. The same 6 vials were excluded at both field strengths.
The difference between qDixon PDFF and fat mass fraction increased as a function of the fat content and of the [MnCl2]. At 1.5 T, qDixon showed a PDFF error larger than 10% only for the highest fat fraction (38.81%) for 3 of the [MnCl2] (5, 3.5, and 0.5 mM) (Figure 3). At 3.0 T, qDixon showed PDFF errors smaller than 10% for all vials except for the highest [MnCl2] combined with a fat fraction of 12.67%, 25.60%, and 38.81%, and for the highest fat fraction combined with a [MnCl2] of 3.5 mM (Figure 3).
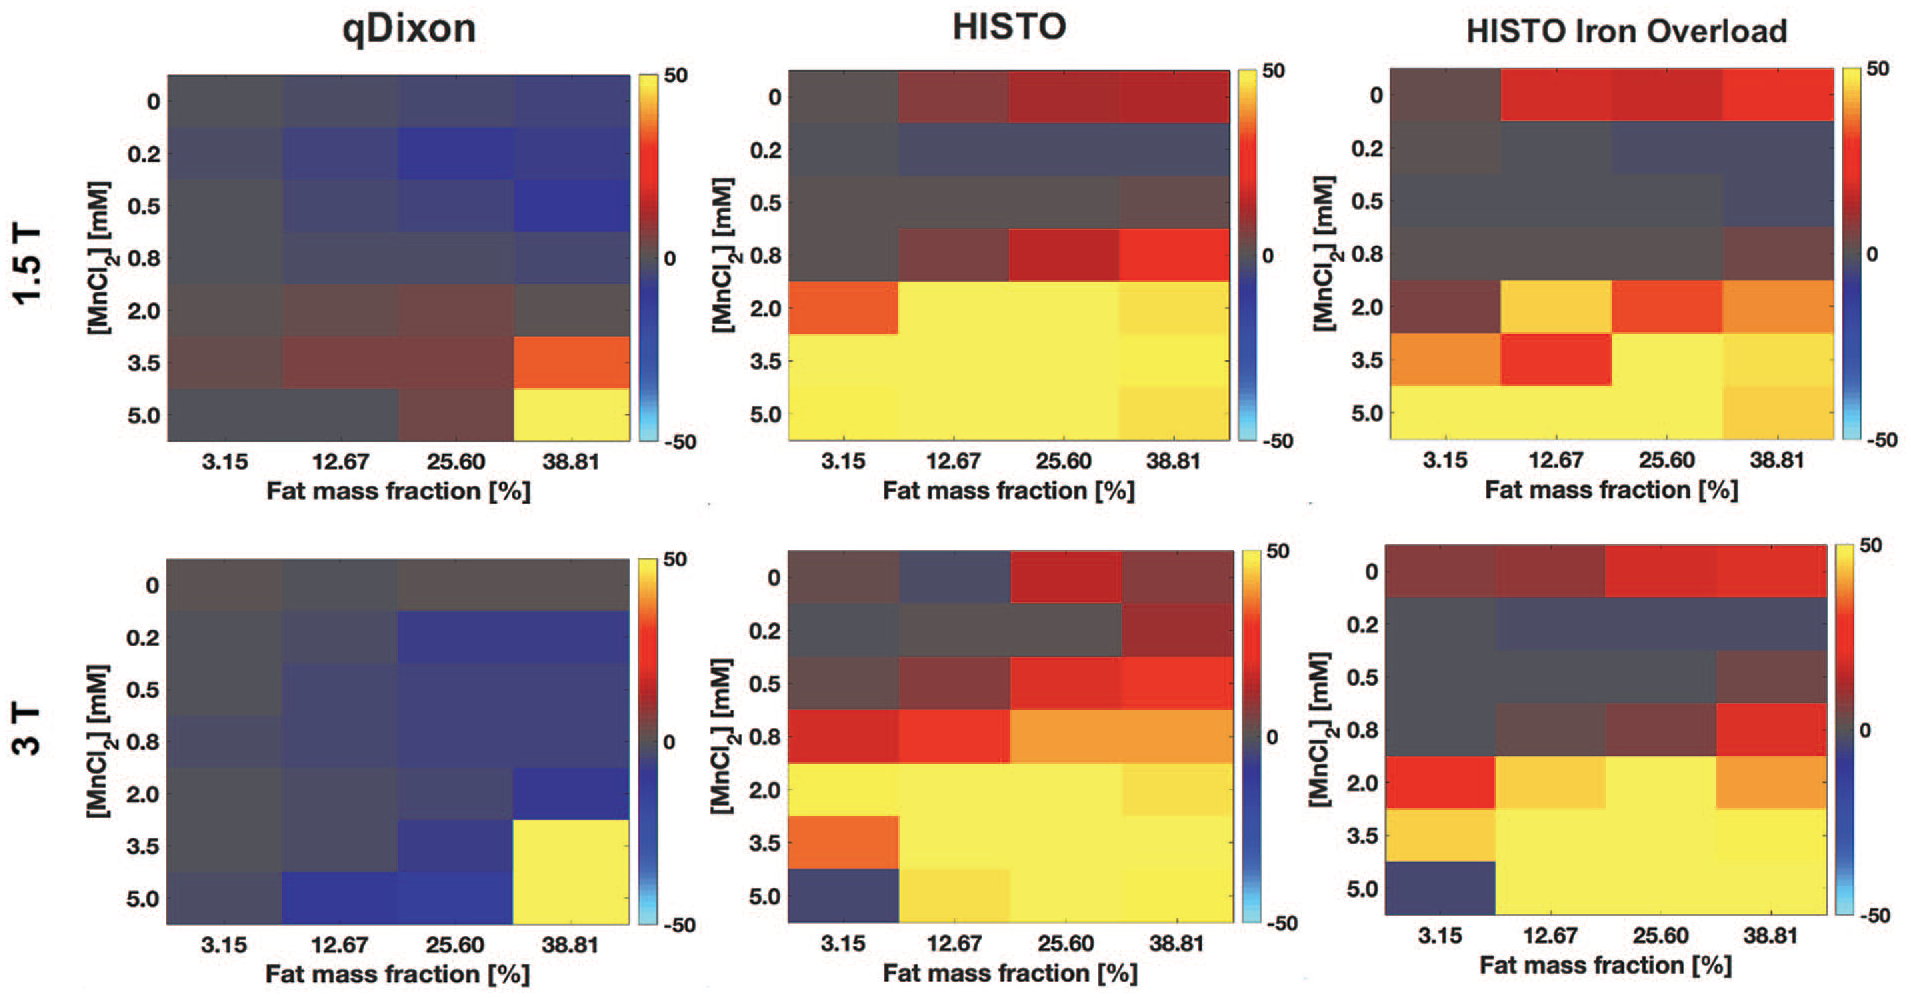
Relative difference (%) between the proton density fat fraction (PDFF) estimated with qDixon (left), HISTO (middle), and HISTO Iron Overload (right) in phantoms and the fat mass fraction, at 1.5 T (top) and 3.0 T (bottom), shown as a function of the concentration of manganese chloride in total solution ([MnCl2]) and of the fat mass fraction. For HISTO and HISTO Iron overload, the PDFF inaccuracy increases significantly as the [MnCl2] increases, with an error larger than 10% for [MnCl2] larger or equal to 2 mM. Both HISTO sequences were also inaccurate in the absence of MnCl2. qDixon was much more accurate over the range of [MnCl2] studied.
HISTO sequences demonstrated large PDFF inaccuracies (Figure 3). At 1.5 T, HISTO PDFF was accurate within 10% for all fat fractions only for [MnCl2] of 0.2 and 0.5 mM, while at 3.0 T, this was observed for a [MnCl2] of 0.2 mM. With HISTO Iron Overload, the PDFF accuracy was slightly improved at 1.5 T, where the PDFF error was smaller than 10% for a [MnCl2] between 0.2 and 0.8 mM for all fat fractions. This slight improvement in the PDFF accuracy with HISTO Iron Overload was also observed at 3.0 T, but only for [MnCl2] of 0.2 and 0.5 mM. Both HISTO sequences showed PDFF errors larger than 10% at both field strengths in the absence of MnCl2 ([MnCl2] = 0 mM). Vials without MnCl2 were excluded from further data analysis.
HISTO PDFF accuracy was strongly dependant on R2* (Figure 4). HISTO was accurate to 10% up to a maximum R2* of 100 s−1 (water R2 ~75 s−1). HISTO Iron Overload was slightly more accurate as a function of R2*, where a maximum R2* of 170 s−1 (water R2 ~120 s−1) was associated with a PDFF error smaller than 10%. qDixon was more robust to R2* variations, resulting in less than 10% PDFF error over the entire range of R2* that was properly quantified.
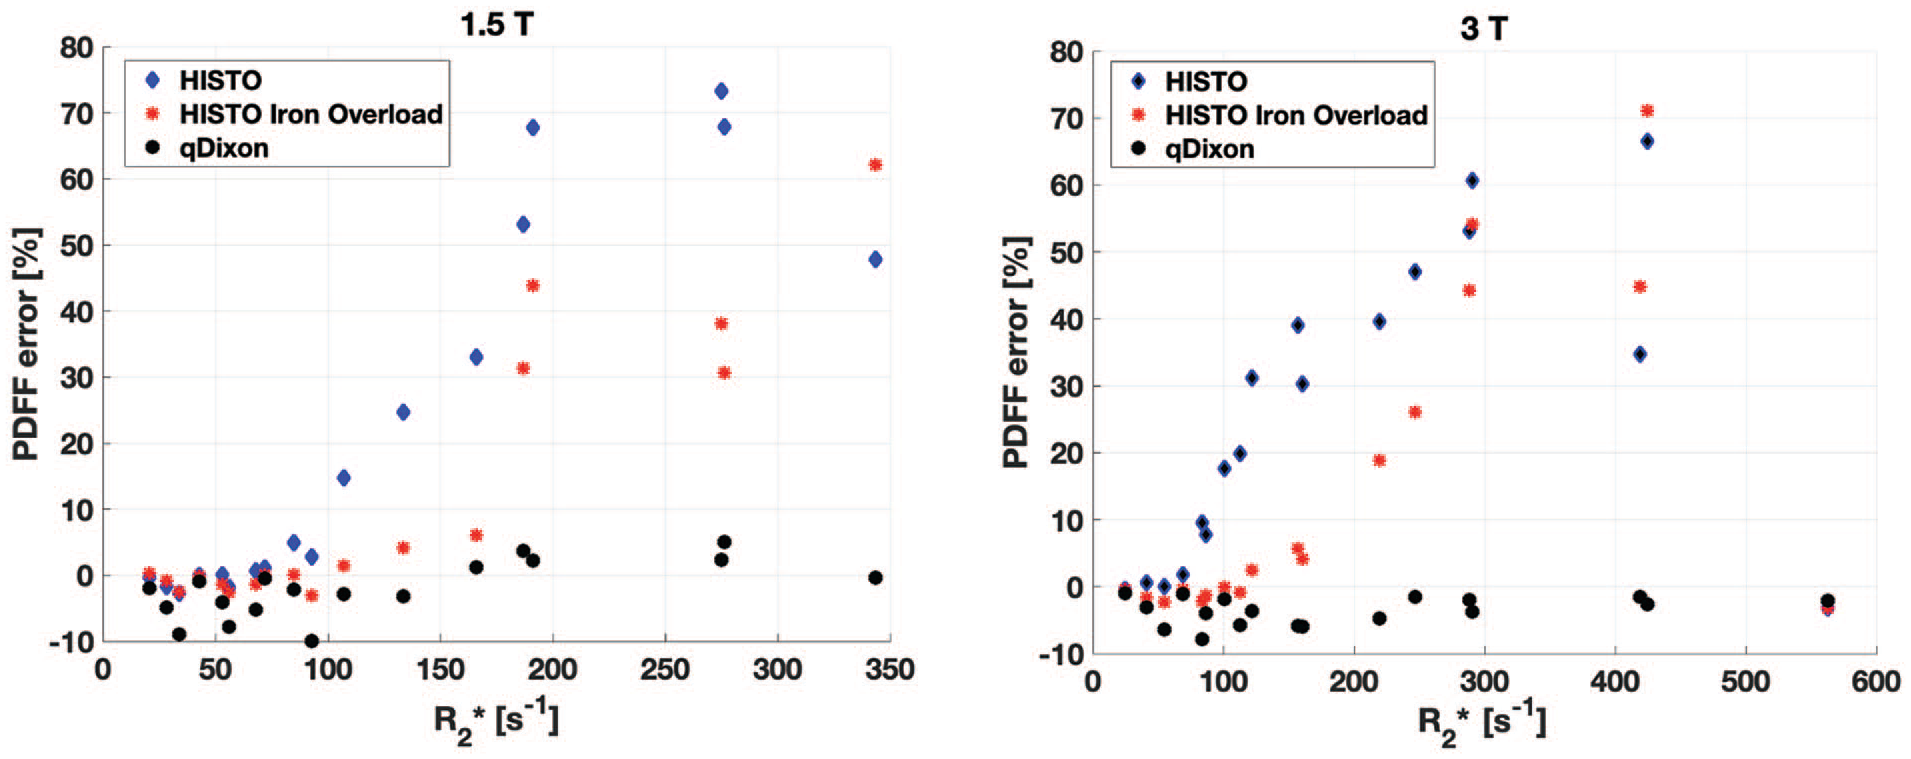
Proton density fat fraction (PDFF) error with HISTO and qDixon in phantoms, at 1.5 T (left) and 3.0 T (right), as a function of the mean R2* measured based on qDixon measurements. The PDFF error is defined as the difference between the PDFF estimate and the fat mass fraction. Very large PDFF errors were obtained with both HISTO sequences for R2* larger than 100 s−1. qDixon accuracy was much more stable across the range of R2* studied, with a PDFF error always under 10%.
Patient Study
Two hundred thirty nine abdominal MRI exams were retrieved, including 110 exams performed at 1.5 T and 129 at 3.0 T. Twelve datasets (10.9%) imaged at 1.5 T were excluded due to qDixon fat-water swaps, resulting in 98 patients (66 women and 32 men, mean age of 61 years old ± 14, median 64 years old). At 3.0 T, 7 datasets (5.4%) were excluded due qDixon fat-water swaps, resulting in 122 exams (59 women and 63 men, mean age of 62 ± 15 years old, median 66 years old).
PDFF, R2, and R2* distributions were skewed toward low values. Supporting Figure S2 illustrates the qDixon PDFF and R2* distributions that were measured at both field strengths, while Supporting Figure S3 shows the HISTO PDFF and R2 distributions. At 1.5 T, the qDixon PDFF range was between 1.5% and 31.0% (median = 6.0%). At 3.0 T, it was from 1.9% to 37.9% (median = 5.8%). The range of the mean R2* measured over the whole liver with qDixon was from 20 to 155 s−1 (median = 35 s−1) at 1.5 T, while it was between 33 and 160 s−1 (median = 54 s−1) at 3.0 T. The vast majority of R2* measurements were below 100 s−1 (99% at 1.5 T and 94% at 3.0 T).
HISTO PDFF was comparable to qDixon PDFF (Figure 5). Both techniques demonstrated an absolute bias smaller than 1% at both field strengths. The bias was not significant at 1.5 T (P-value = .71), whereas at 3.0 T, HISTO significantly underestimated the PDFF on average by 0.89% (P-value = .007).
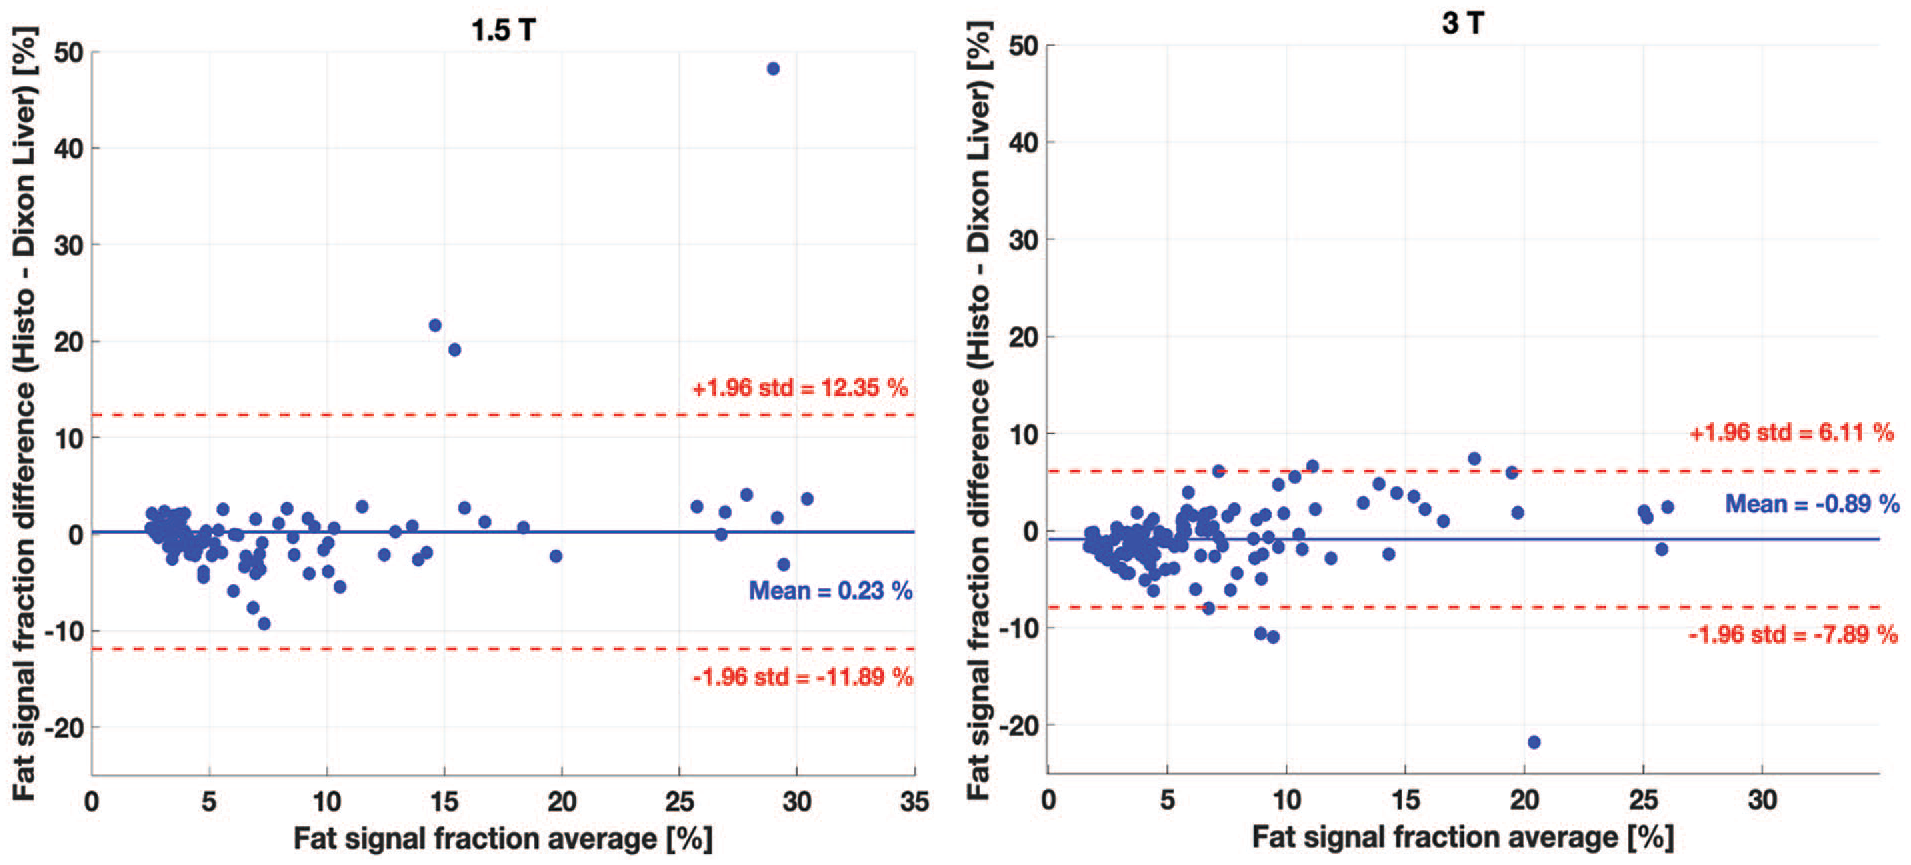
Comparison between the hepatic fat quantification in patients with HISTO and qDixon (mean over whole liver) at 1.5 T (left) and 3.0 T (right). The bias between the 2 techniques is very small (under 1%) at both field strengths. The bias was significant (P-value <.05) at 3.0 T only.
Discussion
HISTO PDFF results obtained in this work were accurate up to 10% for R2* smaller than 100 s−1 in phantoms. HISTO results at 1.5 T disagree with a previous study 8 performed in phantoms doped with an iron-based contrast agent, where a maximum PDFF error of 4.4% was measured for a water R2 up to 140 s−1. Phantom results also showed a much larger PDFF error than previous studies that were performed in vivo outside of the liver, 12 or in phantoms without R2* modulations. 11 This discrepancy may be explained by the larger range of R2* studied in this work. PDFF inaccuracies might also be due to a bias in water R1 introduced by MnCl2. The r1/r2 is larger for MnCl2 compared to ferritin,24,25 resulting in a larger R1 for a given concentration. Based on previous work, 8 it appears that HISTO may neglect R1 contributions, which could lead to PDFF inaccuracies.
HISTO and qDixon provided comparable PDFF with a bias smaller than 1% in patients at 1.5 and 3.0 T, where low R2* were measured (generally <100 s−1), consistent with previous studies.13,14 Observations in patients were also consistent with phantom experiments for R2* smaller than 100 s−1. The bias measured in patients was statistically significant at 3.0 T. However, such a small bias is clinically not significant. The agreement observed between HISTO and qDixon is also consistent with a previous phantom study performed with no R2* modulator at 1.5 and 3.0 T 11 .
R2* in phantoms was representative of values that can be measured in liver. R2* between 24 and 74 s−1 have been reported for healthy liver at 1.5 T.26-28 At 1.5 T, a threshold between 67 and 88 s−1 has been reported to distinguish between healthy liver and mild iron overload. 28 Severe iron overload can produce R2* larger than 900 s−1 at 1.5 T.27,29 Fewer studies have investigated R2* in liver at 3.0 T, but one study reported a threshold of 117 s−1 for the presence of mild iron overload. 30
qDixon provided unreliable R2* measurements in phantoms with large [MnCl2] and/or fat content at both 1.5 and 3.0 T. These inaccuracies were likely due to a TE selection that was too long, as the signal at longer TEs fell below the noise floor. Acquisitions with shorter TEs or custom data post-processing with compensation for longer TEs might address this issue. This was not investigated here in order to rely on commercial packages only.
qDixon PDFF quantification was robust to R2* modulation. The PDFF error over the range of R2* that could be studied was consistent with a previous phantom study performed with no R2* modulations. 11 This suggests that qDixon PDFF accuracy might be independent of the presence of iron in the liver for an R2* up to approximately 350 s−1 at 1.5 T and 550 s−1 at 3.0 T. The qDixon PDFF accuracy observed in this work is also consistent with a previous study performed in liver. 3 The qDixon post-processing algorithm assumes a liver fat spectrum at body temperature, which differs from the phantom fat spectrum at 20°C. However, given the PDFF accuracy observed in this work, the difference in the water chemical shift caused by the temperature difference, 31 as well as the differences between the phantom material and liver, 20 were considered negligible. The phantom’s temperature was stable and consistent within a range of 0.3°C across scan sessions.
HISTO provided unreliable results in vials without MnCl2. This was likely due to the large water T1 (>3 s). 32 The TR used was not long enough to enable the complete longitudinal relaxation of water in the absence of MnCl2. The HISTO TR was not increased to keep the scan time within a manageable breathhold duration. As previously suggested, 3 a correction based on the measured water T1 would be required to remove T1-weighting. Such correction was not implemented since no T1 measurement was performed. This would not be a problem in vivo since human tissues have much shorter T1.
The phantom experiments have certain limitations. The emulsion was liquid, while this is not the case for liver. Liquid solutions have longer T1 and T2 values. A gel-based phantom could be used in future work to address this limitation. In addition, the R2* modulator used was not iron-based, while iron is the agent responsible for R2* variations in liver. MnCl2 has been used to mimic liver R2* modulation in multiple studies,17-19 but it is an imperfect surrogate. 33 However, iron is stored in liver in proteins called ferritin, 34 and MnCl2 has been shown to have similar relaxation properties as aqueous ferritin solutions, 17 thus supporting its use in the context of this work. Future work should be performed in the presence of iron to confirm these findings.
The in vivo study also has some limitations. First, the HISTO PDFF was compared to the qDixon whole liver mean PDFF. Liver has an inhomogeneous fat spatial distribution. 2 This can lead to a significant difference between a single voxel measurement and the whole liver measurement. Second, only the HISTO sequence with the default TEs was used for data acquisition. The phantom experiments demonstrated that HISTO Iron Overload should be preferred because of its slightly higher PDFF accuracy. The use of the HISTO sequence with default TEs might explain the significant difference that was observed at 3.0 T between HISTO and qDixon. Third, low R2* values were measured, a regime in which HISTO showed consistent results with qDixon in phantoms. Larger R2* values remain to be tested. Most patients also had low fat content, with a median under 6%, which also contributed to low R2*. Future in vivo validation should be performed through a prospective study that includes patients with moderate to severe liver iron overload. Fourth, no biopsy samples were available for the patient cohort. As a result, no independent ground truth was available. However, previous studies have demonstrated high correlation between Dixon PDFF and biopsy,2,3 thus supporting the use of Dixon as a ground truth.
Conclusion
In conclusion, this study demonstrated that Dixon is more accurate than HISTO for PDFF quantification as R2* increases. Dixon should therefore be preferred for hepatic fat quantification. The phantoms results suggest that HISTO should only be used when R2* is below 100 s−1, which correspond to patients without or with mild liver iron overload. The iron content cannot be known prior to the examination, which suggests a limited applicability of HISTO clinically, although it can be an alternative in the case of a fat-water swap with Dixon. The retrospective patient study confirmed that HISTO and Dixon provide consistent results in vivo in the absence of liver iron overload.
Supplemental Material
sj-pdf-1-caj-10.1177_08465371241255896 – Supplemental material for R2* Impact on Hepatic Fat Quantification With a Commercial Single Voxel Technique at 1.5 and 3.0 T
Supplemental material, sj-pdf-1-caj-10.1177_08465371241255896 for R2* Impact on Hepatic Fat Quantification With a Commercial Single Voxel Technique at 1.5 and 3.0 T by Véronique Fortier, Ahmed Mohamed, Evan McNabb, Jérémy Dana, Rita Zakarian, Ives R. Levesque and Caroline Reinhold in Canadian Association of Radiologists Journal
Footnotes
Acknowledgements
The authors acknowledge the Medical Physics Unit (McGill University) for access to lab space, Norma Ybarra (McGill University) for support with the phantom preparation, and the MRI Methods Research Group (McGill University) for useful discussion.
Declaration of Conflicting Interests
The author(s) declared no potential conflicts of interest with respect to the research, authorship, and/or publication of this article.
Funding
The author(s) disclosed receipt of the following financial support for the research, authorship, and/or publication of this article: This project was supported by the Research Institute of the McGill University Health Center General Research Funds.
Supplemental Material
Supplemental material for this article is available online.
References
Supplementary Material
Please find the following supplemental material available below.
For Open Access articles published under a Creative Commons License, all supplemental material carries the same license as the article it is associated with.
For non-Open Access articles published, all supplemental material carries a non-exclusive license, and permission requests for re-use of supplemental material or any part of supplemental material shall be sent directly to the copyright owner as specified in the copyright notice associated with the article.