
Abstract
Diffuse liver diseases, including steatosis, cirrhosis, and fibrosis, significantly alter hepatic architecture, and can obscure, mimic, or alter the imaging features of focal liver lesions and reduce the diagnostic accuracy of specific imaging modalities. This review outlines the key imaging pitfalls created by diffuse liver disease and offers practical, evidence-based strategies to overcome them. We describe several key imaging pitfalls in interpreting liver lesions in diffuse liver disease, including the atypical appearance of focal lesions on ultrasound and CT due to altered background parenchyma; the phenomenon of “vanishing washout” of hepatocellular carcinoma on CT in steatotic livers; and the significant risk of underestimating metastatic disease burden or missing occult lesions. For each pitfall, we discuss the strengths and weaknesses of various imaging modalities and suggest problem-solving strategies, such as guidance on selecting the most appropriate next-line imaging modality for lesion characterization. We highlight the roles of contrast-enhanced ultrasound and MRI in resolving diagnostic uncertainty when initial ultrasound or CT imaging is atypical or equivocal. A comprehensive understanding of how diffuse liver disease affects the imaging of both benign and malignant lesions is important for accurate diagnosis. Recognizing these pitfalls allows a tailored, multimodality imaging approach that optimizes the detection and characterization of focal liver lesions, ultimately guiding clinical management and improving patient care.
Introduction
Diffuse liver diseases significantly alter hepatic architecture and imaging characteristics, posing diagnostic challenges in the detection and characterization of focal liver lesions,1,2 leading to reduced sensitivity and specificity across ultrasound (US), computed tomography (CT), and magnetic resonance imaging (MRI).1,3,4 This review discusses the imaging evaluation of major diffuse liver diseases and highlights pitfalls in diagnosing focal liver lesions.
Imaging of Diffuse Liver Disease
Hepatic steatosis results from triglyceride accumulation in the cytoplasm of hepatocytes. On conventional B-mode US, the first-line imaging modality due to availability and ease of performance, 5 the steatotic liver appears diffusely echogenic, brighter than the renal cortex and spleen. Increased fat attenuates the ultrasound beam leading to poor delineation of deeper hepatic architecture. 6 Severity is graded as mild (only increased echogenicity), moderate (loss of definition of the periportal triads), and severe (loss of visualization of the diaphragm and deeper parenchyma). 7
On unenhanced CT, absolute liver attenuation <40 Hounsfield Units (HU) or attenuation difference between liver and spleen of >10 HU are widely accepted criteria for steatosis, 8 correlating to ≥30% histologic fat with 100% specificity. 9 In severe steatosis, intrahepatic vessels may appear hyperattenuating relative to the parenchyma. 10 These criteria are unreliable on contrast-enhanced CT as parenchymal enhancement is highly dependent on contrast timing and injection protocols, making steatosis difficult to assess.11,12
MRI is the most accurate imaging modality for assessing hepatic steatosis, 13 evaluated using chemical shift imaging, where water and fat protons precess at different frequencies, partially canceling each other out on opposed-phase images. 14 Signal loss in the liver on T1-weighted opposed-phase images relative to the T1-weighted in-phase images is therefore diagnostic of microscopic intracellular fat. 15 MRI-based proton density fat fraction (MRI-PDFF) is the most accurate non-invasive method of quantifying steatosis, generating a parametric map representing the fraction of MRI signal attributable to fat. MRI-PDFF is highly reproducible and accurate for grading steatosis, and strongly correlates with histology. 16
Hepatic fibrosis is the extracellular accumulation of extracellular matrix proteins following chronic inflammation and repeated hepatocyte injury, which can progress to cirrhosis, an end-stage condition defined by architectural distortion, formation of regenerative nodules, and development of hepatocellular carcinoma (HCC). 17 A hallmark MRI finding of fibrosis is T2-hyperintense, linear, bridging fibrotic bands demonstrating progressive, delayed enhancement following the administration of gadolinium-based contrast agent (GBCA). 18
Early cirrhosis may appear as heterogeneous or coarse liver echotexture on ultrasound. 19 As cirrhosis progresses, specific signs develop; surface nodularity, expanded gallbladder fossa, widening of the fissures, and notching of the right lobe. Lobar redistribution is classically seen as atrophy of the right lobe and medial left lobe segments, with hypertrophy of the caudate lobe and lateral left lobe segments. 20 Increased transverse caudate lobe width to the right lobe width (>0.65) ratio is a well-described imaging feature. 21
The pattern of lobar redistribution varies according to the underlying etiology. Viral and alcohol-related cirrhosis often causes the classic pattern described above. 22 Primary sclerosing cholangitis causes central caudate lobe hypertrophy with atrophy of the peripheral segments, 23 which can mimic a central mass. Venous outflow obstruction (as in Budd-Chiari syndrome, Fontan-associated liver disease) results in diffuse hepatomegaly and prominent caudate lobe hypertrophy, as the caudate lobe’s separate venous drainage directly into the inferior vena cava spares it from the congestion affecting the rest of the liver.24,25
The degree of altered liver stiffness in fibrosis can be objectively measured using elastography. Magnetic resonance elastography (MRE) utilizes the propagation of mechanical shear waves through the liver 13 . It is one of the most accurate modalities for staging liver fibrosis, with a meta-analysis demonstrating AUROC over 0.90 for advanced (stage 3) fibrosis and cirrhosis. 26 Ultrasound elastography (transient elastography and 2D shear-wave elastography) has similar high diagnostic accuracy27,28 but can be limited by factors such as obesity or ascites, where MRE performs better. 26
Cystic Liver Disease and Biliary Hamartomas
In polycystic liver disease the liver is enlarged with cysts of varying sizes and malignant transformation is rare. 29 The cysts of biliary hamartomas (von Meyenburg complexes) are typically small (less than 15 mm) and may demonstrate an enhancing rim. 30 These can mimic cystic metastatic disease and are differentiated by the absence of solid, enhancing components seen in neoplasm. 29
Increased Liver Attenuation on CT
In hepatic iron overload (eg, hemochromatosis, hemosiderosis), the liver appears diffusely hyperattenuating, >72 HU on non-contrast CT.31,32 Certain medications, notably amiodarone, also cause liver hyperattenuation due to increased iodine deposition. 33 The diffusely hyperattenuating liver parenchyma may obscure or alter the appearance of focal liver lesions.
In hepatic iron overload, the T2 and T2* relaxation times are shortened due to the paramagnetic properties of iron, reducing parenchymal signal on the T1-weighted in-phase compared to the opposed-phase gradient-echo sequence (the opposite of that seen in steatosis). 34 On T2*-weighted images, the liver is reduced in signal intensity compared to the paraspinal musculature. Signal intensity ratio, R2 and R2* relaxometry have been validated for quantifying liver iron concentration, with R2* showing the highest level of evidence for use and correlation with biopsy.35,36
Vascular Abnormalities
Transient hepatic attenuation/intensity differences are areas of parenchymal enhancement due to alterations in the dual hepatic blood supply. They may be associated with a focal lesion or due to vascular causes such as venous thrombosis, biliary obstruction, and arterioportal shunts. 37 Shunts are commonly seen in cirrhosis 37 and appear as wedge-shaped areas of arterial phase hyperenhancement. These represent benign perfusion alterations that can be reassessed on follow-up. 38 They are distinguished from true lesions by their geographic shape, lack of mass effect, absence on other phases and lack of delayed washout. 39
Granulomatous Processes
Systemic conditions like sarcoidosis, tuberculosis, and fungal infections like histoplasmosis can cause diffuse granulomatous infiltration of the liver, creating innumerable small nodules (eg, disseminated miliary tuberculosis) which are hypoattenuating on CT, and T1 and T2 hypointense on MRI. 40 Macronodules may be seen in hematogenous spread of tuberculosis through the portal vein. 41 Confluent inflammatory masses may appear T2 hyperintense with minimal enhancement 40 and can mimic infection or metastases, in which case biopsy can confirm diagnosis.
Pitfalls in Lesion Detection and Characterization in Diffuse Liver Disease
Pitfall 1: Appearance of Pseudolesions in Diffuse Liver Disease
Focal fat deposition and focal fat sparing in hepatic steatosis can mimic true mass lesions.6,42 They are typically geographic, ill-defined, or wedge-shaped, found in characteristic locations—adjacent to the gallbladder fossa, the falciform ligament, or porta hepatis,6,43 and thought to be related to variant venous circulation, such as aberrant gastric venous drainage. 44 There is a lack of mass effect; normal hepatic and portal vessels traverse the area undisturbed. Focal fatty change can demonstrate contrast enhancement equal to or less than the surrounding normal liver parenchyma. 6 Diagnosis is confirmed by the presence of intracellular fat and signal loss on opposed-phase MRI6,14 (Figure 1).
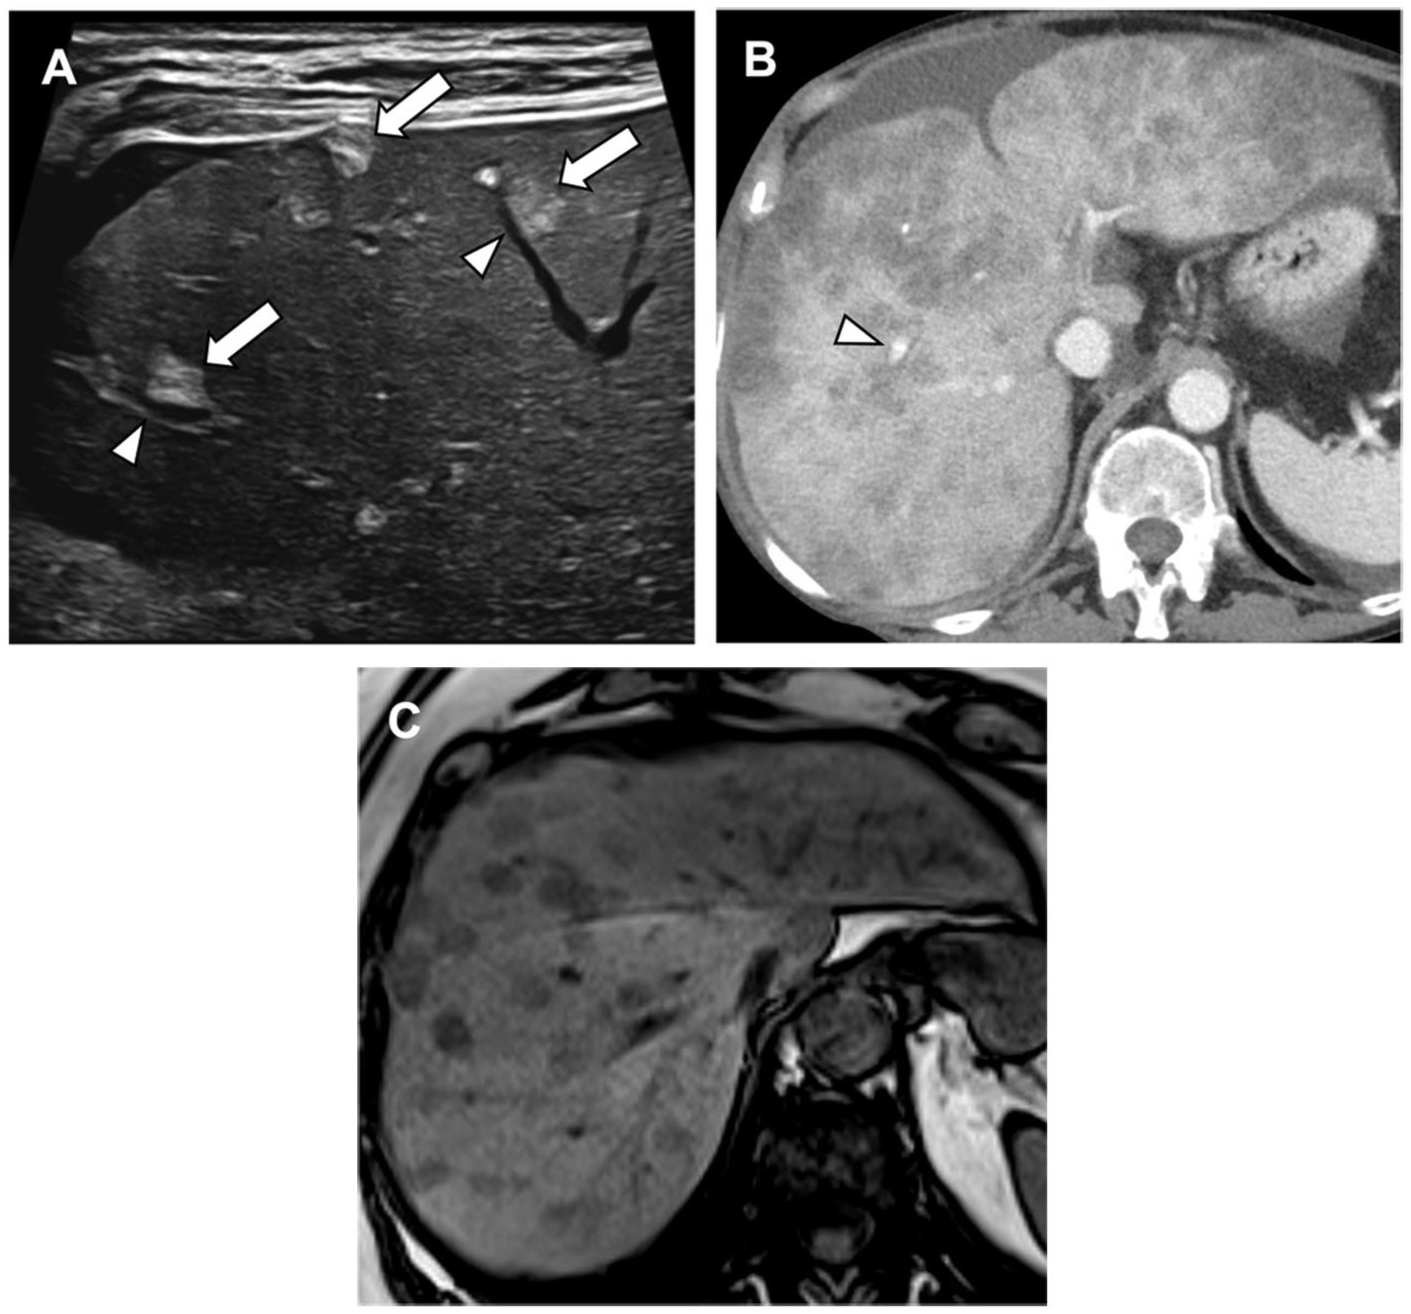
Nodular steatosis causing the appearance of pseudolesions. (A) Ultrasound image shows several echogenic liver lesions (arrows) with traversing vessels (arrowheads). (B) Contrast-enhanced CT images show numerous widespread nodular hypoattenuating liver lesions without mass effect and vessels seen traversing the lesions (arrowhead). (C) T1-weighted opposed-phase MRI image: the nodules show signal dropout, confirming the presence of intracellular fat.
True fat-containing neoplasms should be considered in the differential. They include some hepatocellular adenomas (the HNF-1α-inactivated, inflammatory, and β-catenin activated subtypes), 45 hepatocellular carcinomas, dysplastic nodules, 46 and rarely, focal nodular hyperplasia. 47 Rare tumors like angiomyolipomas and lipomas can also contain fat. 48 Given the complex differential, contrast-enhanced MRI is often required for characterization.
Confluent hepatic fibrosis is a large, mass-like area of fibrosis on a background of advanced fibrosis and cirrhosis and can be challenging to differentiate from infiltrative malignancies like cholangiocarcinoma or HCC. Key features favoring confluent fibrosis are wedge-shaped configuration, geographic distribution, volume loss with capsular retraction, and progressive, delayed enhancement similar to that of fibrotic bands (Figure 2). It typically lacks the arterial phase hyperenhancement or washout characteristic of malignancy and may show volume loss on follow-up studies. 18
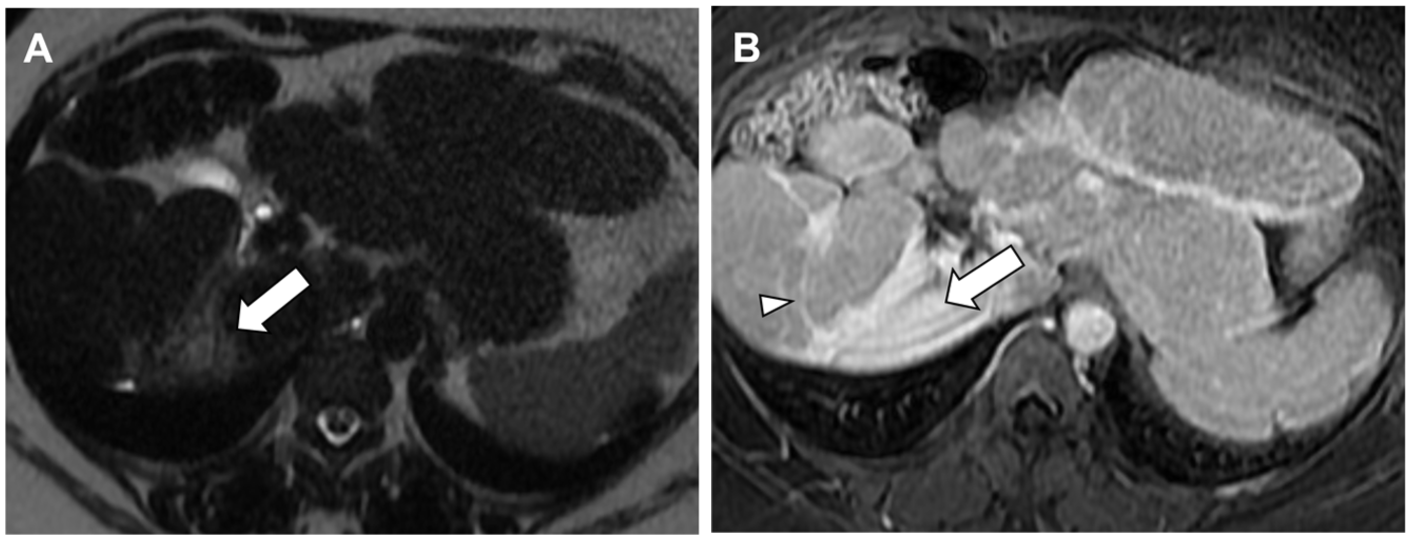
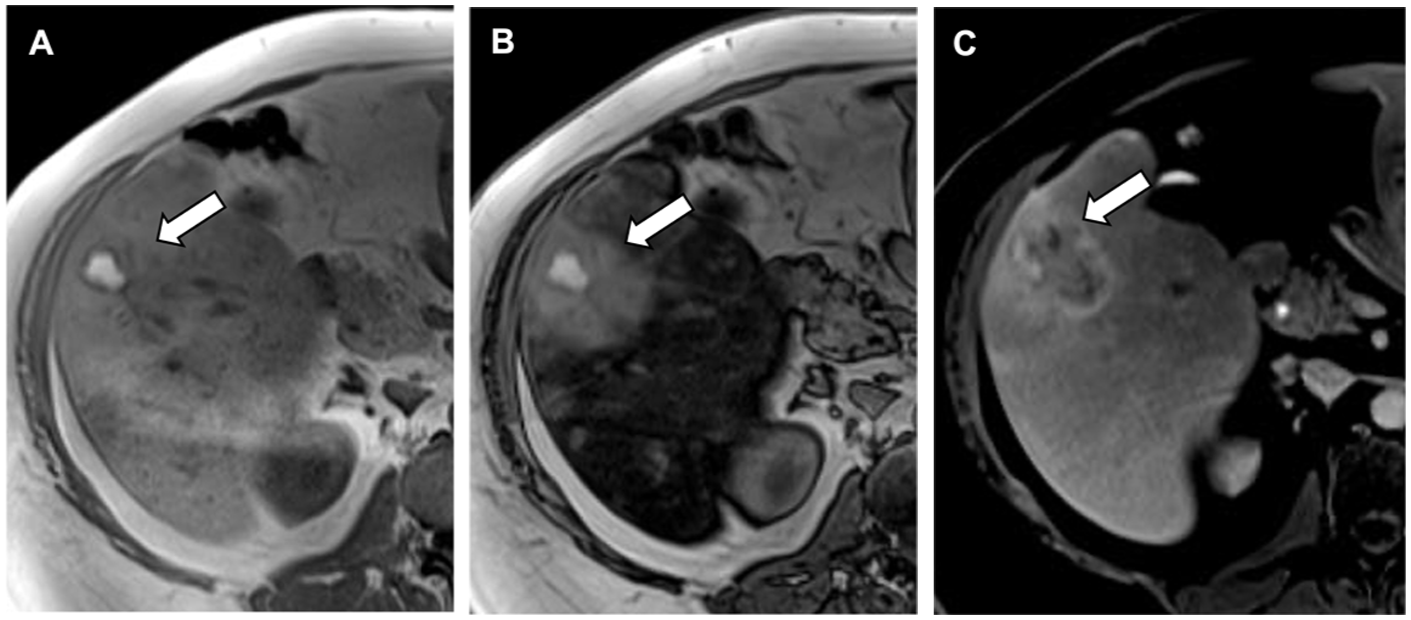
Confluent hepatic fibrosis mimicking a focal mass lesion. (A) T2-weighted MRI image demonstrates a hyperintense wedge-shaped lesion (arrow) with a concave border in the right lobe. The liver is enlarged and fibrotic with lobar redistribution. (B) Dynamic contrast-enhanced MRI, delayed phase: the lesion shows diffuse and delayed enhancement (arrow), similar to that of enhancing fibrotic septae (arrowhead).
Pitfall 2: Altered Liver Parenchyma Can Change the Expected Appearance and Enhancement Characteristics of Focal Liver Lesions
Interpreting the appearance of focal liver lesions by comparing them to the surrounding liver parenchyma can become a diagnostic pitfall when the liver parenchyma is altered in diffuse liver disease.
In hepatic steatosis, the echogenic liver parenchyma on B-mode US causes most liver lesions to appear hypoechoic by default. 4 For example, hepatic hemangiomas are characteristically well-defined and hyperechoic, 6 while focal nodular hyperplasia (FNH) is either occult or only subtly changed in echogenicity relative to the liver, with or without a central scar. 49 In a steatotic liver, both can appear as a non-specific hypoechoic nodule, indistinguishable from a malignant lesion (Figure 3). This frequently leads to further investigations. 6 Where available, contrast-enhanced ultrasound (CEUS) allows real-time assessment of the lesion’s enhancement pattern rather than relying on baseline echogenicity as on B-mode US, making it a useful problem-solving tool. 50
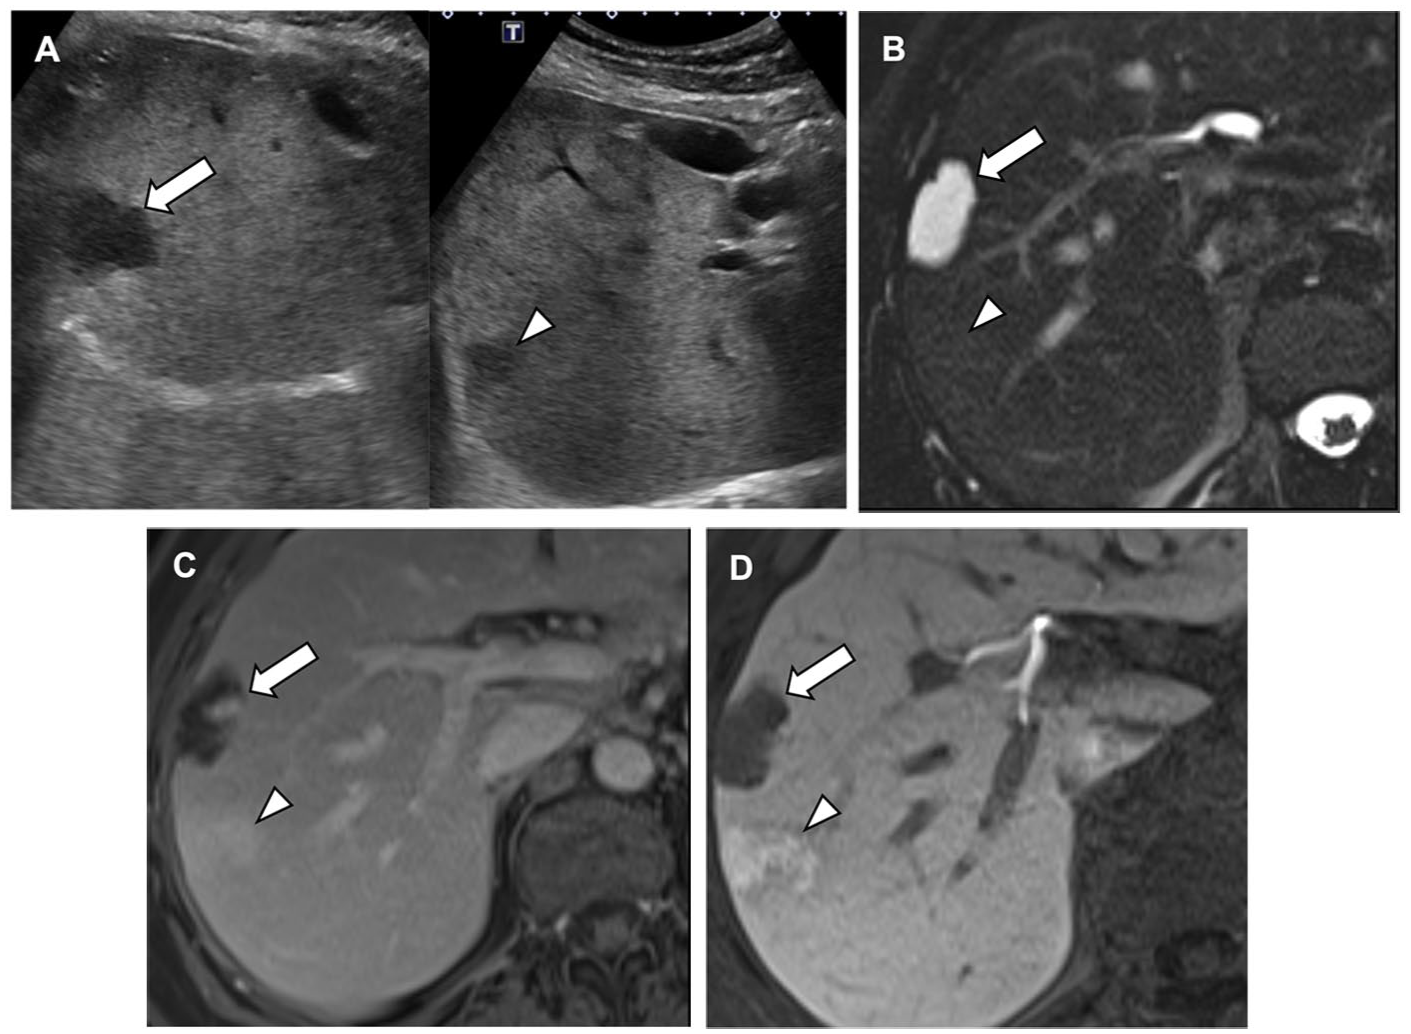
Hemangioma and FNH with atypical hypoechoic imaging appearance on ultrasound due to background steatosis. (A) Ultrasound shows two hypoechoic liver lesions in liver segment 8. The background liver is steatotic and diffusely echogenic. (B) T2-weighted MRI image shows lesion 1 (arrow) as hyperintense and lesion 2 (arrowhead) as isointense to the surrounding parenchyma. (C) Dynamic contrast-enhanced MRI, delayed phase. Lesion 1 (arrow) shows incomplete, peripheral nodular enhancement, while lesion 2 (arrowhead) enhances iso- or slightly hyperintensely relative to the parenchyma. (D) Dynamic contrast-enhanced MRI, hepatobiliary phase. Lesion 1 (arrow) shows no uptake, consistent with a hepatic hemangioma. Lesion 2 (arrowhead) retains hepatobiliary-specific contrast agent, consistent with an FNH.
On CT, the reduced attenuation of steatotic liver parenchyma can cause typically hypoattenuating lesions to appear isoattenuating or even hyperattenuating (“pseudo-enhancing”) relative to the background liver, 6 leading to mischaracterization. Liver metastases from colorectal and breast carcinoma are typically hypovascular and hypodense on contrast-enhanced CT. 51 When present in a low-density fatty liver, the same metastases can appear hyperdense (Figure 4), mimicking hypervascular metastases seen in primary malignancies such as renal cell carcinoma, thyroid carcinoma, neuroendocrine tumors, and malignant melanoma. 51 MRI remains the ideal modality for lesion characterization with its ability to assess enhancement patterns on dynamic contrast-enhanced sequences. 52
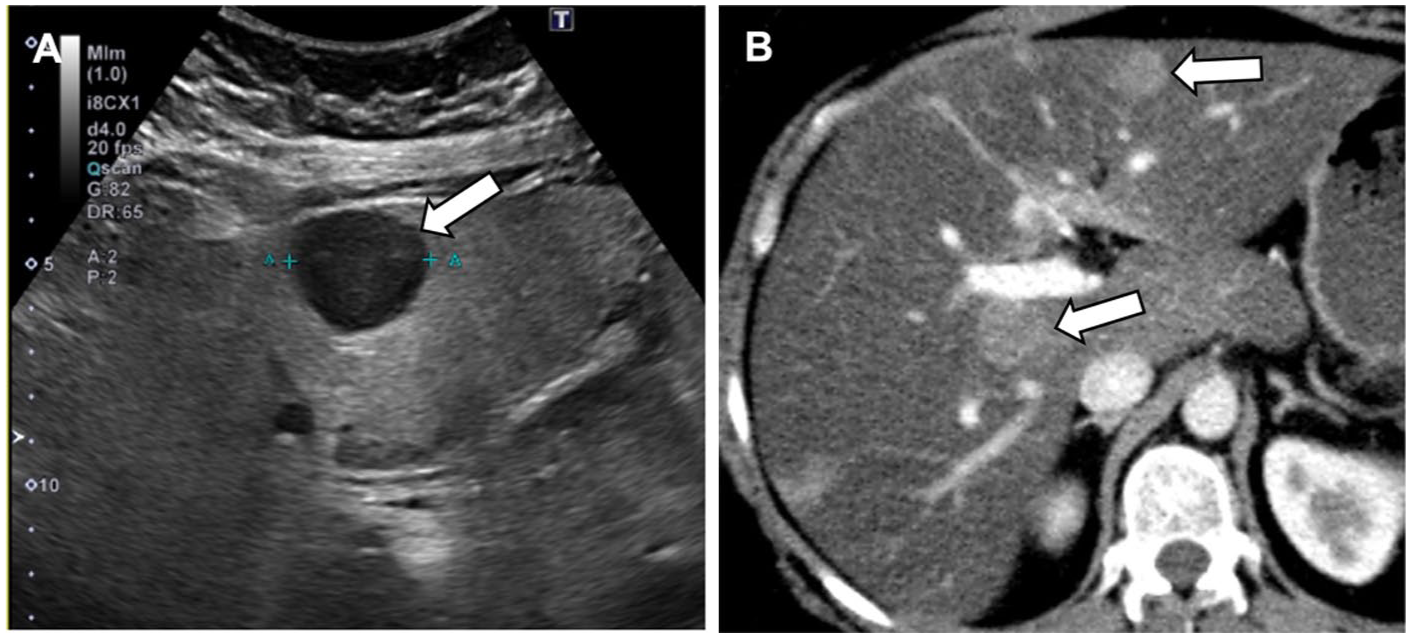
Altered imaging appearance of a liver metastasis on CT in a patient with primary breast malignancy. (A) Ultrasound image shows multiple hypoechoic liver lesions (arrow) in a diffusely steatotic, echogenic liver. (B) Contrast-enhanced CT shows the lesions to appear atypically hyperattenuating relative to the severely hypodense fatty liver (arrows).
In conditions causing hepatic iron overload, the background liver signal intensity is reduced on MRI, which can lead to solid lesions appearing as relatively high T2 signal intensity, mimicking a benign cyst or hemangioma, 31 and requiring intravenous contrast administration for characterization.
Altered liver parenchymal appearance in background liver disease can reduce lesion-to-liver contrast, leading to a phenomenon described as “vanishing washout.” Washout, a major LI-RADS feature for HCC diagnosis, 38 is a reduction in lesion enhancement from an earlier to a later phase, resulting in hypoenhancement relative to the surrounding liver parenchyma. Non-peripheral washout in combination with arterial phase hyperenhancement (APHE) categorizes a lesion as LI-RADS 5 (“definitely HCC”). 38
When the background liver is diffusely hypoattenuating, a truly washing out HCC may not appear hypodense enough, instead appearing iso- or slightly hyperdense. A study by Min et al found that washout was lost on CT in 38% of HCCs in steatotic livers, compared to only 11% in non-steatotic livers. 53 This pitfall can lead to the mischaracterization of a definite HCC as an indeterminate lesion, delaying management.
CEUS can confirm diagnosis by identifying the characteristic washout of HCC in the portal-venous phase. 54 MRI with subtraction imaging digitally subtracts the unenhanced T1-weighted image dataset from the post-contrast datasets, allowing better appreciation of true washout compared to standard post-contrast images. 55 Min et al confirmed that MRI was significantly less affected by steatosis than CT 53 (Figure 5).
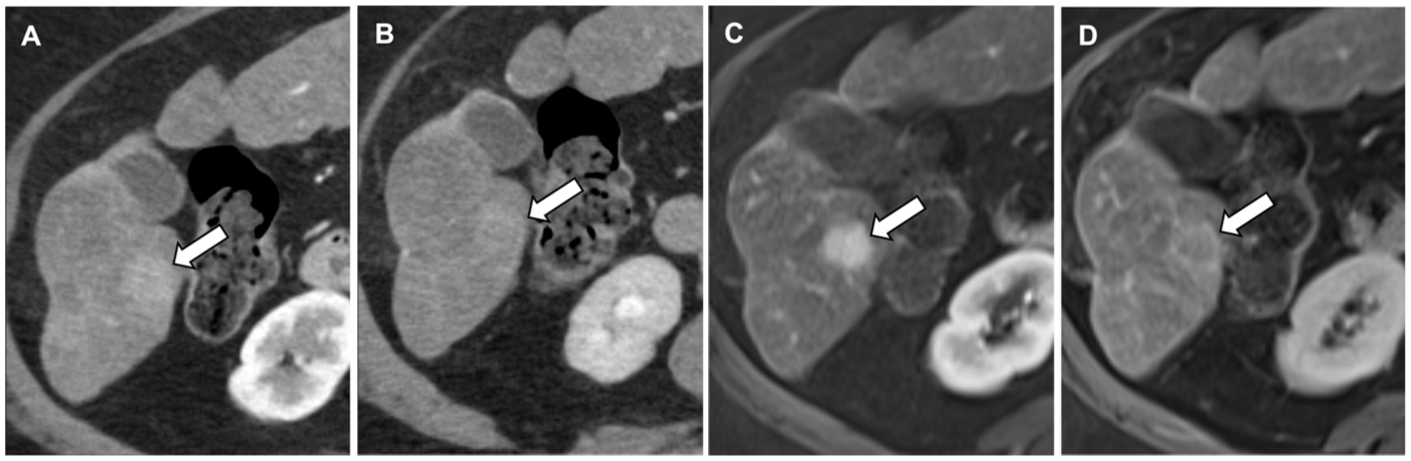
Vanishing intralesional washout on CT in a patient with severe steatosis. MRI aids in clarifying this diagnostic uncertainty. (A) Contrast-enhanced CT, arterial phase image shows a liver lesion with mild arterial enhancement (arrow). (B) Contrast-enhanced CT, portal venous phase image. The lesion appears isodense to the liver parenchyma without discernable washout. (C) Dynamic contrast-enhanced MRI, arterial phase, shows the lesion to be arterially enhancing. (D) Dynamic contrast-enhanced MRI, delayed phase, shows capsule enhancement diagnostic of HCC and subtle washout not appreciable on CT.
Pitfall 3: Diffuse Liver Disease Can Obscure Focal Liver Lesions and Underestimate Burden of Disease
Reduced lesion-to-liver contrast in diffuse liver disease can obscure focal liver lesions and underestimate true disease burden.3,52 On B-mode US, lesion detection is reduced from over 90% in non-steatotic livers to approximately 74% in severe steatosis. 4 On CT, lesion detection drops from 88% in non-steatotic livers to 65% in steatotic livers, with sensitivity for detecting small lesions <1 cm as low as 33%. 52
In a low attenuation steatotic liver on CT, the reduced HU difference between a hypoattenuating metastasis and the liver can render the lesion isoattenuating to the liver and occult, adversely impacting disease staging and patient management. A negative or equivocal CT in a patient with malignancy and underlying hepatic steatosis, therefore, warrants a high degree of suspicion and may require further investigation with alternative imaging modalities (Figure 6).
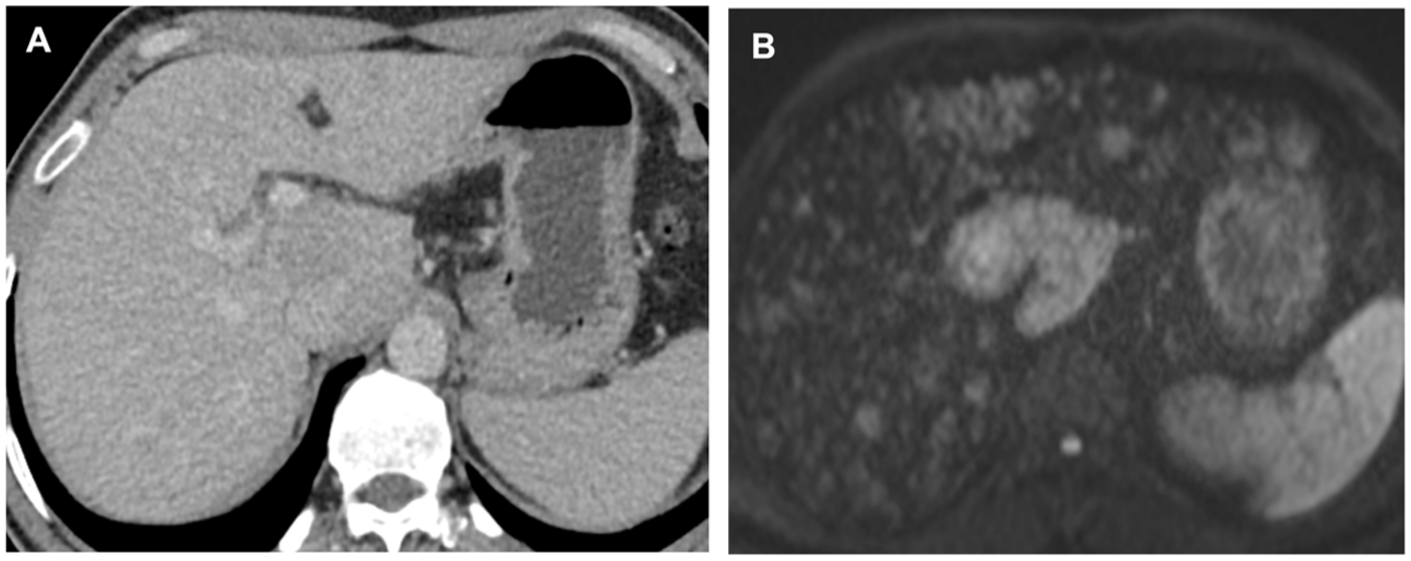
Obscured widespread liver metastases in a steatotic liver. (A) Contras-enhanced CT shows mild parenchymal heterogeneity in a diffusely steatotic liver but no focal lesion. (B) Diffusion weighted MRI image of the same patient reveals widespread hyperintense metastatic lesions, which were occult on CT.
CEUS can be useful for demonstrating definitive portal venous and late phase washout in metastases. 50 MRI remains the definitive modality in the setting of liver diseases, with higher sensitivity (86%) for lesion detection than CT (70%).52,56 Diffusion weighted imaging (DWI) is highly sensitive for oncologic imaging as metastases exhibit restricted diffusion and appear as hyperintense lesions. 57 DWI achieves sensitivity around 84% for small lesions and outperforms conventional T2-weighted imaging. 58 Metastases also will not take up hepatobiliary-specific contrast agent (HBCA) and will appear as conspicuous, hypointense, well-defined defects against the liver. 59
Hepatic Adenoma and FNH: Challenges in Diagnosis
Hepatocellular adenomas (HCAs) can show variable uptake of HBCA on the hepatobiliary phase of MRI, mimicking FNH. Most HCAs lack functioning hepatocytes and biliary ductules and are characteristically hypointense on hepatobiliary phase images; however, certain subtypes can retain contrast 60 due to tumor expression of organic anion transporting polypeptides (OATPs) necessary for HBCA uptake. 61
β-catenin-activated HCA (b-HCA) show the highest frequency of hepatobiliary phase uptake, with approximately 59% demonstrating iso- or hyperintensity relative to the liver. 62 This is a critical pitfall as b-HCAs carry a higher risk of malignant transformation to HCC. 60 Hepatobiliary phase uptake has also been reported in 14% of inflammatory HCA (I-HCA) and 11% of unclassified HCA. 62 In contrast, HNF-1α–inactivated HCA (H-HCA) rarely show hepatobiliary phase uptake (0%-2%) 62 and is characterized by diffuse intracellular fat.
Radiologists should be aware of the imaging overlap between b-HCA (and to a lesser extent I-HCA and unclassified HCA) and atypical FNH, all of which can show heterogeneous hepatobiliary phase uptake. Quantitative methods such as the lesion-to-liver contrast enhancement ratio (LLCER) have been suggested to assess the true degree of contrast uptake by a lesion 60 and differentiate adenomas lacking true hepatobiliary phase uptake from atypical FNH; 63 however, biopsy is often ultimately required to guide management, considering the differing risks of malignant transformation for each adenoma subtype (Figure 7).
Biopsy proven unclassified adenoma with atypical HBCA uptake on the hepatobiliary phase. (A) T1-weighted in-phase MRI image shows a segment 5 liver lesion (arrows), which is largely isointense to the surrounding parenchyma with areas of heterogeneity/intralesional T1 hyperintense signal hemorrhage. (B) T1-weighted opposed-phase MRI image shows T2 hyperintensity of the lesion relative to the background steatotic liver, which has lost signal. (C) Dynamic contrast-enhanced MRI, hepatobiliary phase. The lesion shows variable uptake of contrast, which is atypical in adenoma but can be seen in a minority of unclassified adenomas.
Conclusion
Diffuse liver diseases reduce the sensitivity and specificity of focal lesion detection by altering lesion appearance, masking lesions, and producing pseudolesions. Key strategies to mitigate these challenges include:
Employing MRI and CEUS (where available) for improved lesion detection and characterization in diffuse liver disease, where they may be altered or obscured.
Recognizing pseudolesions such as focal fatty change and confluent fibrosis and using appropriate imaging modalities to avoid misdiagnosis.
Using MRI sequences such as chemical-shift imaging, DWI, and dynamic contrast sequences with HBCA to improve diagnostic accuracy.
An iterative, multimodality imaging approach tailored to the specific diffuse liver disease optimizes detection and characterization of focal liver lesions, ultimately ensuring appropriate clinical management and optimal patient care.
Footnotes
Funding
The authors received no financial support for the research, authorship, and/or publication of this article.
Declaration of Conflicting Interests
The authors declared no potential conflicts of interest with respect to the research, authorship, and/or publication of this article.