
Abstract

Introduction
Radiology generates greenhouse gas (GHG) emissions during the production and use of medical imaging equipment. 1 Rising atmospheric GHG levels are directly linked to climate change and increasing global temperatures. Overall, healthcare systems contribute approximately 4% to 8% of total global GHG emissions. 2 However, there are limited data on overall GHG emissions generated in radiology departments by medical imaging modality. Data on the relative GHG emission contributions by modality is needed to inform prioritization of environmental sustainability efforts in radiology. The purpose of this study was to evaluate GHG emissions by diagnostic imaging modality in a Canadian hospital-based radiology department.
Methods
We performed a cross-sectional retrospective analysis of total GHG emissions for diagnostic radiology tests at an academic Canadian medical imaging department covering 3 hospital organizations (serving 5 hospital sites) over 5 years (2018-2022). The department includes medical imaging equipment from multiple vendors. This study does not involve human subjects or patient-level data and thus, institutional research ethics board approval was not required.
Seven diagnostic imaging modalities were evaluated, including X-ray, mammography, ultrasound (US), computed tomography (CT), magnetic resonance (MRI), single photon emission tomography (SPECT), and position emission tomography (PET).
The total number of diagnostic imaging tests by modality was determined per year based on direct billing data. Average GHG emissions were calculated in metric tons carbon dioxide equivalents (MTCO2e) per year and overall, based on modality-specific GHG emission estimates, 0.65 kg CO2e for X-ray and mammography (range, 0.5-0.8 kg CO2e), 0.85 kg CO2e for US (range, 0.5-1.2 kg CO2e), 7.9 kg CO2e for CT (range, 6.6-9.2 kg CO2e), 18.6 kg CO2e for MRI (range, 17.5-19.7 kg CO2e), 13.0 kg CO2e for SPECT (range, 11.6-14.4 kg CO2e), and 60.5 kg CO2e for PET (range, 54-67 kg CO2e).3-6
Results
Across the entire radiology department, an average of 588 222 ± 43 995 diagnostic imaging tests were performed each year (Table 1). Total diagnostic imaging tests were lowest in 2020 (511 294), as expected due to the COVID-19 pandemic, but were otherwise similar between years.
Number of Diagnostic Imaging Tests and Greenhouse Gas Emissions by Modality.
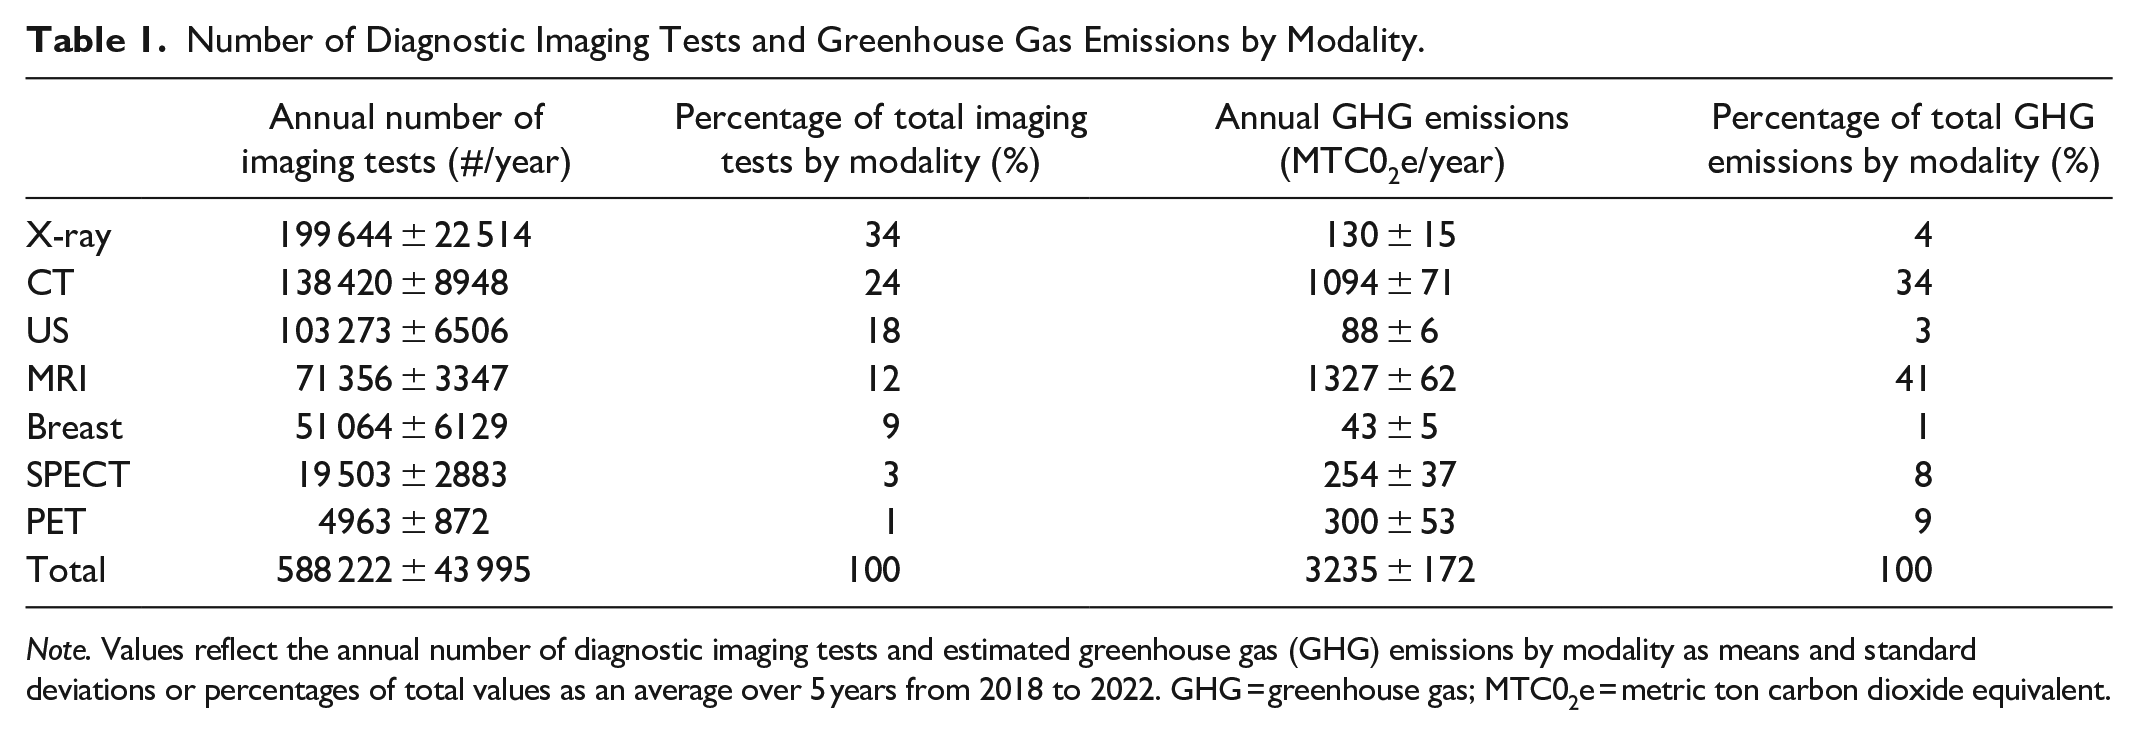
Note. Values reflect the annual number of diagnostic imaging tests and estimated greenhouse gas (GHG) emissions by modality as means and standard deviations or percentages of total values as an average over 5 years from 2018 to 2022. GHG = greenhouse gas; MTC02e = metric ton carbon dioxide equivalent.
Average total GHG emissions for all diagnostic medical imaging tests were 3235 ± 172 MTCO2e per year, comparable to the energy consumed by 422 single-family homes or the average GHG emissions generated by 770 gasoline-powered passenger vehicles driven for 1 year 7 (Figure 1).
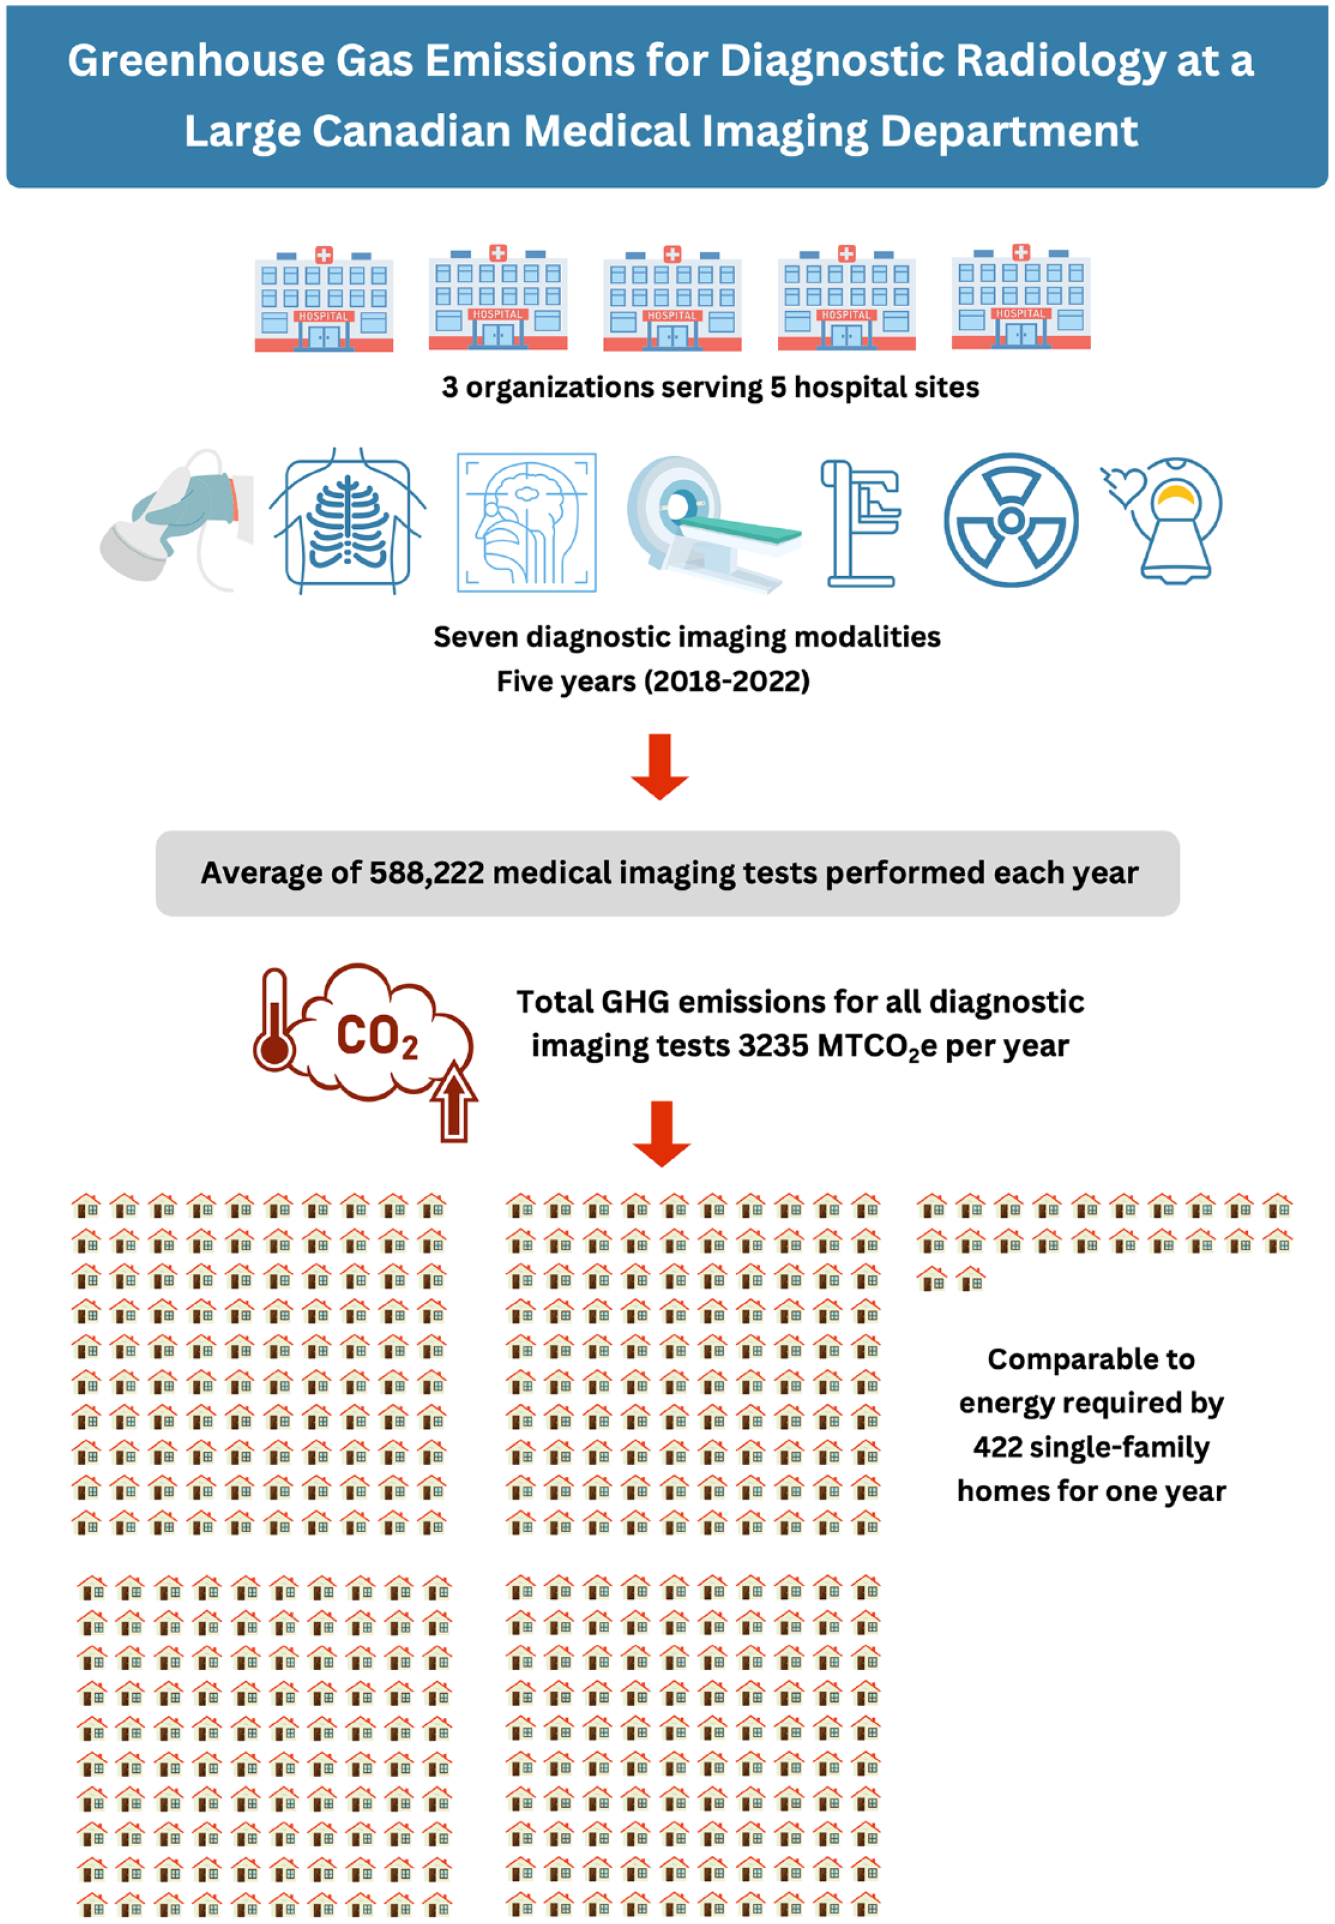
Summary of annual greenhouse gas (GHG) emissions from diagnostic medical imaging in a Canadian hospital-based, multi-site radiology department.
By modality, MRI accounted for the highest proportion of GHG emissions (1327 ± 62 MTCO2e/year, 41% of total GHG emissions) but only 12% of imaging tests performed (71 356 ± 3347 MRI/year) (Figure 2). CT accounted for 34% of total GHG emissions (1094 ± 71 MTCO2e/year) and 24% of imaging tests (138 420 ± 8948 CT/year).
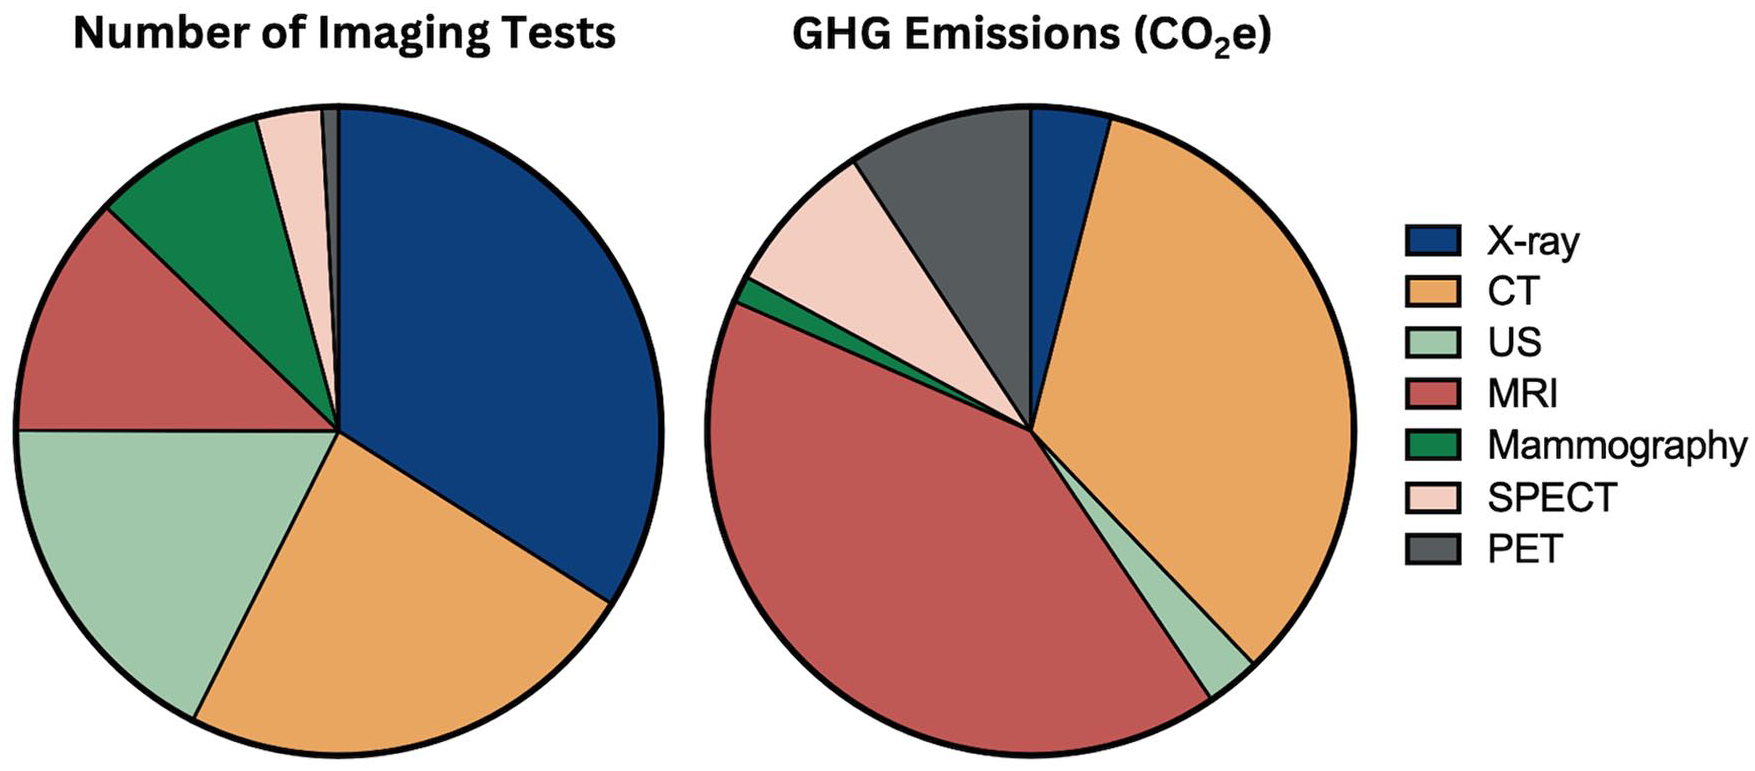
Number of diagnostic radiology imaging tests and associated greenhouse gas (GHG) emissions in a Canadian hospital-based, multi-site radiology department by imaging modality.
Conversely, X-ray and US accounted for 34% and 18% of imaging tests, respectively, (199 644 ± 22 514 X-ray/year and 103 273 ± 6506 US/year), but only 4% and 3% of GHG emissions (130 ± 15 MTCO2e/year and 88 ± 6 MTCO2e/year, respectively).
Discussion
In a cross-sectional analysis of a large Canadian academic multi-site radiology department, annual GHG emissions were substantial, equivalent to the energy consumed by 422 single-family homes. By modality, MRI was the largest contributor to GHG emissions (41%) despite only accounting for 12% of imaging tests.
Limitations of this study include estimated GHG emissions by modality. GHG emission estimates were based on averages from multiple studies when available with totals calculated based on the actual number of imaging tests by modality per year. The distribution of imaging tests may differ in other radiology departments, as can other factors impacting environmental sustainability such as scanner scheduling intensity and the lengths of protocols.8-10 Only diagnostic imaging tests were evaluated as specific GHG emission estimates for interventional procedures are currently lacking. Further study should include direct energy measurements for each modality including a range of indications and comprehensive life cycle analysis for both diagnostic and interventional radiology.
Given that MRI and CT are associated with the highest proportion of GHG emissions, initial environmental sustainability efforts in radiology departments can be targeted to these modalities.
Footnotes
Acknowledgements
Kate Hanneman is the co-chair of the Canadian Association of Radiologists Journal. Ania Kielar is the President of the Canadian Association of Radiologists. No other potential conflicts of interest were declared.
Declaration of Conflicting Interests
The author(s) declared the following potential conflicts of interest with respect to the research, authorship, and/or publication of this article: KH: Co-Chair Canadian Association of Radiologists Environmental Sustainability Working Group and Associate Editor Canadian Association of Radiologists Journal. AK: President Canadian Association of Radiologists.
Funding
The author(s) received no financial support for the research, authorship, and/or publication of this article.