
Abstract
This is a visual representation of the abstract.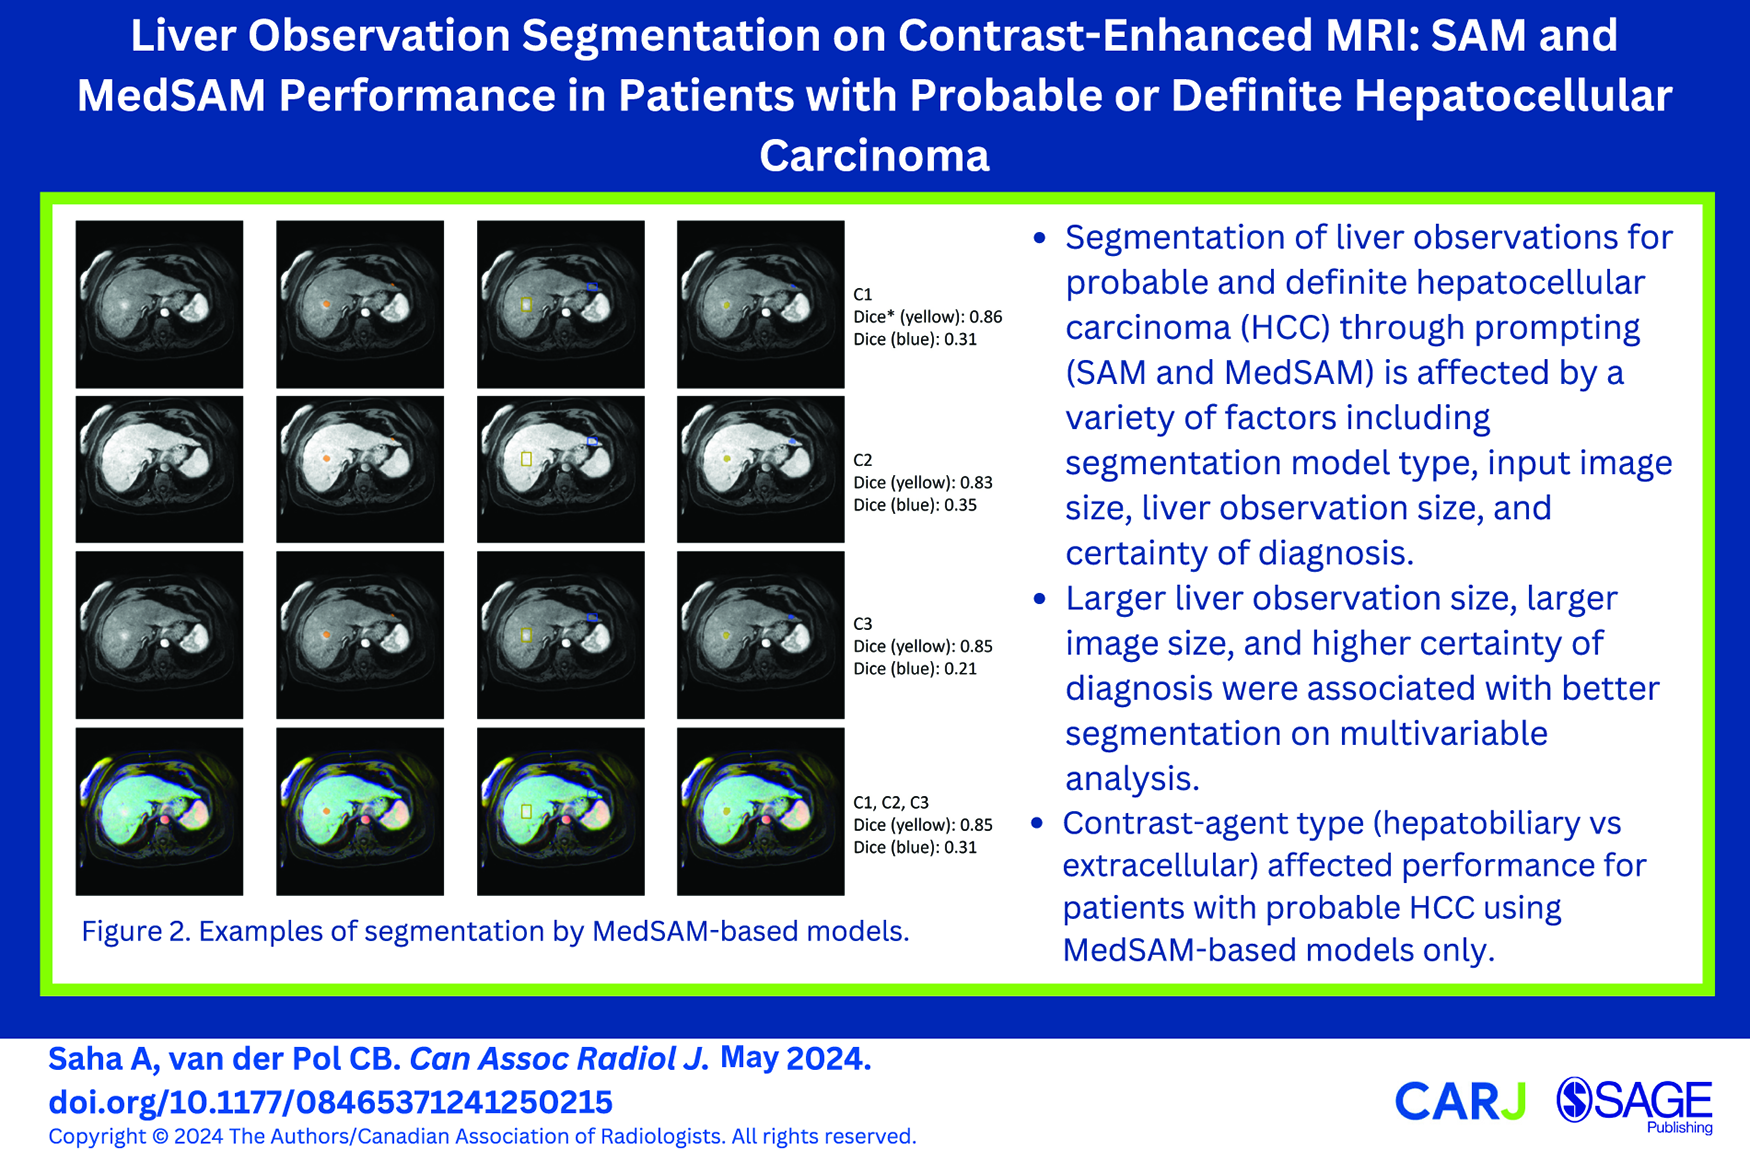
Introduction
The liver is the largest solid organ in the human body. It is a common site for metastatic disease as well as primary malignancy in high-risk patients (non-vascular cirrhosis, chronic hepatitis B viral infection, current/prior hepatocellular carcinoma [HCC]).1-3 Accurate delineation of liver observations on imaging can facilitate machine learning (ML) model development for downstream clinical tasks such as observation detection and interpretation. Though computed tomography (CT) and magnetic resonance imaging (MRI) both play important roles in the diagnosis and staging of HCC,4,5 ML has been mostly used to delineate liver observations on CT. 6 ML-based studies exploring delineation using MRI are limited, possibly due to the use of numerous sequences and the greater susceptibility of MRI to motion artifact compared to CT.7,8 Some studies using MRI for liver observation segmentation including HCC, metastases, and other hepatic observations have shown variability in model performance due to size, shape, and image quality, however, none have combining multiple factors into a single comprehensive analysis to determine which factors are most important.8-14 The task of liver observation segmentation remains challenging due to enormous heterogeneity in liver observation appearance, texture, size, shape, location, and number of liver observations per image and patient.11,15,16
A recent image segmentation model, the Segment Anything Model (SAM), 17 enables interaction through prompts. In the context of images, prompts are instructions/cues/pre-conditions that can be in a variety of forms such as text-based or a location on an image (eg, by providing points or bounding boxes indicating the location of pathology) to elicit a desired response from a trained model for a specific task. The application of SAM has surged the evaluation and utilization of prompts for medical image segmentation 18 using a variety of imaging modalities and diseases in a zero-shot fashion (without the need for explicit re-training or fine-tuning),19-21 with bounding-box prompts performing better for medical image segmentation compared to point prompts. In MedSAM v1., 22 only the mask decoder of SAM is re-trained using a subset of the overall dataset, and tested on a hold-out subset, to adapt SAM for the domain of interest. MedSAM has shown improved performance compared to SAM based on re-training the mask decoder on bounding-box-based prompts, but has nonetheless demonstrated variability in performance across modalities and diseases, similar to SAM.
Hepatic observation segmentation on contrast-enhanced (CE) MRI has not been thoroughly explored and factors leading to variation in model performance remain unclear for prompting-based segmentation. Given the variability of SAM and MedSAM’s performance across tasks and imaging modalities, and the inherent challenge of segmenting hepatic observations in patients at high-risk for HCC, we attempted to address this gap with an extensive evaluation. Patients, with liver observations considered probable HCC or definite HCC using Liver Imaging Reporting and Data System (LI-RADS), were included. The LI-RADS diagnostic algorithm incorporates 5 major and 21 ancillary features on CT/MRI to risk stratify observations in high-risk patients into one of several categories that each have a specific likelihood for HCC with a corresponding management recommendation. The purpose of this study was to evaluate factors impacting the SAM and variant MedSAM performance for segmenting liver observations on CE-MRI in high-risk patients with probable HCC (LR-4) and definite HCC (LR-5).
Materials and Methods
The Hamilton Integrated Research Ethics Board (HiREB) approved this study which was performed using only retrospective data and the need to obtain informed consent was waived. A subset of 59 patients from the present study was reported in an earlier publication 23 that determined the impact of LI-RADS ancillary features on MRI and investigated their role toward diagnostic accuracy. Reporting was in adherence with the Checklist for Artificial Intelligence in Medical Imaging. 24 The study outline is shown in Figure 1.
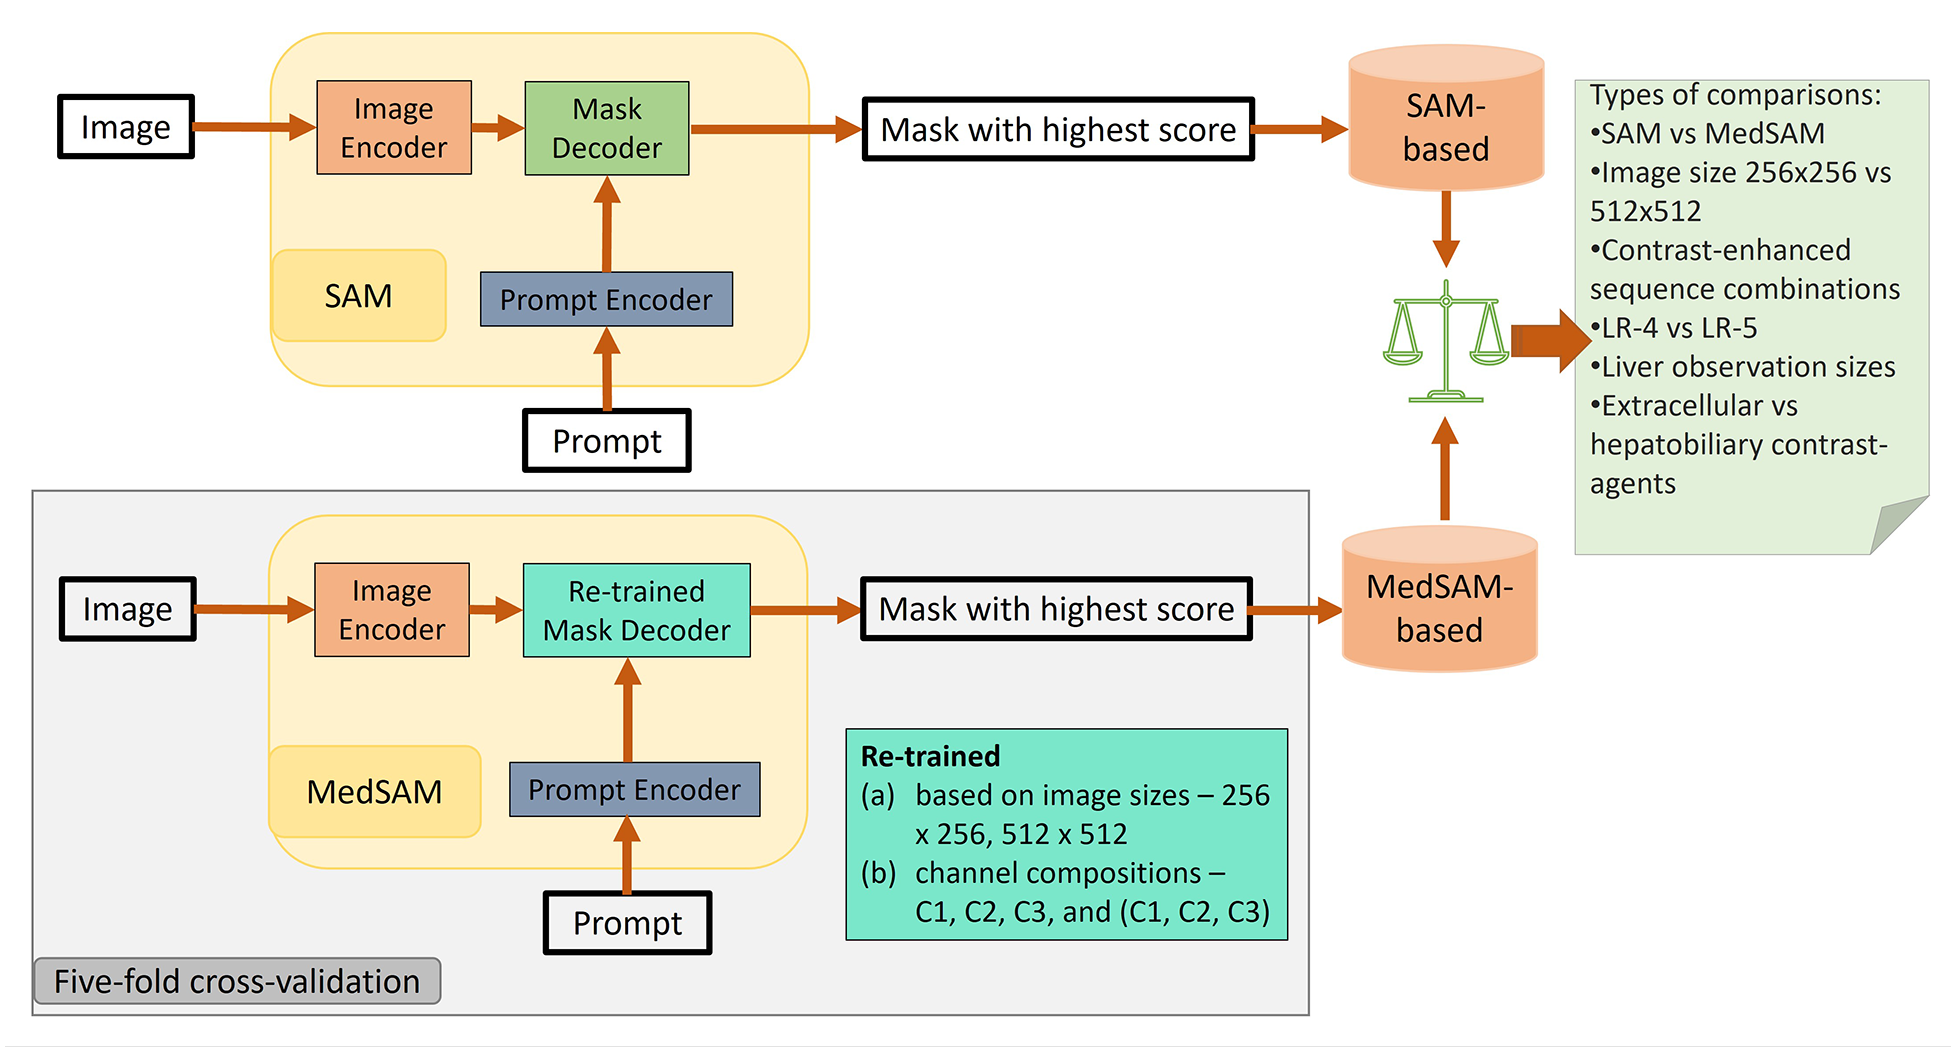
Study outline indicating training, evaluation, and model comparison performed. C1, C2, and C3 correspond to the earliest post-contrast acquisition which is typically a late arterial phase, portal venous phase, and delayed phase using extracellular agent or hepatobiliary phase using hepatobiliary agent, respectively. LR-4 and LR-5 represent patients with probable and definitive hepatocellular carcinoma observations, LI-RADS-4 and LI-RADS-5, respectively.
Data
The institutional Picture Archiving and Communications System (PACS) was searched from August 2013 to December 2018 for the following text strings: “LIRADS,” “LI-RADS,” or “Liver Imaging Reporting and Data System.” Patients were excluded if they were not at high-risk for HCC or if the MRI was nondiagnostic due to motion artifact. The cohort was limited to only patients with LR-4 and LR-5 observations, which warrant further management beyond surveillance. 3 A variety of scanners and field strengths were used (all either 1.5T or 3T) with all scans adherent to the LI-RADS technical recommendations as per our standard MRI protocol available. 23
Post-contrast T1-weighted fat-suppressed sequences formed the primary dataset (prim_d) for model training and evaluation. A secondary dataset (sec_d), formed by including only the subset of patients with any single liver observation positive for any of the 3 of arterial phase hyperenhancement, nonperipheral washout, and enhancing capsule (each a LI-RADS major feature), was evaluated separately to see if performance improved with presence of a major feature. The post-contrast sequences were labelled as C1, C2, C3 with C1 corresponding to the earliest post-contrast acquisition (typically late arterial phase), followed by C2 (typically portal venous phase) followed by C3 (typically delayed phase using extracellular agent or hepatobiliary phase using hepatobiliary agent).
Ground Truth
For identifying the LI-RADS major features and LI-RADS categories, each MRI was reviewed independently by 2 fellowship-trained abdominal radiologists, with discrepancies resolved by a third radiologist. The segmentation ground truth was established by a single fellowship-trained abdominal radiologist (C.V.P, 6 years of experience) who manually segmented each observation image by image using ITK-SNAP. 25 The identifiable metadata in the image volumes were suppressed.
Data Partitions
A 5-fold cross-validation (CV) scheme with patient-wise stratification was used for evaluating the performance of SAM (zero-shot) and MedSAM (mask decoder of SAM retrained).
Models
A publicly available repository for MedSAM was acquired for training the MedSAM-based models. 26 A SAM checkpoint (“sam_vit_b_01ec64.pth”) was acquired from the SAM repository for evaluating SAM and for training MedSAM (Figure 1) separately on both prim_d and sec_d to obtain MedSAM-based models.
Prior to resizing the 2D slices to form the image channels, all image volumes were preprocessed to retain their intensity values within the 0.5 and 99.5 percentiles of their raw values and converted to unsigned integer 8-bit format (“uint8”) prior to conversion to nifti files.
Training
MedSAM-based models were trained on images (2D slices) having >20 voxels per observation only for the following criteria:
Image size: (a) 256 × 256 pixels and (b) 512 × 512 pixels (since the mask decoder’s output is 256 × 256 pixels, a bicubic linear interpolation was used).
Channel composition: two-dimensional (2D) images were formed with 3 channels consisting of slices from (a) C1 only, (b) C2 only, (c) C3 only, and (d) C1, C2, and C3 respectively (referred to as C1C2C3).
Following MedSAM’s training procedure, we expanded the bounding box randomly up to 20 voxels around an observation (foreground) on images and provided that as a prompt. If a slice had multiple liver observations, multiple prompts were provided (one per observation) for that slice. Using Dice loss + cross-entropy as the loss function, the mean loss per slice was determined for all prompts and then backpropagated to fine-tune the mask decoder only. All models were trained for 100 epochs.
Evaluation
The performance of the models over 5-fold CV was evaluated using the following procedure: within each fold, a patient’s image volumes were gathered to form input images using the applicable channels after resizing. Then, each liver observation was checked such that any occurrence of the same observation that was <20 pixels in size was replaced by background (zero values) in that slice only, and an updated ground truth was generated. Then, prompts in the form of a randomly expanded bounding box that were limited to the slices containing foreground, were generated. For a particular volumetric observation, each eligible prompt and corresponding 2D input image were provided to a model, and the output prediction was accumulated in a volume, until all eligible observations were tested. A volumetric Dice coefficient, based on average from 3 prompts (ie, 3 random expansions), was obtained for each observation (using the updated ground truth) and the predicted volume.
The average Dice coefficient for observations were used as datapoints for observation-level performance assessment. In contrast, during model-level performance evaluation assessment, the datapoints used were model performances, under specific conditions. A model’s performance was indicated by the average pooled Dice coefficient (considering each applicable observation evaluated) from the CV. The 95% confidence intervals (CI) for the Dice coefficient at the model-level were calculated using bootstrapping (5000 samples, 1000 iterations).
During univariate analysis at the model-level, model performances was compared using the Wilcoxon signed-rank test for each factor (keeping other factors fixed):
(a) model types: SAM versus MedSAM-based
(b) input image size: 256 × 256 pixels versus 512 × 512 pixels
(c) image channel composition: C1 only, C2 only, C3 only, versus C1C2C3
(d) liver observation size: >20 mm versus >10 mm
(e) certainty of HCC diagnosis: LR-4 versus LR-5 (considering the highest LI-RADS score assigned to a patient)
(f) contrast-agent types: extracellular agent versus hepatobiliary agent
During the observation-level evaluation, the paired t-test was used to compare the performances obtained using SAM (on image size 512 × 512 pixels with C1 as input) corresponding to those from the MedSAM-based models. An observation-level comparison was performed within the LR-4 and LR-5 categories using unpaired t-tests to evaluate the differences caused by contrast-agents. These analyses were all performed using Pytorch 2.0.1, scikit-learn 1.2.2, pandas 2.0.2 (python-based).
Liver observation-level multivariable analysis was conducted to model the effect of the 6 factors on segmentation. First, multiple correspondence analysis (MCA) 27 was conducted to identify the independent directions of variations as some of the factors (which were categorical) were interrelated based on the experimental set-up. Then, a generalized linear model (based on Gaussian family) was formed using the top-5 components (Dim 1, Dim 2, Dim 3, Dim 4, and Dim 5 that are orthogonal) obtained from the MCA, as independent covariates and Dice coefficient as the dependent variable. Subsequently, the significant components (P < .05) were identified. Then, the loadings of the factors on these components were noted. These analyses were performed in R Studio (2023.12.0) with the use of factomineR (version 2.9) and stats (version 4.3.2) packages (R version 4.3.2).
Results
Data and Data Partitions
A total of 485 liver observations in 129 patients were initially identified and then limited to patients with LR-4 or LR-5 observations. This reduced the effective dataset to 102 patients. Our experimental design (pixel limits on single observations per slice) reduced the valuation to a maximum of 97 patients for the prim_d and 92 patients for the sec_d. Subsets of these effective datasets were applicable to the different experimental conditions based on the selected factors under evaluation and the 20-pixel limit on the observation size, per slice (Table 1). Of the 97 patients, 27 had single observation and 71 had multiple observations. Only 1 patient had multiple scans and different (single vs 2) observations on the 2 scans. There were 77 males (mean age: 67 years, range: 45-89 years) and 20 females (mean age: 68.9 years, range: 56-85 years). The MRI scans were part of imaging work-up in patients with abnormal liver observations. The composition of channels did not affect the size of the applicable subsets as all patients had C1, C2, and C3 image sequences available. Probable and/or definite observations were noted in C1 for 44.3%, in C2 for 23.7%, in C3 for 16.5%, and in other (pre-contrast, later, or T2) for 24.7% patients.
Size of the Training and Evaluations Datasets Based on Training Condition.*
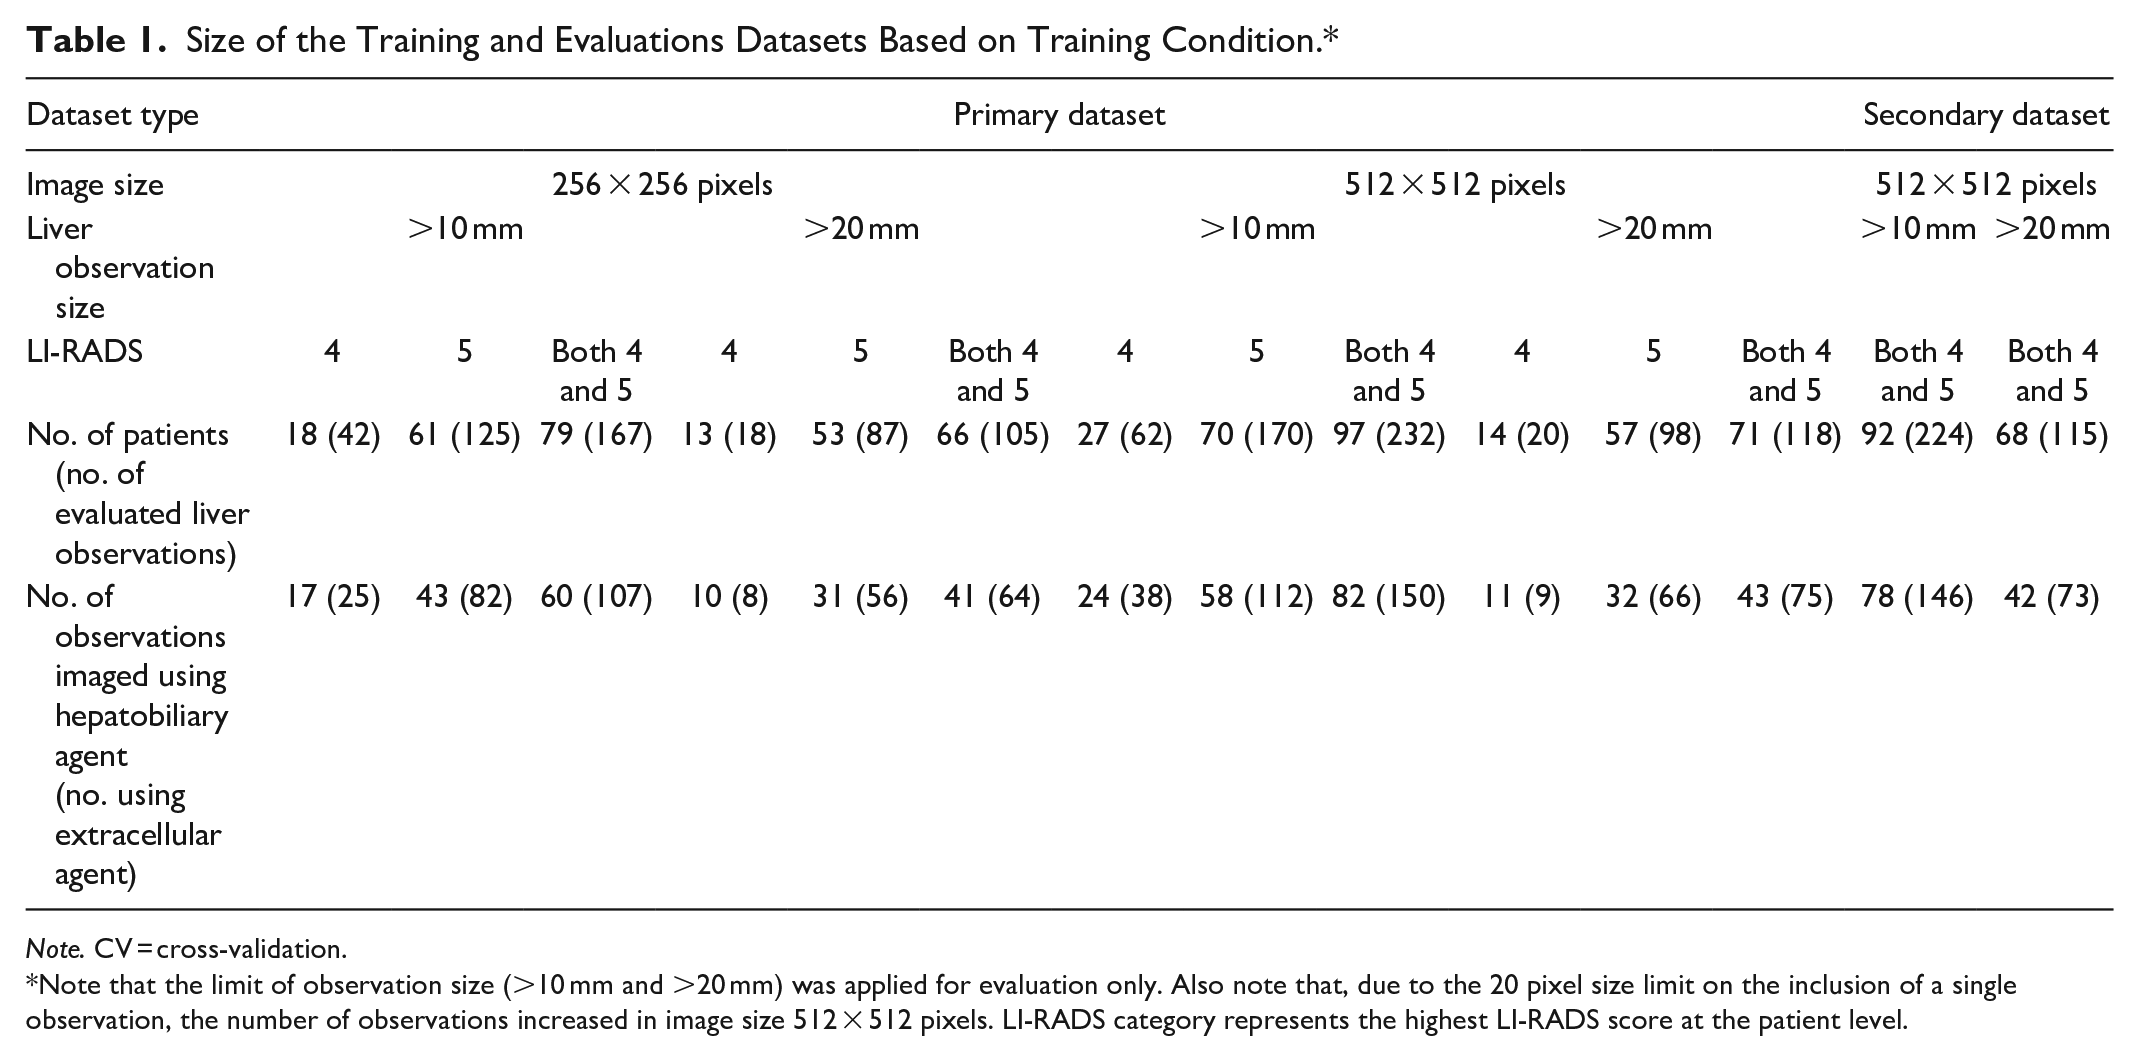
Note. CV = cross-validation.
Note that the limit of observation size (>10 mm and >20 mm) was applied for evaluation only. Also note that, due to the 20 pixel size limit on the inclusion of a single observation, the number of observations increased in image size 512 × 512 pixels. LI-RADS category represents the highest LI-RADS score at the patient level.
MedSAM-Based Trained Models
In total, 16 MedSAM-based models—8 for the prim_d and 8 for the sec_d, were trained. Models were designated by the model type, image size, image channel composition, and dataset, for example “MedSAM_256_C1_prim_d” corresponded to a MedSAM model trained using image size 256 × 256 pixels, using only input channel C1, and only images from the primary dataset. For prim_d, model training was performed using patients having LR-4 and/or LR-5 observations and both contrast-agents. Some examples of segmentation by MedSAM-based models are shown in Figure 2.
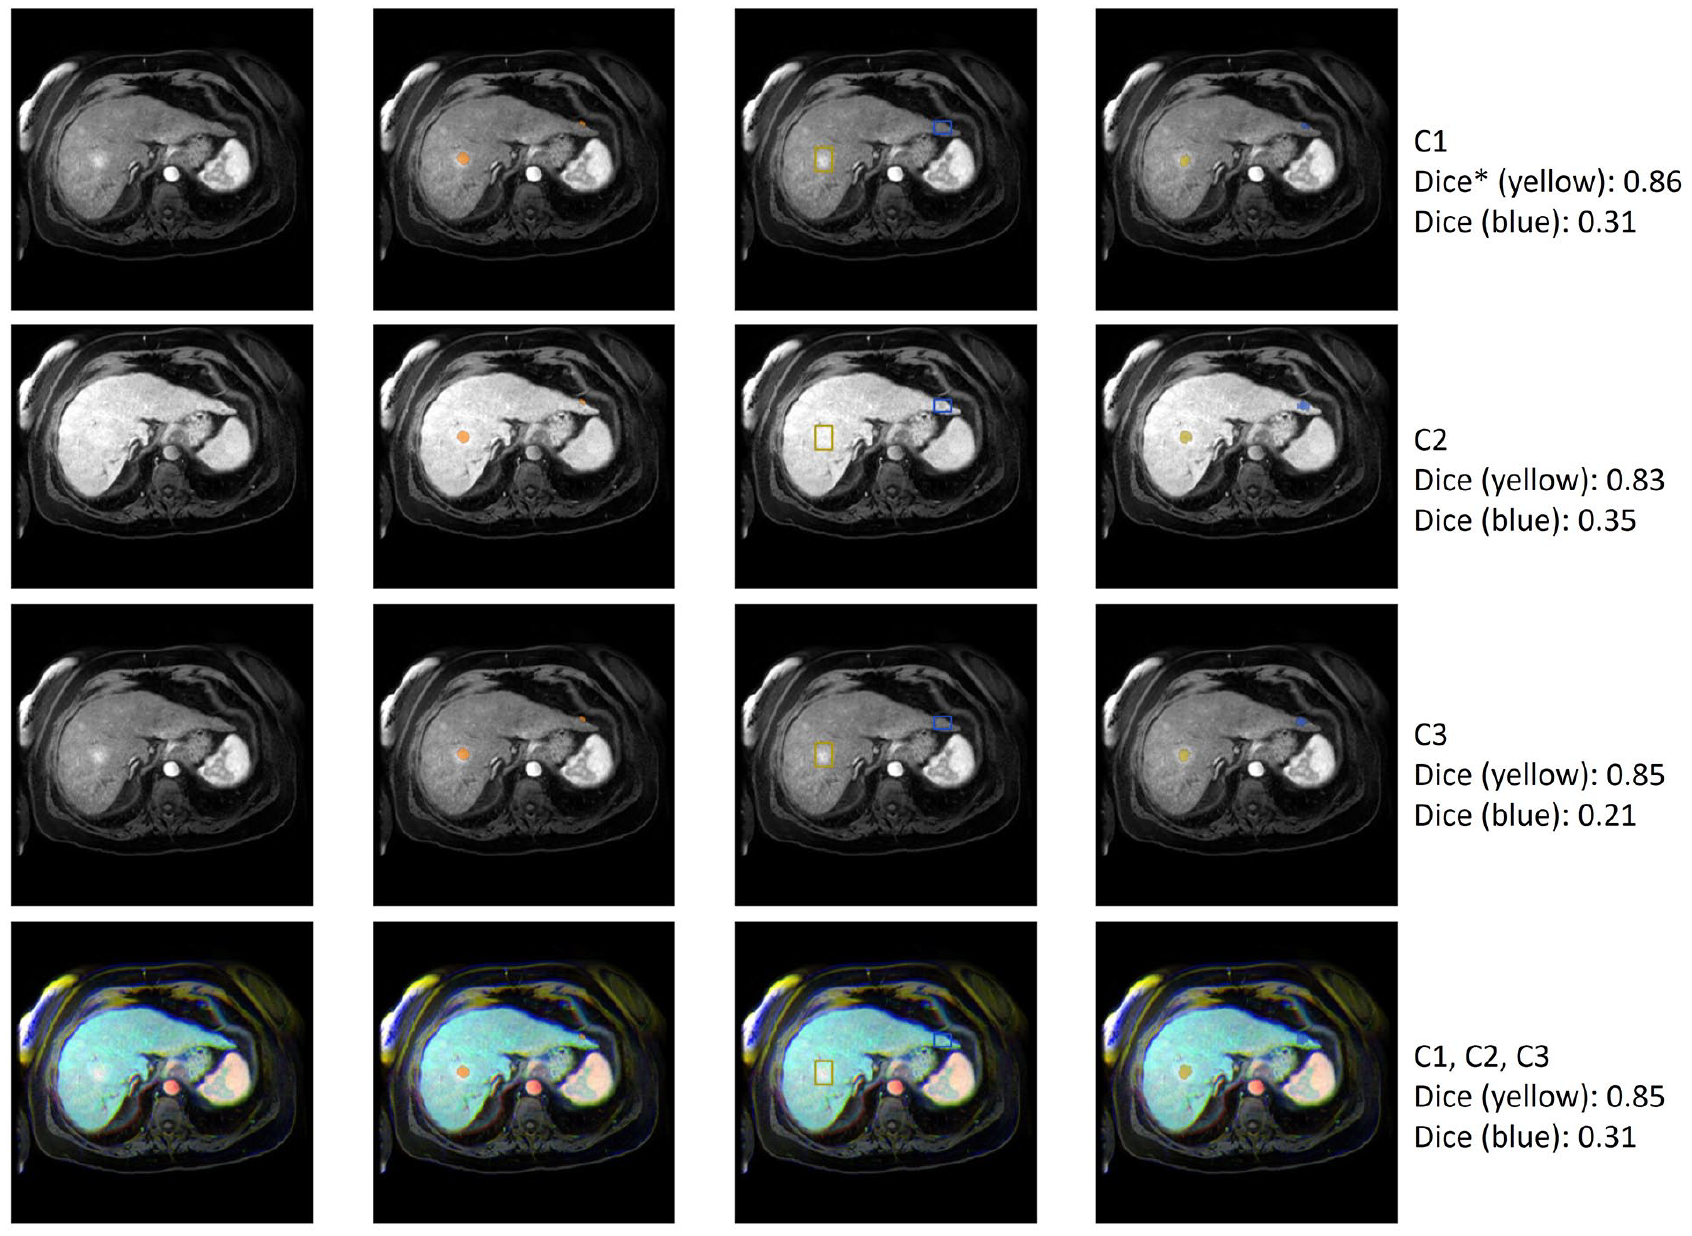
Examples of segmentations produced by MedSAM-based models. Rows indicate different input image channel compositions. The first column represents a transverse slice at different phases of contrast enhancement. The second column shows the ground truth segmentation overlaid on the image. The third column shows the prompts—yellow for an observation with good segmentation performance, blue for an observation with poor segmentation performance. The fourth column shows the predicted segmentation on the image. The fifth column describes the composition of the channel and the Dice coefficient.
Comparison of Models Based on 6 Factors at the Model-Level
Model Dice coefficients are shown in Table 2 for the primary dataset. Across all observations, MedSAM trained on 512 × 512 images using C1, C2, and C3 together as channels performed the best with mean Dice coefficient 0.68 (95% CI: 0.66-0.69). Differences in overall performance were found between SAM and MedSAM-based models (median Dice coefficient SAM: 0.36, MedSAM: 0.44, P < .001), including based on input image size (256 × 256: 0.26, 512 × 512: 0.57, P < .001), and based on input channels (C1: 0.40, C2: 0.38, C3: 40, C1C2C3: 0.40; for C2 vs C1, P = .008; C3 vs C1, P = .41; C1C2C3 vs C1, P = .15). Higher model performance was noted when observations were limited to those >20 mm compared to models including all observations >10 mm (>20 mm: 0.44, >10 mm: 0.36, P < .001). Performance also differed between models evaluating only patients with LR-4 versus LR-5 observations (LR-4: 0.31, LR-5: 0.41, P < .001) as highest score; further details are provided in the Supplemental Material (Table A1). Overall, the type of contrast-agent did not affect model performance (hepatobiliary: 0.38, extracellular: 0.39, P = .098). Model performance varied the most based on input image size (119%) compared to other variables.
Mean Dice Coefficient and 95% Confidence Interval (CI) for Liver Observations Using the Primary Dataset at Model-Level.
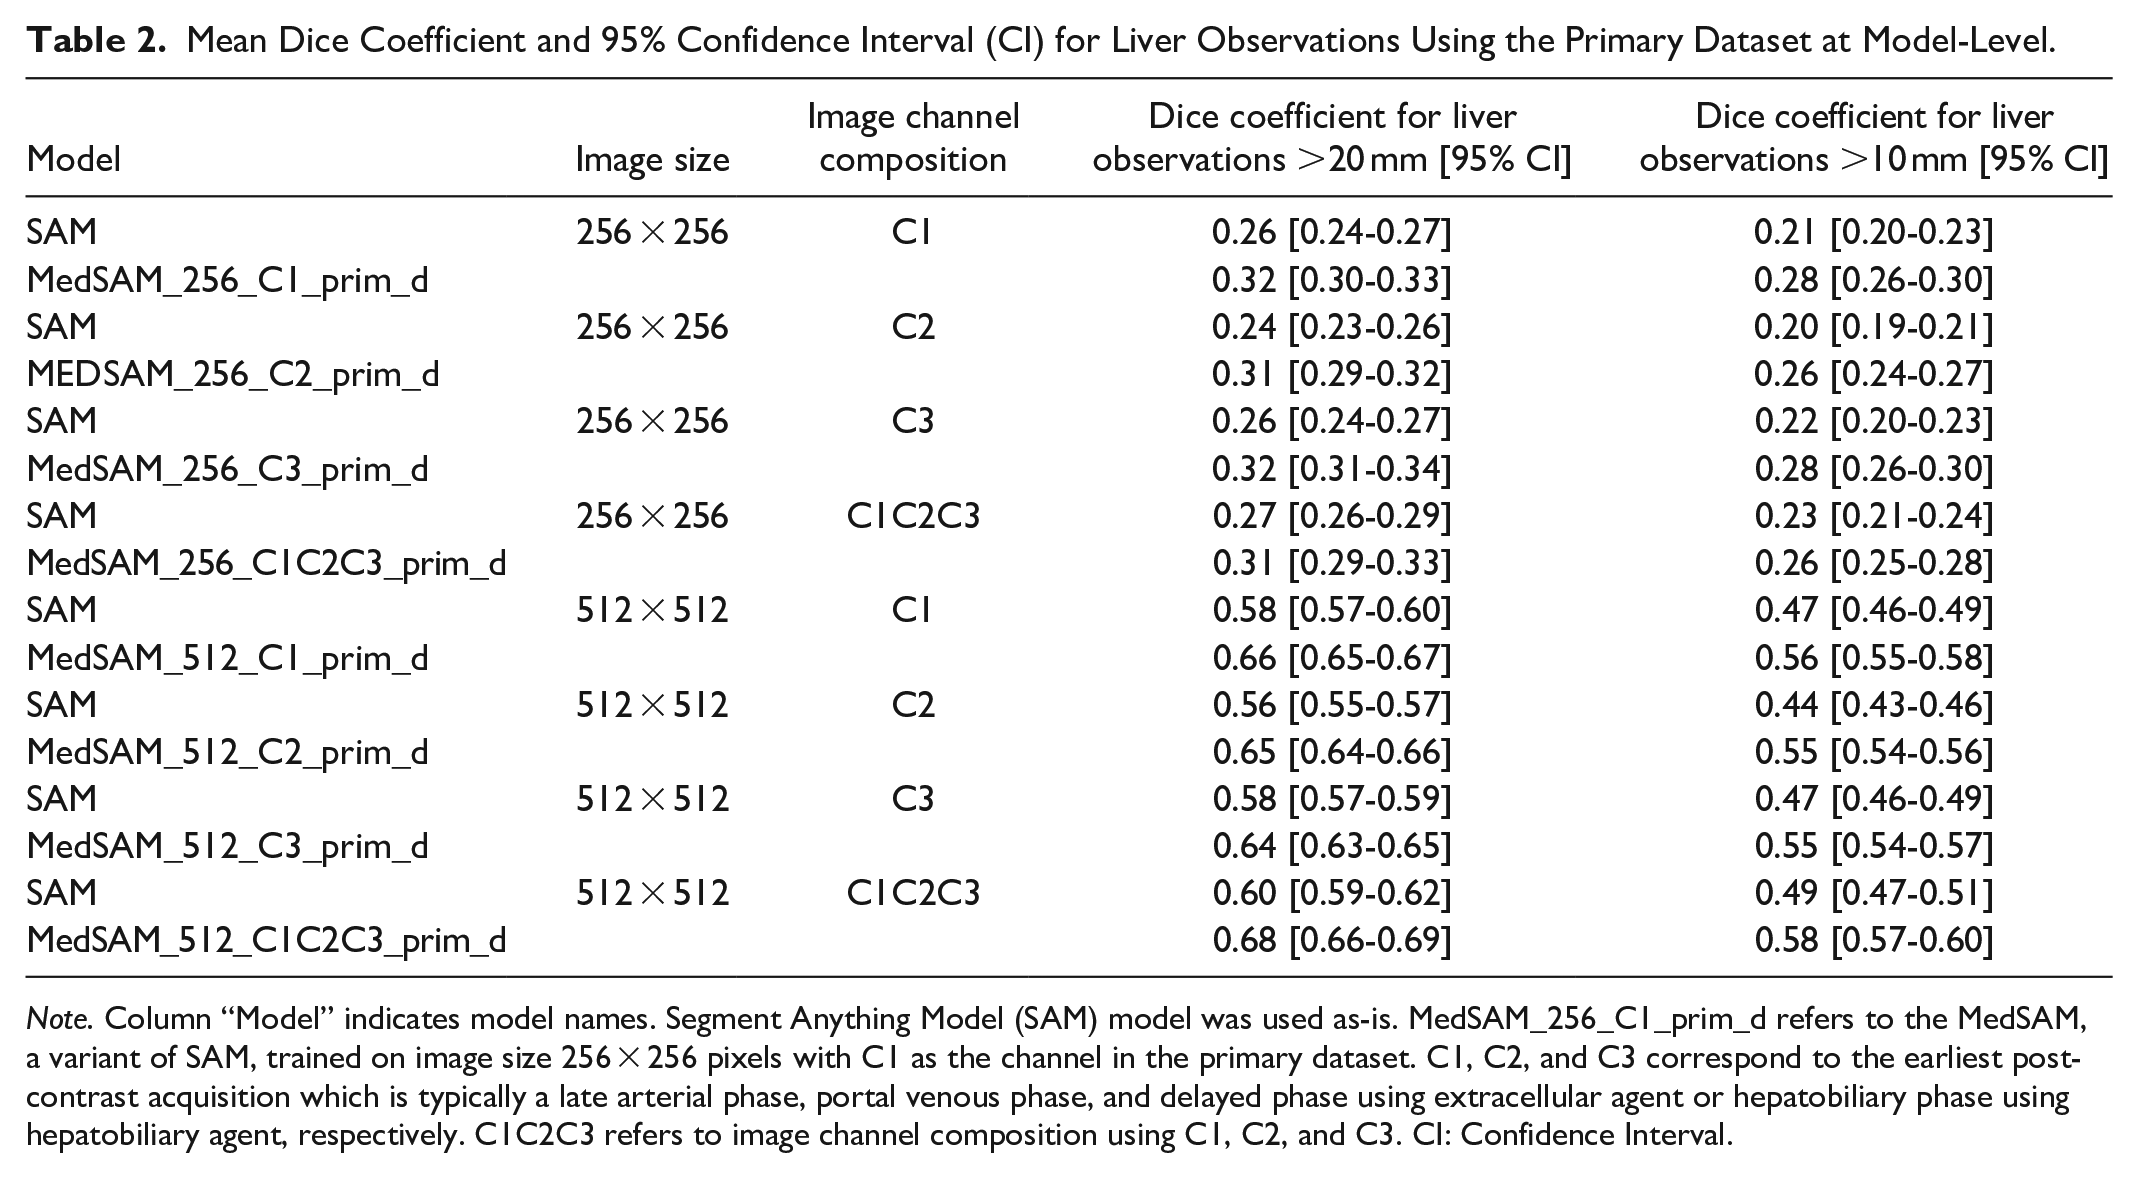
Note. Column “Model” indicates model names. Segment Anything Model (SAM) model was used as-is. MedSAM_256_C1_prim_d refers to the MedSAM, a variant of SAM, trained on image size 256 × 256 pixels with C1 as the channel in the primary dataset. C1, C2, and C3 correspond to the earliest post-contrast acquisition which is typically a late arterial phase, portal venous phase, and delayed phase using extracellular agent or hepatobiliary phase using hepatobiliary agent, respectively. C1C2C3 refers to image channel composition using C1, C2, and C3. CI: Confidence Interval.
The performance of SAM and MedSAM in the secondary dataset was not better than that for the primary dataset (results provided in the Supplemental Material, Table A2).
Effect of Model Type and Contrast Within Specific LI-RADS Categories at the Observation-Level
While using input images sized 512 × 512 pixels, all MedSAM and SAM-based models evaluated using input channel composition C1, C2, C3 performed better than SAM evaluated using C1 only as an input for observation size >20 mm and >10 mm (Table 3).
P-Values at the Observation-Level Comparison Using T-Test for MedSAM-Based Models’ Performance Versus SAM and for Contrast-Agent Type in Patients With LR-4 and LR-5 Observations.
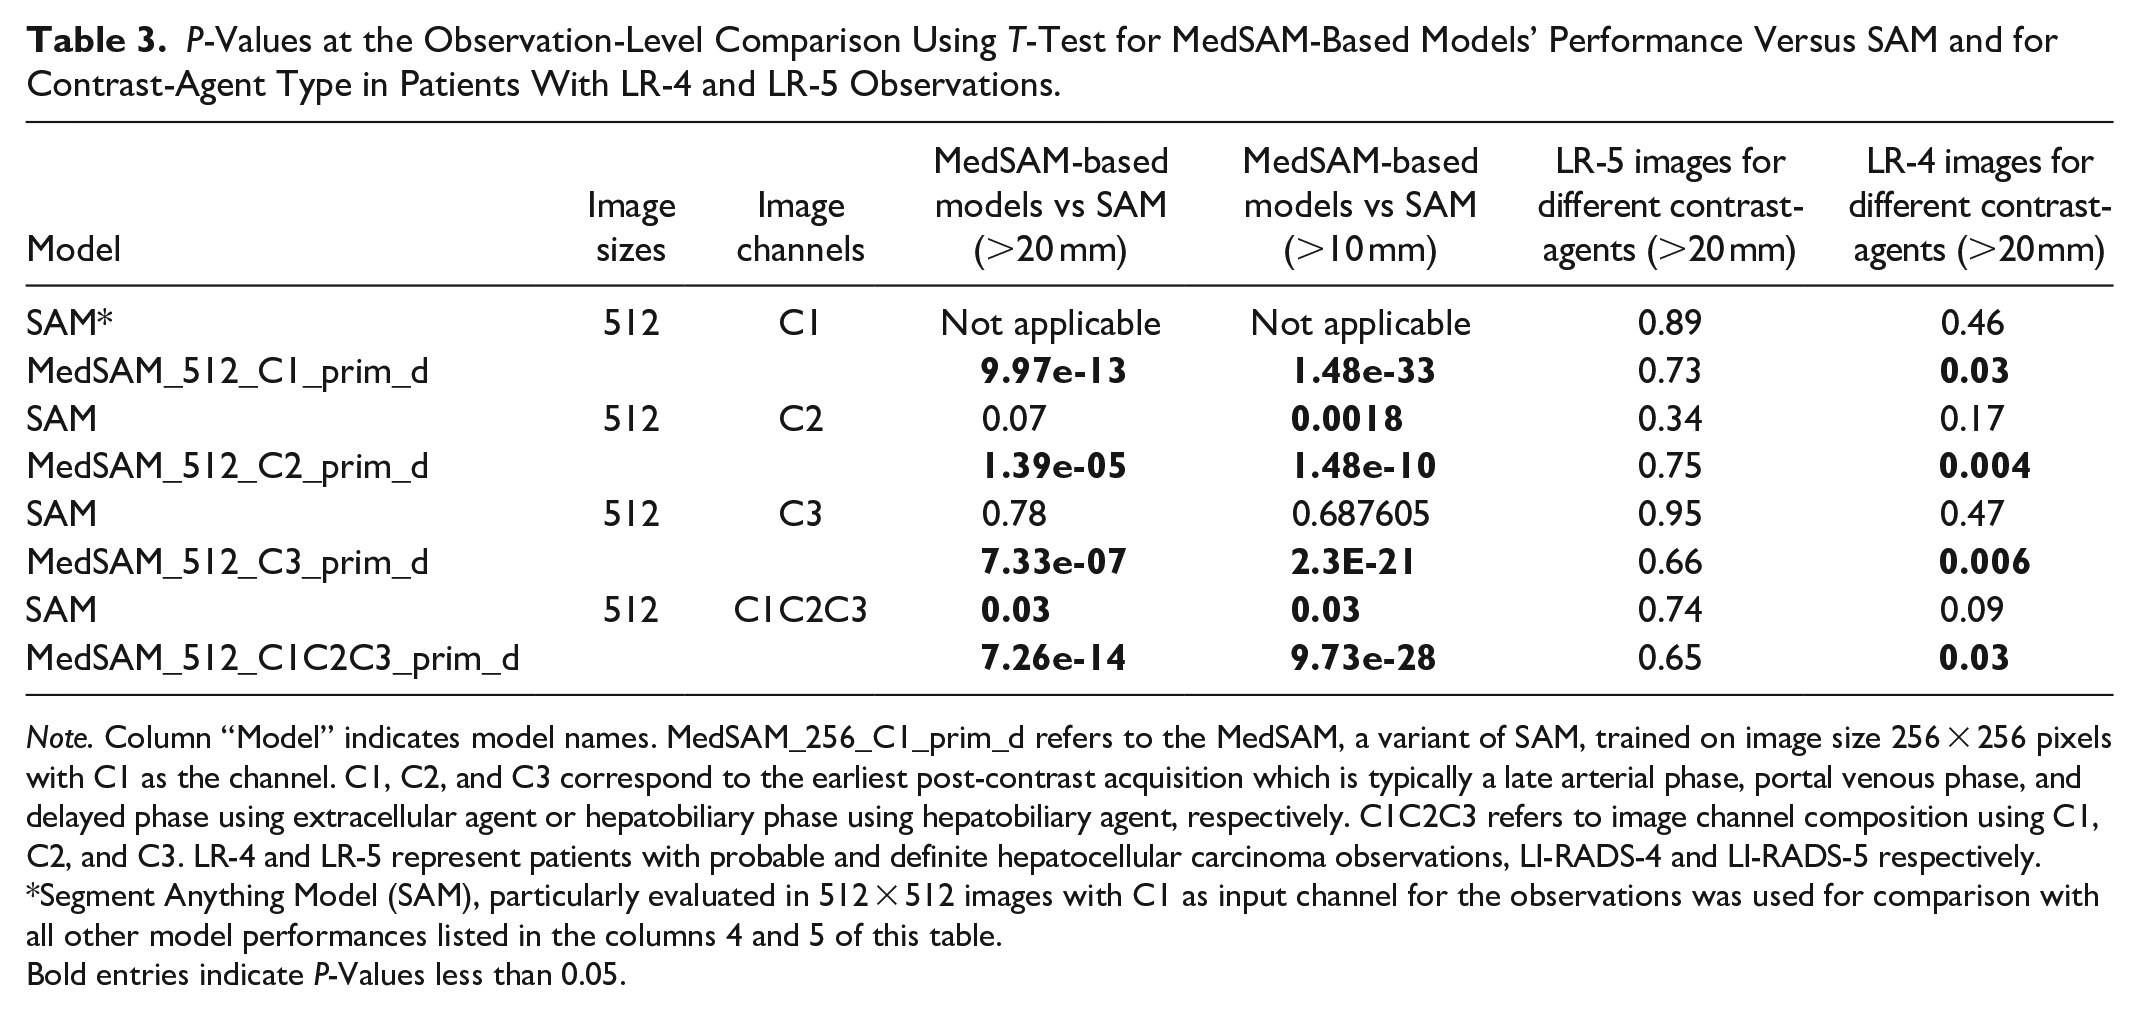
Note. Column “Model” indicates model names. MedSAM_256_C1_prim_d refers to the MedSAM, a variant of SAM, trained on image size 256 × 256 pixels with C1 as the channel. C1, C2, and C3 correspond to the earliest post-contrast acquisition which is typically a late arterial phase, portal venous phase, and delayed phase using extracellular agent or hepatobiliary phase using hepatobiliary agent, respectively. C1C2C3 refers to image channel composition using C1, C2, and C3. LR-4 and LR-5 represent patients with probable and definite hepatocellular carcinoma observations, LI-RADS-4 and LI-RADS-5 respectively.
Segment Anything Model (SAM), particularly evaluated in 512 × 512 images with C1 as input channel for the observations was used for comparison with all other model performances listed in the columns 4 and 5 of this table.
Bold entries indicate P-Values less than 0.05.
For LR-5, the type of contrast-agent did not affect performance (Table 3). For LR-4, performance with hepatobiliary contrast-agent was better than for extracellular contrast-agent for each of the 4 MedSAM-based models trained on 512 × 512 images using observations >20 mm in size (Table 3) and 3 models (MedSAM_512_C2_prim_d, MedSAM_512_C3_prim_d, and MedSAM_512_C1C2C3_prim_d) considering observation size >10 mm.
MedSAM’s performance in images with single observation (0.67) was better (P = .0167) than those in images with multiple observations (0.57), considering image size of 512 × 512 pixels.
In the secondary dataset, for observations >20 mm and >10 mm, MedSAM-based models (P < .0005 for each such model) performed better than SAM using 512 × 512 sized-images and the C1 channel in this dataset.
Multivariable Analysis at the Observation-Level
The linear modelling identified one significant component from the top-5 components, obtained from MCA, associated with the Dice coefficient. This component had 16% (highest) of the variance with high loadings of size of observations, LI-RADS, and input image size (see Figure 3).
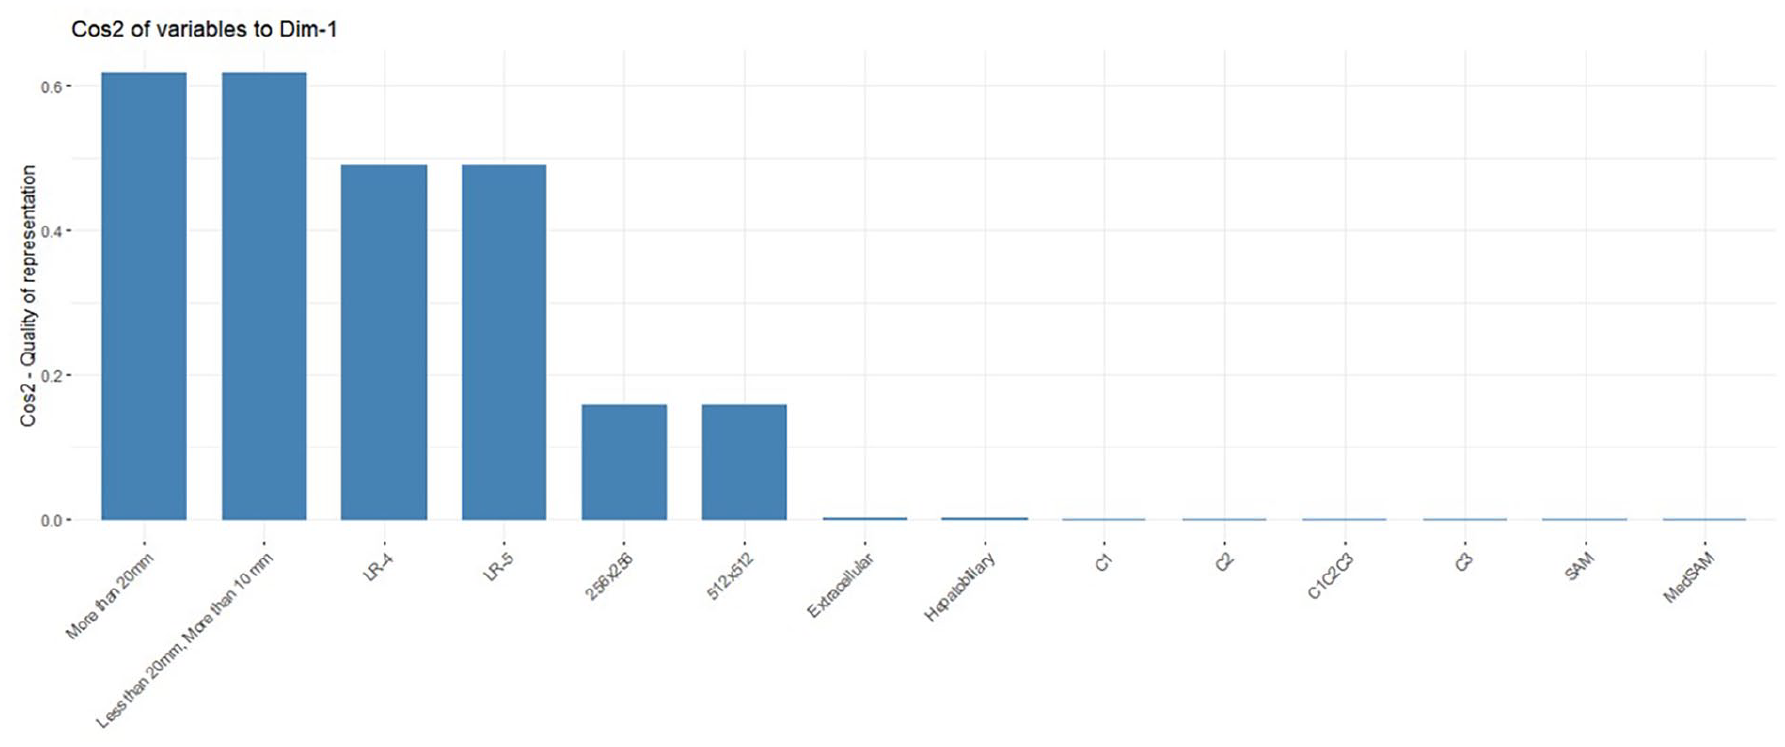
Quality of representation (cosine) of the factors on the component (Dim-1), obtained from the multiple correspondence analysis, that was significantly associated with segmentation performance. In this figure, liver observation size (>20 mm and <20 mm, >10 mm), certainty of diagnosis (LI-RADS-4/LR-4 and LI-RADS-5/LR-5), image size (256 × 256 and 512 × 512 pixels), contrast-agent type (extracellular and hepatobiliary), channel composition (C1, C2, and C3-corresponds to the earliest post-contrast acquisition which is typically a late arterial phase, portal venous phase, and delayed phase) and model type (SAM and MedSAM) are shown.
Discussion
In this study of liver observations (232 observations for size 512 × 512) in 97 high-risk patients, a variety of factors were found to considerably impact SAM and MedSAM model performance for segmenting probable and definite HCC on CE-MRI. We found large differences in the performance of both SAM and MedSAM based on input image size. Performance on 512 × 512 pixel input images was 119% better than for 256 × 256 pixel images. It may seem that the explicit training of MedSAM on 512 × 512 images could explain this improvement; however, MedSAM was also trained for different image channel compositions which led to a maximum improvement of only 5%. Furthermore, the performance improvement based on input image size was seen for both liver observations >10 mm and >20 mm, and the multivariable analysis also suggested the importance of the size of observation. The performance of SAM and MedSAM were affected to a lesser extent by the image channel composition. On average, the performance using multiple channels was better than using any single channel. This is perhaps not surprising as clinicians also review multiple sequences when determining which best demonstrates a liver observation’s margin.
Performance in patients with LR-5 observations was better than for LR-4. While contrast-agent type did not impact the performance in patients with LR-5 observations, the performance in patients with LR-4 observations was better using hepatobiliary contrast-agent. Furthermore, during the observation-level evaluation, each MedSAM-based model performed better when matched with its counterpart through SAM. Our evaluation that was limited to patients with observations with at least one major feature using the secondary dataset, which would generally be more apparent relative to background liver parenchyma, did not show overall improved SAM or MedSAM performance.
Prompt-based liver observation segmentation on MRI had not previously been studied. However, observation segmentation on liver MRI has received limited attention. Bousabarah et al. 14 obtained a mean Dice coefficient of 0.68 using HCC lesions combining 3 postcontrast sequences using a U-Net on 174 patients, with 15% in the test set. A Dice coefficient of 0.84 was obtained by Zhao et al. using 255 patients with hemangiomas and HCC, 5-fold CV, and multiphase CE-MRI. 13 Using the hepatobiliary phase, Chlebus et al. 28 achieved a mean Dice coefficient of 0.65 for segmenting liver metastases using 2D-U-Net in 20 test patients. A carefully selected threshold provided a mean Dice coefficient of 0.7 for segmenting liver observations in a study by Wang et al. 9 using U-Net++ and a convolutional block attention module in 111 patients with 174 liver observations and 9-fold CV. Liver cancers were segmented with Dice coefficient 0.78 using multisequence MRI in 58 patients using 523 images and CV by Zhang et al. 10 Hänsch et al. 8 achieved a Dice coefficient of 0.74 for segmenting liver cancers in delayed phase MRI using 3D U-Net and a multimodal training strategy in 19 test patients. Hillie et al. 11 achieved a Dice coefficient of 0.82 for hepatic observation segmentation on non-contrast MRI in 48 patients with 157 hepatic observations using 7-fold CV. Our cohort is the most similar to Wang et al. 9 who segmented liver observations (LR-3, 4, and 5), and we had comparable model performance. In an extensive evaluation of several advanced deep learning architectures for HCC tumour segmentation, 6 nnUnet and nnFormer architectures demonstrated a Dice coefficient of less than 70% after a following a thorough optimization process for performance improvement. A more direct comparison with the approaches in literature could not be performed due to the heterogeneity of the target conditions studied, image sequences used, evaluation schemes (CV vs test sets), and segmentation mechanism (ours: prompt-based, others: non-prompted).
Limitations of this study include the retrospective use of data from a single centre and the dataset size. However, the size of our dataset is comparable to other studies investigating segmentation of liver observations on MRI. External validation was not performed. However, each liver observation was prompted 3 times using different bounding boxes to obtain a better estimate of the segmentation performance. Also, a 5-fold CV was performed to calculate a reasonable performance estimate. Though we trained models based on input image size and channel composition, we did not specifically train models based on certainty of diagnosis, contrast-agent type, or observation size as this would have reduced the size of the respective training sets. However, we conducted multivariable analysis to account for these effects.
In conclusion, of the factors studied, all but contrast-agent type resulted in segmentation model performance differences, with liver observation size, input image size, and certainty of HCC diagnosis contributing more than other factors toward model performance. Performance difference was observed for only patients with LR-4 liver observations and for input image size 512 × 512 pixels with respect to the contrast-agent type. Further studies are needed to improve segmentation of liver observation on MRI through prompting such that foundational models can be suitably adapted to assist in preparing ground truth segmentations as well as speeding up the interpretation of liver lesions using imaging characteristics.
Supplemental Material
sj-docx-1-caj-10.1177_08465371241250215 – Supplemental material for Liver Observation Segmentation on Contrast-Enhanced MRI: SAM and MedSAM Performance in Patients With Probable or Definite Hepatocellular Carcinoma
Supplemental material, sj-docx-1-caj-10.1177_08465371241250215 for Liver Observation Segmentation on Contrast-Enhanced MRI: SAM and MedSAM Performance in Patients With Probable or Definite Hepatocellular Carcinoma by Ashirbani Saha and Christian B. van der Pol in Canadian Association of Radiologists Journal
Footnotes
Acknowledgements
The authors acknowledge the CentRE for dAta science and digiTal hEalth (CREATE) Team from Hamilton Health Sciences for providing a high-performance computing platform and storage which was necessary for conducting the experiments. The authors thank Dr. Umaseh Sivanesan for providing necessary guidance and codes for registering the sequences, and Drs. Melanie Ferri, Yoan K. Kagoma, Stefanie Y. Lee, Janakan Satkunasingham, Josephine Wat, and Scott Tsai for generating the LI-RADS category ground truth labels.
Declaration of Conflicting Interests
The author(s) declared no potential conflicts of interest with respect to the research, authorship, and/or publication of this article.
Funding
The author(s) received no financial support for the research, authorship, and/or publication of this article.
Supplemental Material
Supplemental material for this article is available online.
References
Supplementary Material
Please find the following supplemental material available below.
For Open Access articles published under a Creative Commons License, all supplemental material carries the same license as the article it is associated with.
For non-Open Access articles published, all supplemental material carries a non-exclusive license, and permission requests for re-use of supplemental material or any part of supplemental material shall be sent directly to the copyright owner as specified in the copyright notice associated with the article.