
Abstract
Background:
Multi-detector contrast-enhanced abdominal computed tomography (CT) allows for the accurate detection and classification of traumatic splenic injuries, leading to improved patient management. Their effective use requires rapid study interpretation, which can be a challenge on busy emergency radiology services. A machine learning system has the potential to automate the process, potentially leading to a faster clinical response. This study aimed to create such a system.
Method:
Using the American Association for the Surgery of Trauma (AAST), spleen injuries were classified into 3 classes: normal, low-grade (AAST grade I-III) injuries, and high-grade (AAST grade IV and V) injuries. Employing a 2-stage machine learning strategy, spleens were initially segmented from input CT images and subsequently underwent classification via a 3D dense convolutional neural network (DenseNet).
Results:
This single-centre retrospective study involved trauma protocol CT scans performed between January 1, 2005, and July 31, 2021, totaling 608 scans with splenic injuries and 608 without. Five board-certified fellowship-trained abdominal radiologists utilizing the AAST injury scoring scale established ground truth labels. The model achieved AUC values of 0.84, 0.69, and 0.90 for normal, low-grade injuries, and high-grade splenic injuries, respectively.
Conclusions:
Our findings demonstrate the feasibility of automating spleen injury detection using our method with potential applications in improving patient care through radiologist worklist prioritization and injury stratification. Future endeavours should concentrate on further enhancing and optimizing our approach and testing its use in a real-world clinical environment.
This is a visual representation of the abstract.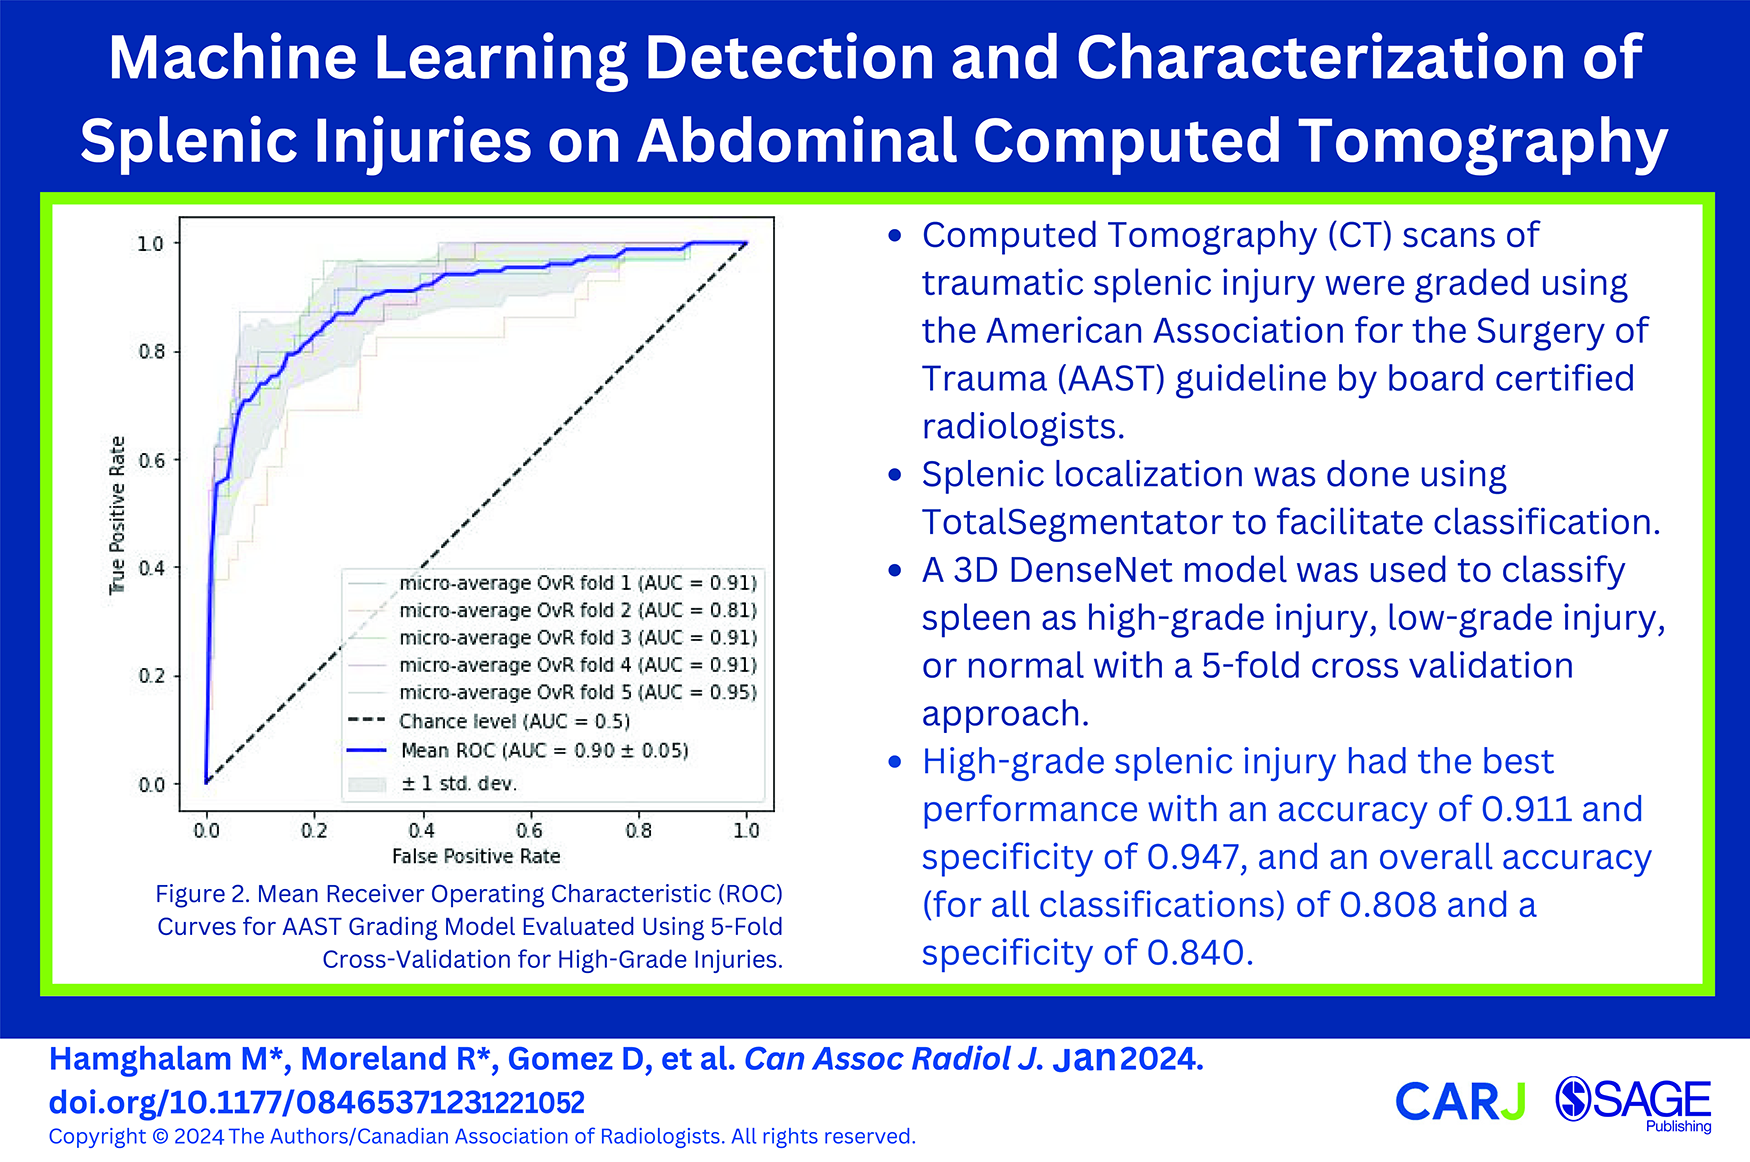
Introduction
The spleen is the most commonly injured solid abdominal organ in blunt force trauma, with injuries having the potential to cause serious internal hemorrhage. Multi-detector contrast-enhanced computed tomography (CT) is the best practice-imaging tool for both accurate detection and subsequent classification of solid organ traumatic injuries, including those of the spleen. 1 Splenic trauma is commonly graded using the American Association for the Surgery of Trauma (AAST) splenic injury scale, which in combination with the hemodynamic status of the patient guides subsequent management steps that can range from conservative management to surgical interventions.2-9 Their effective use requires rapid CT study interpretation, which can be a challenge on busy emergency radiology services, centres with limited after-hours access to radiology expertise, or during complex trauma cases. Furthermore, the increasingly common model of radiologists remotely covering multiple sites during after-hour coverage can add additional problems in triaging studies. These challenges can often delay study interpretation and subsequent patient care.
A machine learning (ML) system has the potential to automate the process of splenic injury detection and grading on CT imaging, leading to a faster clinical response and potentially improved outcomes. It would also allow cases to be prioritized for interpretation when injury is suspected. Our study presents a novel ML system for the automated detection and characterization of such injuries on split-bolus single-pass contrast-enhanced CT scans encompassing the chest, abdomen, and pelvis.
Methods
Data Cohort
This retrospective study was approved by the St. Michael’s Hospital Research Ethics Review Board with a waiver of informed consent. Our radiology information system (Syngo, Siemens Medical Solutions USA, Inc., Malvern, PA) was searched for trauma protocol CT scans of the chest, abdomen, and pelvis that were performed after a trauma team activation between January 1, 2005, and July 31, 2021 using Nuance mPower (Nuance Communications, Burlington, MA). Patients under 18 years of age and those having undergone recent laparotomy were excluded. All CT examinations were performed on a 64-slice multi-detector CT (MDCT) scanner (Revolution, LightSpeed 64, or Optima 64, General Electric Medical Systems, Milwaukee, WI, U.S.) using a split-bolus single-pass technique. Our split-bolus protocol consists of 85 cc of Visipaque 320 administered at 3 cc/s followed by 40 cc of normal saline at 2 cc/s, an injector delay of 25 seconds, and 45 cc of Visipaque 320 at 4 cc/s. Oral and rectal contrast are not routinely administered as part of the protocol.
A total of 9307 reports were manually reviewed by a board-certified, fellowship trained abdominal radiologist and classified as positive or negative for a splenic injury. Equivocal reports were considered positive during the report review. The positive and an equal number of randomly selected negative CT examinations were downloaded in Digital Imaging and Communications in Medicine (DICOM) format from the Picture Archiving and Communications System (Carestream PACS, Carestream Health, Rochester, New York) using RSNA Anonymizer (Oak Brook, IL). The relevant soft tissue window images in axial, coronal, and sagittal planes were extracted using a Python script and de-identified by RSNA Anonymizer. Axial images were 3 mm slice thickness while the coronal and sagittal series were reconstructed at 5 mm. Each CT examination was independently graded in accordance with the AAST splenic injury scoring scale by 5 blinded fellowship-trained abdominal radiologists using a web-based annotation platform (MD.ai, New York, NY). Due to generally poor interobserver agreement in the grading of splenic injuries10-12 and typical clinical practice patterns, AAST I-III injuries were grouped together as low-grade injuries while AAST IV and V were considered high-grade injuries. A majority vote was used to determine the AAST injury grade (low vs high) for each CT scan. Examinations were flagged for removal during radiologist review due to suboptimal image quality, absence of intravenous contrast, recent laparotomy, equivocal report with no injury on image review, and incomplete imaging of the abdomen and pelvis. The negative CT scans were also reviewed by a radiologist to ensure the absence of splenic injuries.
The final dataset was comprised of 608 positive cases (172 female, 438 male; age range 18-97 years; mean age 44.4 ± 19.9 years) and 608 negative cases (154 female, 456 male; age range 18-103 years; mean age 46.6 ± 19.5 years). The positive CT scans consisted of 455 low and 153 high-grade splenic injuries. No patient was represented more than once in the dataset. Only axial CT images were used for model development and validation.
Spleen Localization
In order to facilitate splenic injury detection and grading, the spleen was initially segmented using TotalSegmentator, an open-source multi-organ segmentation system which includes the spleen in its target organs. 13 As the segmentation of injured spleens is challenging due to indistinct boundaries and anatomical disruption, the initial splenic segmentation underwent expansion via three-dimensional binary dilation. This mathematical operation gradually increased the region of interest by including adjacent voxels (3 × 3 × 3) based on their intensity values, which helps bridge parenchymal discontinuity and provides a more comprehensive representation of overall splenic shape and structure. Following one iteration of binary dilation, gap-filling procedures were applied where the missing information within the expanded spleen region was interpolated by using neighbouring pixel information to reconstruct the splenic contour. The spleen is then isolated by cropping and masking it using the largest connected component from the segmentation map obtained from input CT volumes. This segmentation process forms the basis for the subsequent tasks of injury detection and grading. A qualitative review process was undertaken by a fellowship-trained abdominal radiologist to ensure each segmentation covered the spleen through visual inspection.
Splenic Injury Detection and Grading
A 3D DenseNet model was used to classify spleens as normal, low-grade injuries, and high-grade injuries. DenseNet121 with a spatial dimension of 3 and 128 filters in the initial convolution layer was used. An Adam optimizer with a learning rate of 0.0001 was used to optimize the cross-entropy loss between model predictions and ground truth labels. A supervised learning approach was used with 1000 epochs of training on labeled data (n = 973) comprising images of both normal and injured spleens. Model accuracy and balanced accuracy were evaluated on the validation set (n = 243) after each epoch. Class imbalance within our dataset classes led us to adopt balanced accuracy for the 5 - fold cross-validation process. A 5-fold cross-validation approach allows for more thorough validation across different subsets of the dataset, effectively minimizing the impact of variability. Addressing the dataset’s inherent class imbalance with 608 normal spleens, 455 low-grade injuries, and 153 high-grade injuries, we implemented weighted sampling to mitigate this challenge. This approach helps ensure that the model encounters each class roughly an equal number of times, effectively remedying the data imbalance. Weighted sampling has demonstrated its efficacy in managing imbalanced data and is widely regarded as beneficial across various machine-learning tasks. 14
To standardize input data, the entire input volume underwent intensity scaling from the range [−175, 250] to [0, 1] through clipping. To address concerns related to potential overfitting, we implemented a comprehensive set of data augmentation techniques during the model training process. Images were rotated with a 10% probability, introducing variations by potentially returning a 90-degree rotated array in the axial plane. Mirroring along each axis occurred with a 10% probability. A 50% probability of zooming was applied, with a minimum zoom factor of 0.9 and a maximum zoom factor of 1.1, allowing for different scales in the training images. Gamma values were randomly selected from the range (0.5, 4.5), providing flexibility in adjusting image contrast. A nonlinear transformation of the image’s intensity histogram was performed with a 50% probability, enhancing the model’s ability to capture variations in image contrast. Random intensity shifts with a 50% probability, including offsets ranging from −0.1 to +0.1, were applied to further augment the dataset.
The input patch size was defined as 128 × 128 × 48, managed with a batch size of 48. Our 2-stage framework was developed using PyTorch and a 24 GB NVIDIA GeForce RTX 3090 GPU. The training duration for the splenic injury detection and grading lasted approximately 5 hours (Figure 1).
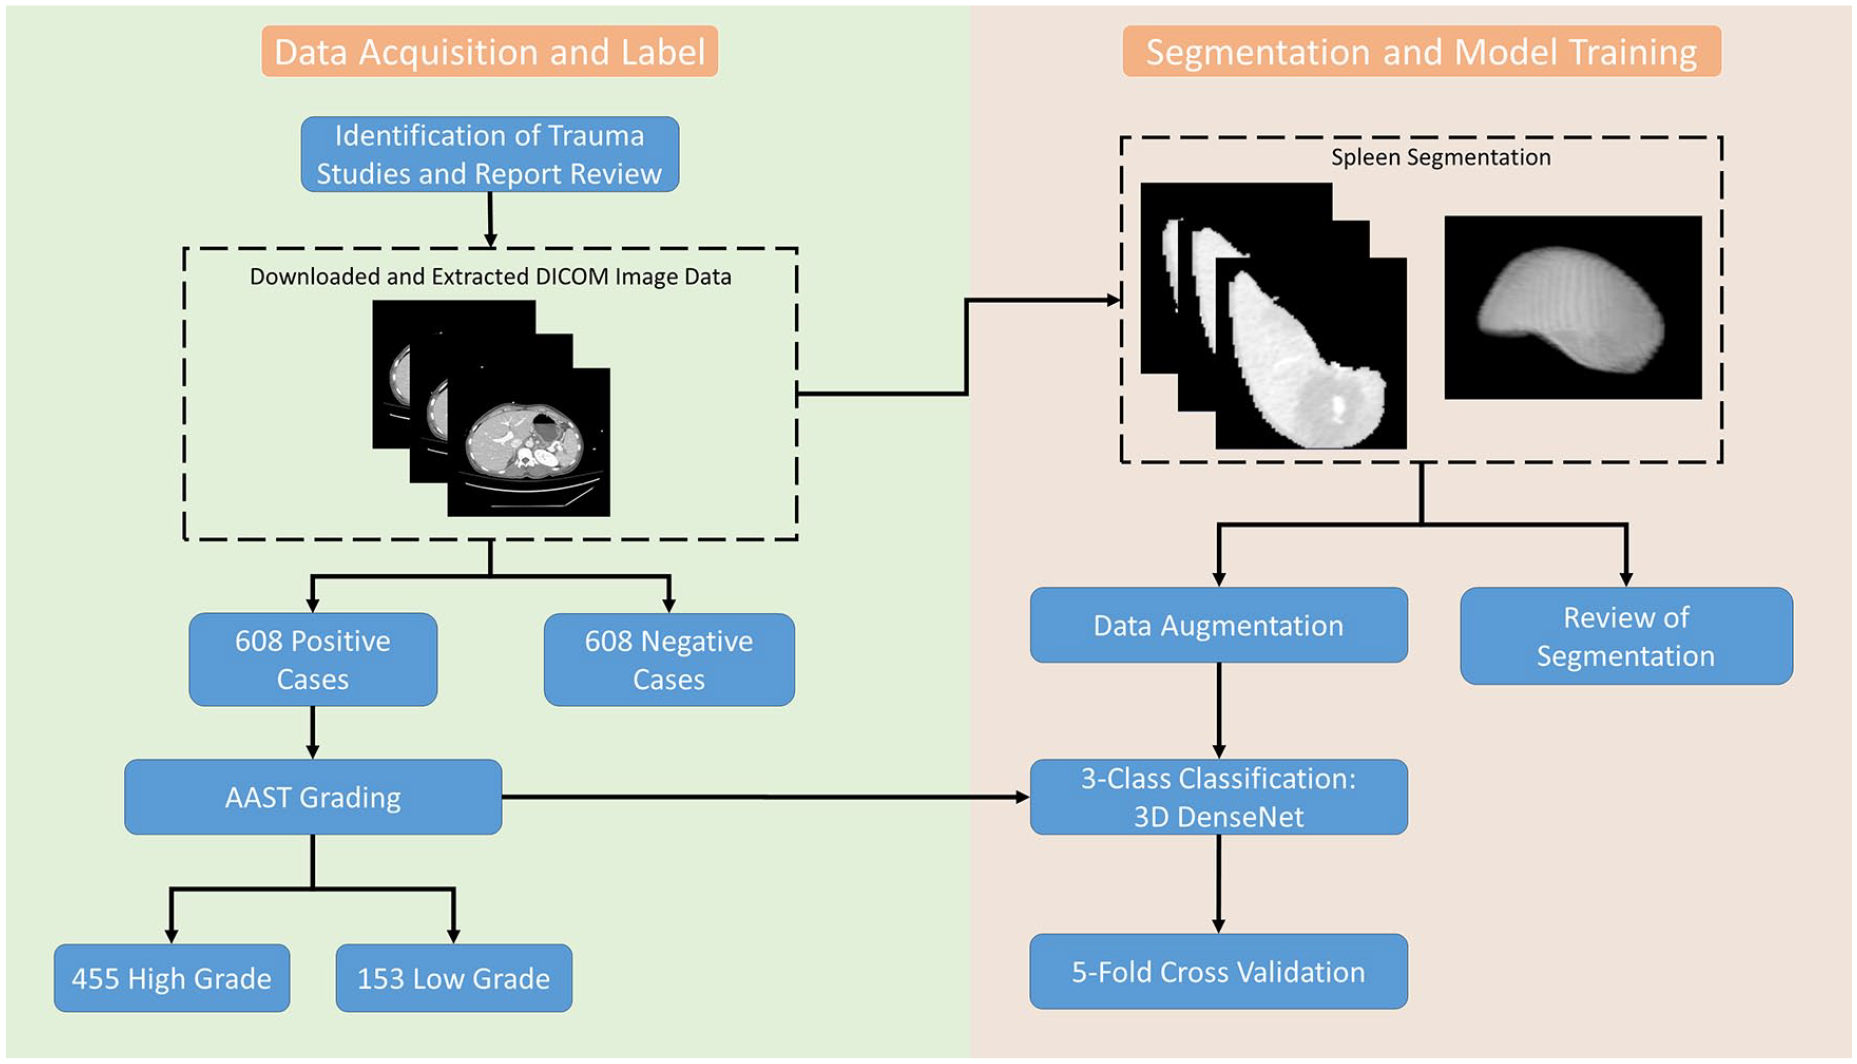
Summary flowchart of study design outlining data curation, annotation, data pre-processing, and model training.
Statistical Analysis
Statistical analysis was performed using 5-fold cross validation. This approach allows for a more robust estimate of model performance by averaging results over multiple folds and tests whether model performance is consistent across different subsets. A confusion matrix was constructed to determine the accuracy, sensitivity, specificity, positive predictive value, and negative predictive value of model classification. In addition, receiver operating characteristic (ROC) and area under the ROC (AUC) curves were used to evaluate model performance. Misclassified scans were reviewed by a board-certified radiologist to determine common themes among misclassified cases.
Results
The validity of the splenic localization system was confirmed by visual inspection of the resultant segmentation following the three-dimensional binary dilation stage.
The classifier performance of the model is summarized in Table 1. The model demonstrated the highest accuracy (0.911 ± 0.023), specificity (0.947 ± 0.018), and negative predictive value (0.952 ± 0.018) with high-grade injuries. ROC curves were generated using micro-averaging as this approach accounts for the uneven distribution of classes in our dataset. The area under the receiver operator curve was highest for high-grade injuries (0.90 ± 0.05) and lowest for low-grade injuries (0.69 ± 0.04) (Figure 2). The model achieved a micro-average AUC of 0.84 ± 0.01. The low standard deviation of 0.01 underscores the model’s consistency across the 5 validation folds.
Classification Metrics for Normal, Low-Grade Injuries, and High-Grade Injuries.
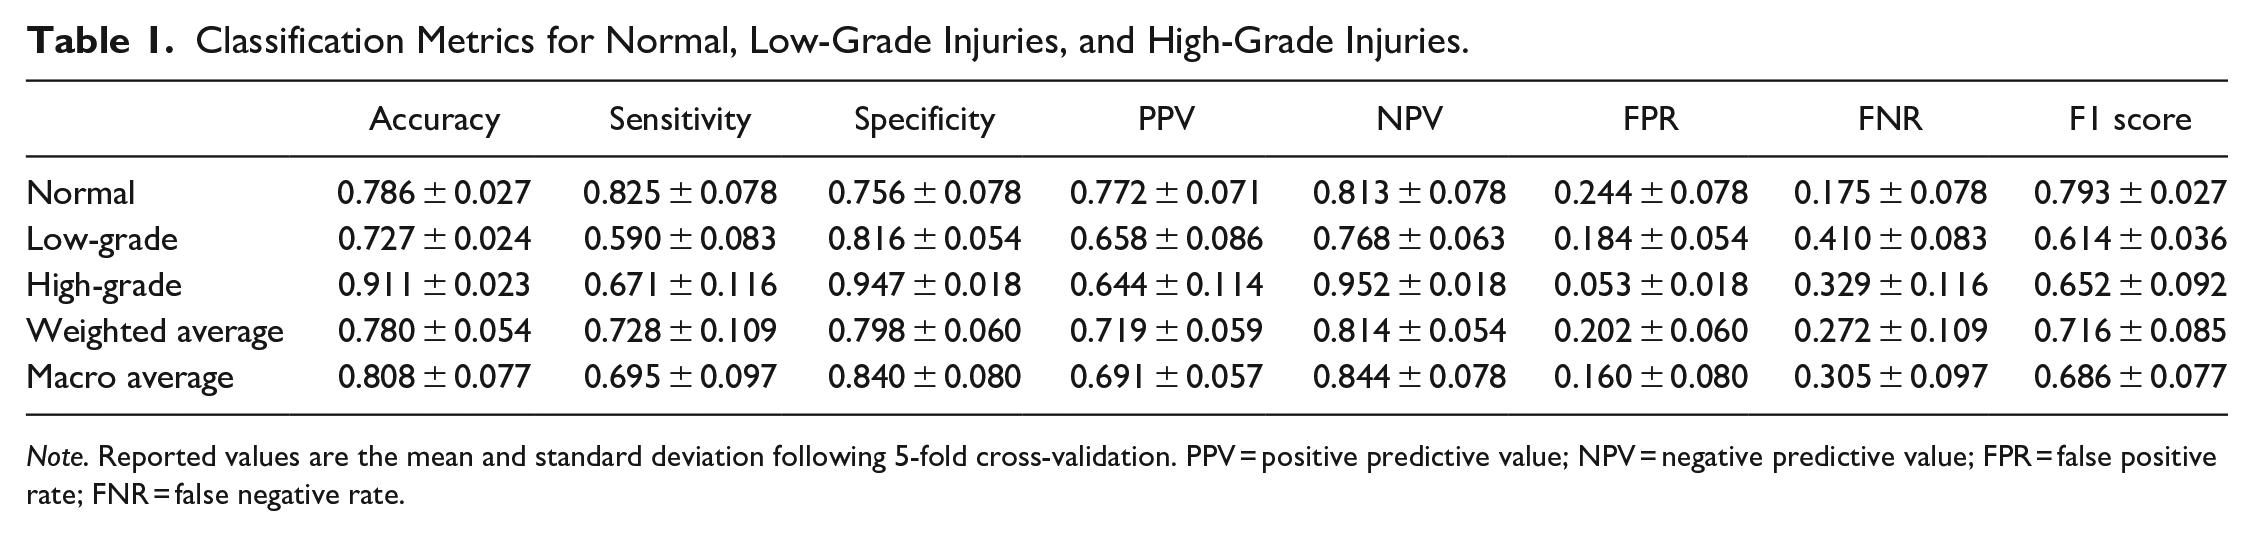
Note. Reported values are the mean and standard deviation following 5-fold cross-validation. PPV = positive predictive value; NPV = negative predictive value; FPR = false positive rate; FNR = false negative rate.
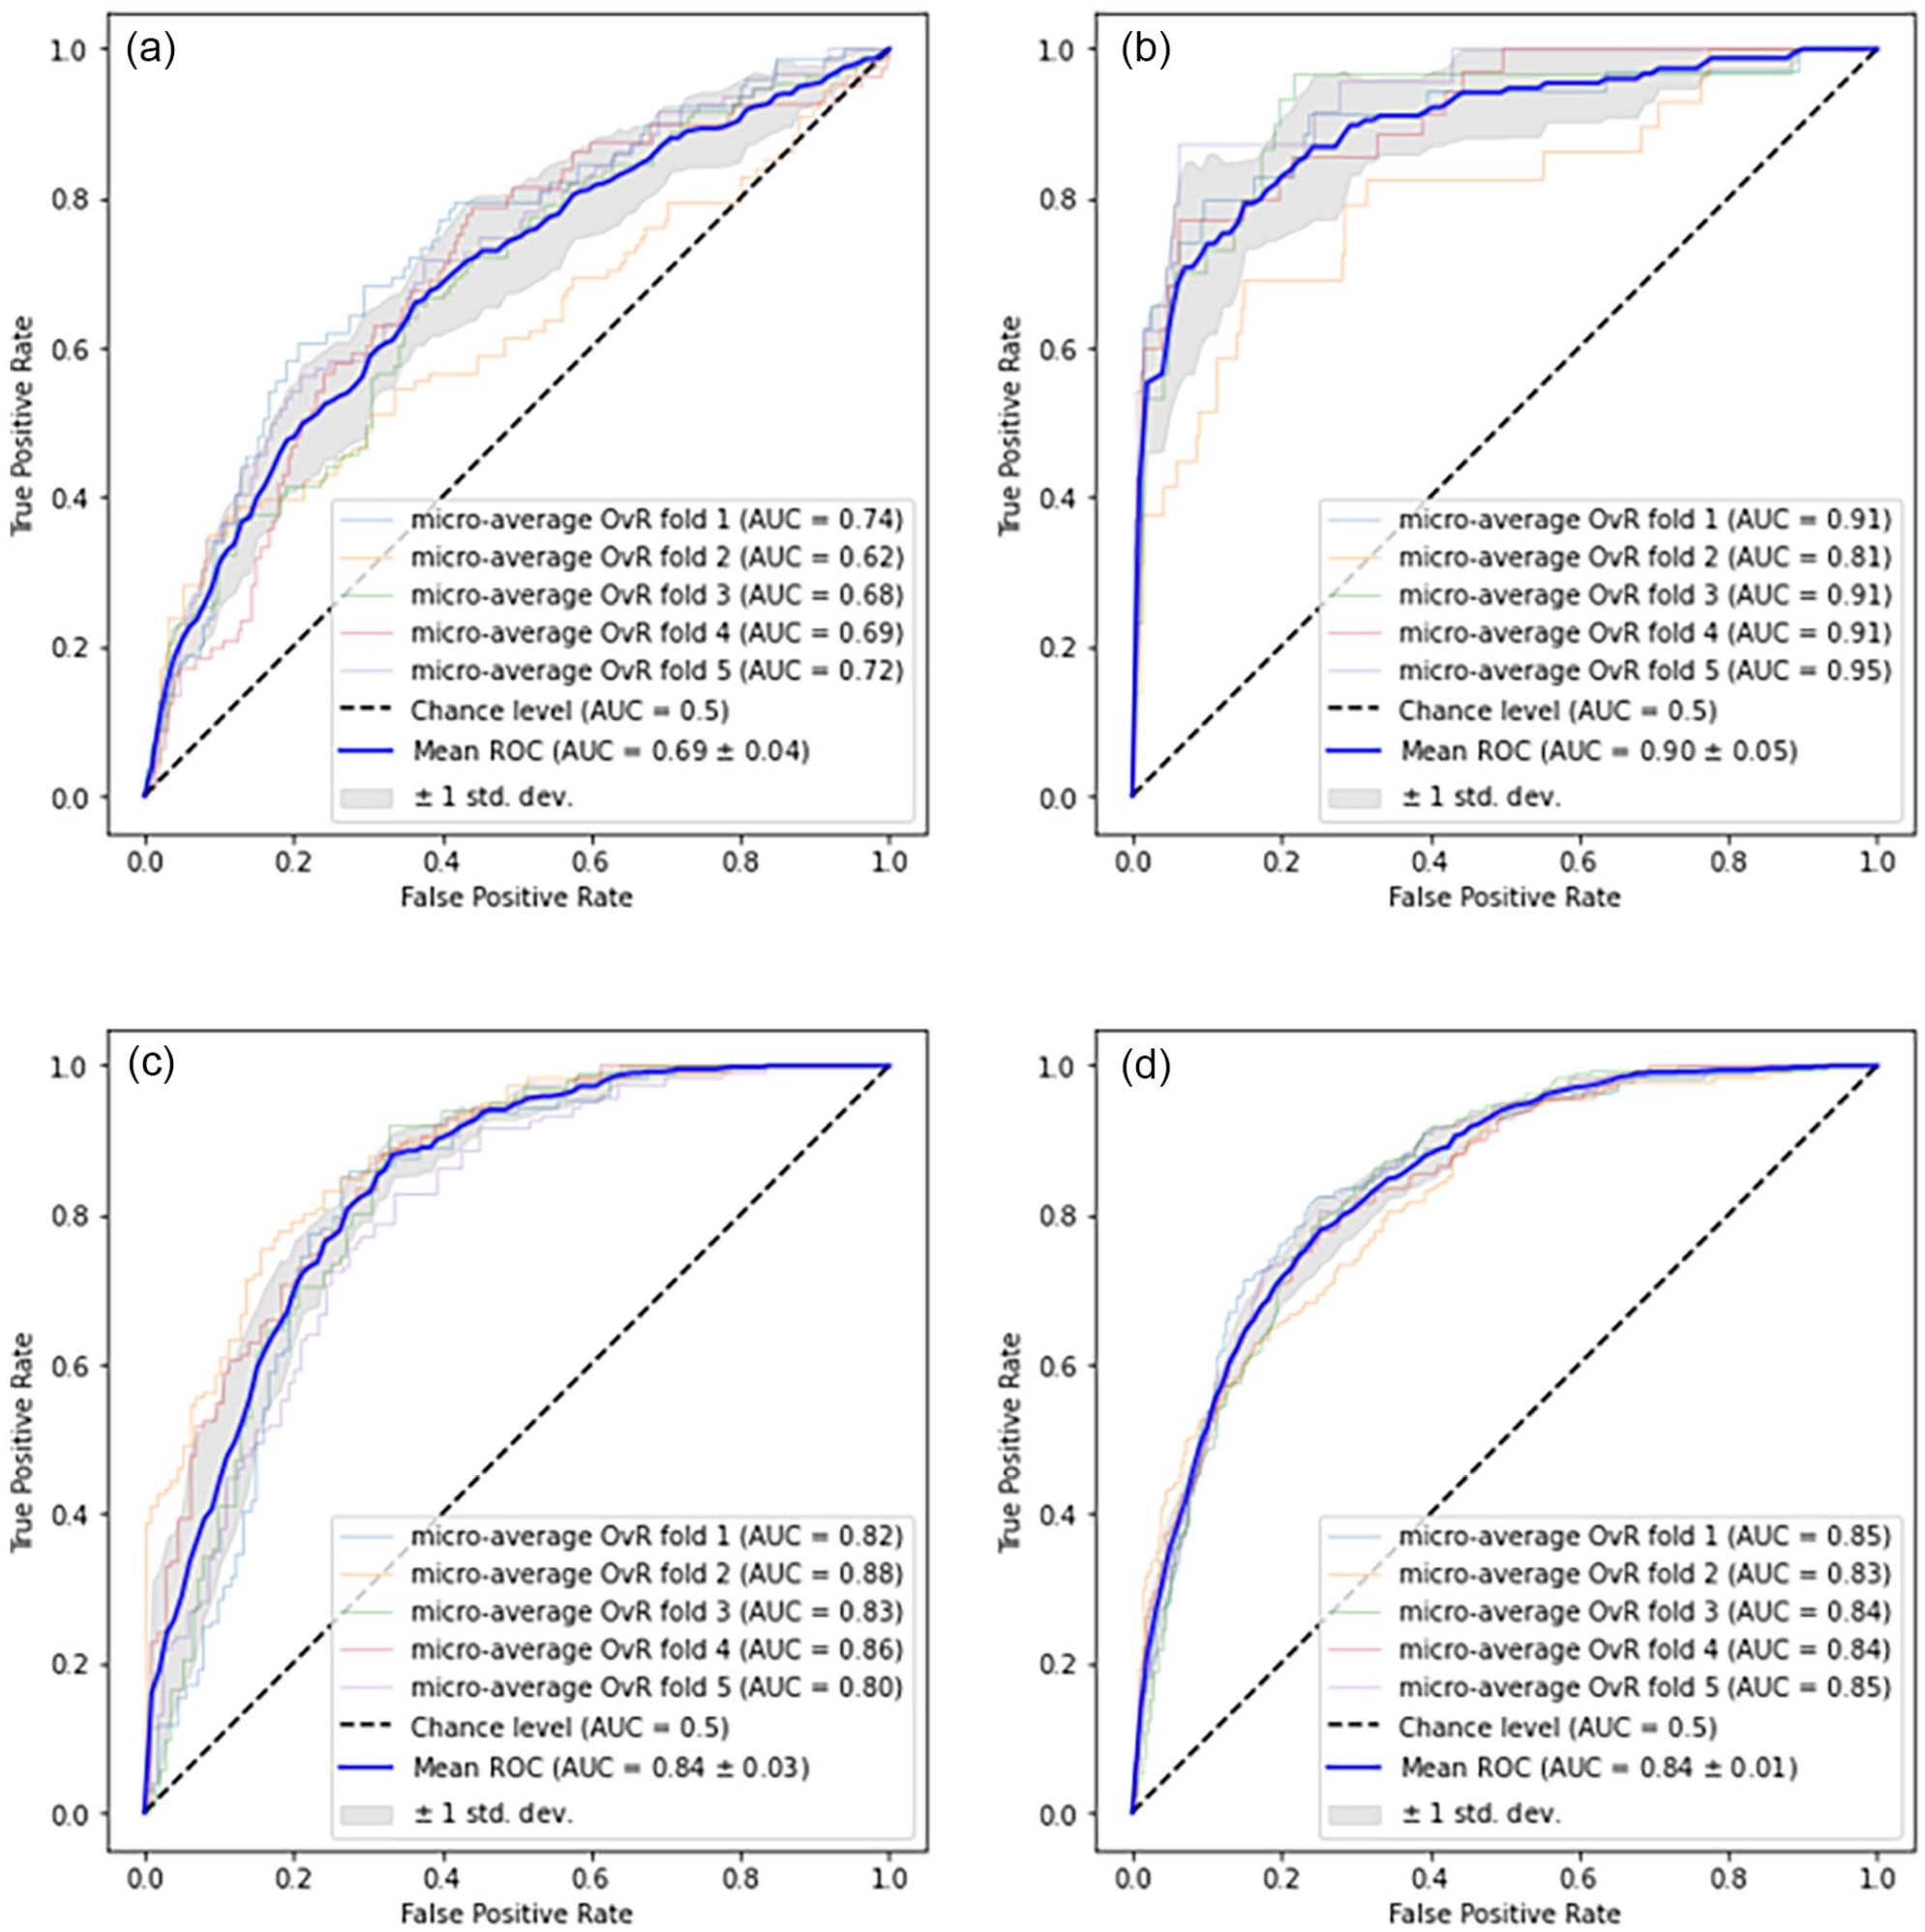
Mean ROC curves for AAST grading model evaluated using 5-fold cross-validation. (a-c) depict ROC curves for individual classes treated as positive classes: low-grade (a), high-grade (b), and normal (c), while the remaining classes serve as negative classes in a One-versus-Rest approach. (d) The mean ROC curve is computed by averaging the micro-averaged ROC curves across all classes.
The confusion matrix in Figure 3 highlights that a limited number of high-grade injuries were misclassified as normal and vice versa. There were 20 normal scans classified as low-grade injuries and 28 low-grade injuries classified as normal. Additionally 8 high-grade injuries were misclassified as low-grade injuries and 2 high-grade cases were misclassified as normal.
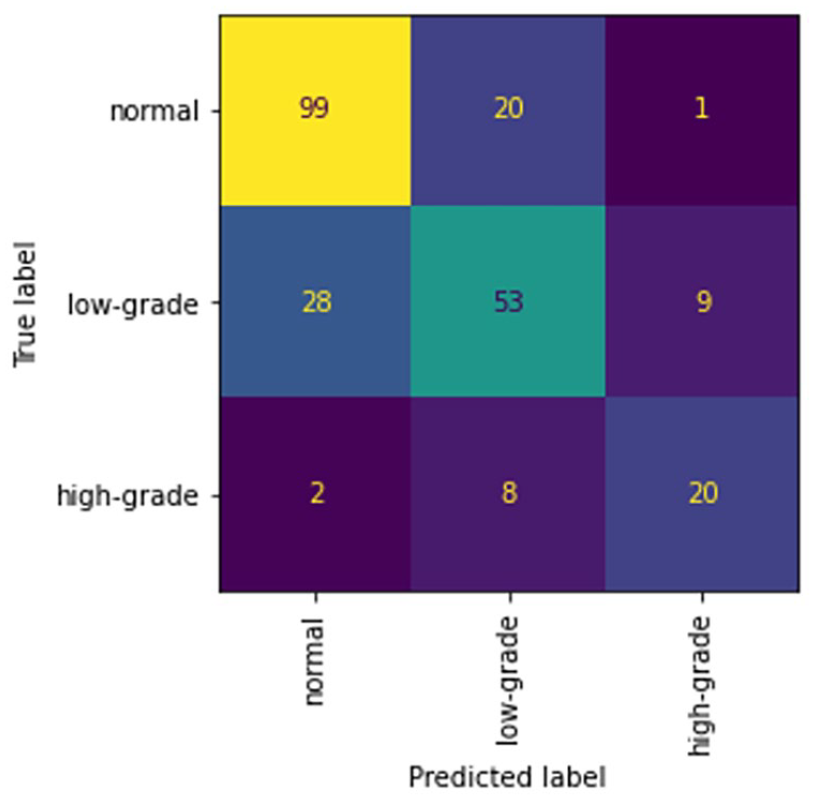
Mean confusion matrix for 5-fold cross-validation of the normal, low-grade injury, and high-grade injury classifier.
Discussion
With the goal of creating an automatic spleen injury detector and classifier on trauma CT studies we created a 2-step machine learning system. First, to reduce the size of the search space spleen localization was done using TotalSegmentator as the initial segmentation, followed by three-dimensional binary dilation to expand the cropped area to identify any missing components. Expert manual inspection of the resultant segmentation masks demonstrated good isolation of the spleen in all cases within the dataset, even including those with morphologically complex higher-grade injuries. Next, a classifier was created using a 3D DenseNet model to stratify into normal, low-grade, and high-grade splenic injuries based on the AAST injury scale. This classifier was trained over a dataset of 1216 expertly curated cases (50% injured, 50% normal spleens) which is more than twice the size of previously published work in this area.15-18 It also underwent data augmentation to improve classifier robustness.
The classifier performance was best on the most critical high-grade splenic injuries with an accuracy of 0.911 with a specificity of 0.947, and overall accuracy was 0.808 with a specificity of 0.840. The high NPV for high-grade splenic injuries in particular could be useful for triaging critical patients. The majority of the classification errors are due to the misclassification of small low-grade injuries as normal and vice versa. These misclassifications are likely due to the often subtle imaging findings of low-grade injuries and performance is not dissimilar to those of expert radiologists on the same dataset. 16 While the false negative rate for high-grade injuries was 32.9%, the model would have correctly identified 93.3% of these patients as having a splenic injury. Manual inspection of the misclassified high-grade injuries showed that 66% of these cases were due to intraparenchymal injuries which can be difficult to identify on split bolus protocol CT imaging (Figures 4 and 5). Only 2 high-grade injuries were misclassified as normal which on inspection demonstrated intraparenchymal vascular injuries.
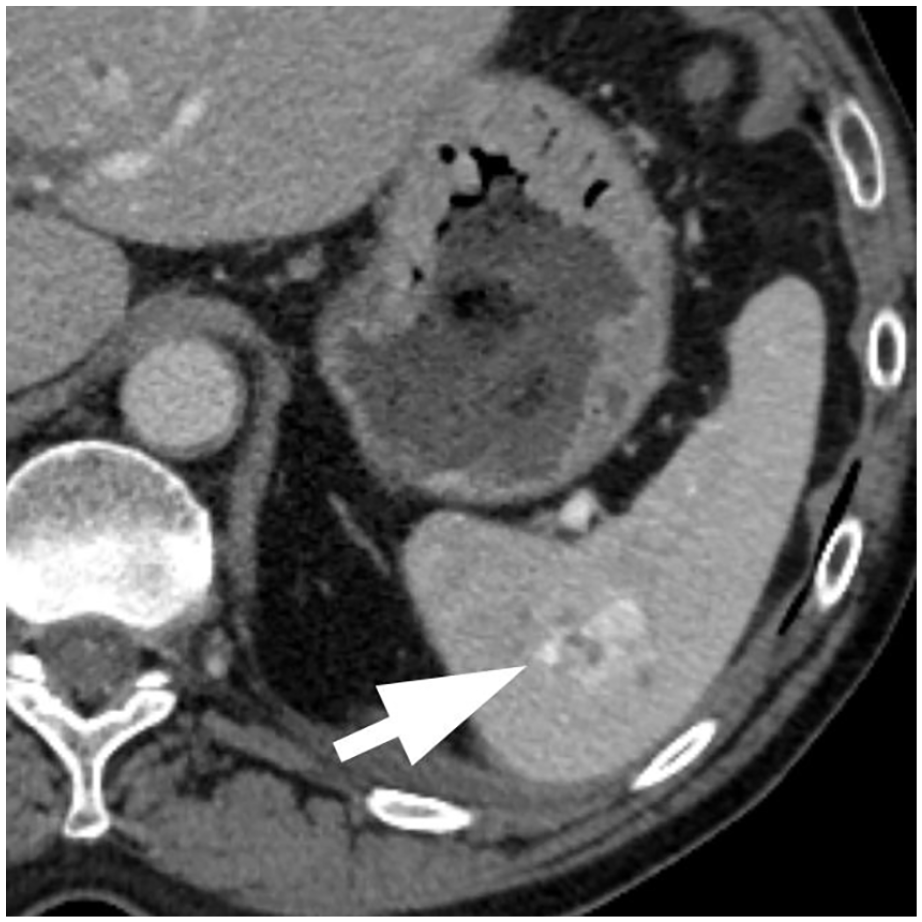
Model prediction: Low-grade injury. Ground truth: High-grade injury due to the presence of an splenic vascular injury.
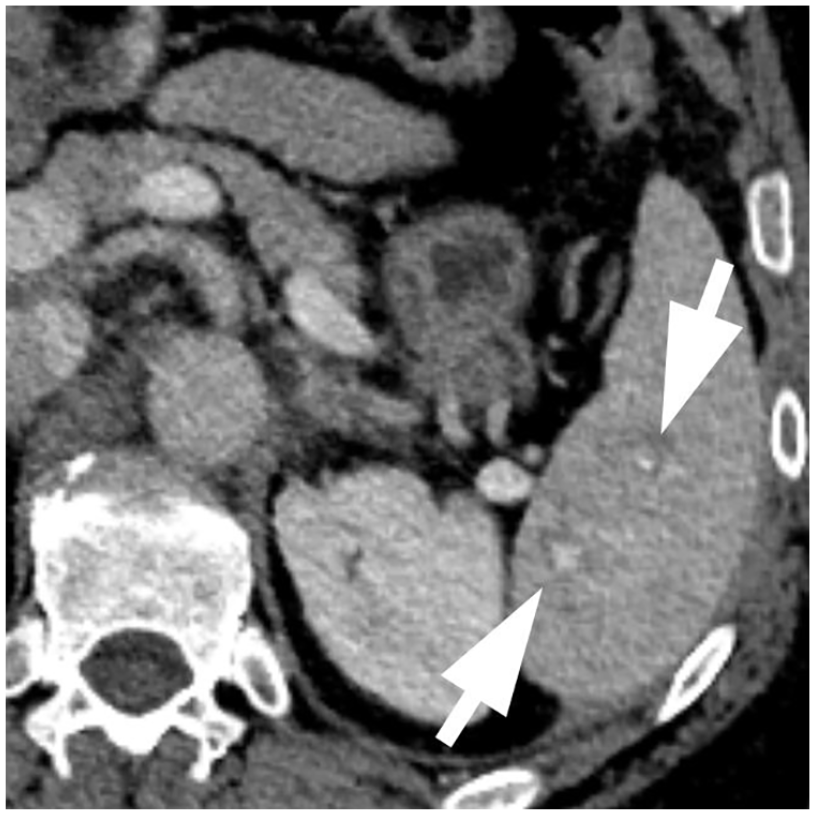
Model prediction: Low-grade injury. Ground truth: High-grade injury due to the presence of subtle splenic vascular injuries.
Chen et al 15 proposed an interpretable automated splenic injury grading system following the AAST injury scoring scale. Their method combines feature-based and deep learning models to predict grades of splenic injuries on dual-phasic CT scans. While their approach achieved an accuracy of 92% in classifying high-grade injuries (AAST grades IV and V), their training dataset was limited to only 68 CT scans and did not include normal spleens. Wang et al 16 utilized a dataset of 91 CT scans that included both normal and injured spleens. Their study explored diverse machine learning models, including random forest (RF), naive Bayes, support vector machine (SVM), k-nearest neighbours (k-NN) ensemble, and subspace discriminant ensemble. Model evaluation was performed using a 5-fold cross-validation approach. A random forest model was the most effective with an AUC of 0.91 and F1 score of 0.80. Cheng et al 17 developed a 2-step deep learning algorithm that included localization and classification steps using a dataset of 600 CT scans. Reported performance included an AUC, accuracy, sensitivity, specificity, PPV, and NPV of 0.90, 0.88, 0.81, 0.92, 0.91, and 0.83, respectively. External validation was performed on 25 positive and negative CT scans demonstrating a decrease in accuracy of up to 0.08 and a specificity as low as 0.60. Model accuracy improved to 0.93 in detecting major injuries when they were considered a single group. Limitations of this study include utilization of portal venous phase CT scans only which are known to miss splenic vascular injuries 18 which can result in the downgrading of higher-grade splenic injuries. Additionally, the investigators utilized a single reader for the AAST grading of splenic injuries extracted from the radiology report. Previous studies have documented poor inter-rater reliability in grading splenic injuries.10-12 Finally, the dataset was unbalanced containing a single grade V splenic injury and grade III injuries dominating the major injury group (54%, n = 21/33).
While our study yields promising outcomes there are limitations. Our dataset uses CT studies solely using the single-pass split-dose protocol and the resultant classifier likely performs best with such an imaging protocol. While this is a common trauma imaging protocol, it is not the only standardly used one in trauma imaging. The data also originates from a single centre and there would be concerns about generalizability to broader clinical settings. Lastly, there are inherent challenges in AAST grading with high inter-observer variability as the boundaries between grading levels are often subtle. This could potentially influence ground truth labels, thereby affecting model training and evaluation. The use of 5 independent radiologist reviews done in this study does reduce the risk of mislabeled cases. Lastly, our dataset excluded cases considered suboptimal, which in clinical practice would not occur.
To mitigate these limitations, future research should encompass a prospective evaluation of our model, incorporating external validation from multiple centres and diverse CT scan vendors or models. This approach will ensure the robustness and adaptability of our solution across varied clinical contexts. Additionally, exploring the potential impact of different CT scan sources on our method’s performance will enhance its versatility. Continual refinement and optimization remain essential to bolster our model’s accuracy and practicality in real-world clinical scenarios.
Conclusion
In conclusion, we developed a 2 stage splenic injury detection and classification system using automatic spleen segmentation followed by classification using a 3D DenseNet model dividing injuries into 3 groups (normal, low-grade, and high-grade) based on the AAST spleen injury scoring scale. We assessed this system’s diagnostic feasibility and found its performance reasonable for clinical use as an initial injury stratification system, leading to a faster appropriate clinical response.
Footnotes
Acknowledgements
The authors would like to acknowledge the contributions and support of Dr. Yangmei Li and Kaiyin Zhu.
Declaration of Conflicting Interests
The author(s) declared no potential conflicts of interest with respect to the research, authorship, and/or publication of this article.
Funding
The author(s) disclosed receipt of the following financial support for the research, authorship, and/or publication of this article: Errol Colak received funding from the Odette Professorship in Artificial Intelligence for Medical Imaging, St. Michael’s Hospital, Unity Health Toronto. David Gomez received funding from the Division of General Surgery Innovation Grant, St Michaels Hospital, Unity Health Toronto, Toronto, ON, Canada. Amber Simpson received funding from the Canada Research Chairs program and the Natural Sciences and Engineering Research Council of Canada.