
Abstract

Introduction
The COVID-19 pandemic disrupted healthcare delivery in Canada leading to shortages of CT and MRI medical radiation technologists (MRTs). 1 Prior to the pandemic, MRTs perceived increased workload due to caseloads. 2 Sustained understaffing may adversely affect MRT mental health, patient safety, and wait-times.
CT and MRI trends have been explored for Canada; however, no data are available on trends relative to MRTs. 3 While national centralized data are lacking, provincial data are available for Ontario which had 15 million people in 2021, an increase by 25% since 2001. The purpose of this study was to examine trends in CT and MRI examination volumes relative to MRTs and machines in Ontario.
Methods
Data on examinations, practicing MRTs, and machines for CT and MRI were collected from 2000 to 2022. The Ontario Medical Association provided the number of CT and MRI examinations. Statistics Canada was sourced for population data. The Regulator of medical radiation and imaging technologists in Ontario (CMRITO) provided MRT data; MRI was documented as a distinct MRT specialty with data available after 2002 whereas MRTs performing CT and/or radiography were grouped together. The Canadian Agency for Drugs and Technologies in Health (CADTH) provided machine data for 2003 to 2007, 2009 to 2012, 2015/2017 (corrected for free-standing machines), and 2020.
Poisson regression or negative binomials were used for each time series depending on the presence of overdispersion with significance set at P < .05. All analyses performed using R (R Foundation for Statistical Computing, v4.2.1).
Results
From 2001 to 2021, the total number of CT and MRI examinations, and the number of CT and MRI examinations per capita, increased in Ontario (Table 1). The number of CT examinations tripled to 1 951 518 with spine and cardiothoracic CT increasing the most; the number of MRI examinations increased six-fold to 872 448 with abdominal pelvic MRI increasing the most. Spine was the most imaged region using CT and MRI in 2021. The number of examinations per MRT increased (Figure 1), with the number of CT examinations per MRT more than doubling and a similar increase for MRI.
CT and MRI Trends Relative to the Population in Ontario, the Number of Medical Radiation Technologists (MRTs), and the Number of Machines Between 2001 and 2021.
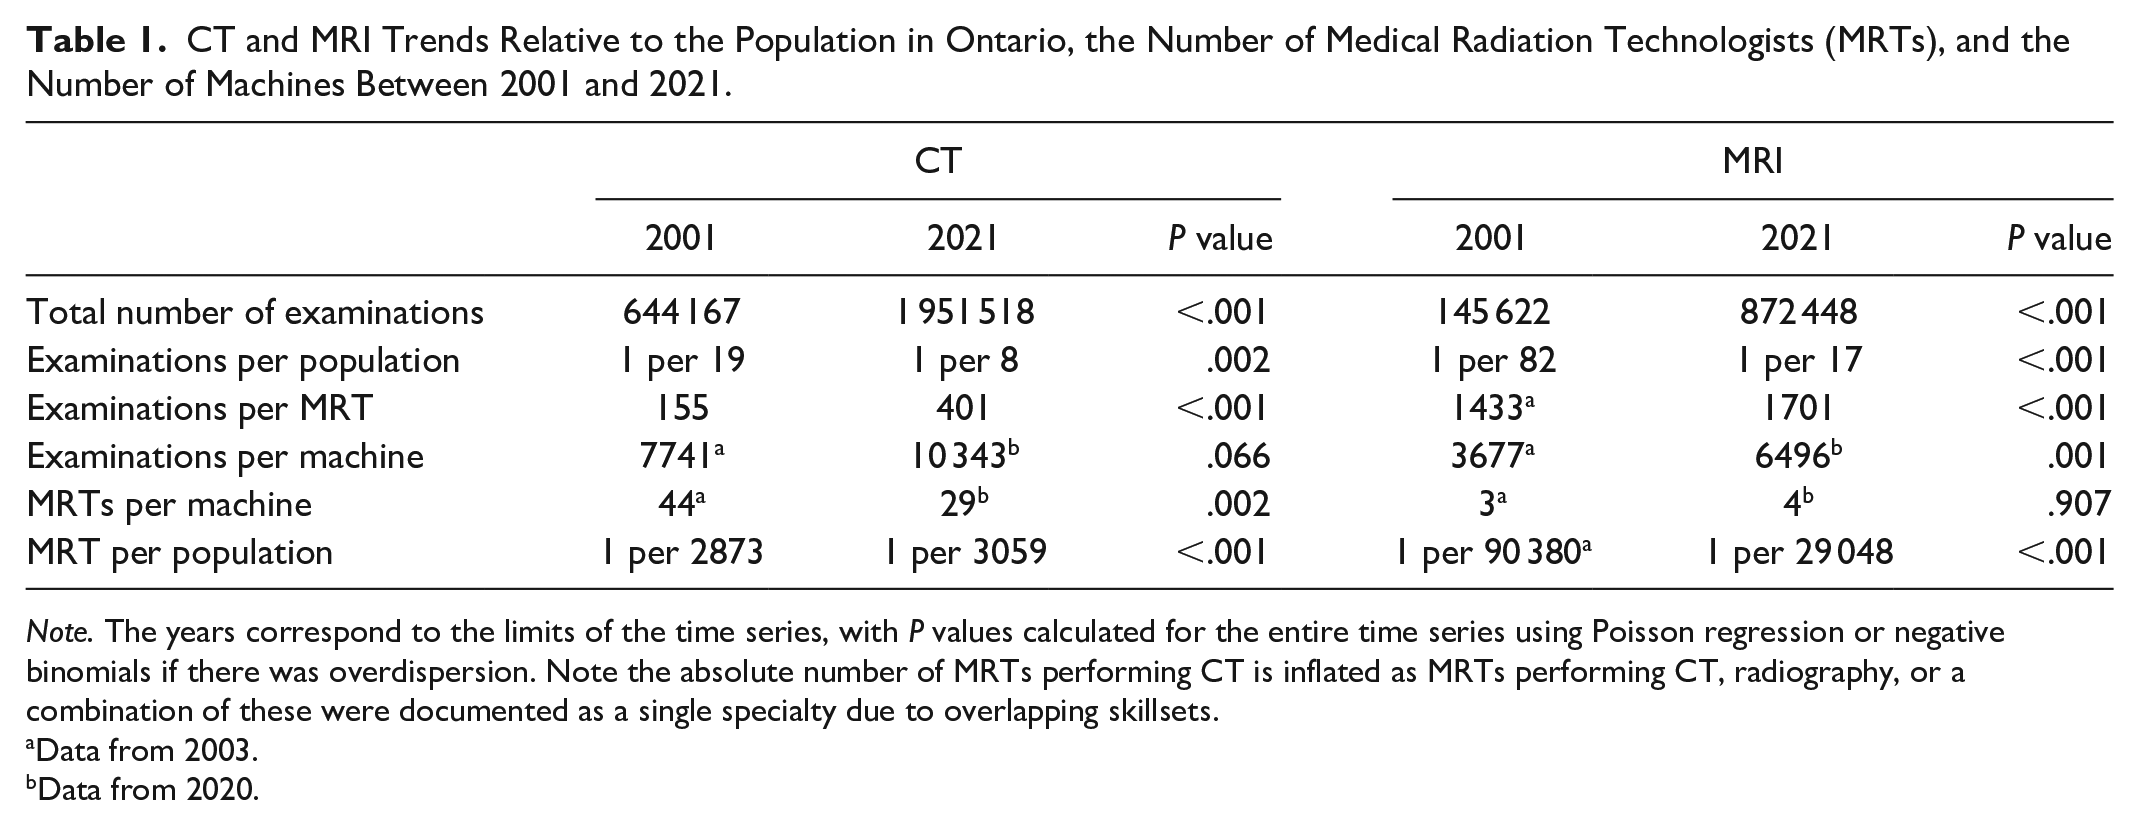
Note. The years correspond to the limits of the time series, with P values calculated for the entire time series using Poisson regression or negative binomials if there was overdispersion. Note the absolute number of MRTs performing CT is inflated as MRTs performing CT, radiography, or a combination of these were documented as a single specialty due to overlapping skillsets.
Data from 2003.
Data from 2020.
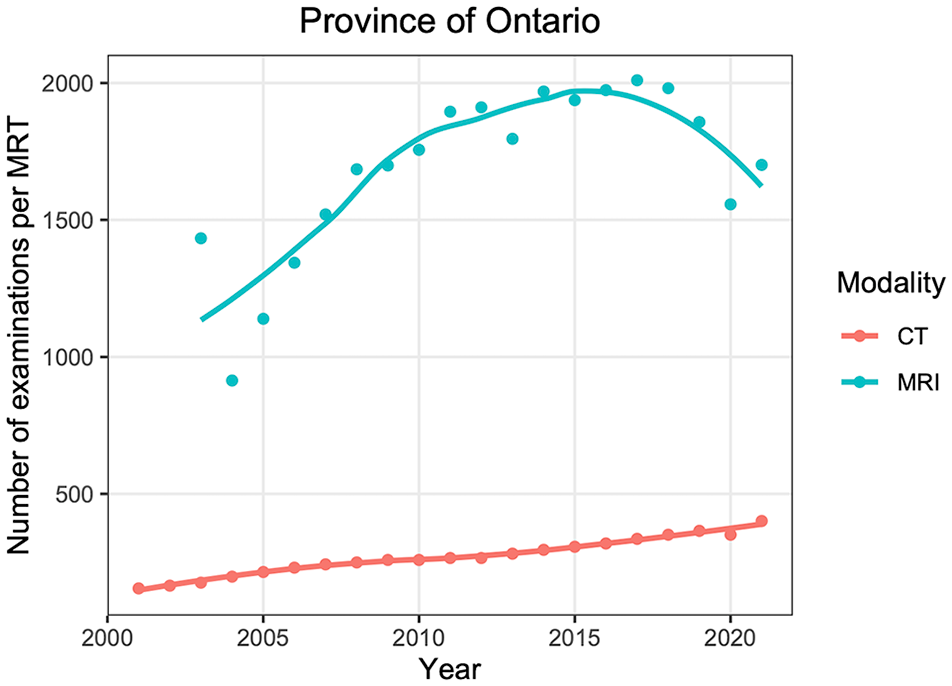
Number of CT and MRI examinations per medical radiation technologist (MRT) in Ontario between 2001 and 2021. Smooth curve fitting was performed using local polynomial regression (locally estimated scatterplot smoothing; LOESS). The absolute number of MRTs performing CT is inflated as MRTs performing CT, radiography, or a combination of these were documented as a single specialty due to overlapping skillsets. The number of MRI examinations increased rapidly earlier in the time series, then later dropped off which we suspect was due to a combination of data quality and the COVID-19 pandemic.
From 2003 to 2020, the number of MRTs per CT machine decreased from 44 to 29 (Figure 2), while the number of CT examinations per machine was borderline unchanged (P = .066). The number of MRTs per MRI machine in the province did not change at approximately 4 MRTs per MRI machine, while the number of MRI examinations per machine increased (P = .001). There are now fewer CT MRTs per capita than previously, while there are more MRI MRTs per capita (P < .001).
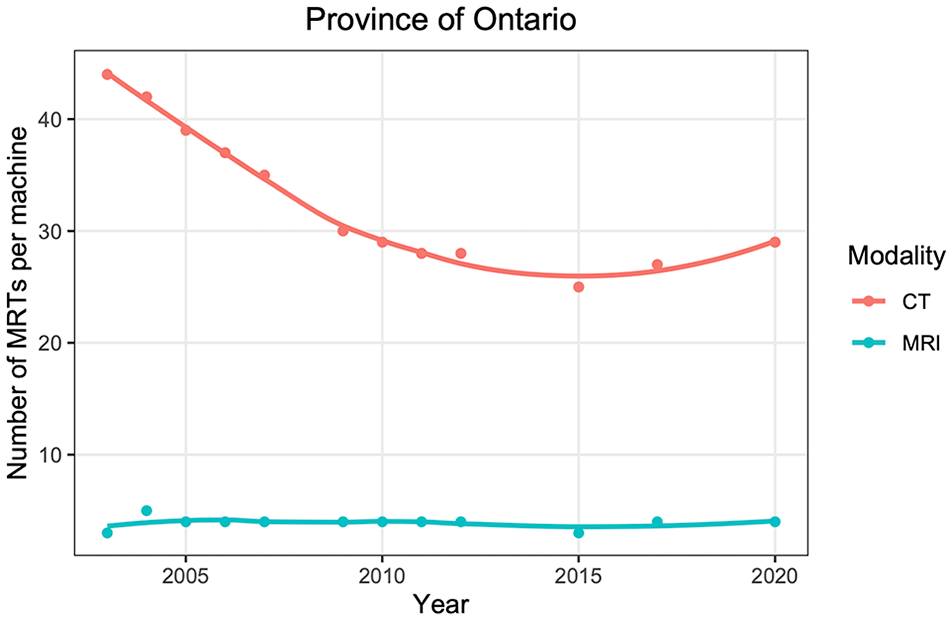
Number of medical radiation technologists (MRTs) per CT and MRI machine in Ontario between 2003 and 2020. Smooth curve fitting was performed using local polynomial regression (locally estimated scatterplot smoothing; LOESS). For CT, the number of MRTs per machine decreased until approximately 2015 then stabilized.
Discussion
Several imaging trends have occurred in Ontario. Total CT and MRI examination volumes, examinations per capita, and examinations per MRT have all increased. The CT caseload per MRT increased due to predominantly fewer MRTs per machine, while the MRI caseload increased due to predominantly more examinations per machine. Much of this work occurs after hours and may contribute to burnout. 4
The onset of the COVID-19 pandemic led to fewer full-time MRTs and reduced volumes.1,5 Anecdotally, the scanning volumes have since returned to (or exceeded) pre-COVID-19 levels at many sites that are now struggling to maintain operations due to MRT understaffing. More recent data capturing the current challenges are not yet available, and there are no high-quality national-level data which limits a more in-depth analysis.
Canada’s population grew by 23% over the data collection period and will likely continue; commensurate growth in healthcare investment is critical. The province of Ontario alone is projected to gain 49 additional MRI machines in the near term. 6 Concerted efforts are needed to considerably increase the supply of MRTs to avert an MRT staffing crisis for both CT and MRI.
Footnotes
Acknowledgements
The authors would like to acknowledge Caroline Morris, Deputy Registrar and Registration Director and Pree Tyagi, Registrar and CEO of CMRITO: Regulator of medical radiation and imaging technologists in Ontario for providing data on medical radiation technologists; Andra Morrison at CADTH: Canadian Agency for Drugs and Technologies in Health for providing data on the number of CT and MRI machines in Ontario; and George Marusic at the Ontario Medical Association for providing data on the number of examinations performed.
Declaration of Conflicting Interests
The author(s) declared no potential conflicts of interest with respect to the research, authorship, and/or publication of this article.
Funding
The author(s) received no financial support for the research, authorship, and/or publication of this article.