
Abstract
Introduction
Glioblastoma (GBM) is the most common and most aggressive primary tumour of the central nervous system (CNS). Its incidence varies by country and population, with an overall annual incidence of 3.26 cases per 100,000 inhabitants. 1 Despite advances in the management of GBM, patient prognosis remains poor with a mean overall survival of 16-17 months. 2 According to the fifth edition of the WHO Classification of Tumors of the CNS (WHO CNS5), molecular markers are crucial for determining accurate brain tumour diagnosis and predicting patient outcome. 3 The criteria for GBM diagnosis include adult-type diffuse gliomas with microvascular proliferation, necrosis, and specific molecular features, such as telomerase reverse transcriptase (TERT) promoter mutation, epidermal growth factor receptor amplification, chromosome 7 gain, and chromosome 10 loss. 4 Therefore, TERT promoter mutation status plays an important role in GBM diagnosis. 5
Although complete resection of GBM contrast-enhancing lesions is associated with prolonged survival, 6 the tumour often recurs due to the presence of tumour cells beyond the contrast-enhancing lesions. 7 GBM with TERT promoter mutation is more aggressive and has greater peritumoural tumour cell infiltration; thus, maximum surgical resection of contrast-enhancing and non-contrast-enhancing lesions should be performed when safe and feasible. 8,9 Therefore, a preoperative identification of TERT promoter mutation may play a key role in formulating an appropriate surgical plan.
With advances in machine learning algorithms and computer technology, computer-aided diagnosis has become an important area of medical imaging research. Previous studies on radiomics have revealed that peritumoural features in medical images have good diagnostic ability. 10,11 Models for predicting grade in gliomas incorporate peritumoural radiomics features with satisfactory results. 12 Peritumoral regions contain valuable information that is closely linked with tumour characteristics. 13 Furthermore, studies have shown that using a machine learning model based on deep learning (DL) features from multi-parametric magnetic resonance imaging (MRI) can achieve good classification results. 14 This indicates that DL features are associated with high selectivity, stability, and robustness in distinguishing normal from abnormal patterns. 15 However, whether the intra- and peritumoural DL features can be used for non-invasive evaluation of TERT promoter mutation in GBM patients is currently underexplored. We hypothesized that DL features of the intra- and peritumoural regions would help identify TERT promoter mutation in patients with GBM.
The aim of this study was to develop and validate a radiomics model that incorporated intra- and peritumoural DL features of multi-parametric MRI to preoperatively identify TERT promoter mutation in patients with GBM.
Methods
Patients
This study was approved by our Institutional Ethics Committee, and the requirement for informed consent was waived due to the retrospective nature of this multicenter study. Data from patients with histologically confirmed isocitrate dehydrogenase (IDH)-wild-type GBM (WHO grade 4) between November 2016 and September 2022 were included in this study. The data were obtained from the relevant medical institution I and II databases. Figure 1 and Supplementary Method S1 present the patient recruitment process, inclusion, and exclusion criteria. In total, 229 GBM patients in this study were included. The patients were divided into a training set (115 patients [72 men and 43 women; mean age, 54.3 ± 13.4 (21-96) years] from medical institution I) and an external test set (114 patients [72 men and 42 women; mean age, 54.5 ± 12.4 (23-86) years] from medical institution II). Baseline clinical characteristics included age, sex, tumour location, number of recurrences, and mean postoperative progression-free survival time. Mutation hotspots in the IDH1, IDH2, and TERT promoters (C228 T and C250 T) were detected by Sanger sequencing. Data collection flow chartThe inclusion and exclusion criteria for selecting the study populations are shown for the training and test sets. GBM, Glioblastoma; TERT, Telomerase reverse transcriptase.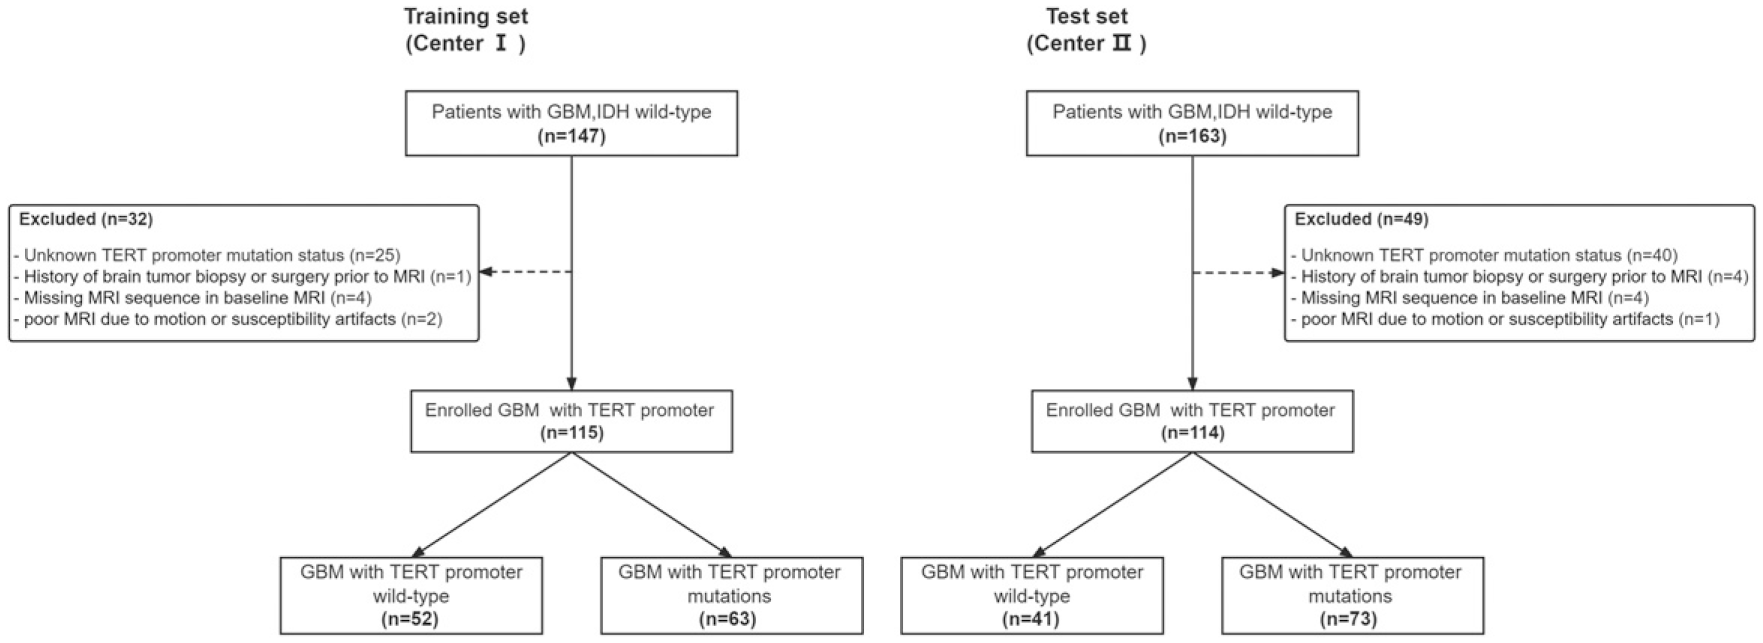
MRI protocol and preprocessing
Figure 2 summarizes the workflow employed. GBM magnetic resonance (MR) images [axial T1-weighted contrast-enhanced image (T1CE), T1-weighted image (T1WI), and T2-weighted image (T2WI)] were retrieved from a Picture Archiving and Communication System (PACS) for further evaluation. The following MRI acquisition protocol was used (Supplementary Table S2). Overall study flowchart. ROI, Region of interest; CNN, Convolutional neural network; DL, Deep learning; DLR, Deep learning radiomics; FDLR, Fusion deep learning radiomics; LR, logistic regression.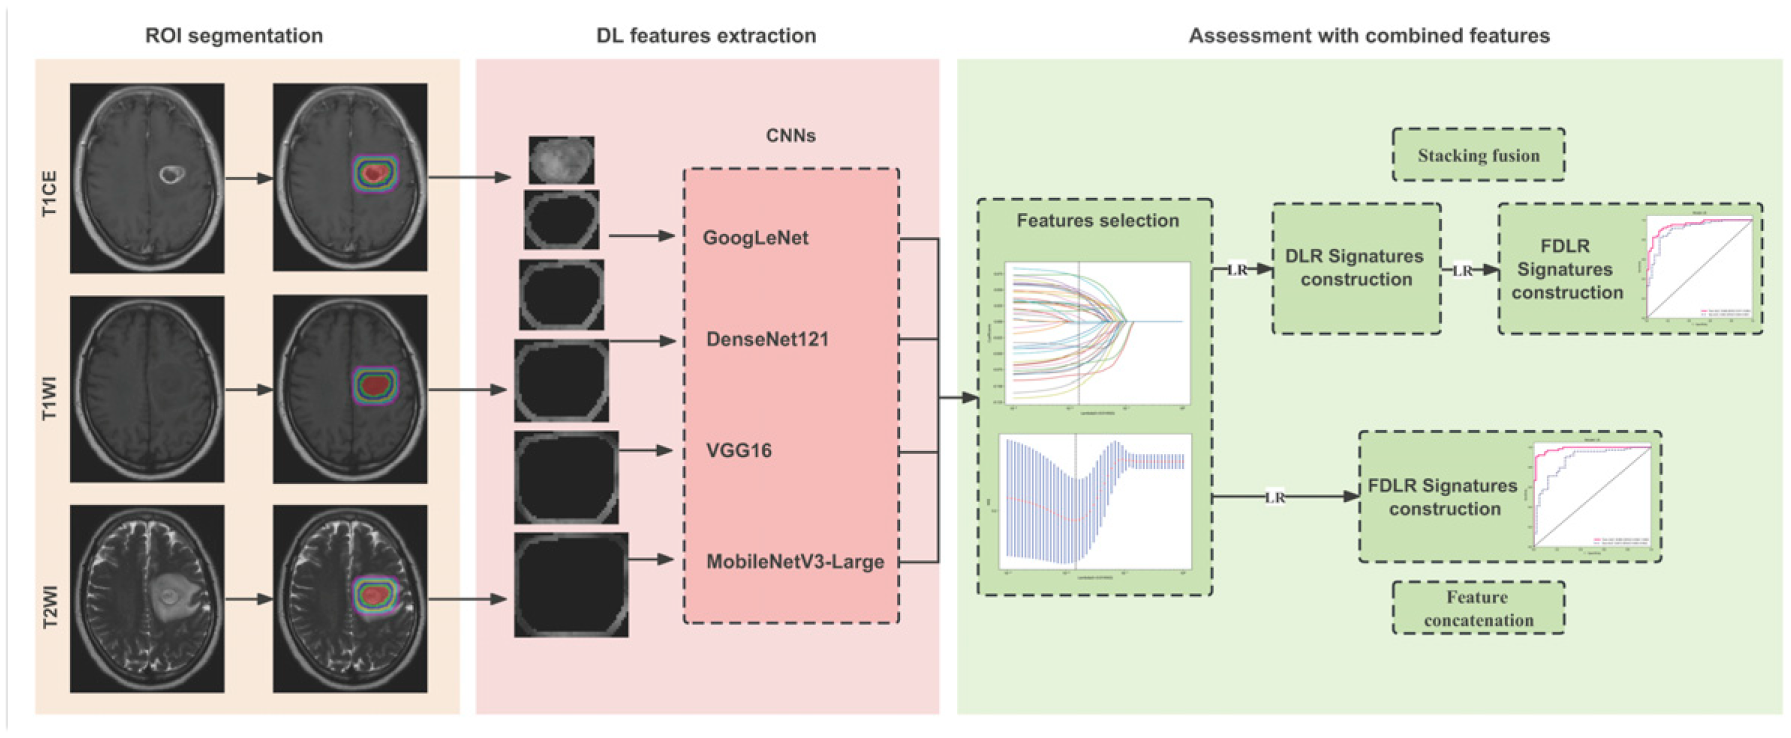
To pre-process the image data, we first performed N4 bias field correction on the collected MR images using the SimpleITK package (NumFOCUS, Austin, TX). The T1WI and T1CE were then registered as T2WI using FLIRT (action options: Affine, 12 parameter model, and trilinear interpolation method) in the FMRIB Software Library (Analysis Group, FMRIB, Oxford, UK). Next, the images were re-sampled to a uniform voxel size of 1 × 1 × 1 mm3 using the nearest-neighbor interpolation method of the “SimpleITK” package. Finally, the image signal intensity was normalized using the “PyRadiomics” package. 16
Tumour Segmentation
Reader 1, with 3 years of experience in neurological MRI interpretation, first delineated the tumour’s region of interest (ROI) based on the MRI images of 229 patients using the ITK-SNAP software (version 3.6.0; Penn Image Computing and Science Laboratory, Philadelphia, PA). The outline was defined as the tumour core (tumour enhancement, necrosis, and cystic region), which included all tumour structures, as shown in the T1CE and T2WI. For tumours lacking an enhancement area, the tumour core with an intermediate signal on T1WI and T2WI was delineated. Reader 2, with 7 years of experience in neurological MRI interpretation, validated the ROIs for all images. Reader 3, with 30 years of experience in neurological MRI interpretation, provided the validation in cases of disagreements between Reader 1 and Reader 2.
After determining the core of the tumour and to further evaluate the predictive ability of the tumour core's surrounding area, the originally masked area was expanded in segments at 2 mm intervals to five radial distances outside the area of the tumour core (maximum expansion distance was 10 mm) by Onekey AI platform (OnekeyAI, Shijiazhuang, Hebei). Figure 3 shows the mask expansion process, and the final mask shows the intra- and peritumoural regions. Previous studies have shown that the surrounding 10 mm peritumoural area outside of the tumour core can provide GBM-related diagnostic information.
17
Therefore, selecting the parenchyma 10 mm around the tumour at the imaging level is reasonable for tumour behaviour stratification.
18,19
MRI masks. An example of dilated MRI masks for different radial dilation distances outside the original mask is shown. The red area represents the segmented tumour core area and the coloured rings indicate the peritumoral area, with each ring representing a 2 mm wide dilation. MRI, magnetic resonance imaging.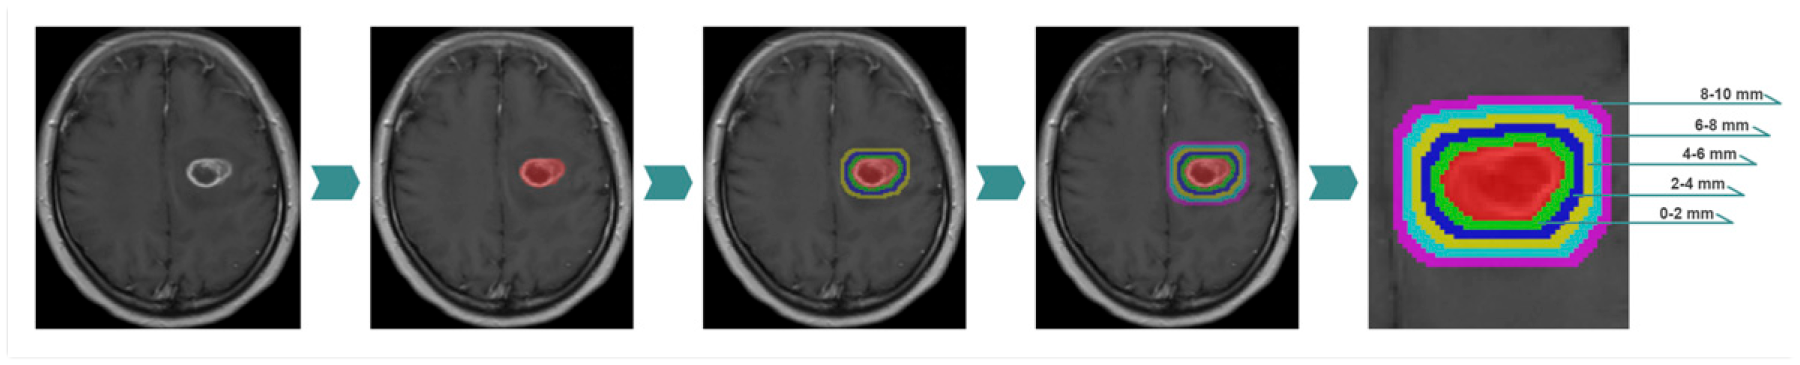
Extraction and Selection of DL Features
DL features were extracted using four 2D convolutional neural networks (CNNs), including GoogLeNet, DenseNet121, VGG16, and MobileNetV3-Large. The code for each architecture was derived from previous research. 20 -23 After pre-training all the 2D CNNs using ImageNet (Stanford Vision Lab, Stanford University, Palo Alto, CA), the largest horizontal axial ROI images of the intra- and peritumoural regions in each sequence image were used for feature extraction. DenseNet121 extracted the features of the features.norn5 layer, whereas the rest of the CNN architecture used an average pooling layer to extract the DL features. Finally, principal component analysis was used for deep feature compression, and 200 DL features were output from the intra- and peritumoural regions of the T1CE, T1WI, and T2WI.
Feature selection first used Z-score normalization to standardize the features, which returned all data to a distribution with a mean of zero and a variance of one. Feature selection was performed on the training set as follows: (1) the Mann–Whitney U test was used to retain features with a P-value <.05; (2) The Pearson correlation analysis was performed, and the correlation coefficients among features were calculated to evaluate their multi-collinearity. If there was any coefficient value ≥.9 for a pair of features, then only the feature with a better diagnostic performance was retained; (3) the key features were selected using the least absolute shrinkage and selection operator (LASSO). The optimal regulation weight λ was found using 10-fold cross-validation with minimum criteria. The Python “scikit-learn” package (Python Software Foundation, Fredericksburg, VA) was used for LASSO regression modelling.
Differentiation of TERT Promoter Status With Different Signatures
We aimed to assess the discriminative ability of intra- and peritumoural regions on T1CE, T1WI, and T2WI to identify the presence of TERT promoter mutation in patients with GBM. The key features of the selected multi-parametric MRI and multi-ROI regions were constructed with corresponding deep learning radiomics (DLR) signatures. The signature of the best prediction result was then selected for different expansion distances for each MRI sequence to construct the fusion DL radiomics (FDLR) signature. We employed two multi-parametric fusion strategies: feature concatenation and stacking fusion. Feature concatenation involved concatenating the DL features extracted from different ROIs of each MRI sequence to obtain fused multi-parametric features for modelling. Stacking fusion combined the DLR signatures on different ROIs of each MRI sequence using another machine learning algorithm.
To validate the performance of the FDLR signature with multi-parametric MRI, only signatures with either one or two parameters were used to determine the presence of TERT promoter mutation in GBM patients.
Statistical Analysis
All statistical analyses were performed using Python software (version 3.7.14, Python Software Foundation, Fredericksburg, VA). The receiver operating characteristic (ROC) curve and area under the curve (AUC) were used to evaluate the signatures with different sequences, ROIs, and fusion strategies. Other evaluation metrics included accuracy, sensitivity, specificity, positive predictive value, negative predictive value, precision, recall, and F1-score. The Delong test was used to calculate the statistical significance between two ROC curves.
The clinical characteristics of patients in the different groups were compared using t-tests for continuous variables and chi-squared or Fisher’s exact tests for categorical variables, as appropriate. Statistical significance was set at a P-value <.05.
Results
Patient Characteristics
Clinical Characteristics of Glioblastoma Patients.
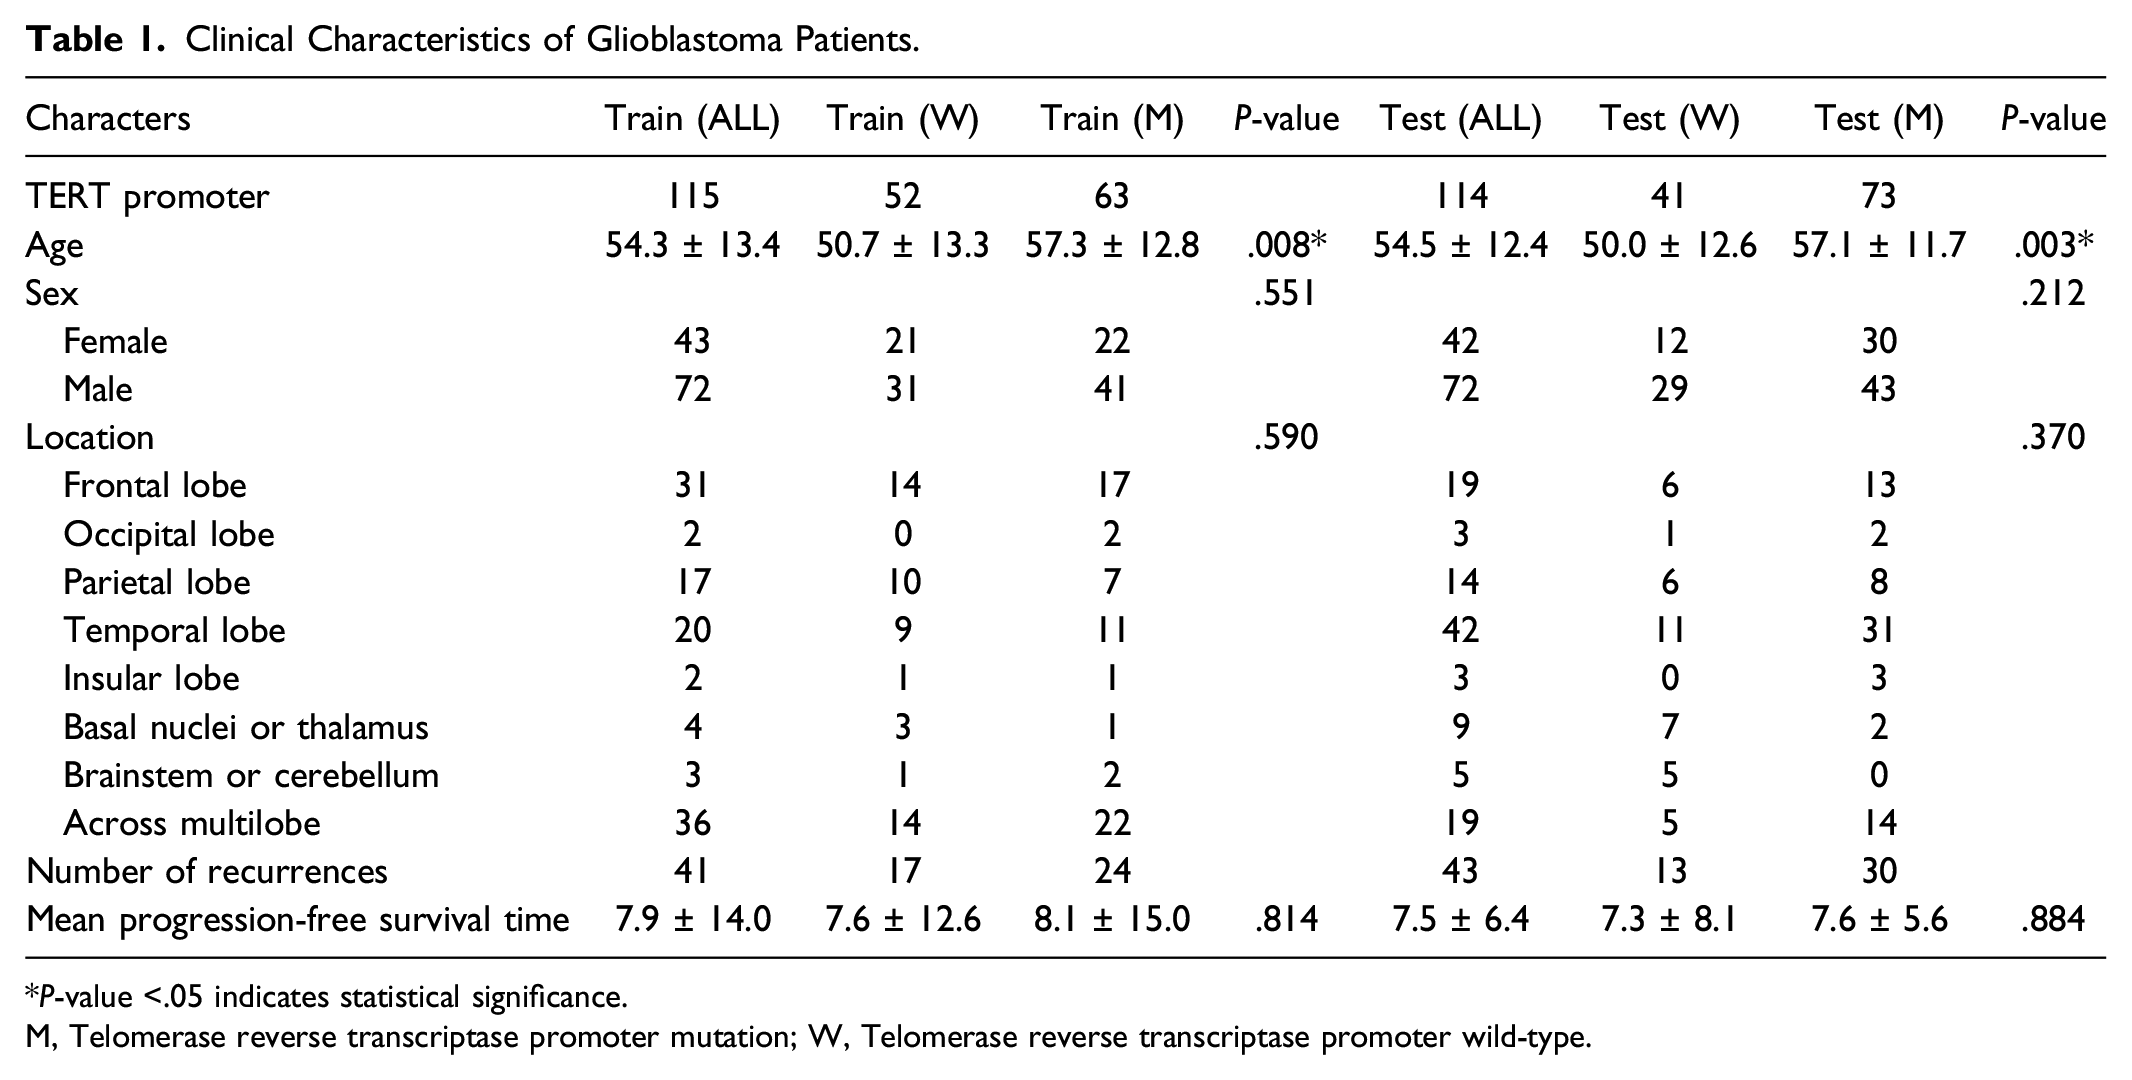
*P-value <.05 indicates statistical significance.
M, Telomerase reverse transcriptase promoter mutation; W, Telomerase reverse transcriptase promoter wild-type.
Evaluation of Intra- and Peritumoural Regions
TERT Promoter Mutation Prediction Performance of Intra- and Peritumoural Regions in T1CE, T1WI, and T2WI.
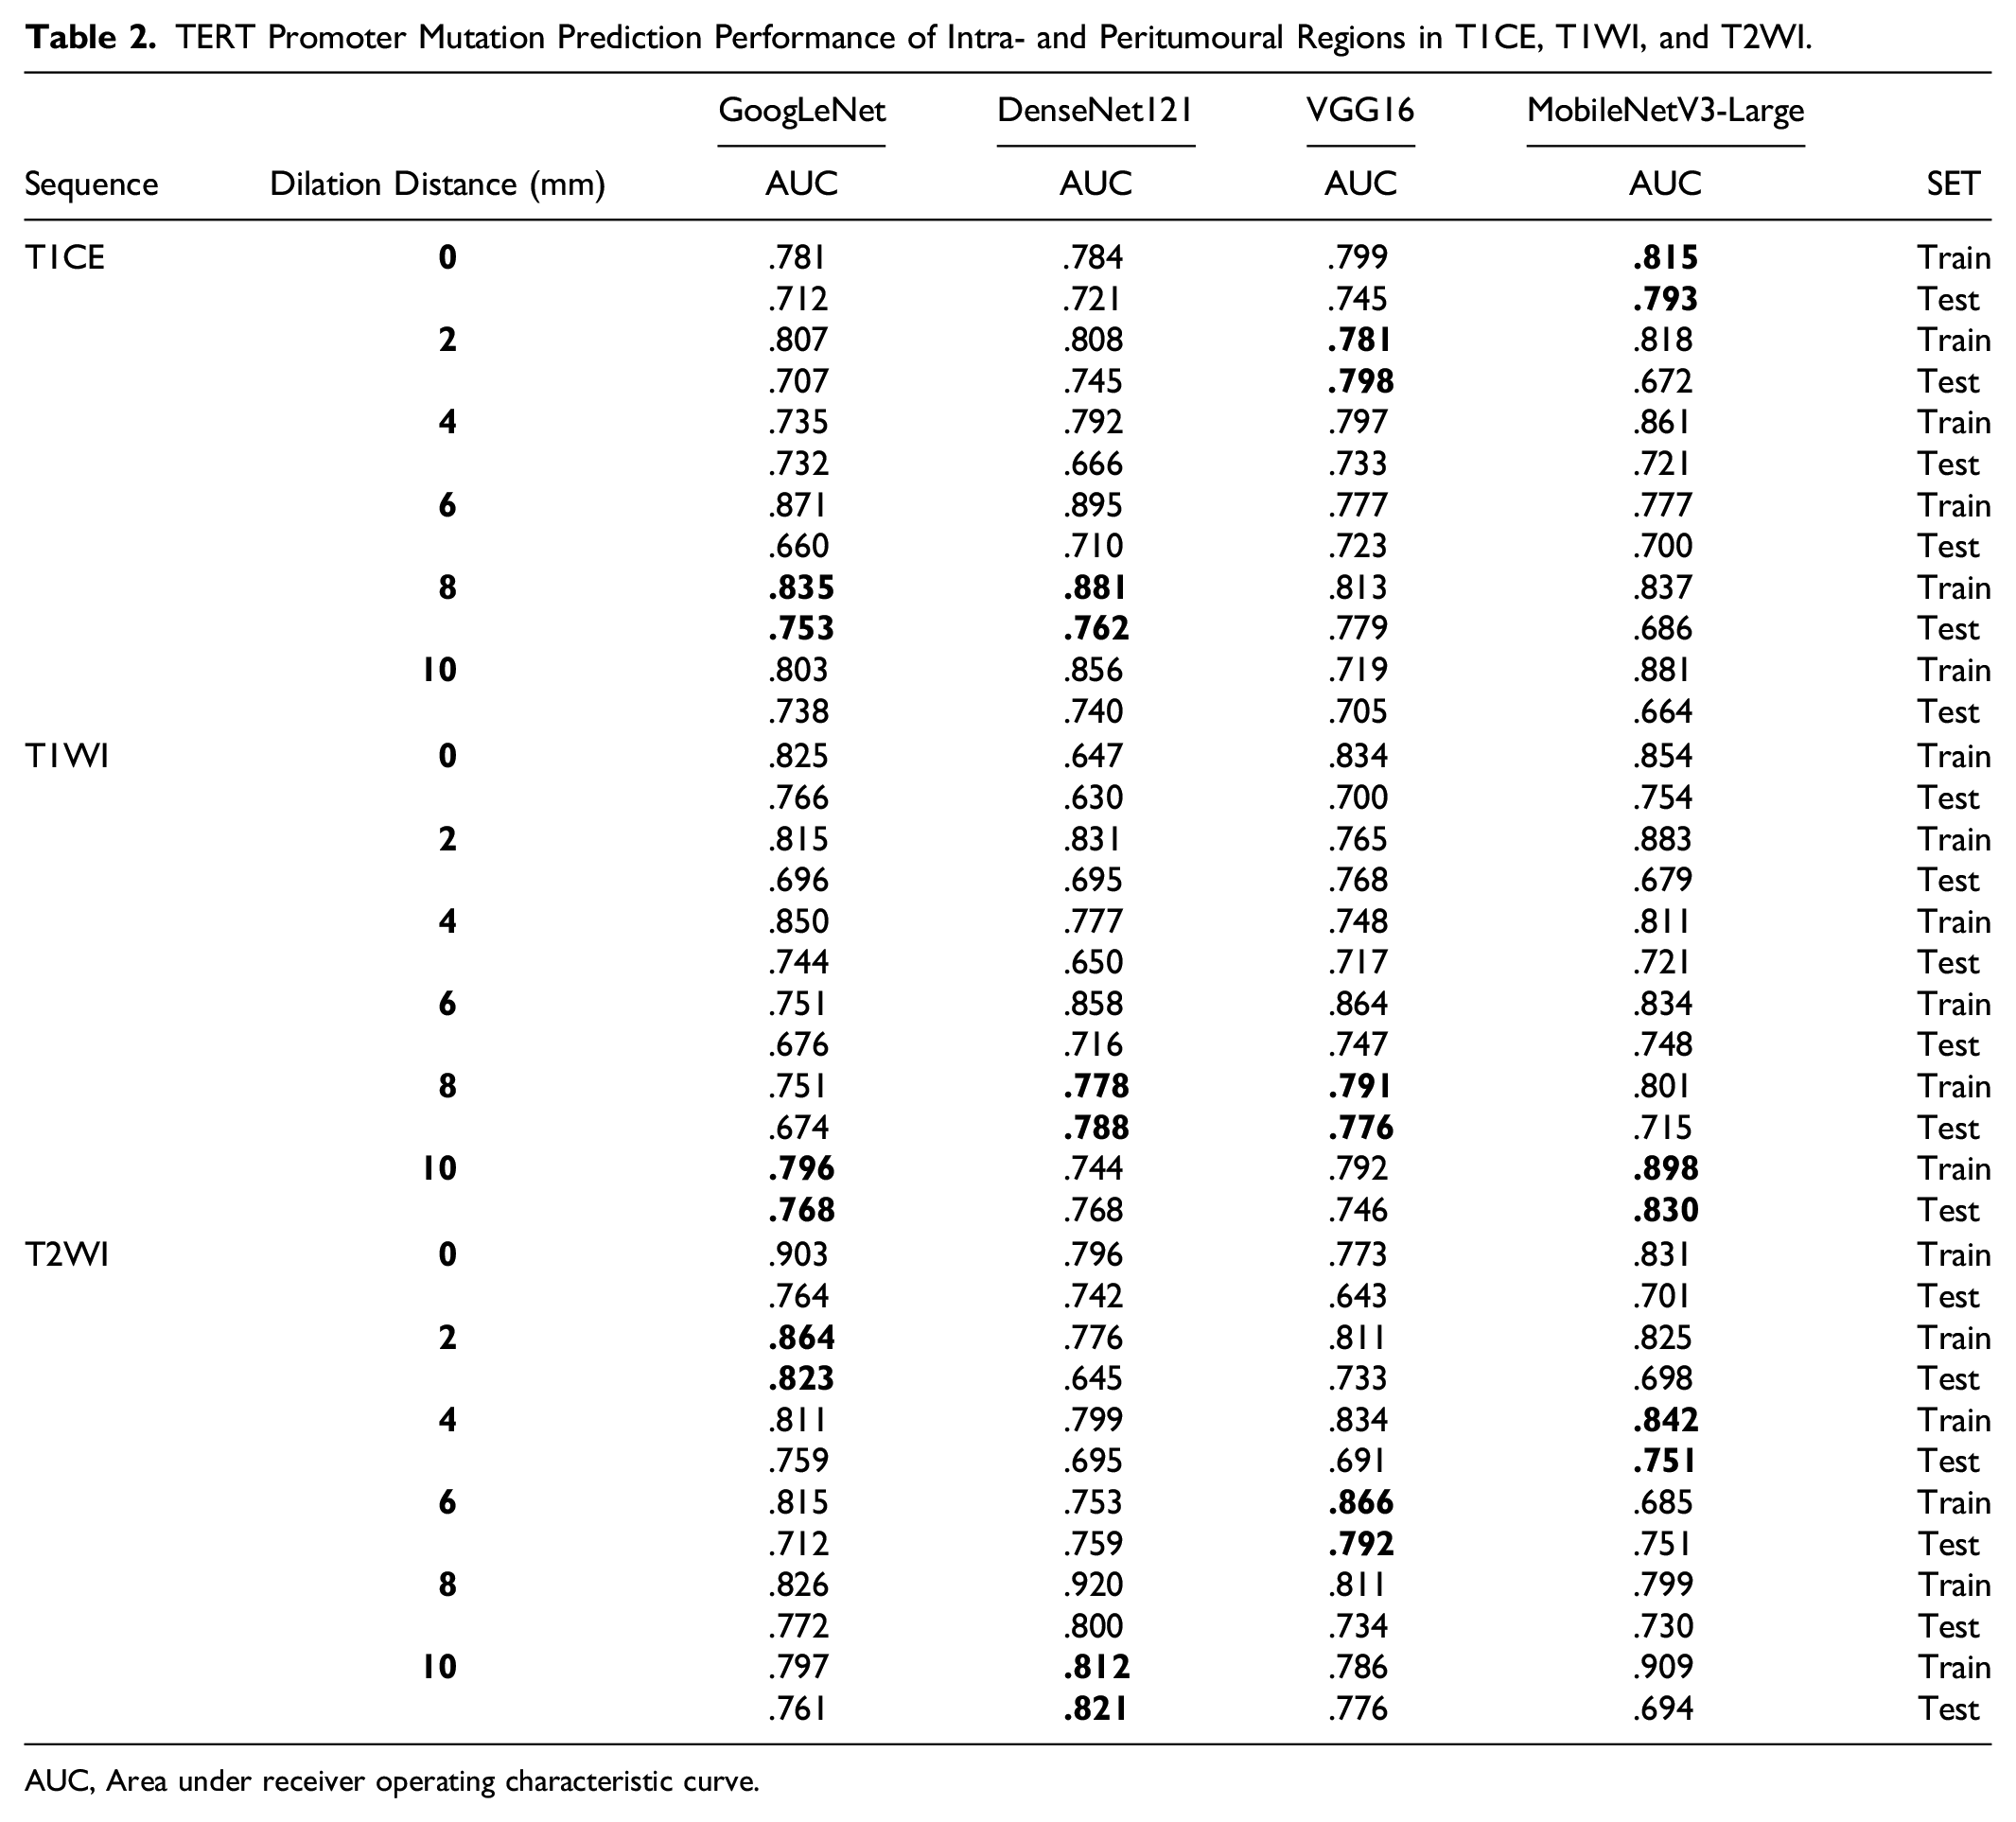
AUC, Area under receiver operating characteristic curve.
Evaluation of Different Multi-Parametric Fusion Strategies
Differentiated TERT Promoter Mutation Status Performance of Different Fusion Strategies in the Training and Test Sets.
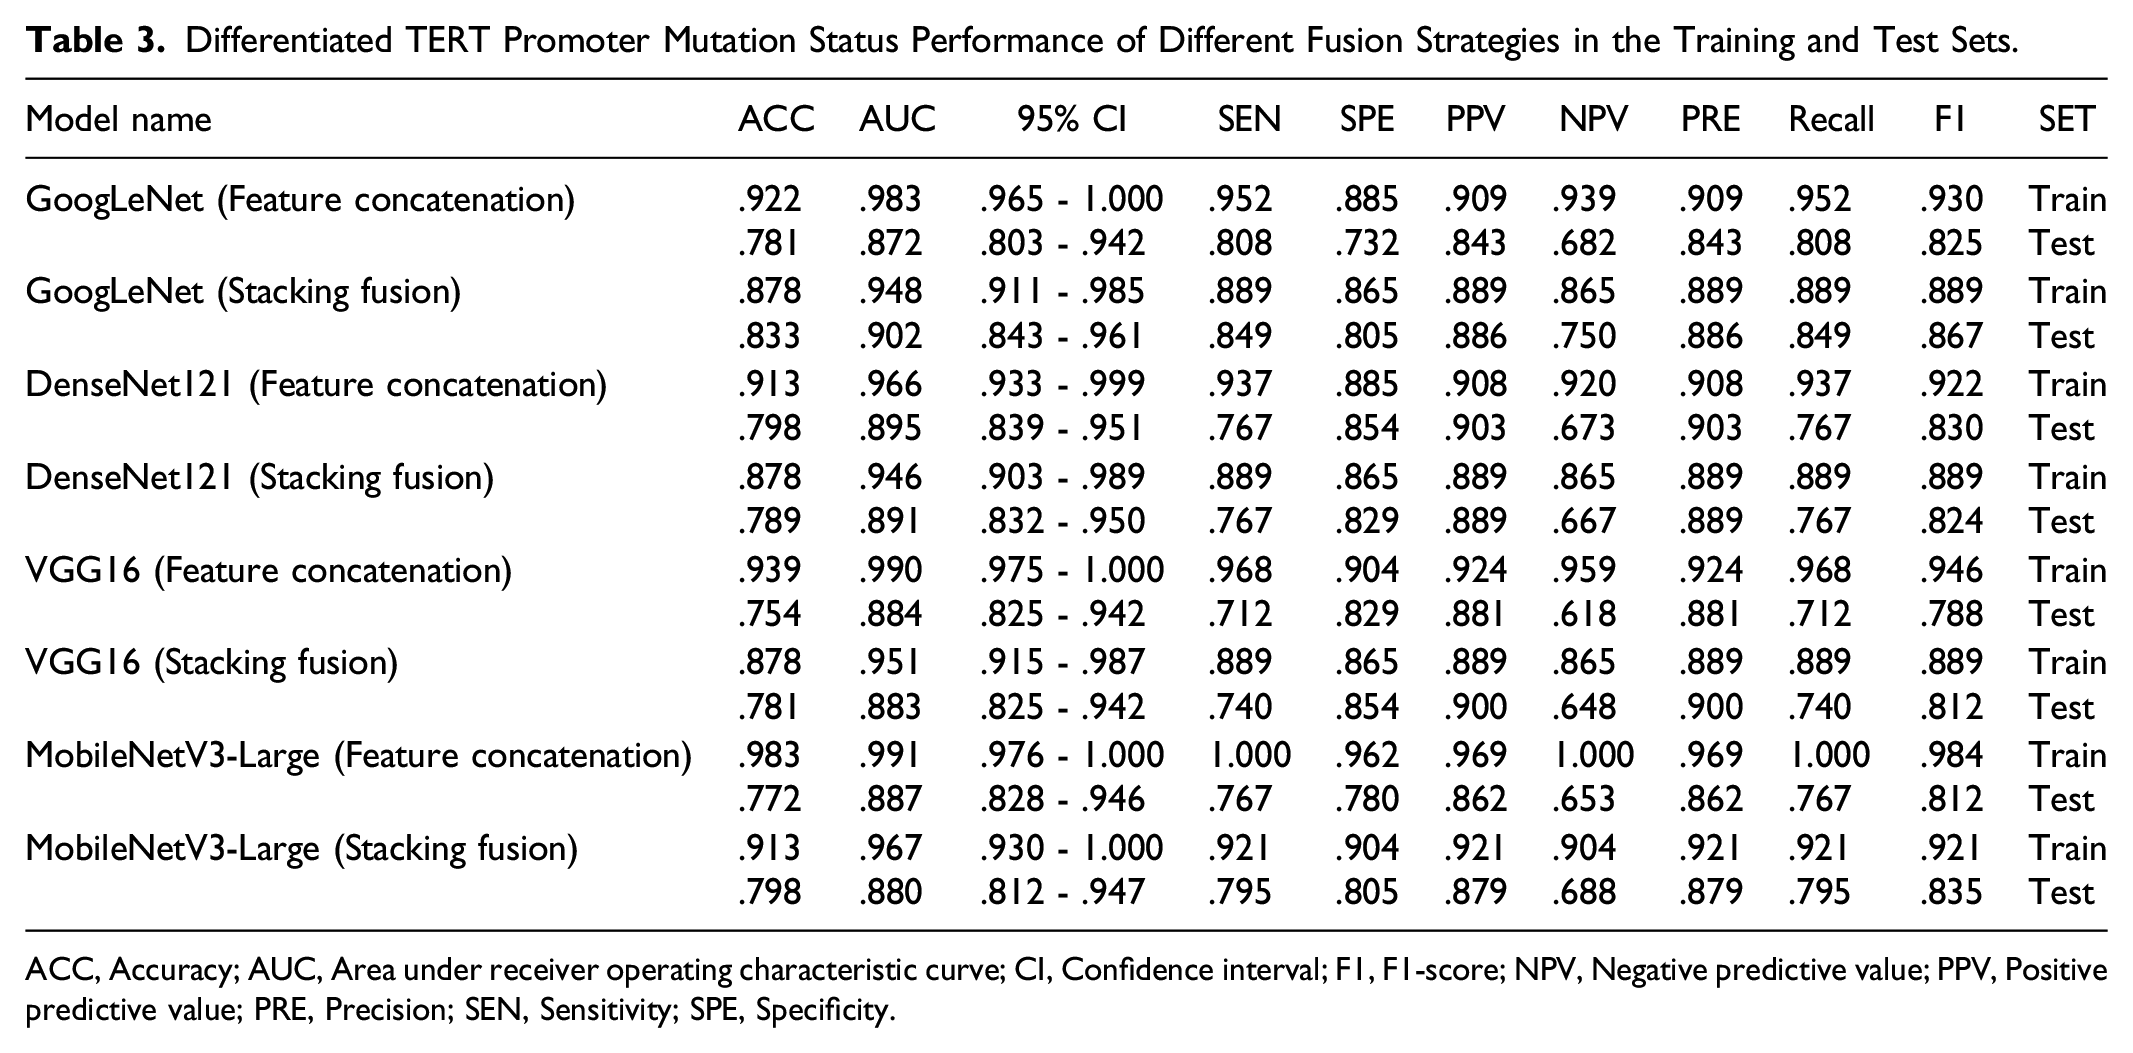
ACC, Accuracy; AUC, Area under receiver operating characteristic curve; CI, Confidence interval; F1, F1-score; NPV, Negative predictive value; PPV, Positive predictive value; PRE, Precision; SEN, Sensitivity; SPE, Specificity.
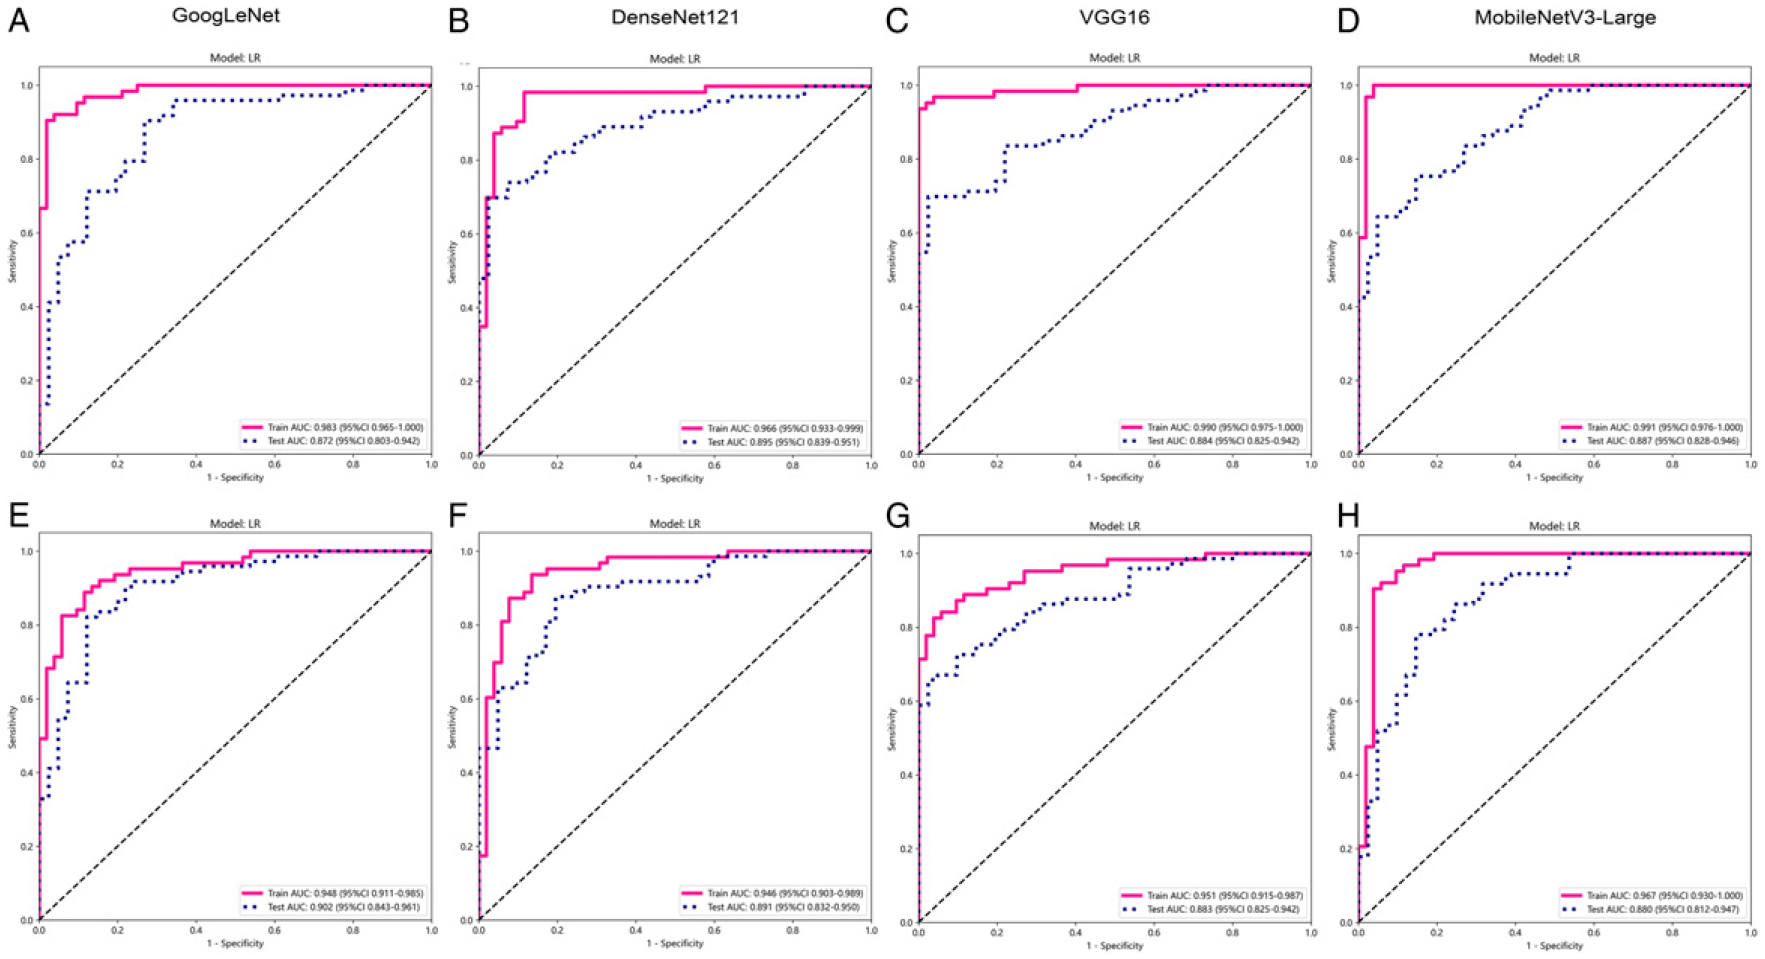
ROC curves by fusion strategy. ROC curves comparing the performance of models with different fusion strategies in the training and test sets. (A-D) Feature concatenation fusion; (E-H) Stacking fusion. ROC, Receiver operating characteristic; AUC, Area under the receiver operating characteristic curve.
Evaluation of Multi-Parametric DL Features
GoogLeNet FDLR Signatures Performance of Different Parameters in the Training and Test Sets.
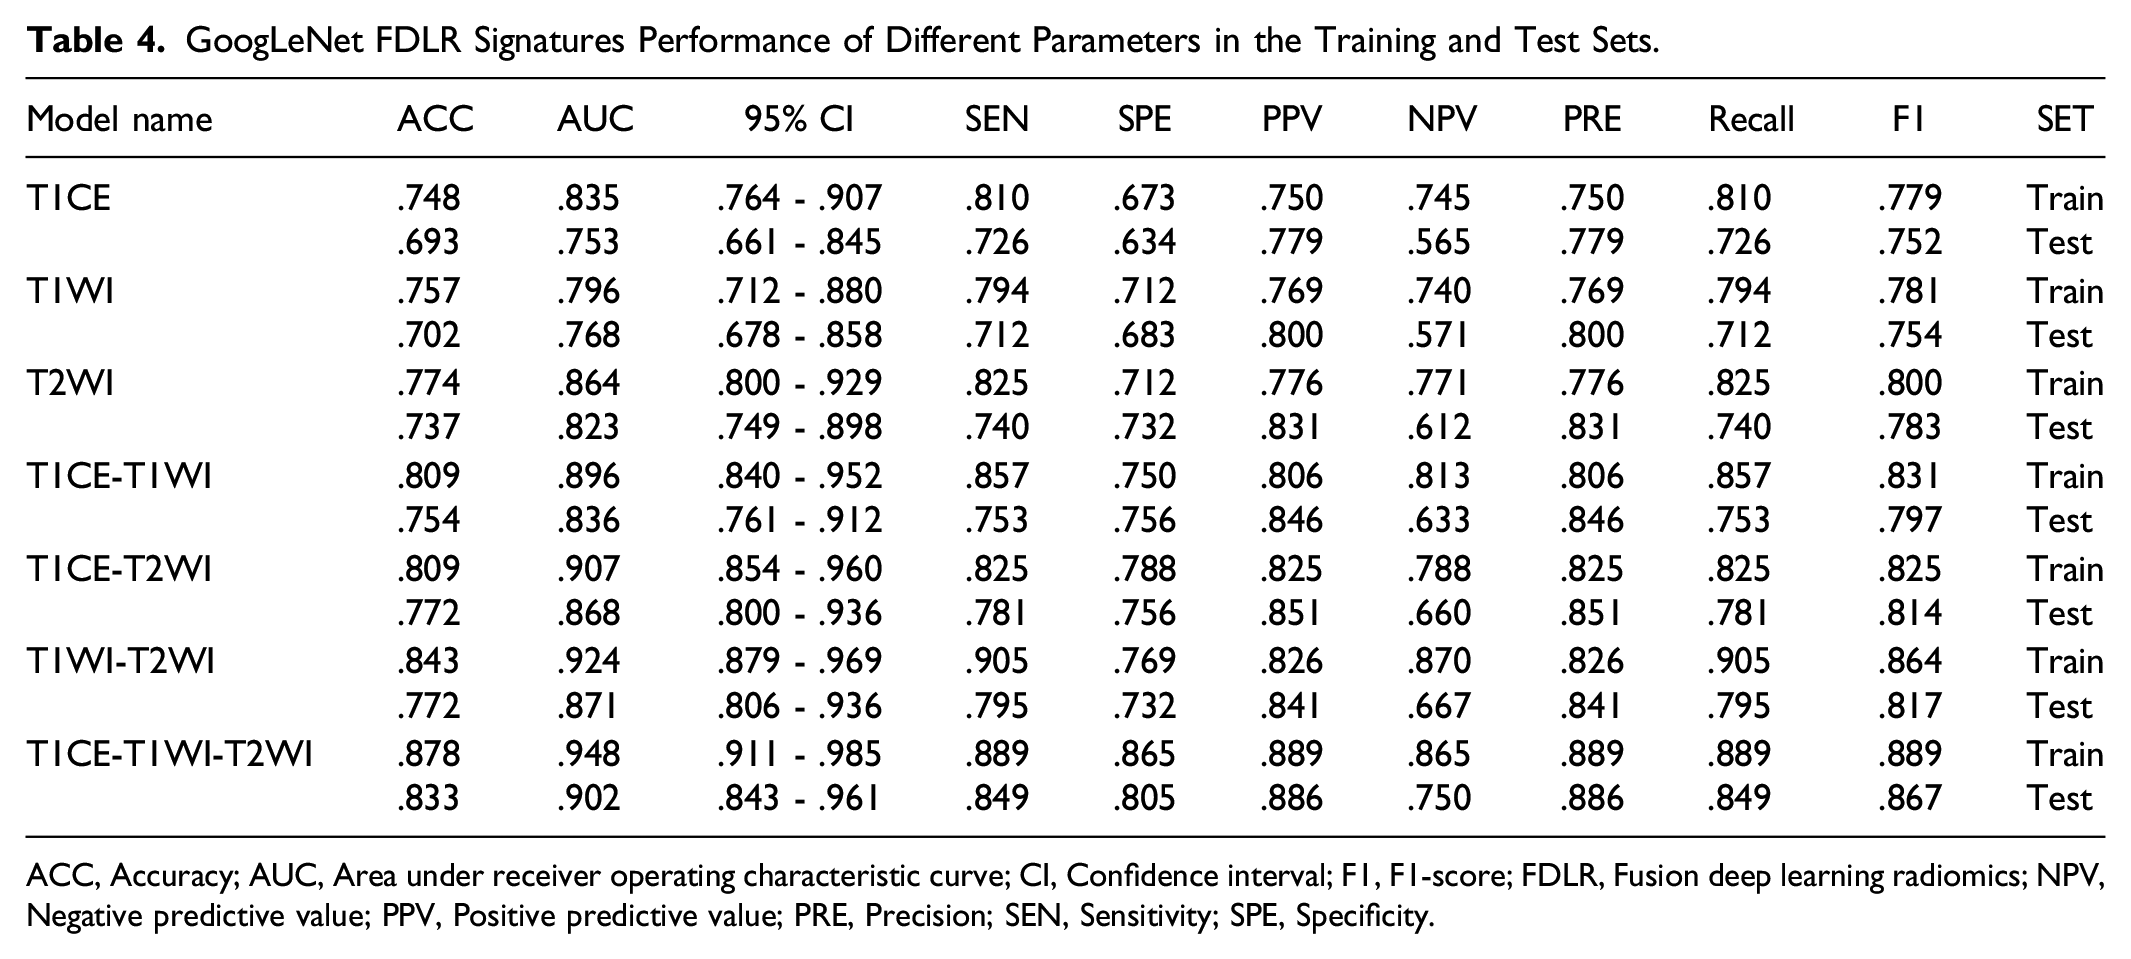
ACC, Accuracy; AUC, Area under receiver operating characteristic curve; CI, Confidence interval; F1, F1-score; FDLR, Fusion deep learning radiomics; NPV, Negative predictive value; PPV, Positive predictive value; PRE, Precision; SEN, Sensitivity; SPE, Specificity.
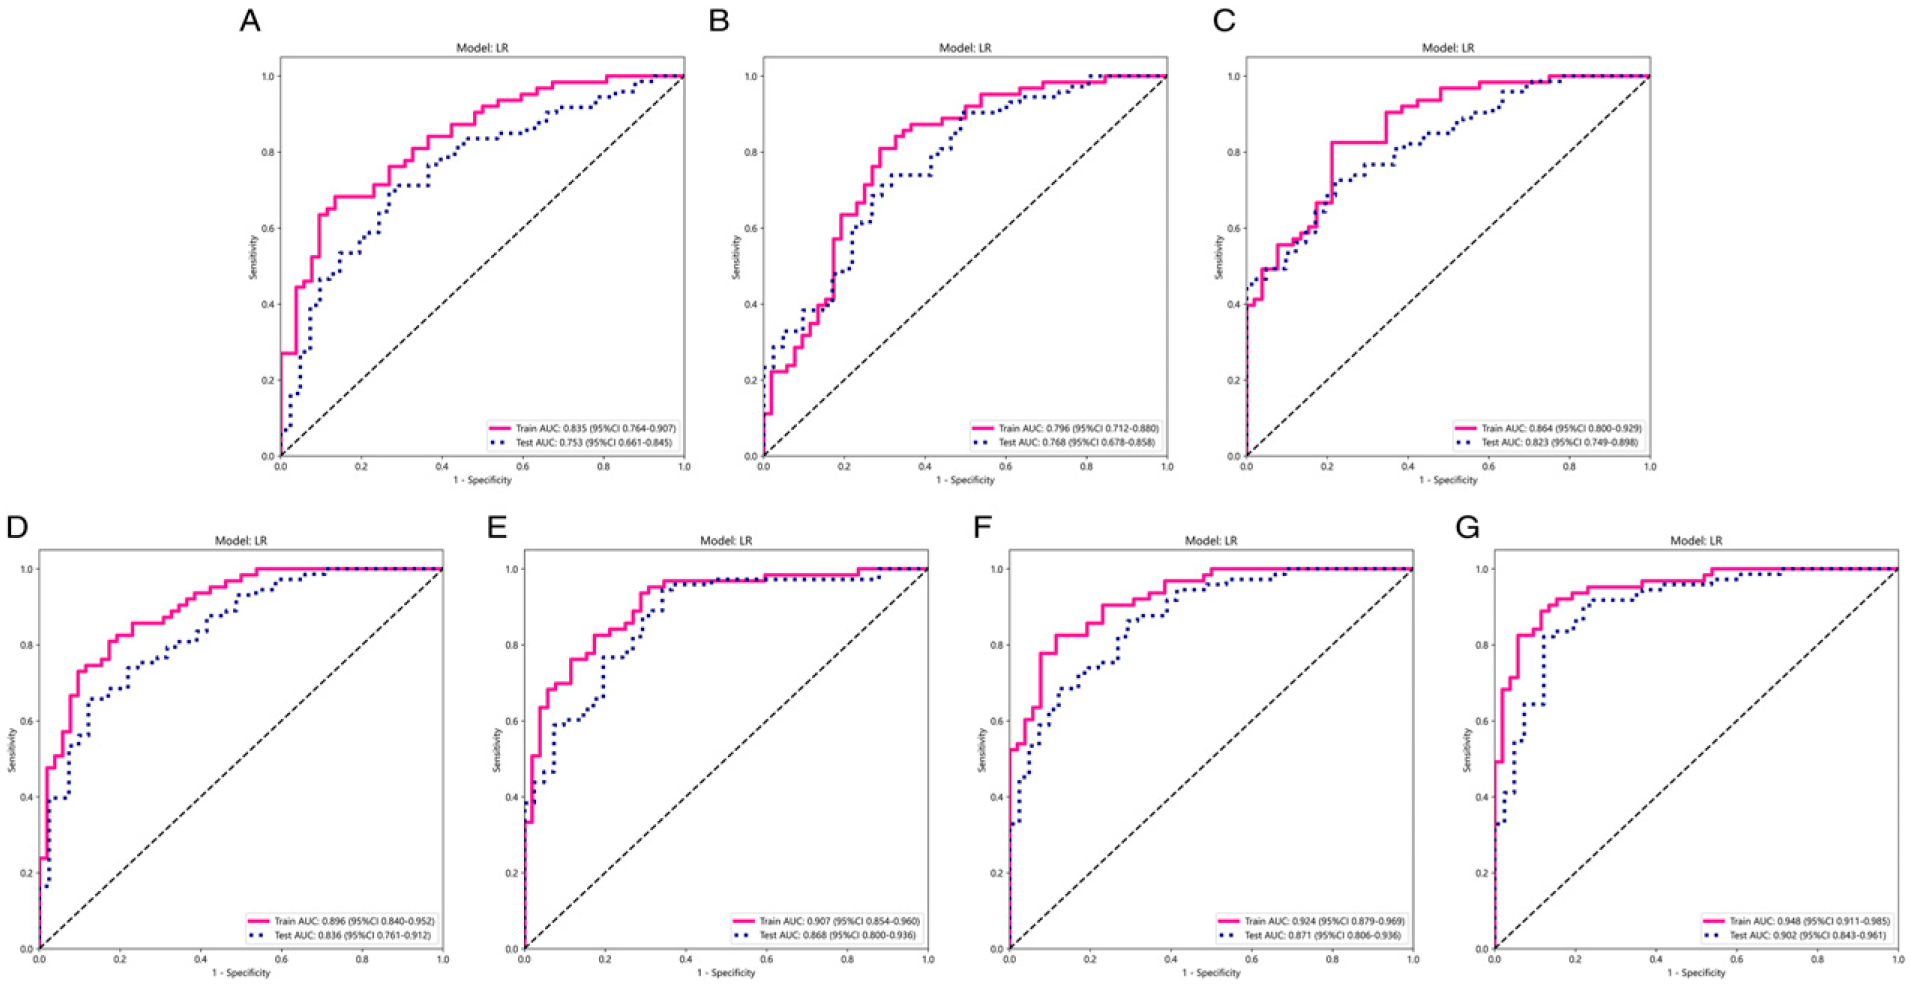
ROC curves by variable parameters. ROC curves comparing the performance of models with different parameters in the training and test sets. (a) T1CE; (b) T1WI; (c) T2WI; (d) T1CE-T1WI; (e) T1CE-T2WI; (f) T1WI-T2WI; (g) T1CE-T1WI-T2WI. ROC, Receiver operating characteristic; AUC, Area under the receiver operating characteristic curve; T1CE, contrast-enhanced T1-weighted image; T1W1, T1-weighted image; T2W1, T2-weighted image.
Discussion
In present study, we evaluated FDLR signature based on multi-parametric MRI to predict TERT promoter mutation status in GBM patients. In the T2WI, T1CE, and T1WI, the corresponding GoogLeNet DLR signatures with 2 mm, 8 mm, and 10 mm expansion distances outside the tumour core through stacking fusion showed good discriminative power in both the training (AUC = .948), and external test (AUC = .902) sets. In addition, the high sensitivity and specificity of the model test set for identifying TERT promoter mutation might benefit GBM patients by allowing individualized surgical plans.
In comparing the single-parameter and single-region DLR models, this study found that DLR signatures based on the DL features of the peritumoural region were better than those of the intratumoural region (tumour core) in determining TERT promoter mutation status. Peritumoural features have also shown adequate performances in other medical image-based diagnostic tasks. For instance, one study used radiomics features of the peritumoural region to predict lymph node metastasis in early non-small cell lung cancer and achieved good classification (AUC = .825), 24 whereas another study used stratified peritumoural features to construct a nomogram and achieved good results (AUC = .804) in predicting lymph node metastasis in early cervical cancer. 11 It is well known that the depth of GBM invasion often extends beyond the tumour contrast enhancement area into the peritumoural region. 18 Skogen et al. 25 used diffusion tensor imaging-based texture analysis to quantitatively analyze and evaluate the heterogeneity of tumour tissues and peritumoural edema in GBM and metastatic tumours. Whereas GBM and metastatic tumours showed no significant difference in solid tumour tissue heterogeneity, metastatic tumours had significantly greater peritumoural heterogeneity. 25 Therefore, the peritumoural area of GBM can provide valuable information about the tumour's biological characteristics.
Most models constructed by extracting DL features from four 2D CNNs models achieved valid results in predicting the presence of TERT promoter mutation. The discriminative power of predictive models using DL features was higher than those using radiomics and clinical features in most cohorts, 26,27 indicating that DL features incorporate additional information about important regions in the image, spatial tumour heterogeneity, and tumour microenvironment. 28 However, the first CNN training is prone to overfitting because the number of labelled medical images for a specific clinical problem is usually limited. Using pre-trained CNNs for feature extraction in the medical field has emerged as an effective way to address these difficulties. 29 Transfer learning can transfer prior knowledge of image features and apply it to novel medical images with better generalization, as verified in the present study. 14
Furthermore, the multi-parameter model outperformed the single parameter models in identifying the TERT promoter mutation in GBM patients. The models' performance improved as the number of MRI sequences increased. A previous study used T1WI, T1WI-T1CE, and T1WI-T1CE-T2WI for radiomics analysis and achieved AUCs of .722, .795, and .843, respectively. 30 Consistent with our findings, they found that the multimodal MRI-based model outperformed the bimodal and unimodal models potentially since multimodal or multi-parametric learning can aggregate information from multiple sources. With sufficient training data, the richer the modalities or parameters input, the more accurate the estimation of the representation space that can be achieved. 31
This study has some limitations. First, we selected the 2D image of the largest cross-section of the tumour instead of the entire tumour (3D) to extract DL features. The differences between 2D and 3D images may have affected some DL features. Therefore, DL feature extraction modeling based on images of the entire tumour is warranted in future studies. Second, we conducted a modeling analysis of only routinely used MRI sequences. Diffusion-weighted imaging (DWI), the apparent diffusion coefficient, and dynamic contrast-enhanced MRI (DCE-MRI) all have the potential to provide functional glioma information. 32 Therefore, adding DWI and DCE-MRI may further improve the model's accuracy. Third, the FDLR signature for identifying TERT promoter mutation was used to evaluate patient prognosis. However, the features included in the FDLR signature cannot distinguish between the high- and low-risk GBM groups. Therefore, further radiomic research on intra- and peritumoural features to predict patient prognosis is needed.
Conclusion
Our results suggest that there may be a role for the intra- and peritumoural DL features in the identification of the TERT promoter mutation in patients with GBM. We propose an FDLR signature based on the multi-parametric MRI intra- and peritumoural fusion that may help in the preoperative identification of the TERT promoter mutation in GBM and inform individualized patient treatment.
Supplemental Material
Supplemental Material - Peritumoral Radiomics for Identification of Telomerase Reverse Transcriptase Promoter Mutation in Patients With Glioblastoma Based on Preoperative MRI
Supplemental Material for Peritumoral Radiomics for Identification of Telomerase Reverse Transcriptase Promoter Mutation in Patients With Glioblastoma Based on Preoperative MRI by Hongbo Zhang, Beibei Zhou, Hanwen Zhang, Yuze Zhang, Yi Lei, and Biao Huang in Canadian Association of Radiologists Journal.
Footnotes
Acknowledgments
We appreciate Python technology provided by the Onekey AI platform.
Declaration of Conflicting Interests
The author(s) declared no potential conflicts of interest with respect to the research, authorship, and/or publication of this article.
Funding
The author(s) disclosed receipt of the following financial support for the research, authorship, and/or publication of this article: This study is supported by a grant from National Natural Science Foundation of China (Grant Number: 82071871) and Youth Exploration Fund of Shenzhen Health Economics Society of China (Grant Number: 202211).
Supplemental Material
Supplemental material for this article is available online.
References
Supplementary Material
Please find the following supplemental material available below.
For Open Access articles published under a Creative Commons License, all supplemental material carries the same license as the article it is associated with.
For non-Open Access articles published, all supplemental material carries a non-exclusive license, and permission requests for re-use of supplemental material or any part of supplemental material shall be sent directly to the copyright owner as specified in the copyright notice associated with the article.