
Abstract
Background
P-hacking, the tendency to run selective analyses until they become significant, is prevalent in many scientific disciplines.
Purpose
This study aims to assess if p-hacking exists in imaging research.
Methods
Protocol, data, and code available here https://osf.io/xz9ku/?view_only=a9f7c2d841684cb7a3616f567db273fa. We searched imaging journals Ovid MEDLINE from 1972 to 2021. Text mining using Python script was used to collect metadata: journal, publication year, title, abstract, and P-values from abstracts. One P-value was randomly sampled per abstract. We assessed for evidence of p-hacking using a p-curve, by evaluating for a concentration of P-values just below .05. We conducted a one-tailed binomial test (α = .05 level of significance) to assess whether there were more P-values falling in the upper range (e.g., .045 < P < .05) than in the lower range (e.g., .04 < P < .045). To assess variation in results introduced by our random sampling of a single P-value per abstract, we repeated the random sampling process 1000 times and pooled results across the samples. Analysis was done (divided into 10-year periods) to determine if p-hacking practices evolved over time.
Results
Our search of 136 journals identified 967,981 abstracts. Text mining identified 293,687 P-values, and a total of 4105 randomly sampled P-values were included in the p-hacking analysis. The number of journals and abstracts that were included in the analysis as a fraction and percentage of the total number was, respectively, 108/136 (80%) and 4105/967,981 (.4%). P-values did not concentrate just under .05; in fact, there were more P-values falling in the lower range (e.g., .04 < P < .045) than falling just below .05 (e.g., .045 < P < .05), indicating lack of evidence for p-hacking. Time trend analysis did not identify p-hacking in any of the five 10-year periods.
Conclusion
We did not identify evidence of p-hacking in abstracts published in over 100 imaging journals since 1972. These analyses cannot detect all forms of p-hacking, and other forms of bias may exist in imaging research such as publication bias and selective outcome reporting.
Introduction
Publication bias in scientific literature arises when the dissemination of research findings is impacted by the nature and direction of results. Sources of researcher-driven publication bias include inflation bias (also known as p-hacking) 1 and selection bias. 2 P-hacking involves the manipulation or selective reporting of results within studies. Practices leading to p-hacking include fitting multiple models to the same dataset in an attempt to obtain affirmative estimates, 3 deciding to include or drop outliers post-analysis, 1 and ceasing data exploration if analysis yields a significant P-value. 1 Whereas selection bias operates across studies, which can include decisions by a study’s investigators to entirely withhold the study from submission to journals, as well as decisions by journal editors and reviewers. 3 This study focuses on p-hacking in a manner that does not include the effects of selection bias.
A p-curve describes the distribution of P-values for a group of studies. 1 P-curves have been adopted as a tool to assess the reliability of evidence in various scientific fields4,5 and can be used to detect publication bias. This is illustrated as a sharp drop in the p-curve for values above the significance level. While a discontinuity in the p-curve around the significance level suggests publication bias, it does not differentiate between selection bias and p-hacking. 1
One application of the p-curve is to detect the presence of p-hacking with respect to significant P-values.
6
Under certain assumptions about the mechanism of p-hacking (as described below), if p-hacking is conducted such that a nonsignificant result is turned into a significant one (e.g., because investigators conduct subsequent tests until they obtain a significant result), then the p-curve’s shape may be notably changed close to the significance level (usually P = .05). As a result, when these forms of p-hacking have occurred, a p-curve may have an excess of P-values just below the significance level. If there is no true effect, p-hacking will shift the p-curve from being flat to left skewed (Fig. 1A).
1
If, however, there is a true effect, the p-curve may be right skewed (i.e., distribution with tail on right side), and p-hacking may introduce an overabundance of P-values in the tail distribution just below the significance level (Fig. 1B).
1
Discontinuity in the p-curve around significance level is present in both p-hacking and selection bias, but only p-hacking will demonstrate an overrepresentation of P-values just below the significance level.
7
Hypothetical distributions of effects across studies and the effect of p-hacking on the p-curve. Adapted from Head et al1. Copyright: © 2015 Head et al. This is an open access article distributed under the terms of the Creative Commons Attribution License, which permits unrestricted use, distribution, and reproduction in any medium, provided the original author and source are credited. (A) Black line—the hypothetical distribution of P-values is uniform when the effect size for a studied phenomenon is zero; red line—the effect of p-hacking shifts the distribution from being flat to left skewed. (B) Black line—the hypothetical distribution of P-values is exponential with right skew when the true effect size is nonzero; red line—the effect of p-hacking results in an exponential distribution with right skew, but there is an overrepresentation of P-values in the tail of the distribution just below the significance threshold (P = .05).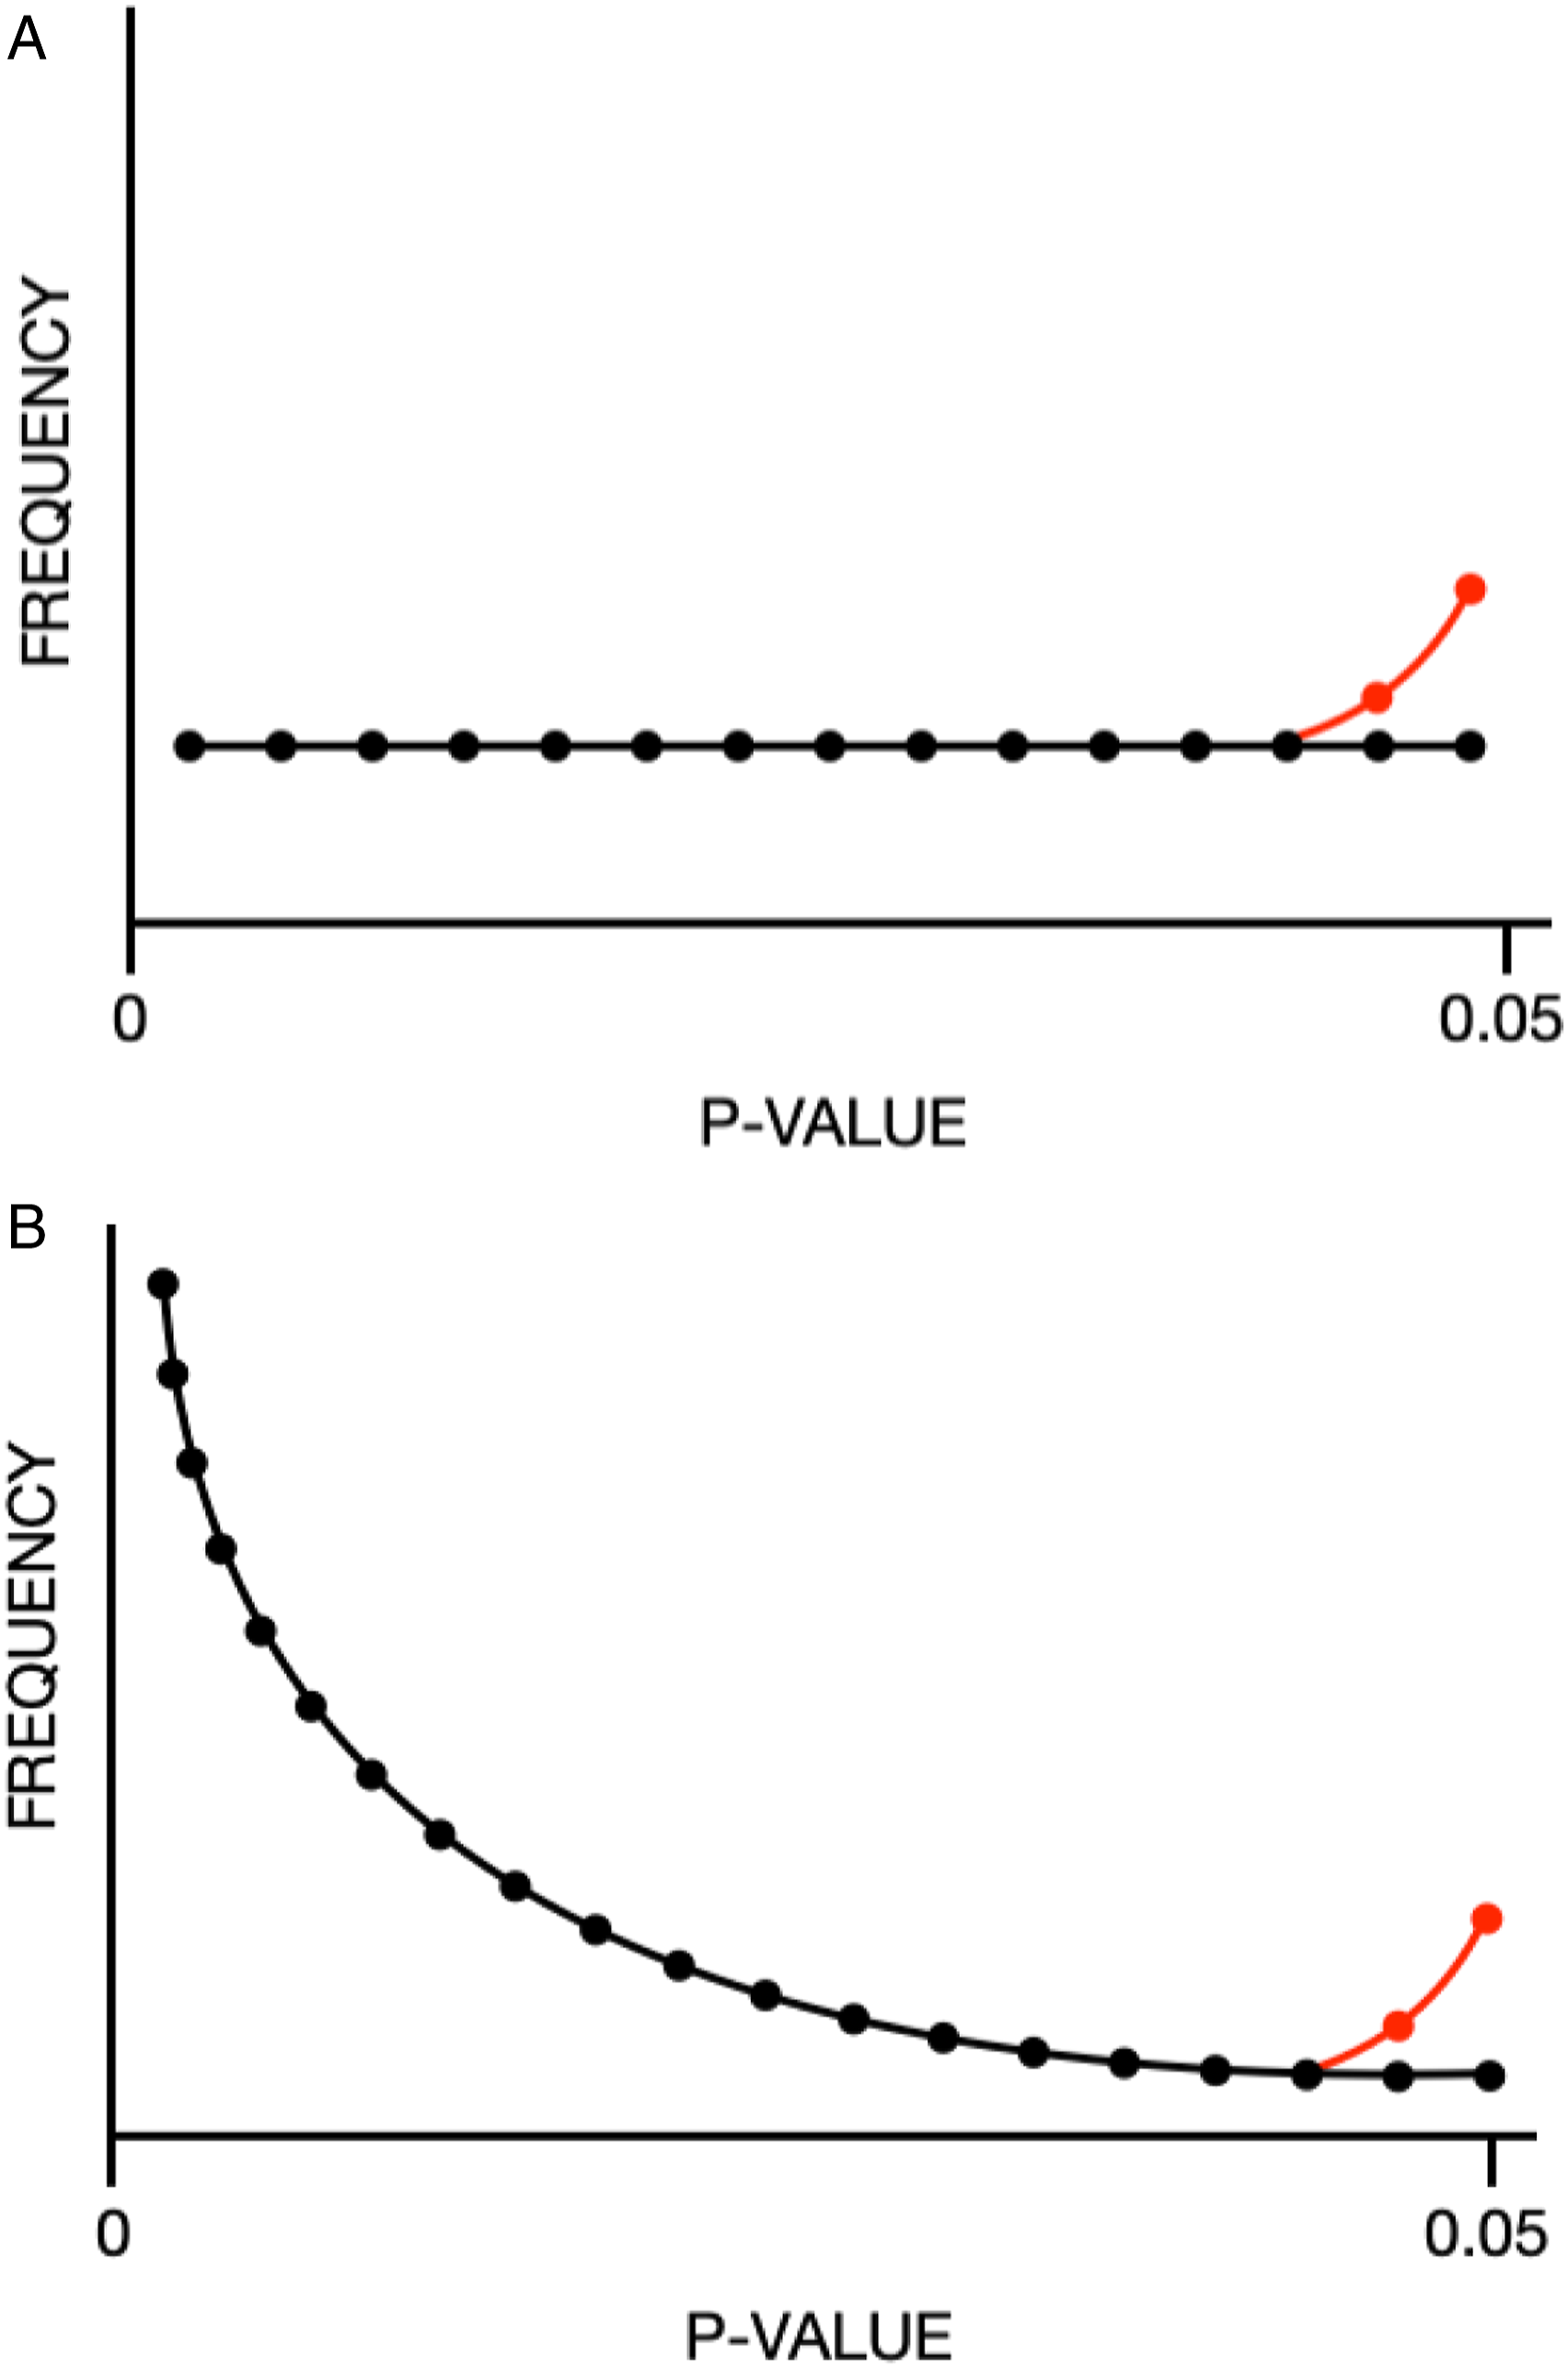
The p-curve can also be used to examine whether a set of findings provides evidence for true effects by examining the distribution of P-values between 0 and .05. Effect refers to the underlying population effects across studies. When the true effect size is zero, every P-value is equally likely to be observed. On the other hand, when true effect size is strong, researchers are more likely to obtain very small P-values (i.e., P <.001) rather than moderate P-values (i.e., .01) or non-significant P-values (P >.05). As true effect size increases, the p-curve demonstrates a greater right skew. Overall, the shape of the p-curve is dependent on the distribution of true effects and the extent of p-hacking. 4
Previous research in fields outside of imaging has identified publication bias in the forms of both preferential publication of studies with significant P-values and selective reporting of significant P-values by researchers.1,8-12 With respect to imaging research, reporting biases involving favorable diagnostic accuracy findings have been documented in the form of publication bias and citation bias,13-17 and there can be considerable flexibility in analyses. 18 Studies with higher accuracy estimates are cited more frequently than those with lower accuracy estimates 17 and show a weak association with shorter time to publication. 13 Studies with positive titles or conclusions are cited more frequently, 14 while only studies with positive conclusions were associated with shorter time to publication. 15
Selective reporting of significant P-values within studies (a.k.a “p-hacking”) has only been assessed in a handful of radiology papers. These studies have a limited sample size of journals, and the results are conflicting.8,19-21 P-hacking has yet to be explored in imaging research broadly. The aim of this study is to determine if there is evidence of p-hacking in imaging research.
Methods
This is a retrospective meta-research study of published imaging research. The methods of this study are modeled after Head et al. 1 Research ethics board approval was not required due to the nature of this study (use of public domain data) at our institution. The study protocol is preregistered, and source data is posted on the Open Science Framework (OSF) at https://osf.io/xz9ku/?view_only=a9f7c2d841684cb7a3616f567db273fa.
Search Strategy
A list of imaging journals was identified using Web of Science. A search with this list was conducted in Ovid MEDLINE 22 with the assistance of a librarian. Keywords were also used to search titles of journals that may not have been included in Web of Science. List of keyword search terms is as follows: radiol* OR imaging OR ROENTGENOLOG* OR nuclear. All duplicate abstracts were excluded. Any arising disputes concerning the search were resolved through consensus by all the researchers involved (AA, BB, CC, and DD). For the full list of journals included in this study, see Appendix 1.
Data Extraction and Management
Text mining was used to search imaging-related abstracts exported from Ovid MEDLINE. 22 A Python (version 3.9.4) 23 script was used to collect metadata regarding journal name (source), unique identifier, year of publication, article title, abstract, and P-values (numbers in the range 0–1 that were preceded by “p =”, “p <”, “p >”, “p ≤,” or “p ≥” regardless of spacing or capitalization) from abstracts for each included study. The extremes of P-values reported in ranges (e.g., “P = .02 – .04” would lead to extraction of P = .02 and P = .04) were taken for the purpose of analysis. Taking the extremes of a given range guarantees that the P-values used for analysis were in the original distribution. Data were collected and managed in Microsoft Excel (version 16.49). Python libraries, such as Beautiful Soup (http://www.crummy.com/software/BeautifulSoup/bs4/doc/), were used to clean and parse the extracted P-values from the abstracts.
The extraction process was piloted, and results were verified by manually extracting P-values from 500 abstracts, selected chronologically from the search result. This was used to optimize the automated extraction process.
In this study, a subset of the full dataset is used. Because papers sometimes reported multiple P-values in the abstract, we randomly sampled one P-value per abstract. Sampling of P-values was randomized using the random sample function in R. For the main analyses, randomly sampled P-values reported as “p =” were included, and P-values “<.001” were assigned a value of “=.0001” prior to inclusion. A sensitivity analysis excluding P-values reported as “P <.001” was also performed. The sensitivity analysis is conducted to determine the effect of including very small P-values (i.e., “<.001”) on the results. Restricting our analysis by only including exact P-values (i.e., “p=”) makes testing for p-hacking more conservative, as it is not known where P-values reported as inequalities should be placed. The data are filtered prior to running the analysis. The filtering process includes P-values that are <.05, have equality expression (i.e., “p=”), and are in the range we have designated for the p-hacking analysis (i.e., .04 < P < .05). This is summarized in Figure 2. Filtering process. The number of journals, abstracts, and P-values included after each step in the filtering process is outlined above. This process includes P-values that are <.05, have equality expression (i.e., p = ), are in the range we have designated for the p-hacking analysis (e.g., .04 < P < .05), and random sampling of one P-value per abstract.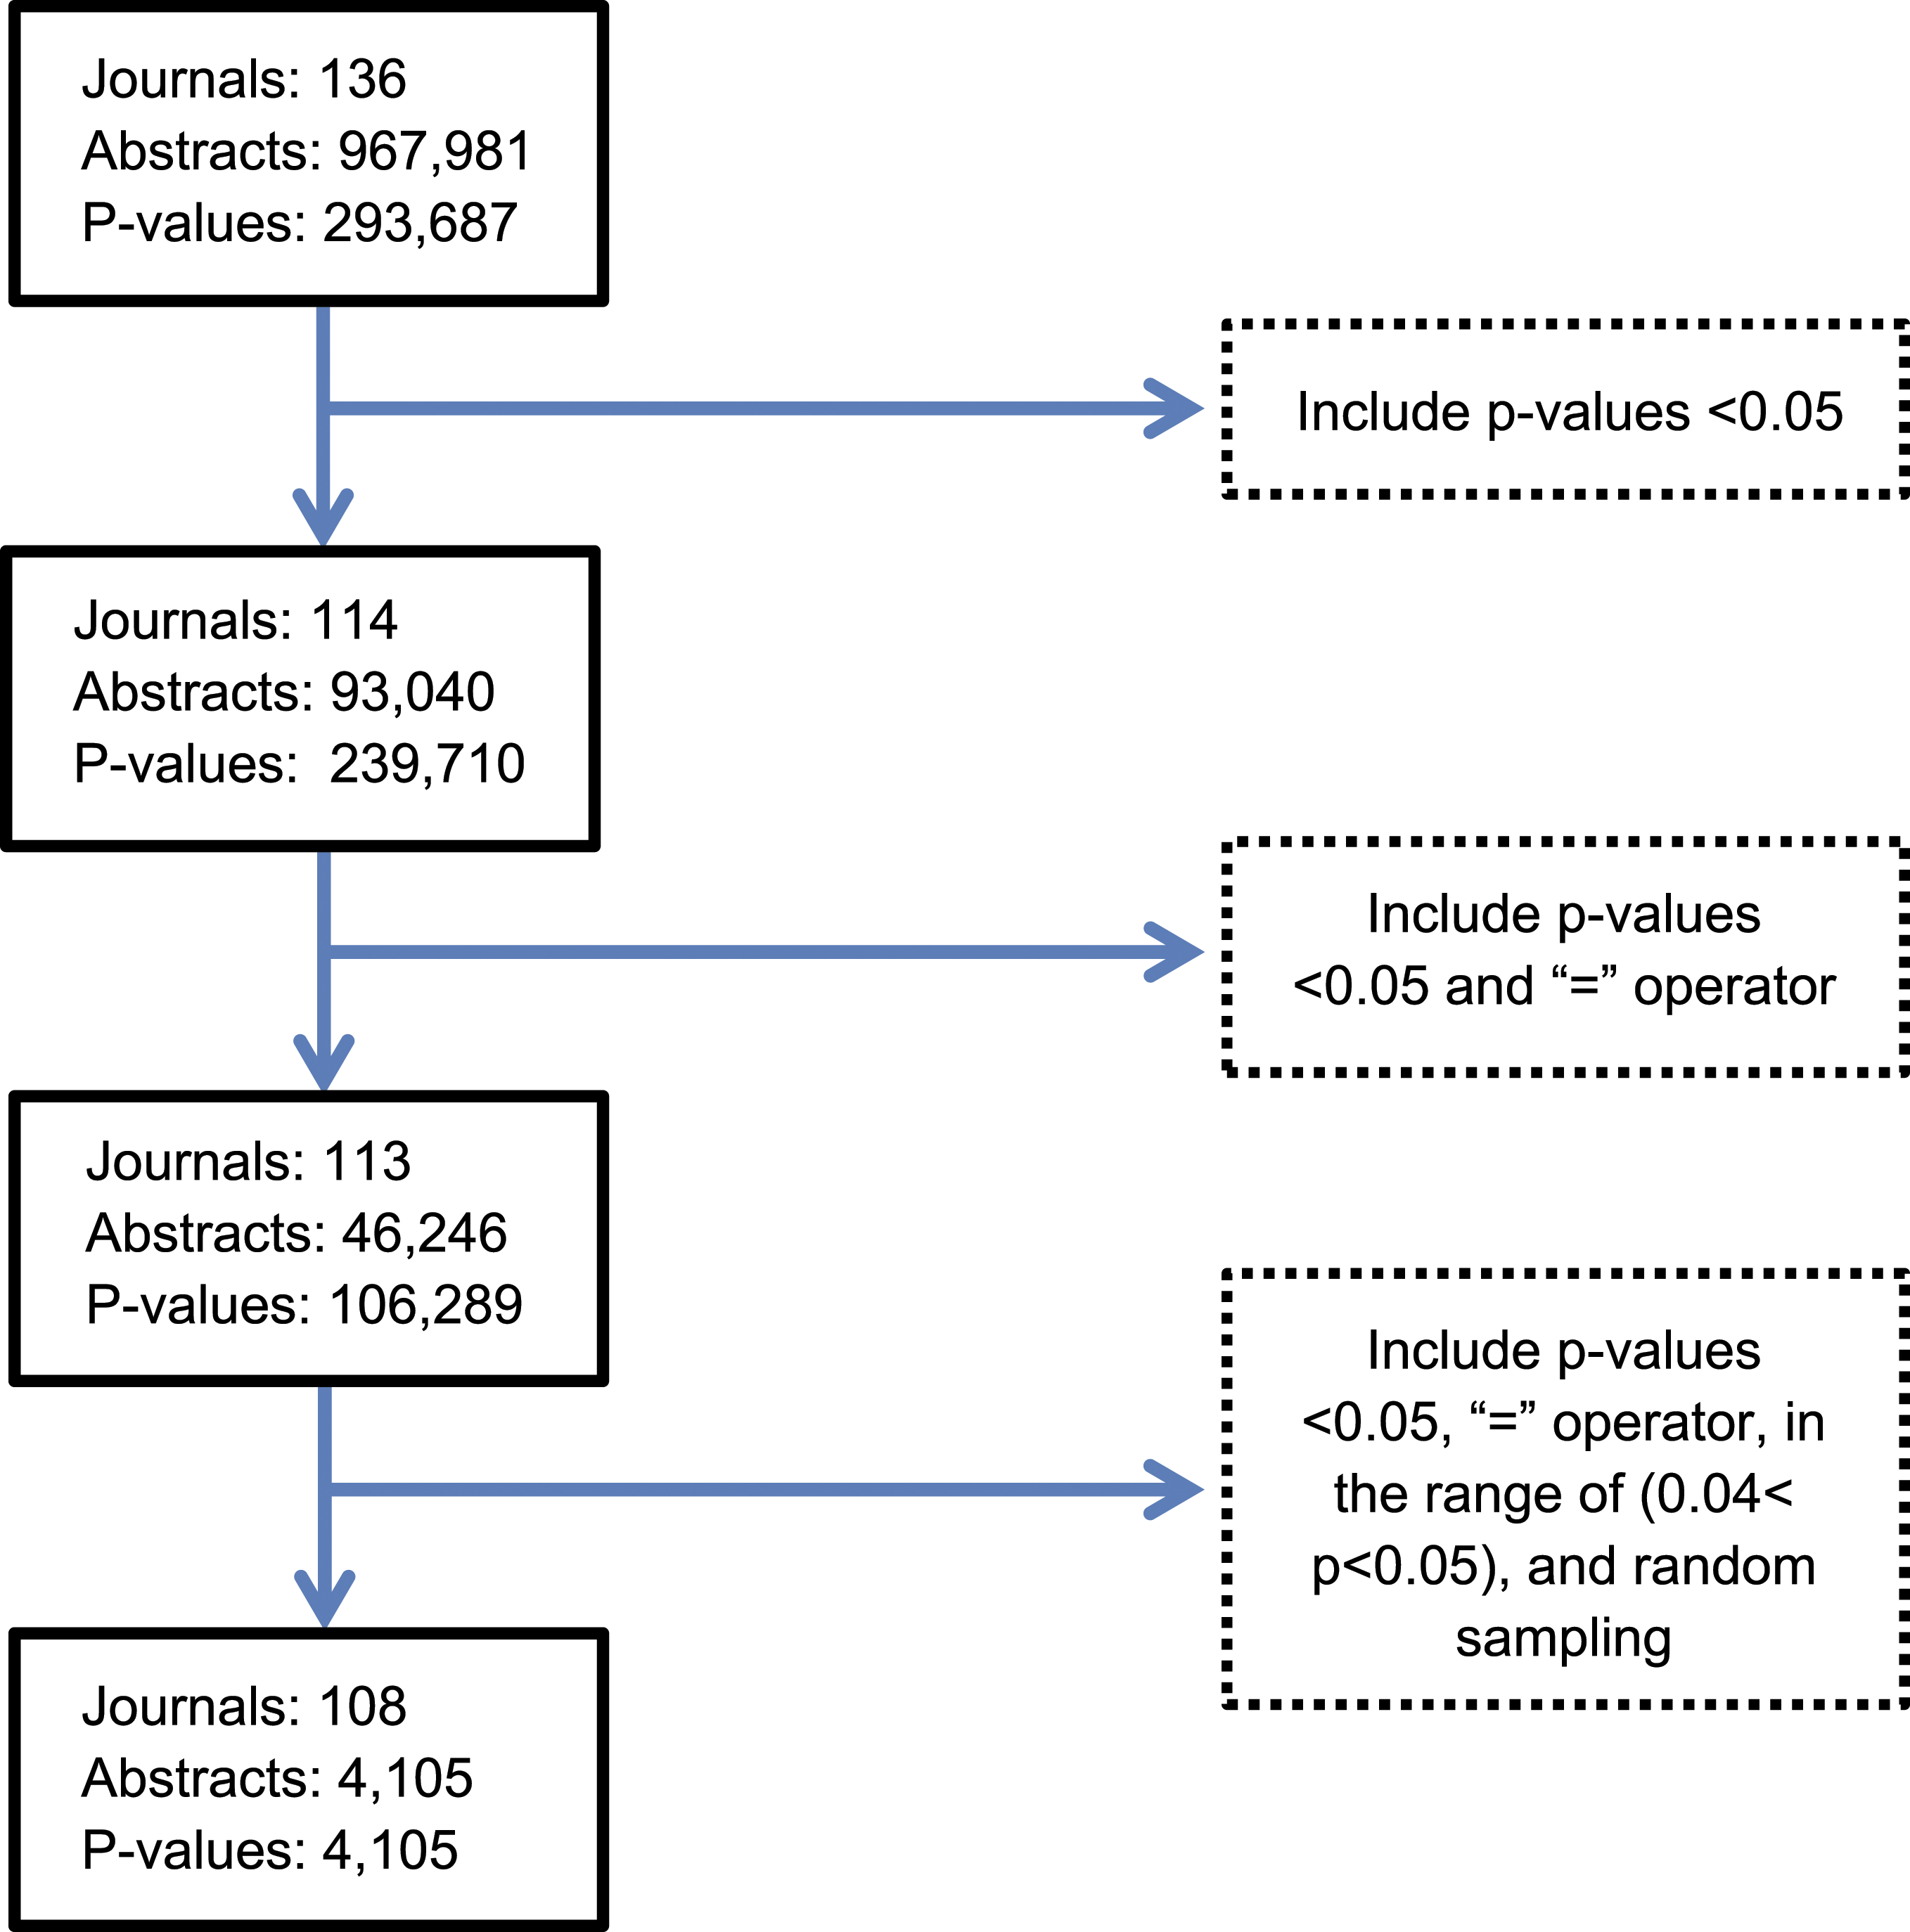
Statistical Analysis
P-curves were constructed from the extracted P-values to evaluate the distribution of P-values for biased proportions of significant P-values and the distribution of study effects. A p-curve with a high proportion of values just below (e.g., .045 < P < .05) the perceived threshold of significance (generally P = .05) was interpreted as evidence of p-hacking.
To detect p-hacking in the primary analysis, we assessed whether P-values falling in the range .04 < P < .05 tended to concentrate just below .05. We conducted a one-tailed binomial test to assess whether, among P-values falling in the range .04 < P < .05, there were more P-values falling in the upper half of this range (e.g., .045 < P < .05) than in the lower half of the range (e.g., .04 < P < .045). To assess variation in results introduced by our random sampling of a single P-value per abstract, we repeated the random sampling process 1000 times, performed each main analysis for each random sample, and pooled results across the samples using the harmonic mean P-value. 24
In the secondary analysis, we test for the distribution of effects across studies in our text-mined dataset; binomial tests were performed to compare the numbers of P-values falling in the range 0 ≤ P < .01 vs in the range .01 ≤ P < .02. These ranges were used because they are far away from .05 making it less likely to capture p-hacking. To detect distribution of study effects, a two-tailed sign test was used to compare the number of P-values falling in the range 0 ≤ P < .01 vs in the range .01 ≤ P < .02. A significantly higher number of P-values in the lower range than the upper range was interpreted as evidence of a nonzero mean effect size. Conversely, a significantly higher number of P-values in the upper bin was interpreted as evidence of a zero mean effect size. The P-value distribution was examined visually in its entirety, alongside any statistical tests.
Lastly, to test for trends in p-hacking over time, a time trend analysis was conducted. This involved performing the p-hacking analysis using the harmonic mean P-value 24 on our text-mined data split into discrete 10-year periods. This interval was chosen to capture the subtleties in changes of p-hacking overtime while being broad enough to achieve adequate power.
All analyses were performed by study authors (AK, PR, and EL) using the binom.test function in the stats package in R (R Core Team, version 4.1.2; R foundation for Statistical Computing). 25
Results
Our search of 136 journals from 1972 to 2021 identified 967,981 abstracts. Text mining identified 293,687 P-values. The number of journals and abstracts that were included in the analysis as a fraction and percentage of the total number was, respectively, 108/136 (80%) and 4105/967,981 (.4%). A total of 4105 randomly sampled P-values were included in the p-hacking analysis.
Pilot Analysis
The pilot analysis yielded a low error rate: of the 459 P-values extracted manually, we found only 11 cases in which the script failed to extract a reported P-value (2% false negative rate). Of these, two were due to a typographical error (e.g., “P<0.001”) and the rest were due to our script being unable to parse certain formatting (e.g., “Pcorrected < .001”). We also found 1 false positive (.22% false positive rate), which involved our script recording P-values from papers that describe alpha values in terms of a P-value threshold (e.g., “statistical significance was taken as P < .05”).
P-hacking Analysis
Test for p-hacking in imaging research, using P-values obtained from the Abstract.
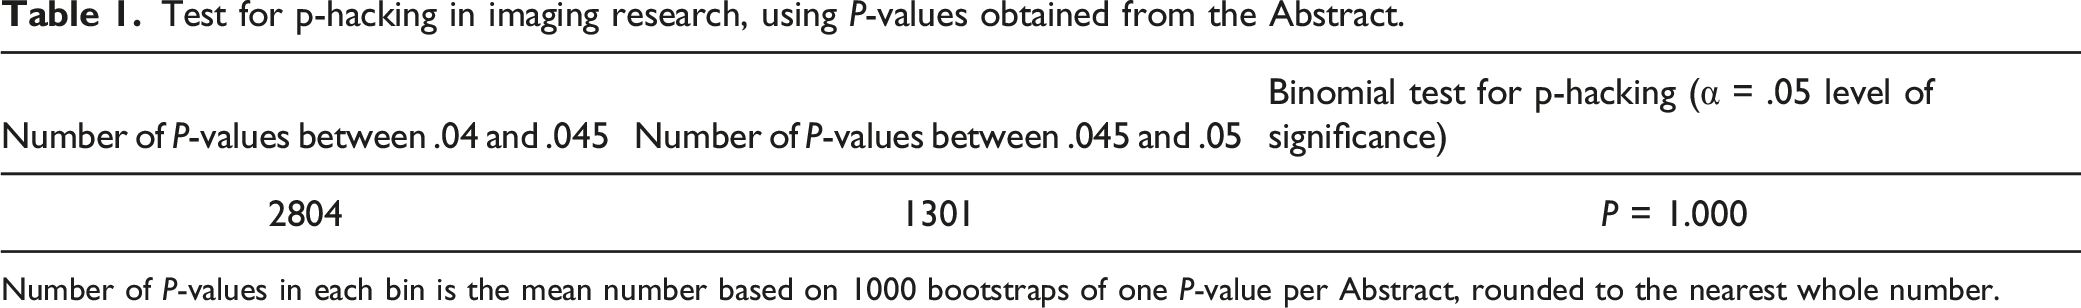
Number of P-values in each bin is the mean number based on 1000 bootstraps of one P-value per Abstract, rounded to the nearest whole number.
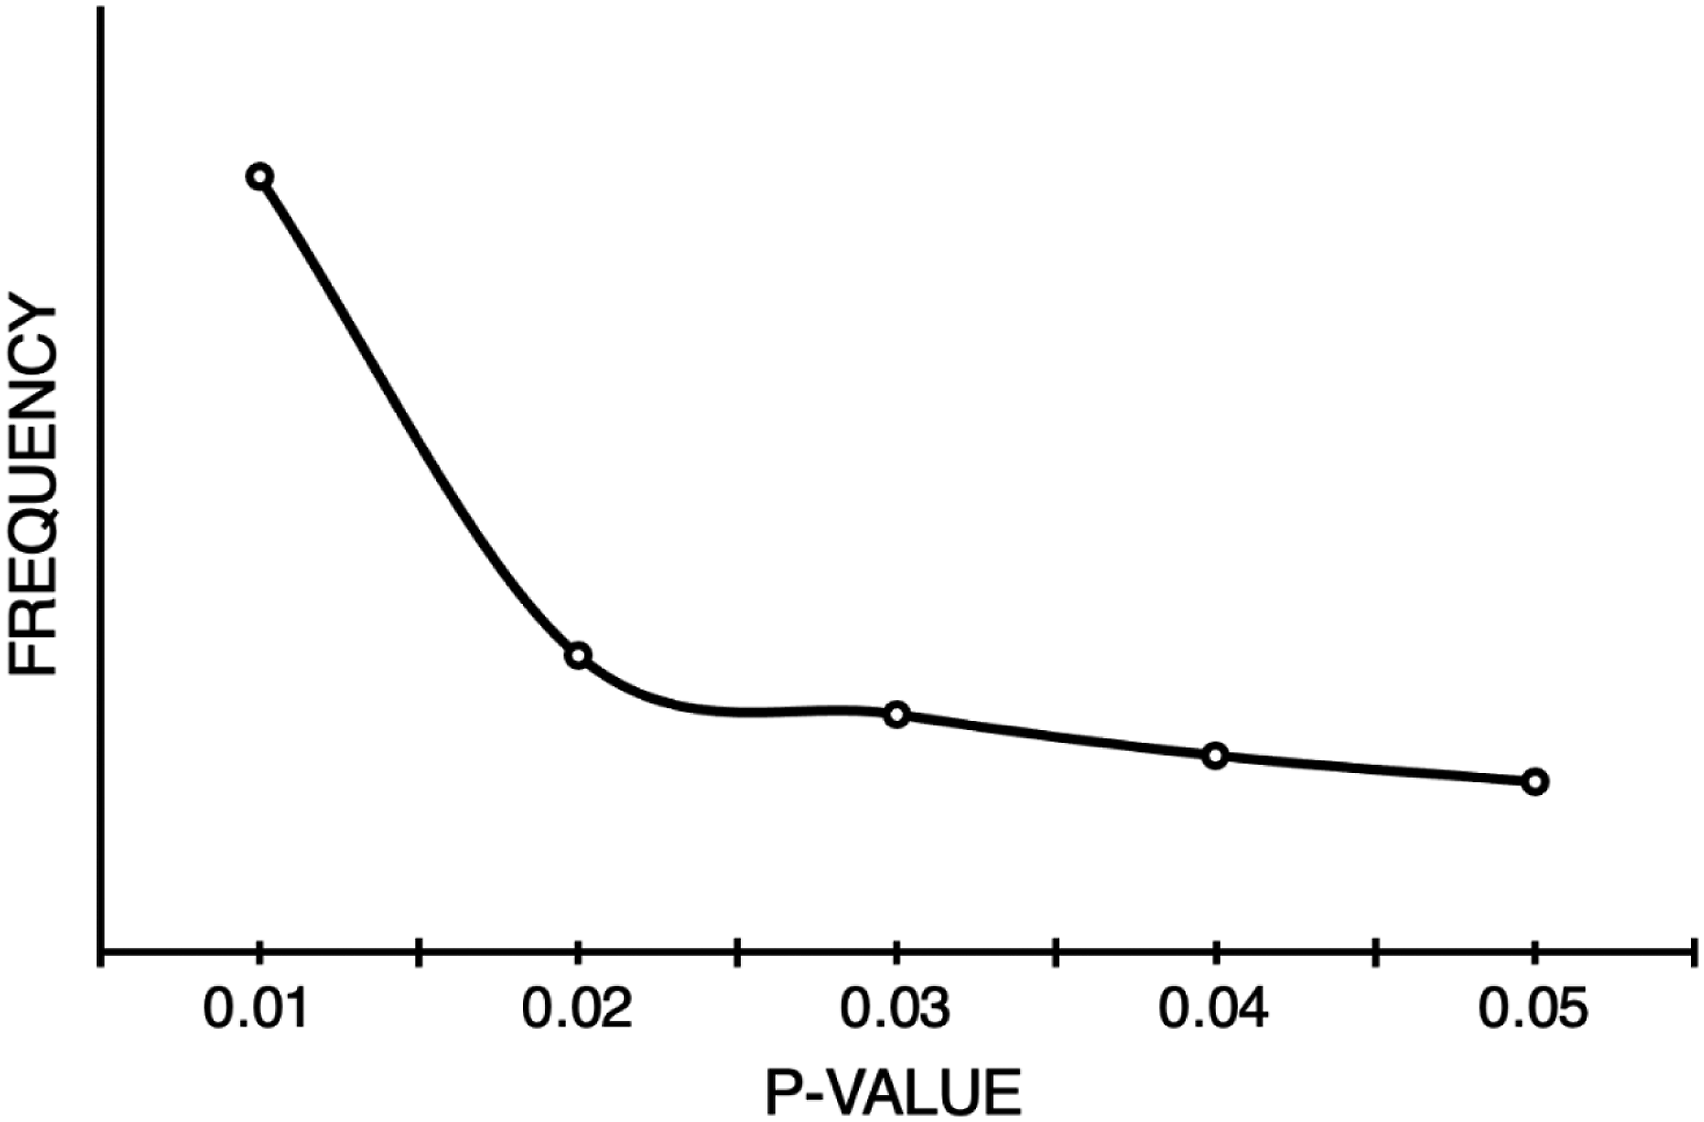
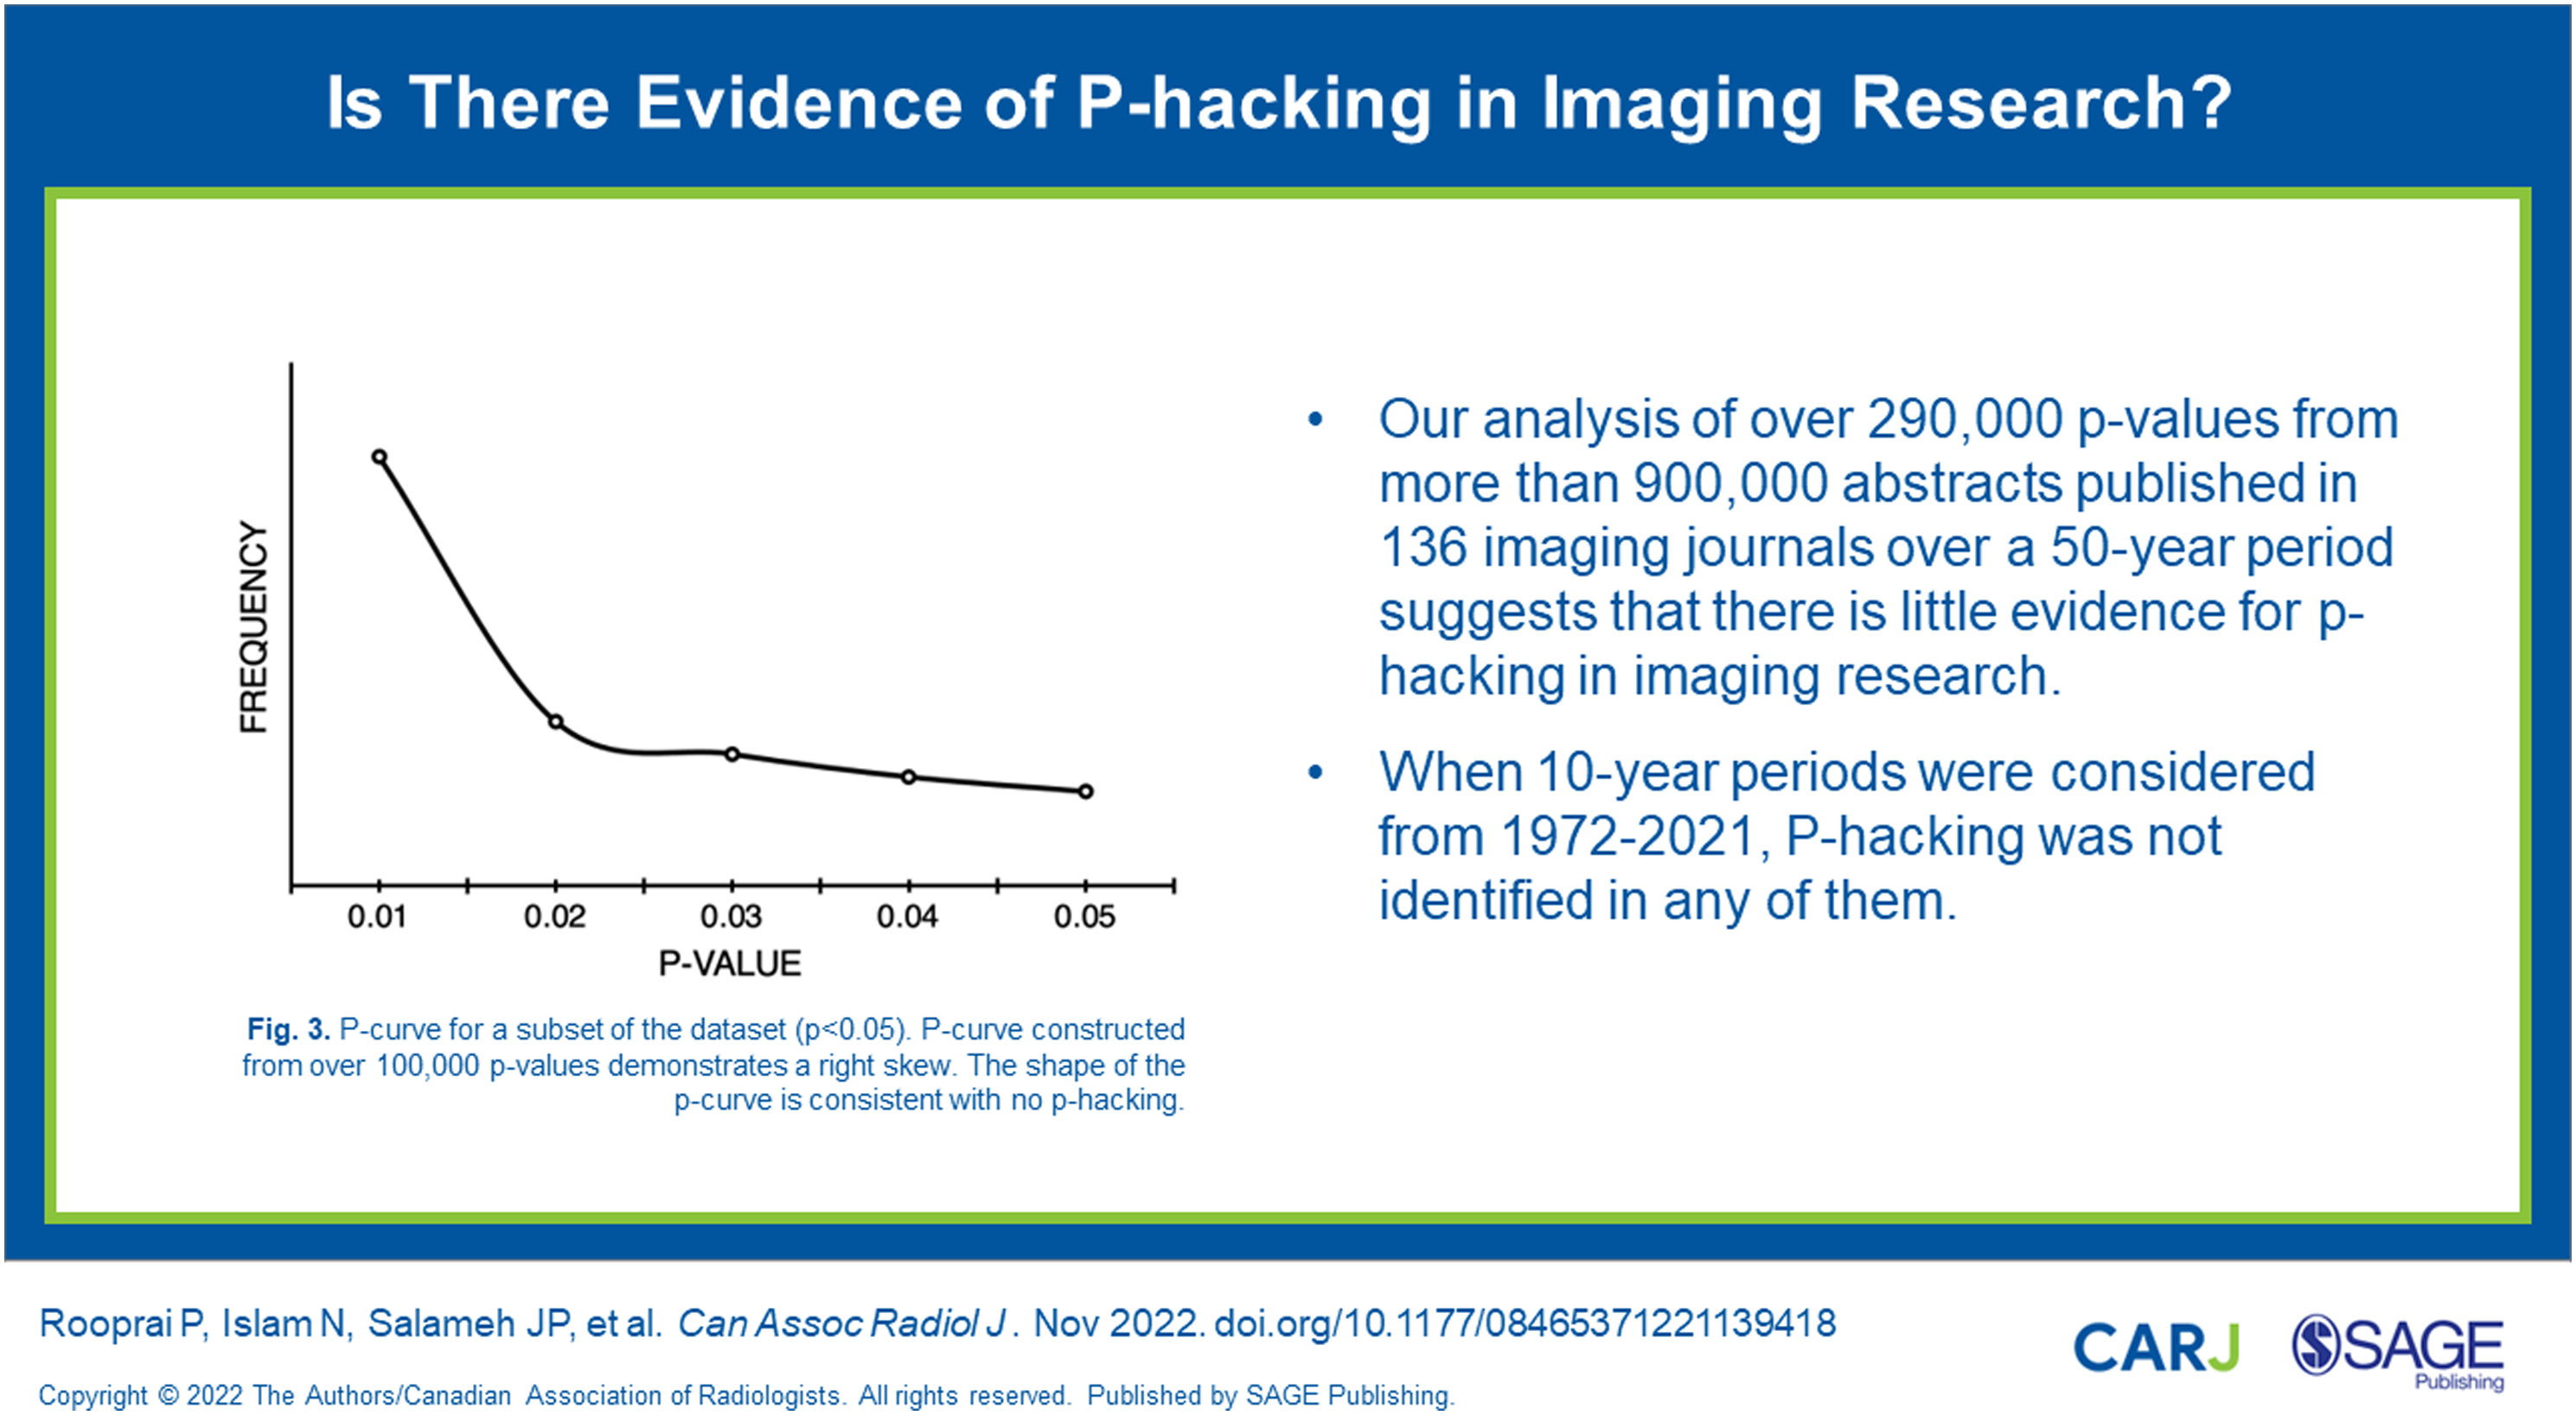
P-curve for a subset of the dataset (P < .05). P-curve constructed from over 100,000 P-values demonstrates a right skew. The shape of the p-curve is consistent with no p-hacking.
Effect Size Analysis
Test for true effect size in imaging research, using P-values obtained from the Abstract.
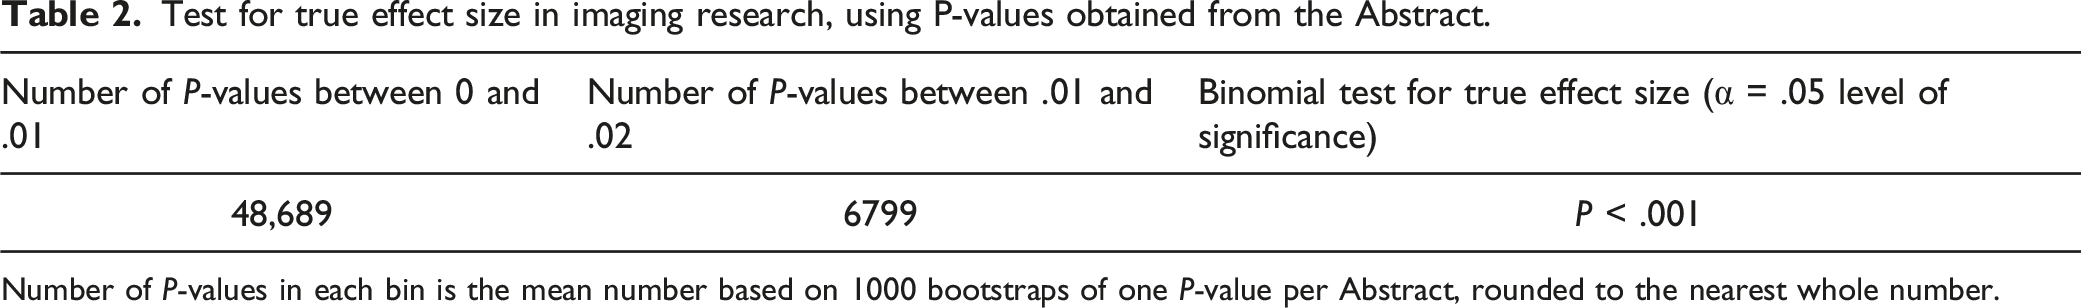
Number of P-values in each bin is the mean number based on 1000 bootstraps of one P-value per Abstract, rounded to the nearest whole number.
Time Trend Analysis
Time trend analysis, using P-values obtained from the Abstract.
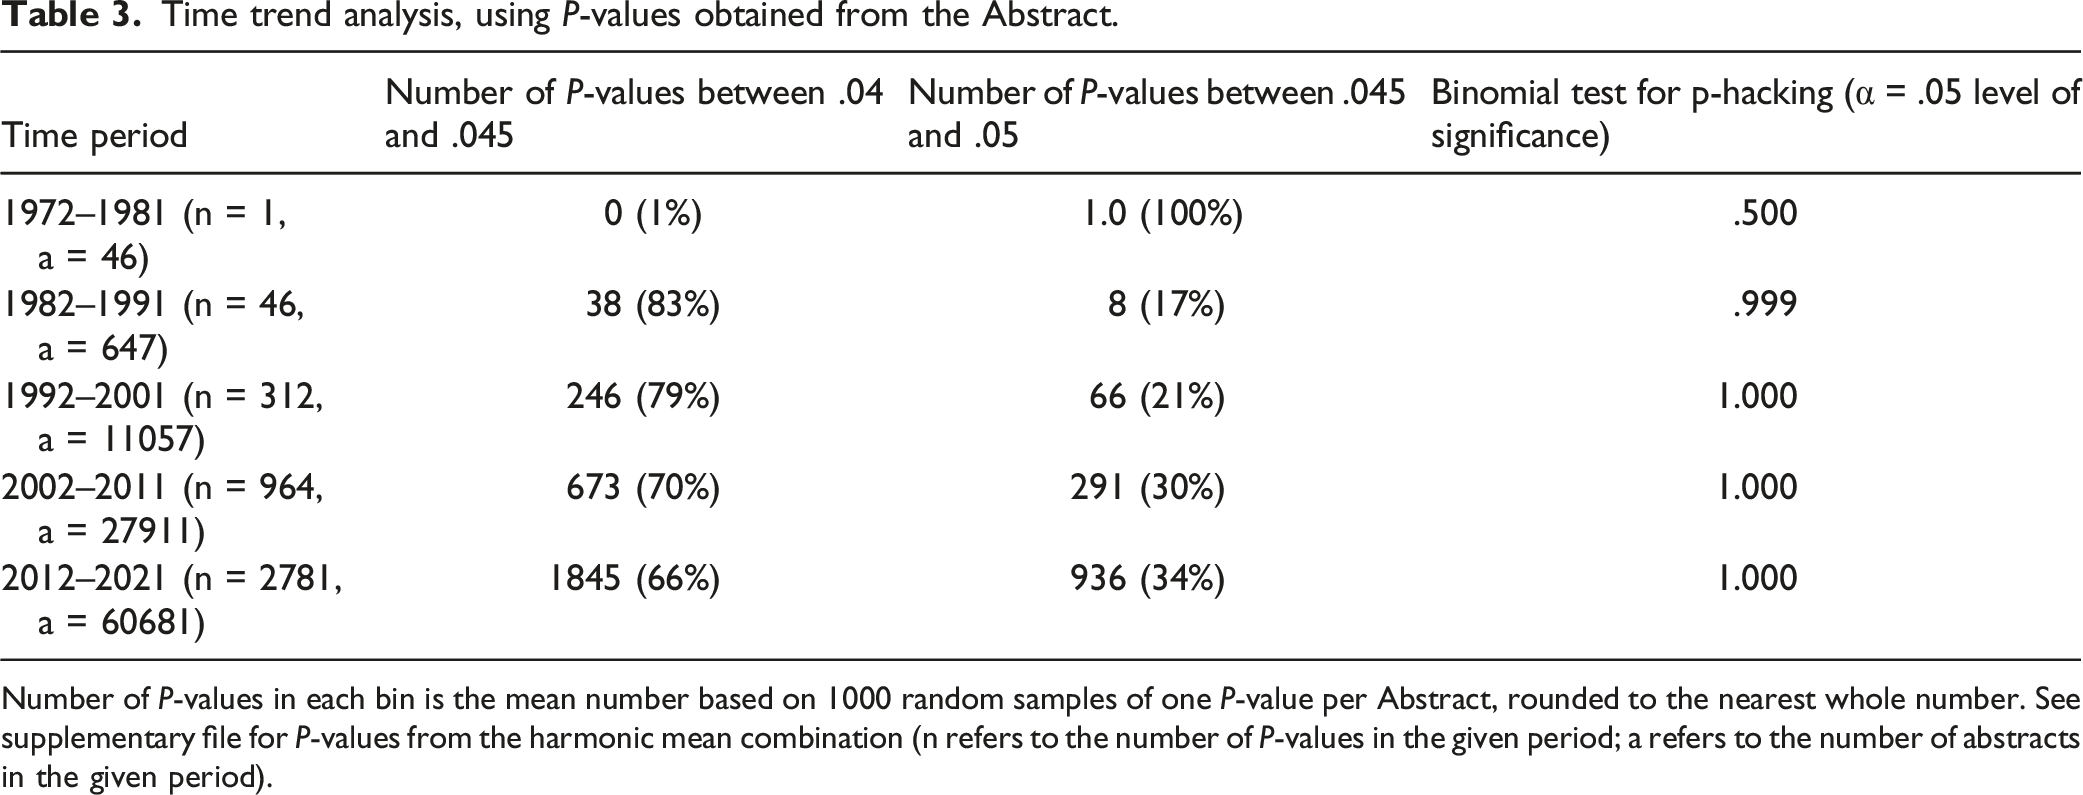
Number of P-values in each bin is the mean number based on 1000 random samples of one P-value per Abstract, rounded to the nearest whole number. See supplementary file for P-values from the harmonic mean combination (n refers to the number of P-values in the given period; a refers to the number of abstracts in the given period).
Discussion
This evaluation of abstracts in over 100 imaging journals published from 1972 to 2021 did not show evidence of p-hacking, which was maintained when excluding P-values <.001 in sensitivity analysis. Time trend analysis did not identify p-hacking in any of the five discrete 10-year periods. We observed right skew among P-values falling in the range 0 ≤ P < .02; that is, there were more P-values falling in the lower half of this range (0 ≤ P < .01) than in the upper half (.01 ≤ P < .02). This suggests that researchers appear to be primarily studying phenomena with nonzero effect sizes or “true effects.” It is interesting to note that the percentage of abstracts reporting P-values rose from .046% in the first 10-year period to 60.5% in the final one. Chavalarias et al 26 evaluated large-scale P-values reported in MEDLINE abstracts from 1990 to 2015 and found that abstracts reported more P-values over time. One explanation can be attributed to changes in the mandatory reporting of P-values in abstracts. Overall, our findings do not identify evidence for p-hacking in imaging research. However, other forms of p-hacking may be present that were not detectable by our study design, as we discuss below. 3
The evidence for p-hacking in other areas of research is variable. To et al 21 assessed the prevalence of publication bias in the top 5 radiology journals over the past 20 years and found that statistically significant P-values are preferentially reported in abstracts. Despite the focus of the study on publication bias, the distribution of P-values with equality expression identified by To et al 21 follows a right skew (indicating a true effect) which is in line with the findings of our study. Similar to our results, Jager and Leek 27 found no evidence of p-hacking in a text-mining study using P-values from abstracts of five medical journals. By contrast, Vul et al 19 reported strong evidence for p-hacking in correlational psychology fMRI studies and suggested that the underlying problems they found appear to be common in fMRI research of many kinds. The method utilized in fMRI research likely lends itself to greatly inflating estimates of correlation. 19 Other studies have inspected p-curves for a smaller sample of journals involving specific fields, such as dentistry and orthopedic surgery, and found evidence of p-hacking.8,20 These findings can in part be attributed to analysis of P-values from abstracts exclusively and or inclusion of studies that tested multiple comparisons simultaneously. When comparing methodologies of these studies to the current study, one key difference exists. Both studies use all P-values regardless of operator in their analysis, which biases toward detecting a signal for p-hacking. The current study opted to utilize a more conservative approach of restricting analyses to exact P-values (i.e., “p =”), which is in keeping with the methodologies of Head et al. 1
Head et al 1 conducted one of the largest studies of p-hacking in the literature to date. Head et al downloaded all available open access papers from PubMed Commons, categorized them by subject area, and used text mining to locate abstracts and results sections and then to search in these for P-values in the range .0 to .05. The number of papers included by Head et al varied considerably from discipline to discipline, from 94 in mathematical sciences to over 60,0000 in medical and health sciences. These were divided according to whether P-values came from results or abstract sections. Head et al found a general trend of p-hacking, with only 2 of the 14 subject areas being statistically significant. A nonzero effect size was demonstrated in all disciplines represented in their text-mined data. While the study design of the current paper is based on Head et al. 1 there are a few important differences. Firstly, we placed a greater emphasis on validating the extraction process, with over 500 abstracts included in the pilot analyses. Secondly, the text-mining script was developed with a comparable false negative rate (2%) and significantly better false positive rate (.2%). Thirdly, in addition to the main analyses, a sensitivity analyses involving taking the harmonic mean P-value was conducted. Lastly, the test for true effect size was improved by using lower ranges (0 ≤ P < .01 and .01 ≤ P < .02 vs 0 ≤ P < .025 and .025 ≤ P < .05) to minimize the influence of p-hacking or publication bias. The difference in findings between Head et al 1 and the current study is best explained by the broader scope of studies and journals included, which increases the likelihood of a signal for p-hacking to be found.
This study, to our knowledge, is the first empirical analysis to assess the presence of p-hacking in imaging research broadly. Strengths of our study include a comprehensive list of 136 imaging journals, a 50-year search range, and identification of nearly one million abstracts and greater than 200,000 P-values. While only 4105 P-values were included in analysis, these values are derived from over 100 imaging journals.
Limitations of this work are discussed as follows. P-hacking may not manifest as an overconcentration of P-values just below .05 if there is little correlation between multiple P-values obtained by each study, or if p-hackers favor smaller significant P-values over significant P-values just below .05 (i.e., their chosen alpha value is .01 rather than the commonly used .05). Other problems may arise when the p-curve analysis is used to detect p-hacking and distribution of study effects from text-mined data such as the uncertainty that the P-values are related to the main hypothesis of interest. 28 These problems are less likely to affect our results as the text-mined data used in our study comes from abstracts; P-values reported in abstracts are likely to be selected as relating to the most important findings. 5 Additionally, P-values can be reported with variable precision (i.e., 2–3 decimal places) using different thresholds (e.g., P <.05) or symbols (e.g., asterisks) instead of numbers. 1 This makes it challenging to extract all published P-values using text mining and potentially leads to under- or over-representation of certain values. 1 Our pilot analysis of 500 abstracts, involving the comparison of manually verified P-values and P-values extracted by the script, suggests that our error rates were low. This indicates a high probability of accurate text mining of P-values across the included studies. Lastly, the list of imaging journals chosen as defined by “Web of Science” has a broader definition than a radiologist reader would for a “clinical imaging journal.”
P-values from abstract sections were utilized in this study. There are several notable criticisms of using this approach. Reporting of P-values in abstracts is often optional and, as a result, many studies do not report these values. A larger proportion of imaging research pertains to diagnostic accuracy studies which do not typically report P-values, but report measures of accuracy such as sensitivity and specificity. 29 As such, other forms of reporting bias may be present in this area of research but would not be detected in our analysis but have been found in other work.13-17,30 Further, P-values reported in abstracts are likely to be selected as relating to the most important findings or primary hypotheses, which are expected to be more strongly p-hacked than P-values related to secondary objectives. 4 Indeed, some empirical evidence suggests that P-values reported in abstracts are substantially more likely to be significant than P-values reported elsewhere in papers. 31
Future research might involve looking at certain subsets of imaging research that are amenable to p-hacking. This may include AI studies, prediction models, and large databases which are of increasing interest in imaging. As such, attention should be paid to these areas as they evolve. It should be noted that the absence of clustering of P-values around .045 < P < .05 does not exclude the possibility of p-hacking. Our analysis suggests that the imaging literature likely remains a reliable record of scientific progress. The accuracy of published medical research is critical for scientists, physicians, and patients who rely on these results.
Key Results
1. We evaluated more than 900,000 abstracts from 136 imaging journals that reported more than 290,000 P-values and identified no evidence of p-hacking. 2. When 10-year periods were considered from 1972–2021, P-hacking was not identified in any of them.
Footnotes
Declaration of Conflicting Interests
The author(s) declared no potential conflicts of interest with respect to the research, authorship, and/or publication of this article.
Funding
The author(s) disclosed receipt of the following financial support for the research, authorship, and/or publication of this article: Dr. McInnes is supported by the University of Ottawa Department of Radiology Research Stipend Program.
Data Sharing Statement
Summary Statement
Our analysis of over 290,000 P-values from over 900,000 abstracts published in 136 imaging journals over a 50-year period suggests that there is little evidence for p-hacking in imaging research.
Appendix 1
1. List of search terms