
Abstract
Introduction
A gender pay gap (GPG) is the difference between remuneration for working men and women. 1 In 2020, the Canadian Human Rights Commission estimated that a woman in Canada earned $0.88 for every dollar a man earned. 2 Pay equity requires equal pay for work of equal value regardless of the recipient. As an internationally recognized fundamental human right, 3 pay equity demands that employers address potential for devaluation of any individual’s work that could contribute to a pay gap regardless of race and gender.
More women than men attend medical school. Fifty six percent of 2021 US medical school matriculants were women. 4 In Canada, 55% of 2021/2022 graduating MD students were women, which has not varied more than three percent in the last decade. 5 Female physicians continue to be paid less than males in comparable roles. 6 In academic medicine, the GPG may reflect differences in academic rank. However, this does not account for all disparities. A recent study found after adjusting for factors such as academic productivity, female department chairs in public medical schools earn $0.88 for every dollar earned by male counterparts. 7 Many other studies have shown a persistent GPG in medicine after adjusting for physician age, number of hours worked and practice characteristics.8,9 The GPG is more pronounced in some specialties 6 such as urology, orthopedic surgery, cardiology, and vascular surgery. 10 A Medscape survey of 13 064 physicians demonstrated the GPG increased in 2021. Male physicians earned 24% more than female physicians across all specialties. Male salaries were 25% higher in primary care, and 26% higher in pediatrics, a female-dominated specialty. 11
In addition to a GPG, there is a pay difference for academic physicians compared to those in private practice. In 2003, academic vascular surgeons made $54 500 less than those in private practice, which increased to $110 500 less by 2013. 10 The largest GPG was found in vascular surgery, with women earning 20% less ($88 800) than men. 10 Several studies have shown a pay gap by ethnicity. Medscape found that White physicians reported the highest earnings ($303 000) than Asian ($283 000), Hispanic/Latinx ($271 000), and finally Black physicians ($262 000). 10 The Association of American Medical Colleges (AAMC) reported similar findings for academic clinical salaries and salary data indicates that White clinical faculty had the highest salaries at $303 000. Women consistently earned lower salaries within every ethnic group. 12
In Canada’s publicly funded health care system, physician compensation varies provincially, and payment models include fee-for-service, blended, alternative payment (salary, service, or sessional contracts) and rural funding programs. Payment methods amongst individual radiologists also vary significantly. Greater than 70% of Canadian radiologists are paid fee-for-service or pooled-income, although alternative payment models are increasingly popular.13,14 Seventy percent of Canadian radiologists are hospital-based and 21% are in group practices with a small minority in solo practices. 14 Due to significant payment and practice variation, obtaining income data is challenging and currently, no accurate data exists to examine the GPG in Canadian radiology.
We conducted a cross-sectional study to obtain self-reported data from radiologists across Canada to determine if self-reported income level of practicing Canadian radiologists is related to gender.
Methods
Study Design and Population
We surveyed radiologists and trainees across Canada and reported only data on radiologists practicing in Canada. The survey was approved by the University of British Columbia Research Ethics Board (H21-01253) and distributed from May 2021 to July 2021. The survey explored several aspects of the practice of radiology in Canada. This work reports on results pertaining to GPG and other demographic variables related to the pay gap.
Survey Procedures
Hyperlinks to French and English surveys were distributed using: (1) email from Canadian radiology organizations, such as the Canadian Association of Radiologists (CAR), Canadian Heads of Academic Radiology (CHAR), Canadian Radiology Women (CRW), and L’Association des Radiologistes du Quebec (ARQ); (2) social media of members in organizations such as CRW, and the Canadian Society of Breast Imaging (CSBI) posting the link on Facebook, Twitter, and Instagram; (3) snowball sampling by asking radiologists to forward the link to radiologist friends and colleagues. Data were collected using REDCap12 electronic web-based data capture tool hosted at the University of Alberta.
Survey Content
A PDF of the surveys can be provided upon request.
Primary Outcome
The primary outcome is self-reported income, defined as a 4-level categorical variable: (1) “less than $100,000”; (2) “$100 000–$299 000”; (3) “$300 000–$500 000”; and (4) “greater than $500 000.” The respondents could also choose, “prefer not to say.”
Independent Variables
We explored the association of independent variables with self-reported income: Gender Identity, Ethnic Group, Visible Minority (VM) status, URiM (Underrepresented in Medicine) status, Provincial Region, having children, Full-/Part-Time work status, and Academic position.
Grouping of Subcategories
Depending on response frequency, some answer choices were recoded to decrease the number of categories. The income variables were recoded into three categories (“less than $300 000,” “300 000–$500 000,” and “greater than $500 000),” since the lowest level, “less than $100 000,” only had 5 responses (1.1%). Due to low number of responses for those earning <$300 000 for subsequent analyses, the self-reported income variable was further dichotomized to “equal to or less than $500 000” (n = 137, 37.0%) and “greater than $500 000” (n = 233, 63%).
There were six gender identity response categories (Survey Supplement upon request), plus “other” and “prefer not to say”; however, respondents only chose “man,” “woman,” and “prefer not to say,” therefore “gender” was considered a binary variable. For gender, 48.0% (n = 216) identified as “man,” 50.4% (n = 227) as “woman” and 1.6% (n = 7) “prefer not to say,” so only “man” and “woman” were included in analyses.
We grouped provinces and territories into three regions: (1) Western (British Columbia, Alberta, Saskatchewan, Manitoba, Yukon, Northwest Territories, and Nunavut); (2) Central (Ontario and Quebec); and (3) Atlantic (Nova Scotia, Prince Edward Island, New Brunswick, Newfoundland, and Labrador).
We used self-reported ethnicity variables: (1) Ethnicity (with 18 different ethnic categories, detail in Survey), VM (yes/no), and URiM (Black, Indigenous, Latinx, and multi-racial groups). Ethnicity was recoded, as some categories had less than one percent of total responses, for example, Black Caribbean, Filipino, Arab, West Asian, and Canadian First Nations respondents. There were no responses for Black North American or Canadian Métis or Inuit.
There were two opinion items: (1) “I believe there is a gender pay gap in radiology”; (2) “addressing the gender pay gap in radiology is important to me.” The questions “addressing the GPG in radiology is important” and “the Canadian Association of Radiologists (CAR) should collect demographic data about diversity on an ongoing basis” were examined to determine if there was a relationship between people who agreed with these statements and those who did not, therefore the responses for both questions were recoded (“Strongly Disagree” or “Disagree” or “Neither Agree nor Disagree” = “0” or “Agree” or “Strongly Agree” = “1”).
Statistical Analysis
Frequency counts for demographic variables and chi-square analyses were calculated using SPSS V28.0 (IBM Corp, 2021). Chi-squared analysis was performed to determine if there was a significant relationship between self-reported income and gender. We then performed chi-square analyses for self-reported income by gender controlling for the demographic variables in our research question. Only categories with at least one response were included in the chi-square analyses. Significance level was set a priori at
Results
Of the 611 survey responses, 466 (76%) practicing radiologists, 133 (21%) trainees and the rest were retired radiologists, “other,” and those who preferred not to respond. Our final sample consisted of 454 radiologists actively practicing in Canada. We did not fix the number of surveys sent out instead rely on replies through, for example, social media hence are not able to obtain the percentage response. The sample size for our analyses varies by number who reported self-reported income, gender, and demographic variable in question; for example, of 454 respondents, 370 answered the self-reported income question.
Results of Self-reported Income and Gender
There was a significant relationship between income and gender (χ2 = 10.44, df = 2, P < .05) as shown in Figure 1. More men (70.6%, n = 120) reported the highest income level, “greater than $500 000,” compared to women (56.4%, n = 110). Fewer men (20.6%, n = 35) reported an income level of “$300 000–$500 000” compared to women (35.9%, n = 70). 8.8% (n = 15) of men and 7.7% (n = 15) of women reported the lowest income level, “less than $300 000.”
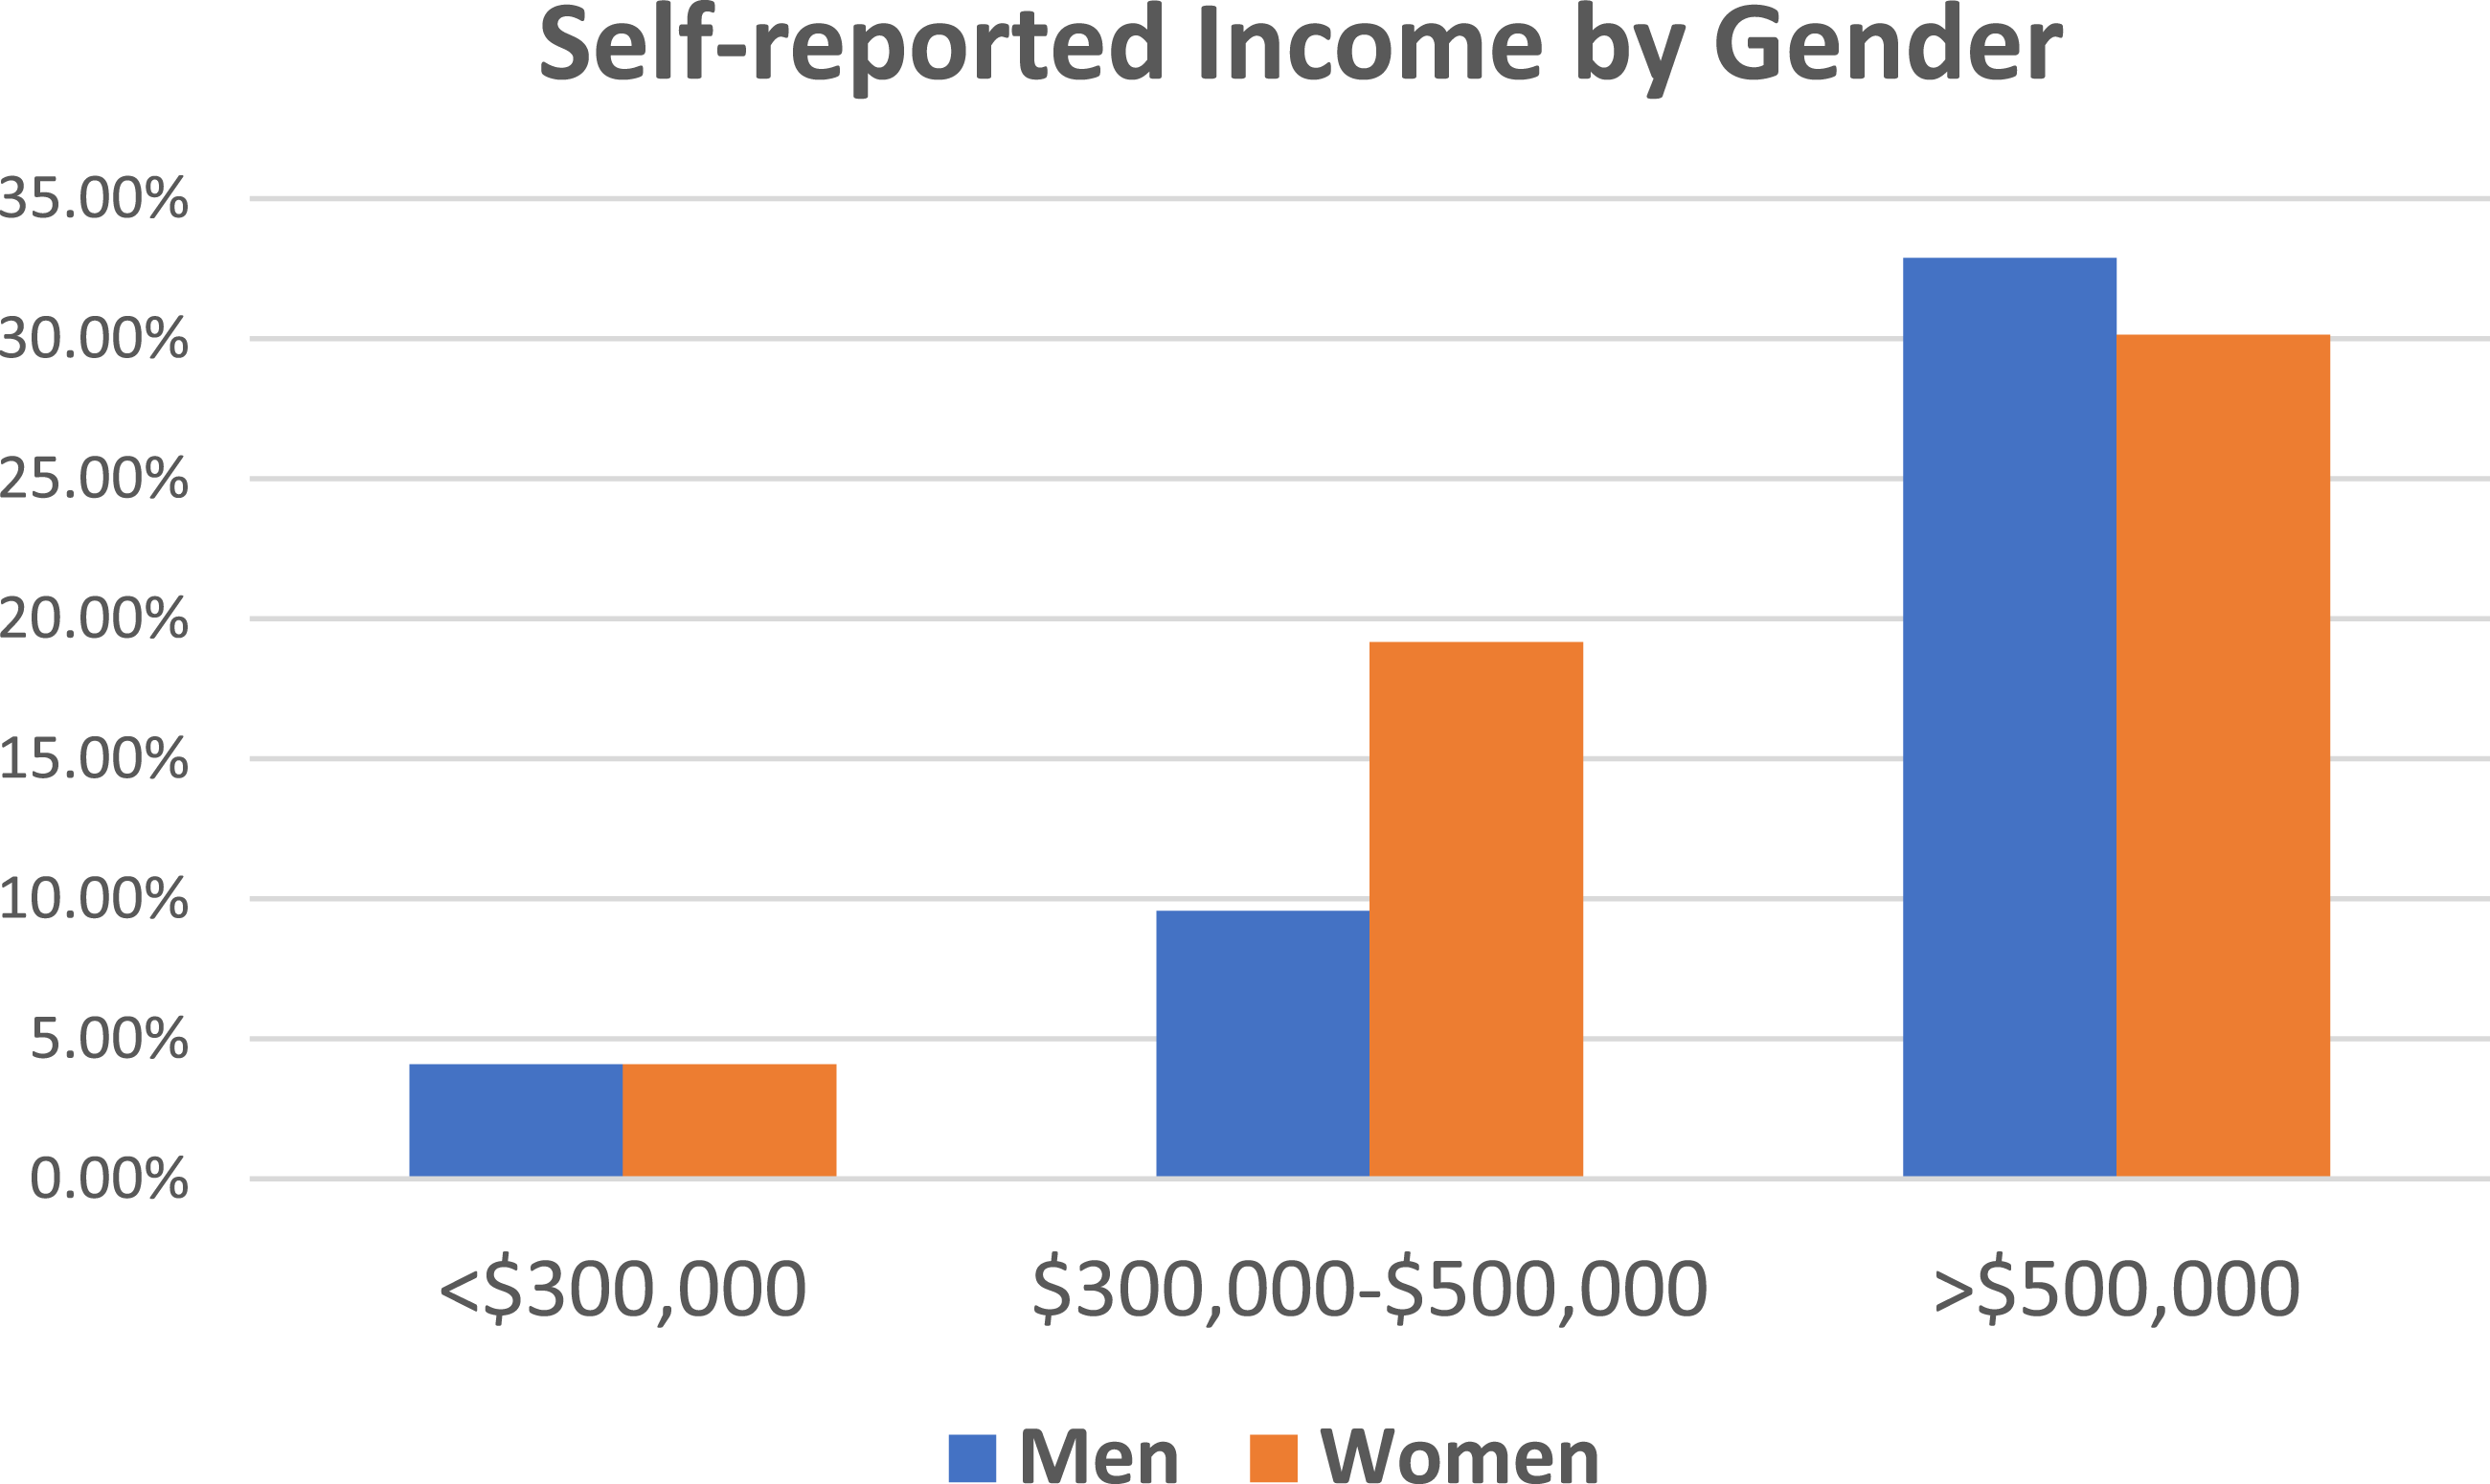
Self-reported income by gender.
Sub-Analyses With Demographic Variables
Results of Self-Reported Income by Gender Controlling for Ethnicity
Self-Reported Income by Gender Controlling for: Visible Minority and Under-Represented in Medicine Status.
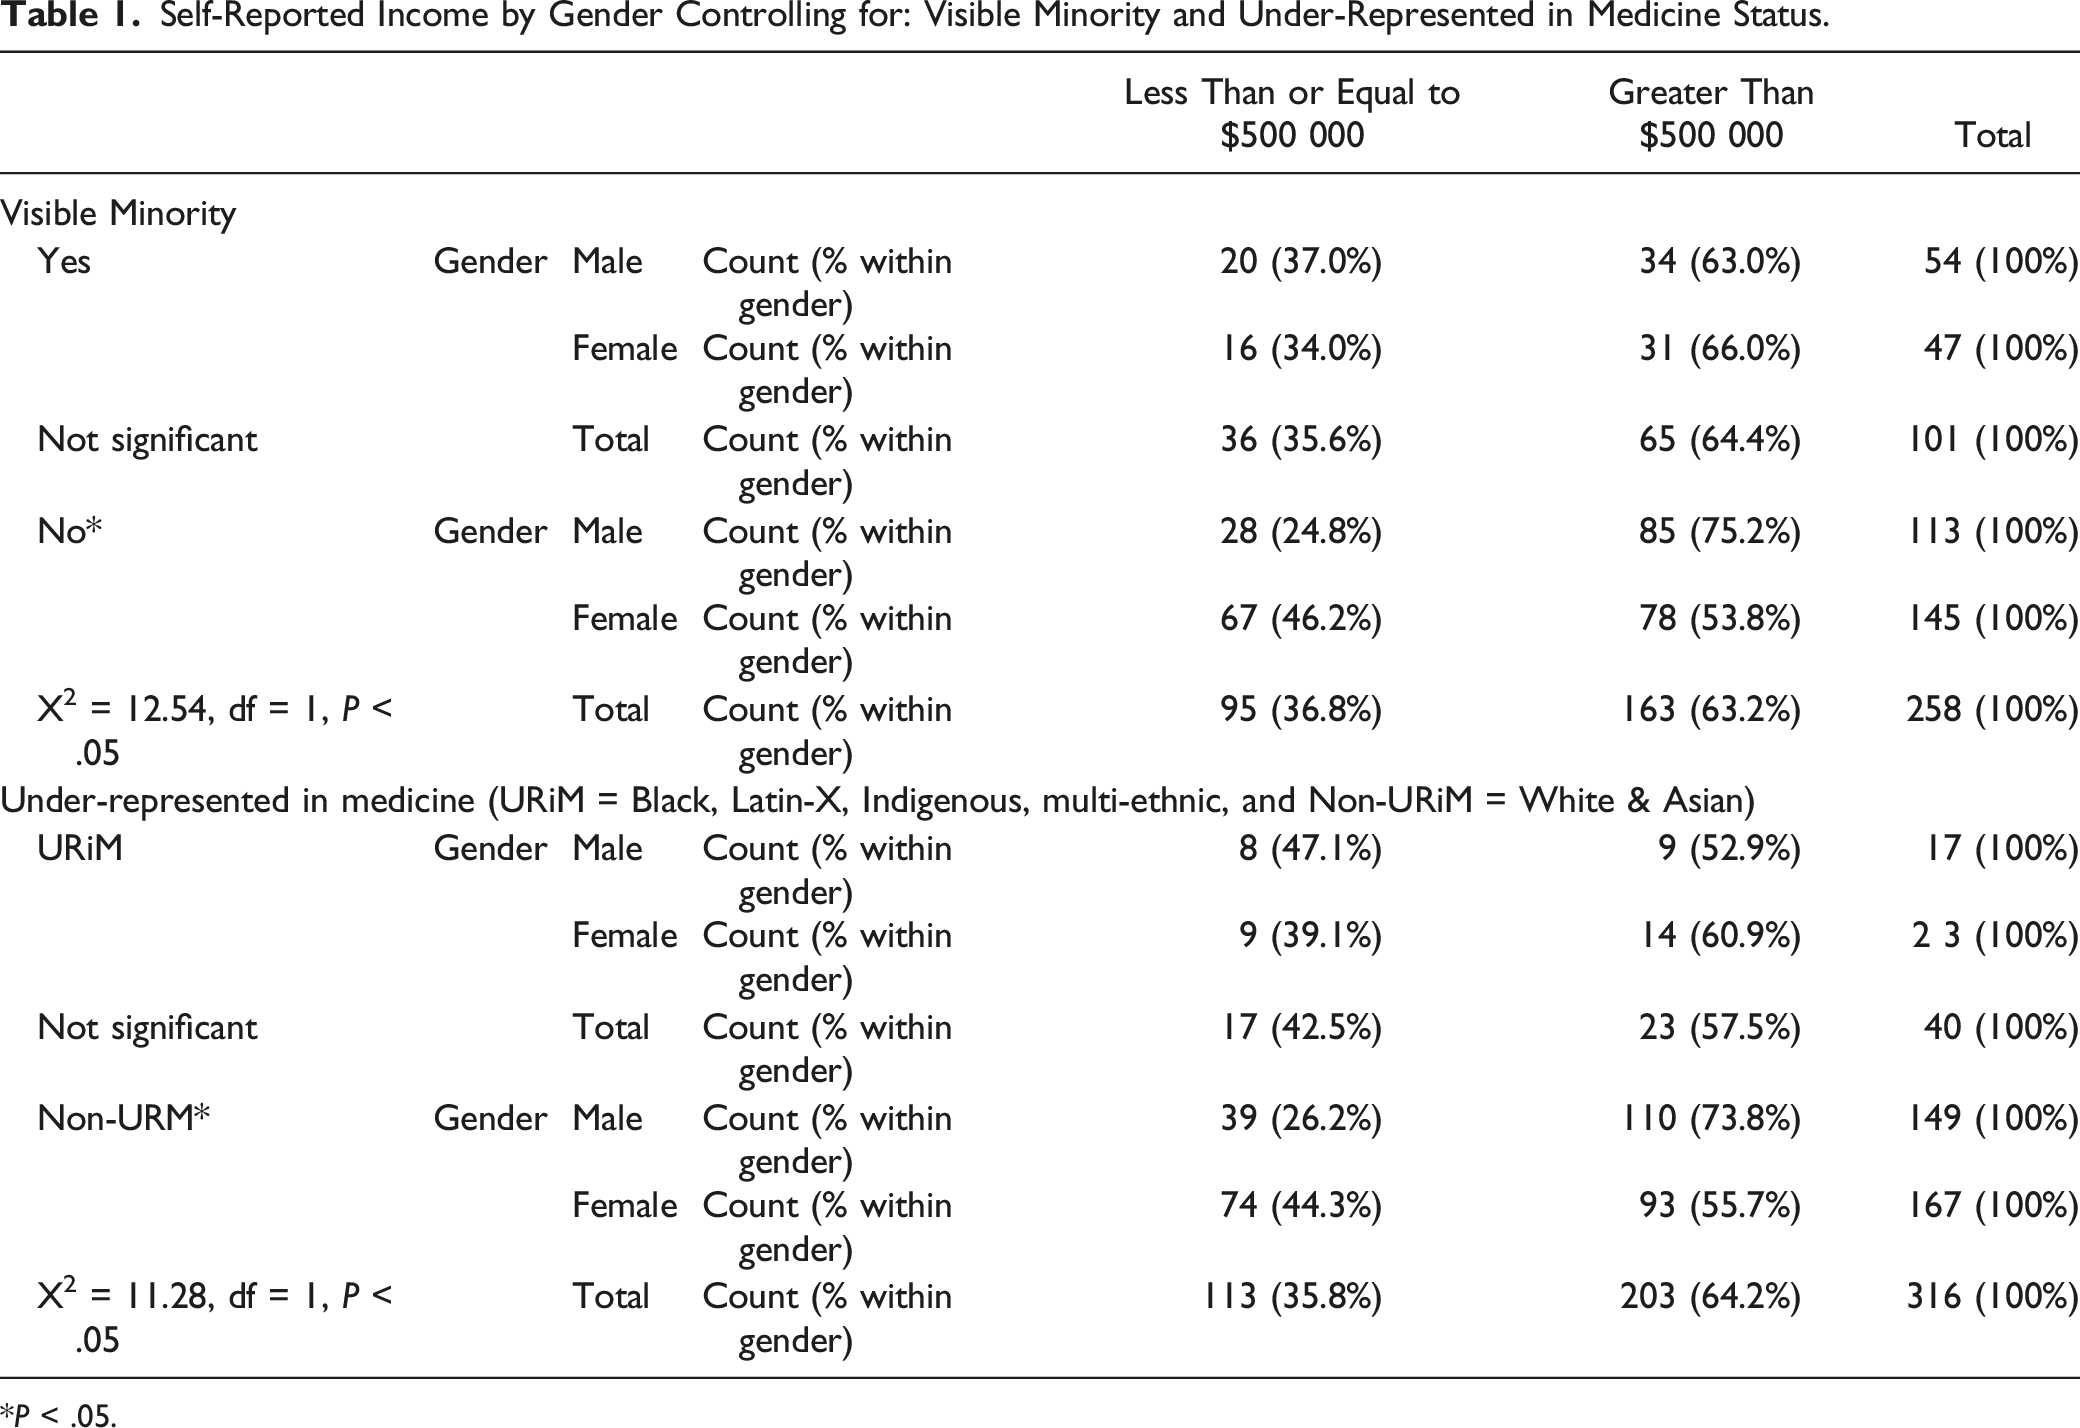
*P < .05.
Results of self-reported Income by Gender Controlling for Provincial Region
The largest number of respondents was in the Western region (64.9%); 27.4% from Central region and 7.7% from the Atlantic region. The results for income by gender, controlling for Provincial Region, are in Table 2; however, please note the small sample size per cell in the Atlantic and Central regions.
Self-Reported Income by Gender Controlling for: Provincial Region: Western (British Columbia, Alberta, Saskatchewan, Manitoba, Northwest Territories, Yukon, and Nunavut); Central (Ontario and Quebec); and Atlantic (Nova Scotia, Prince Edward Island, New Brunswick, and Newfoundland and Labrador).
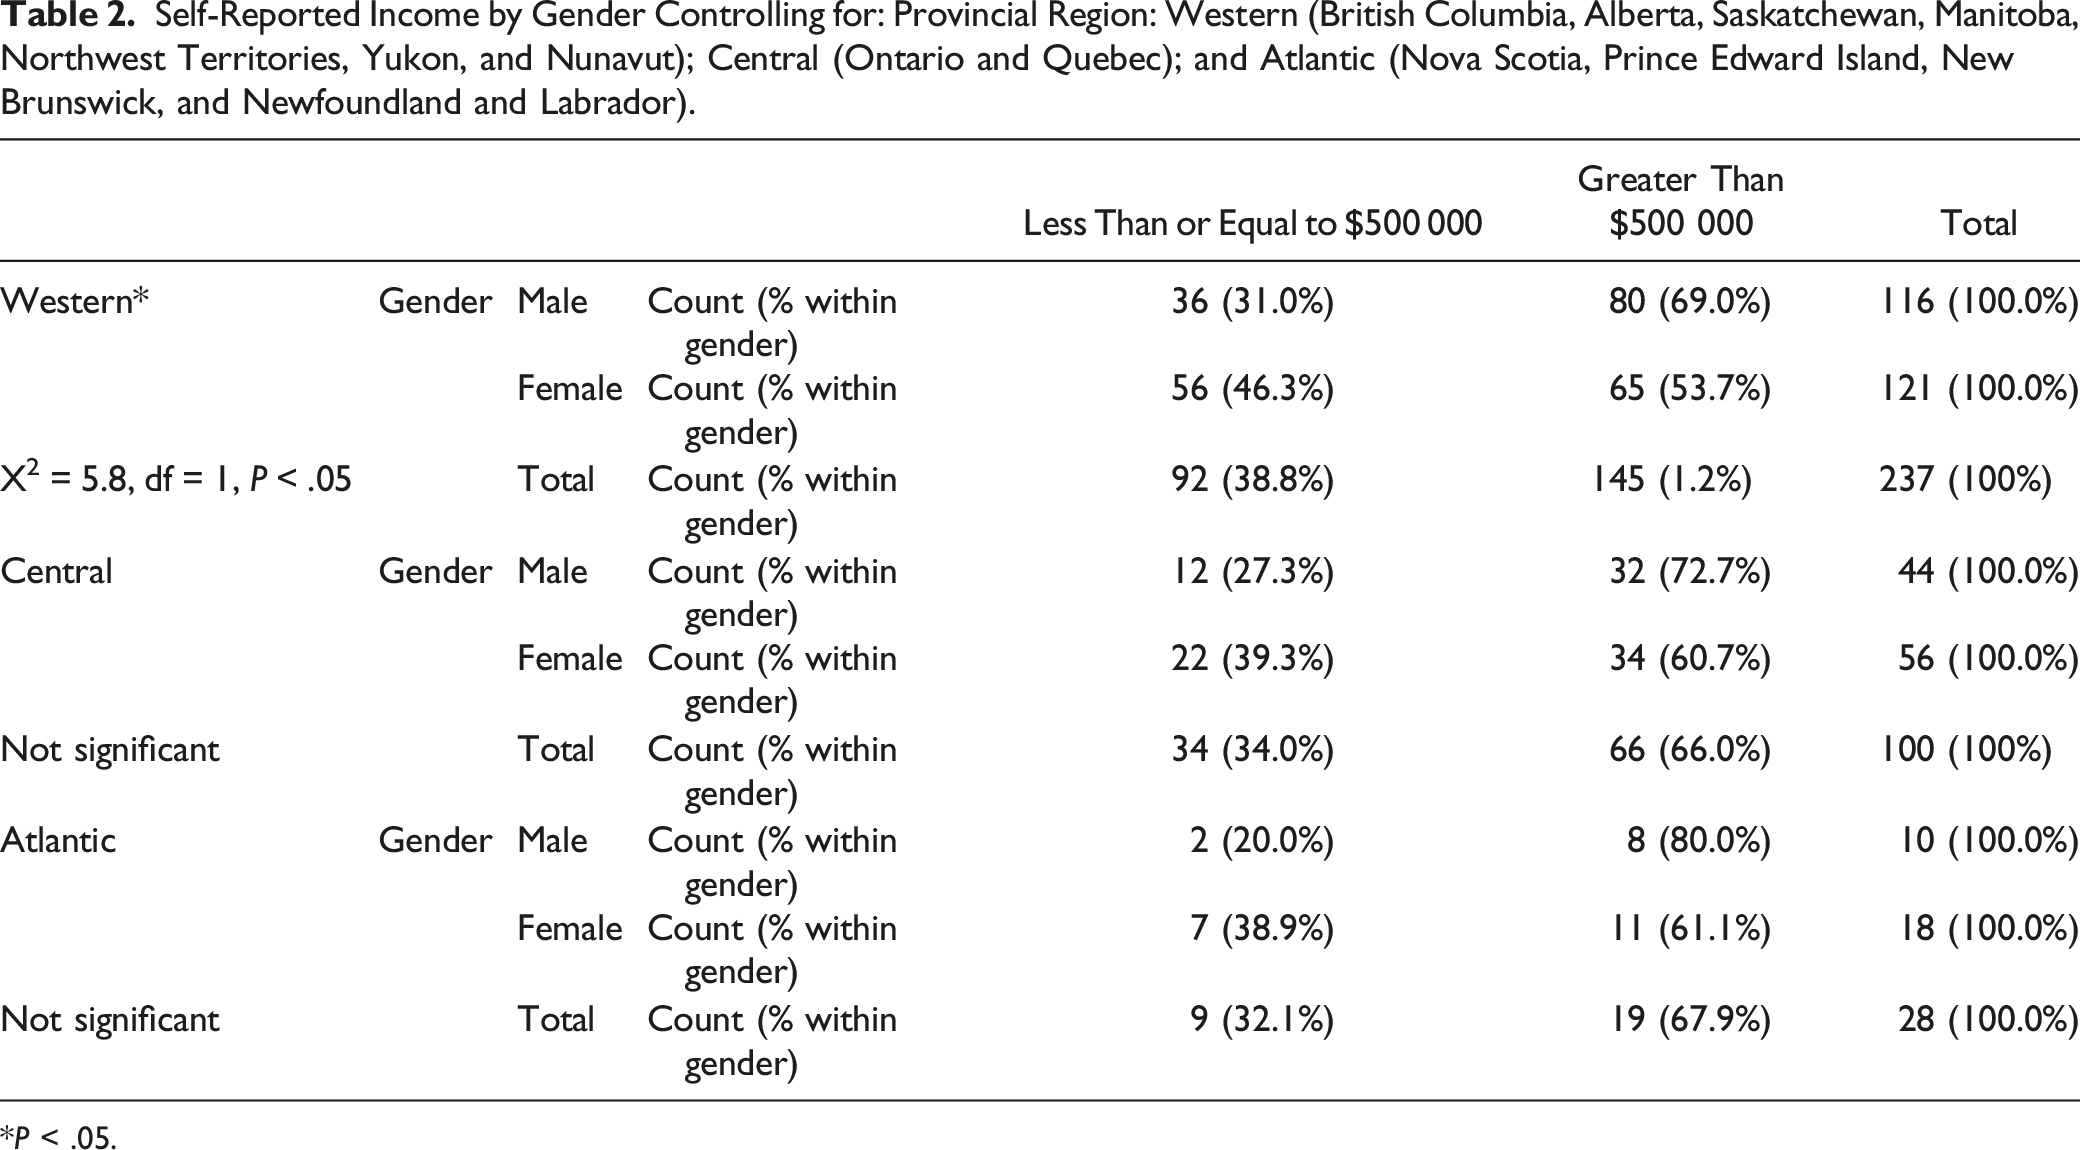
*P < .05.
Results of Self-reported Income by Gender Controlling for having children, Part- or Full-time Employment, and Academic position
The percentage of men and women with children is roughly equal (men 48.9% and women 51.0%); however, more women than men reported not having children (men 36.7%; women 63%). The results for income by gender, controlling for having children, are in Table 3. There is a GPG found for Radiologists with children, but the gap is not significant for those without children. Most (78.2%, n = 352) reported working full-time; however, the number of hours worked for part-time vs full-time were not included in the survey. More women (25.9%) work part-time compared to men (18.1%) and more part-time radiologists (71.6%) reported making less than $500 000 per year whereas 73% of full-time radiologists reported making Majority (75.9%, n = 325) respondents reported an academic position. The highest percentage were “lecturer” or “assistant professor” (37.2%), however, 26.5% reported having a clinical appointment; 25.5% were “associate professors”; and 10.8% full professors. The results for income by gender, controlling for: (1) having Children; (2) Part- or Full-time Employment; and (3) having an Academic position are in Table 3.
Self-Reported Income by Gender Controlling for: Having Children; Part-time of Full-time Employment; and Having an Academic position.
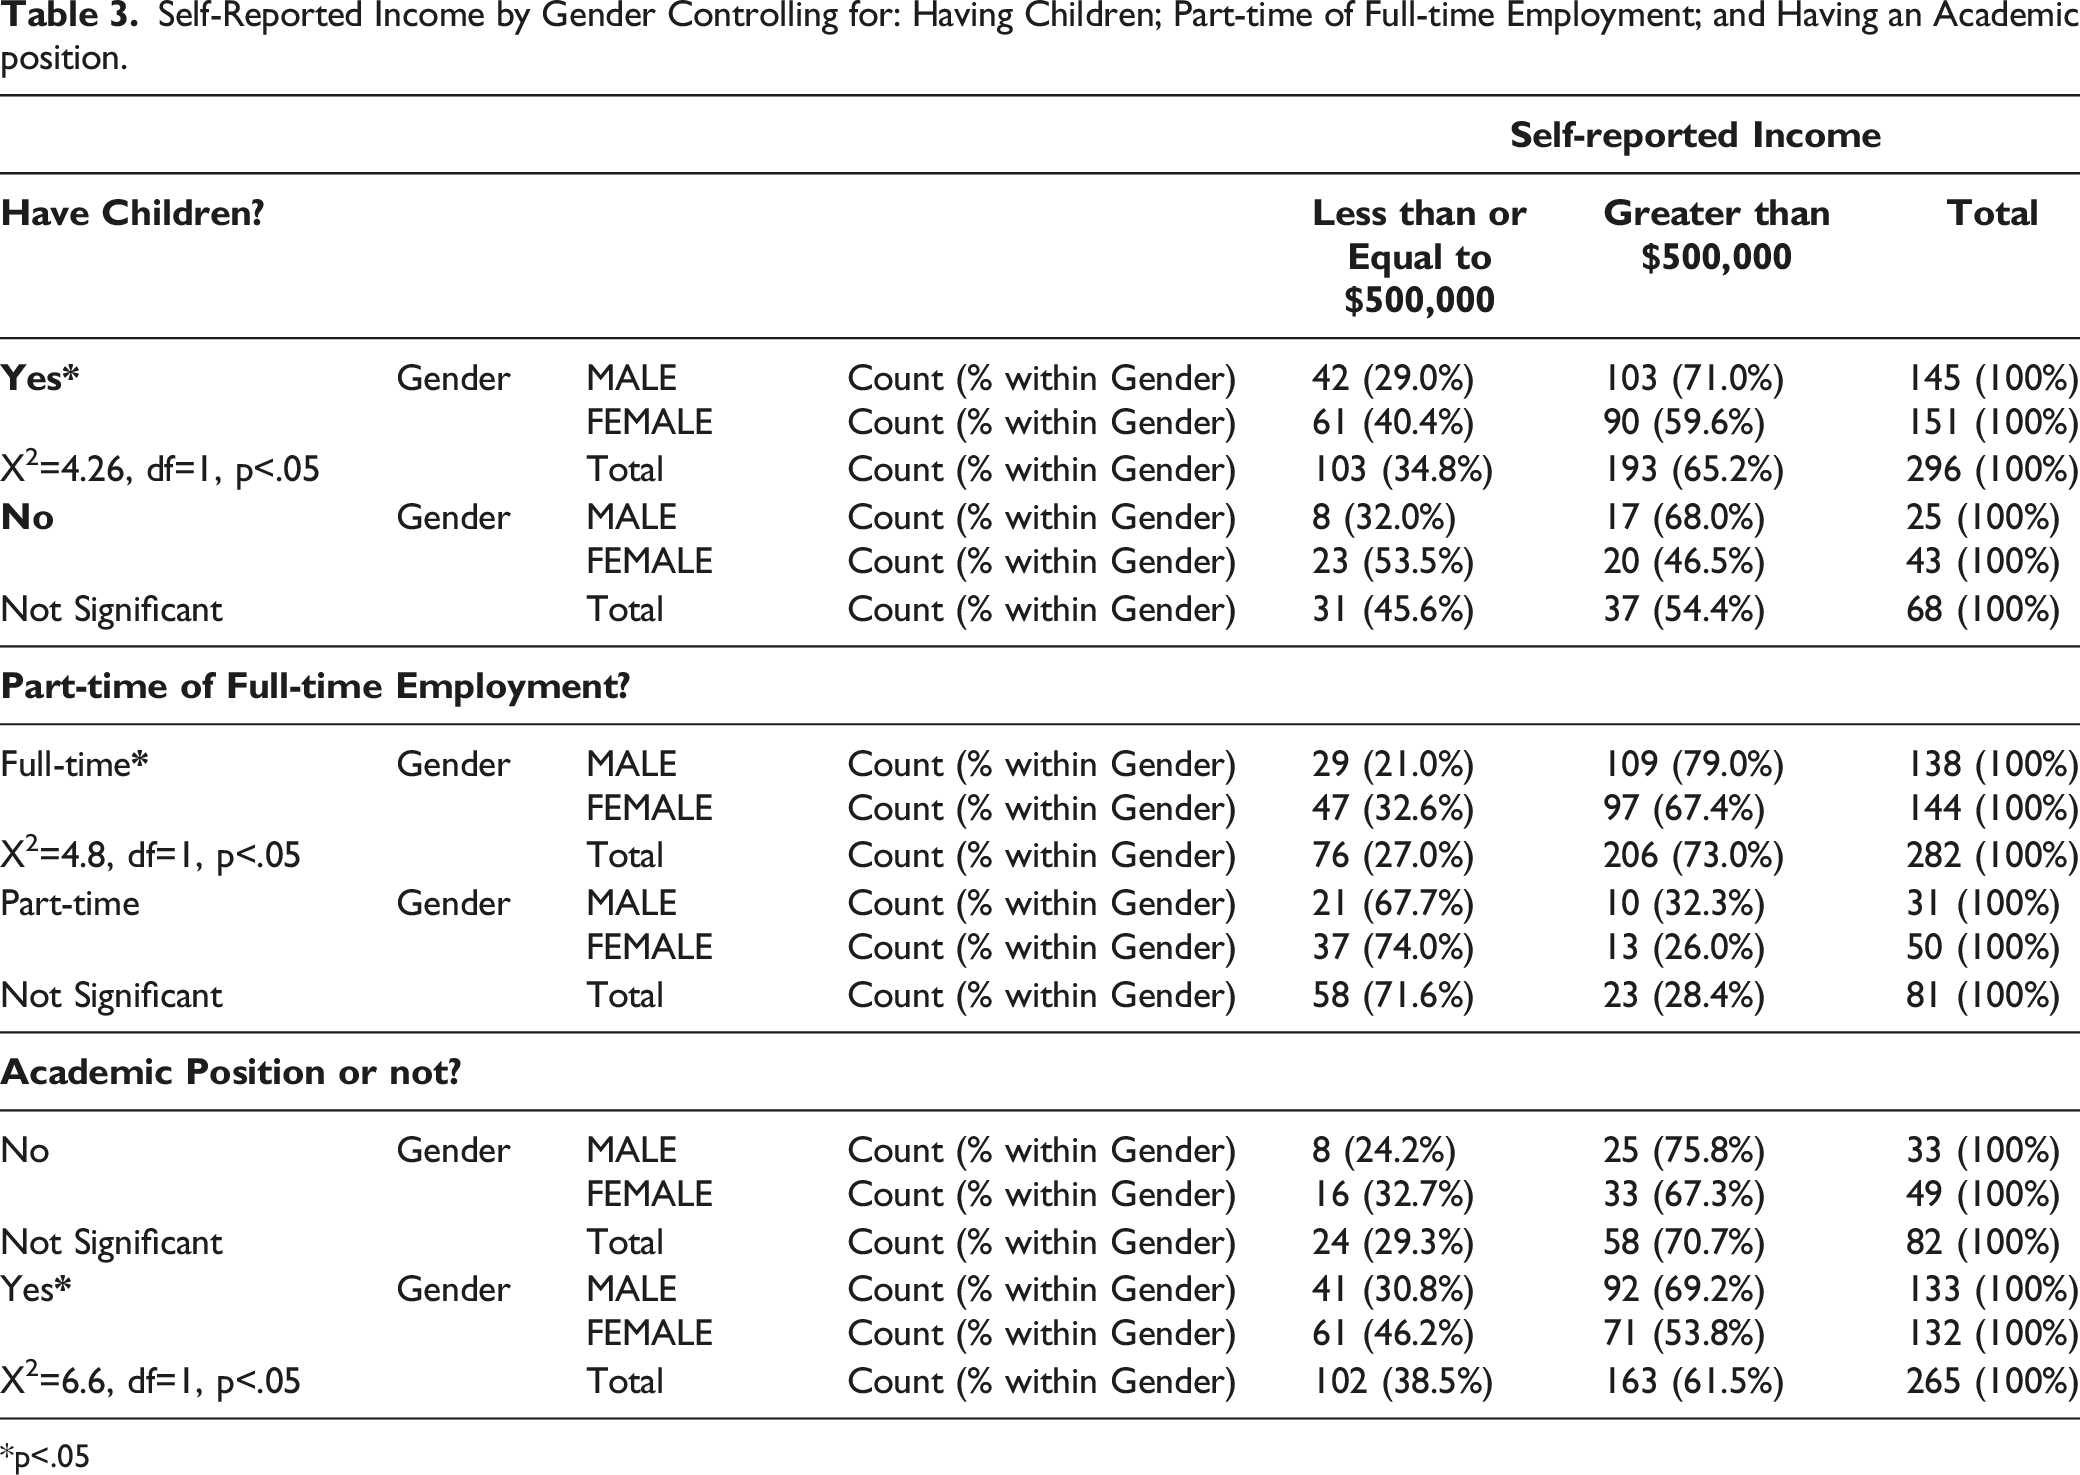
*p<.05
Results of Self-reported Income by Opinions on the Gender Pay Gap, controlling for Gender
The results for two opinion questions on GPG and the role of CAR by Income are in Table 4. There were moderate correlations between the three opinion variables as denoted by correlation coefficient (r): “I believe there is a GPG” by “Addressing the GPG is important” (r = 0.51) and by “CAR should collect demographic data” (r = 0.37); however, “Addressing the GPG is important” was more strongly correlated to the opinion that CAR should collect demographic data (r = 0.63).
Self-Reported Income by: “I believe there is a Gender Pay Gap (GPG) in Radiology”; “Addressing the GPG in Radiology is Important to Me”; and “The Canadian Association of Radiologists (CAR) should Collect Demographic Data about Diversity on an Ongoing Basis”; controlling for Gender (Male/Female).
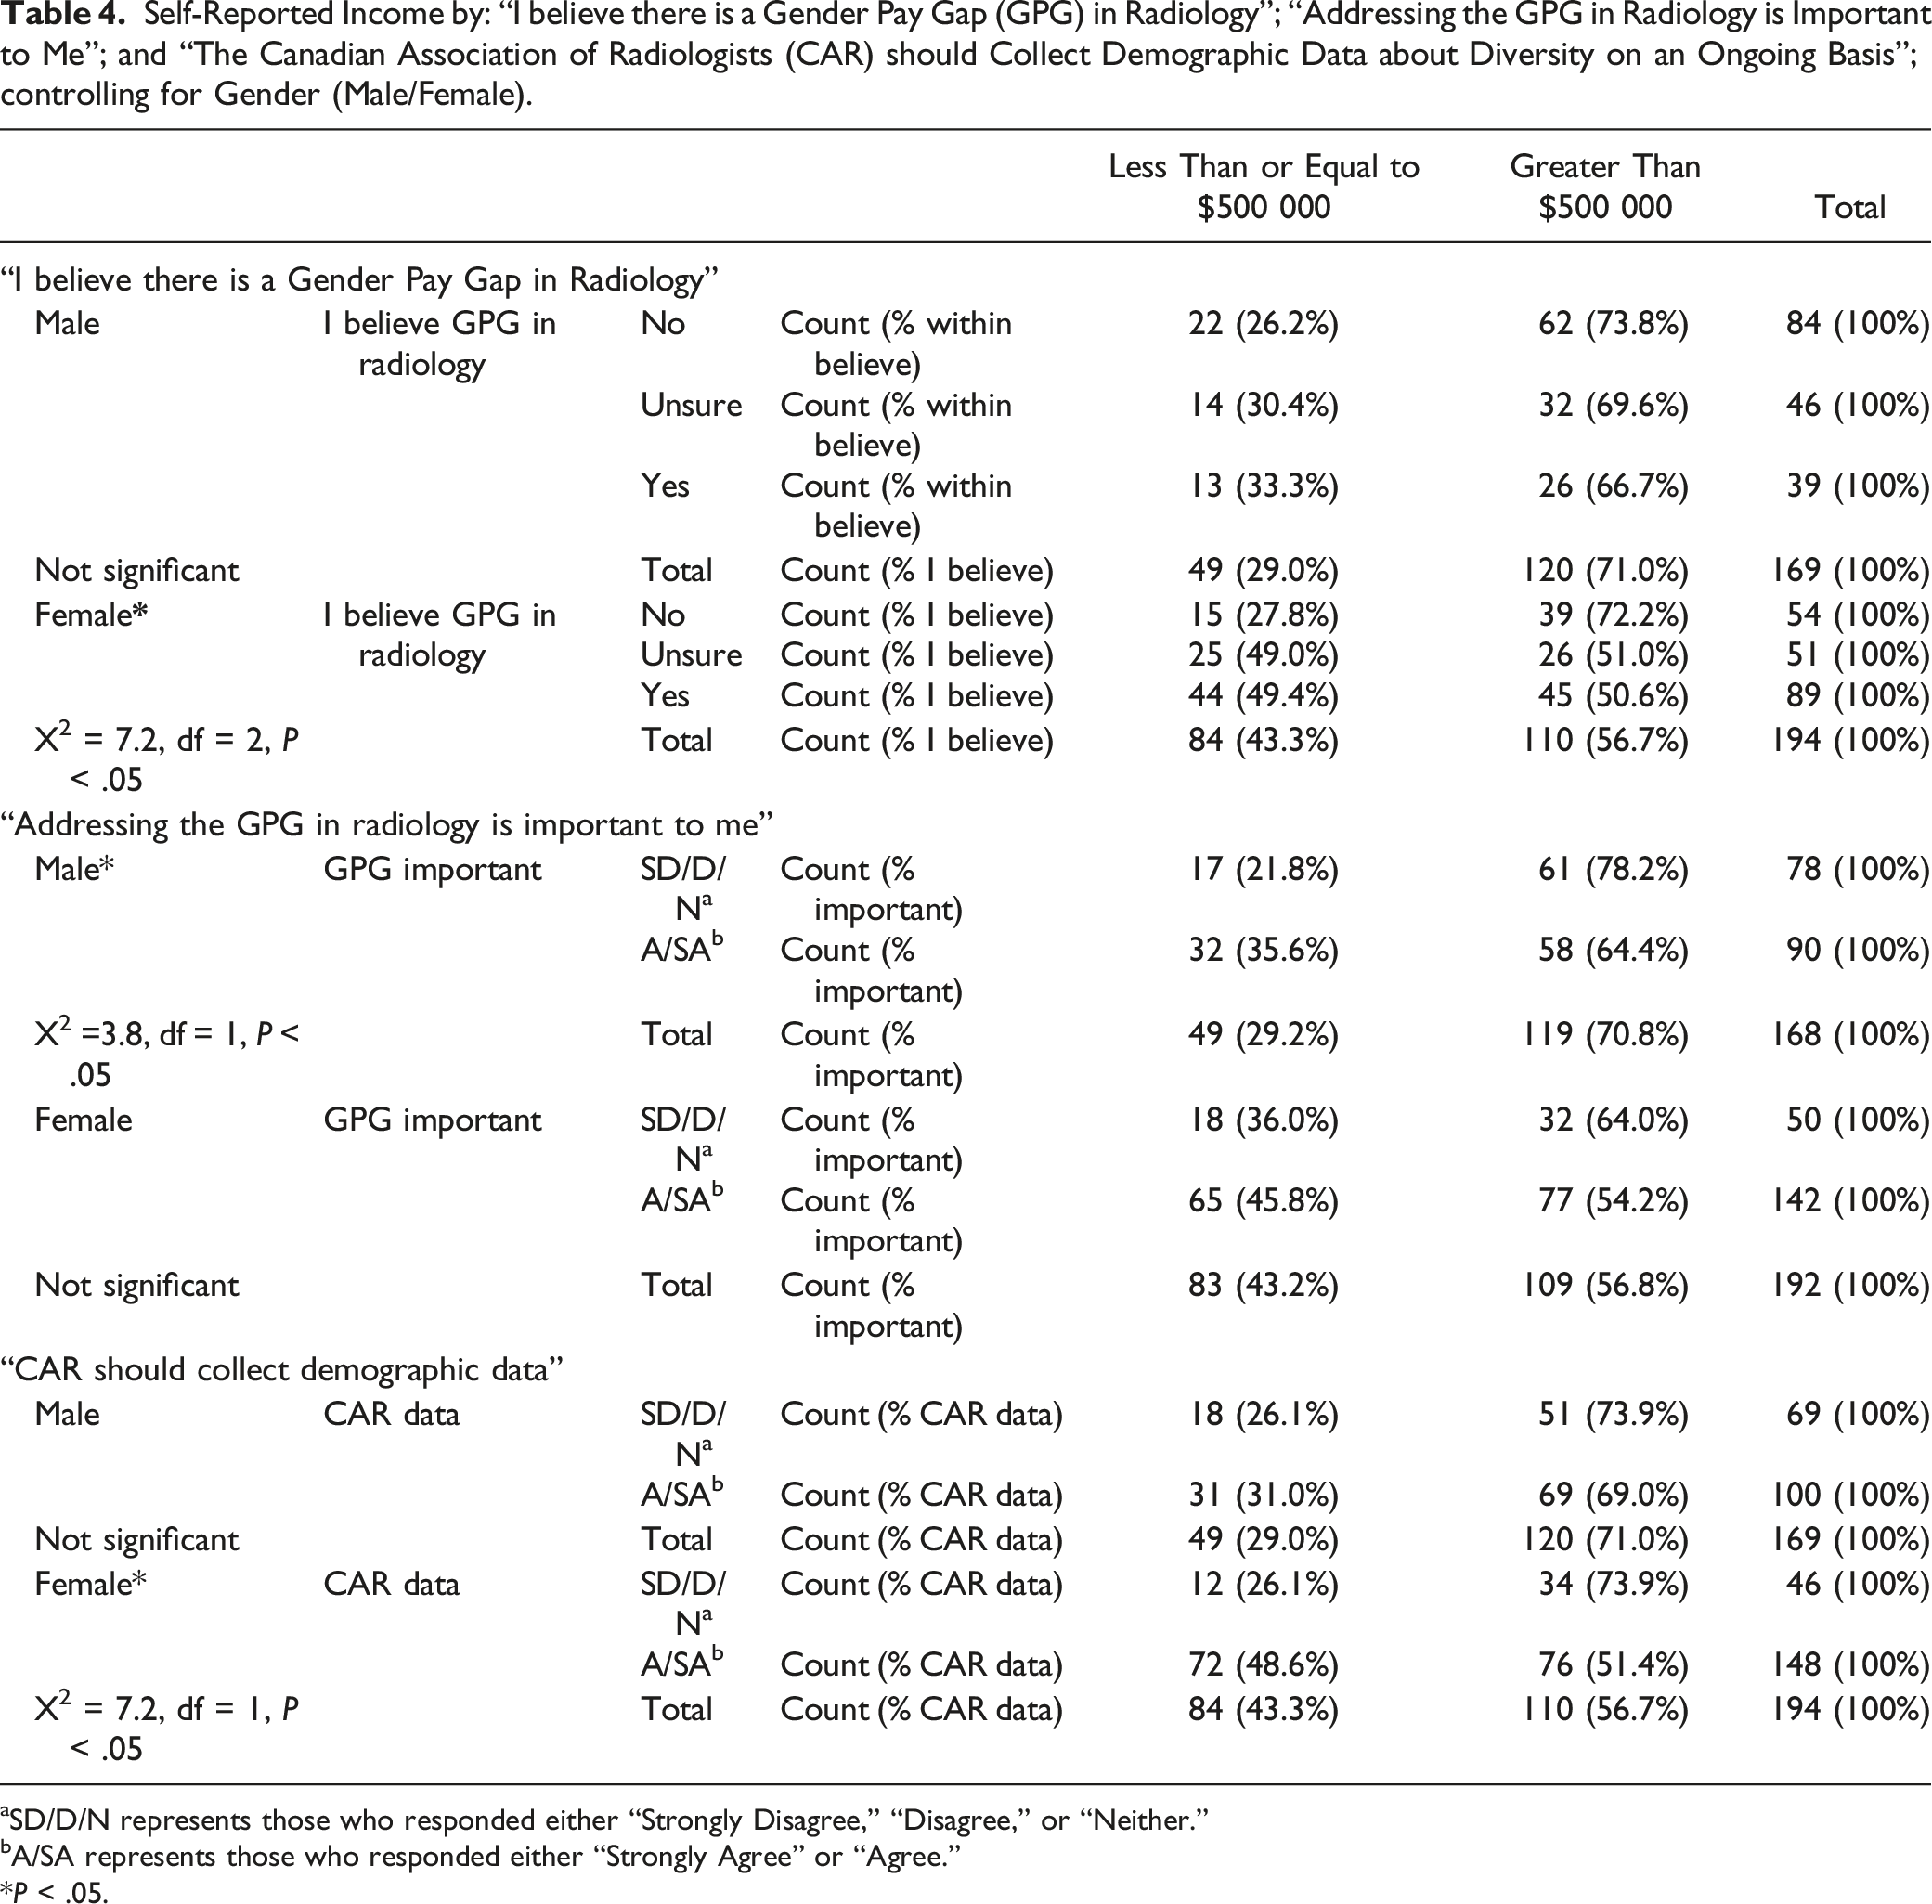
aSD/D/N represents those who responded either “Strongly Disagree,” “Disagree,” or “Neither.”
bA/SA represents those who responded either “Strongly Agree” or “Agree.”
*P < .05.
Discussion
To our knowledge, we are the first to report a Canadian radiology GPG. Our results indicate more full-time, male radiologists in Canadian report an income level “greater than $500 000” (79%), approximately 10% more than full-time, female radiologists (67%), which is consistent with many previous studies.9,15,16 We did not examine radiology subspecialties; however, previous studies6,17 have shown a GPG in both low-paying and high-paying medical specialties. Merali et al 18 found a GPG in fee-for-service claims in Ontario with women claiming less than men in nearly every medical specialty. More female radiologists subspecialize in breast, pediatric, and gynecologic imaging19-21; future studies must be conducted to establish how this affects the GPG.
Several studies have shown physician ethnicity affects pay gap.10,12 We had too few ethnic minority respondents to examine this relationship. We compared self-reported income of self-reported VMs vs self-reported Non-VMs, but unlike other studies within medicine, 12 we found no GPG; however, the number of ethnic minority respondents was small. The response rate may be lower for VM and URiM radiologists or there may be few ethnic minority radiologists. Since no data on Canadian radiologist ethnicity is available, we are not able to establish whether our study was underpowered. We found a GPG for non-VM and non-URiM respondents and we know that gender pay inequities exist within minority ethnic groups. 12 We hope that organizations such as CAR will collect demographic data, especially on self-reported ethnicity and VM status.
We analyzed whether the GPG varies by geography. We found a GPG in Western provinces, with 69% of men and 54% of women reporting income > $500,000. The number of respondents was especially low in Atlantic provinces, and lower in Central provinces, which limited analyses. Further research is required to explore whether provincial compensation models are equitable.
In Canada, Diagnostic Radiology (DR) remains a male-dominant specialty. In 2022, 76 males’ and 28 females’ first choice discipline was DR. Out of that, 53 males (70% of applicants) and 17 females (61% of applicants) were matched to DR. 22 In our survey, we found that the percentage of men and women with children is roughly equal, with more women than men reporting not having children. More women without children than those with children are earning >$500,000. Gender pay gap is found in women with children, but no such gap is found in those without children. We could infer that more women with children may—by choice, societal norm, or inflexibility of schedule—take up greater responsibility in childcare. This information may further deter women medical students who wish to have children from choosing radiology as a specialty, an already male-dominant specialty in Canada.
In our survey, we did not define “full-time vs part-time” by the number of hours worked, but relied on self-reported hours worked. We found more women, who self-reported working part-time, earning <$500 000 and yet there is a GPG for those who work full-time. Since our survey did not include actual number of hours worked, we are not able to correlate income with actual hours worked. Future studies are required to analyze if there is a direct correlation between income and work hours.
Kapoor et al 15 in 2017 analyzed publicly available salary information and concluded that in public medical schools, male and female academic radiologists had similar salaries after adjusting for age, faculty rank, years since residency, NIH funding, total Medicare payment etc. In 2022, Miller et al 16 compared gender-based salary differences in three different medical specialties—radiology, obstetrics and gynecology, and general surgery—and found no GPG in academic Radiology. They hypothesized the main reason for lack of disparity in salary in radiology, unlike other specialty, was because radiologists mainly work in shifts with less opportunity for gender-based increases to supplemental income. In contrast, we found no GPG for those without a faculty position (24%) but for academic radiologists a GPG with 46% of women compared to 31% of men reporting a salary at or below $500 000.
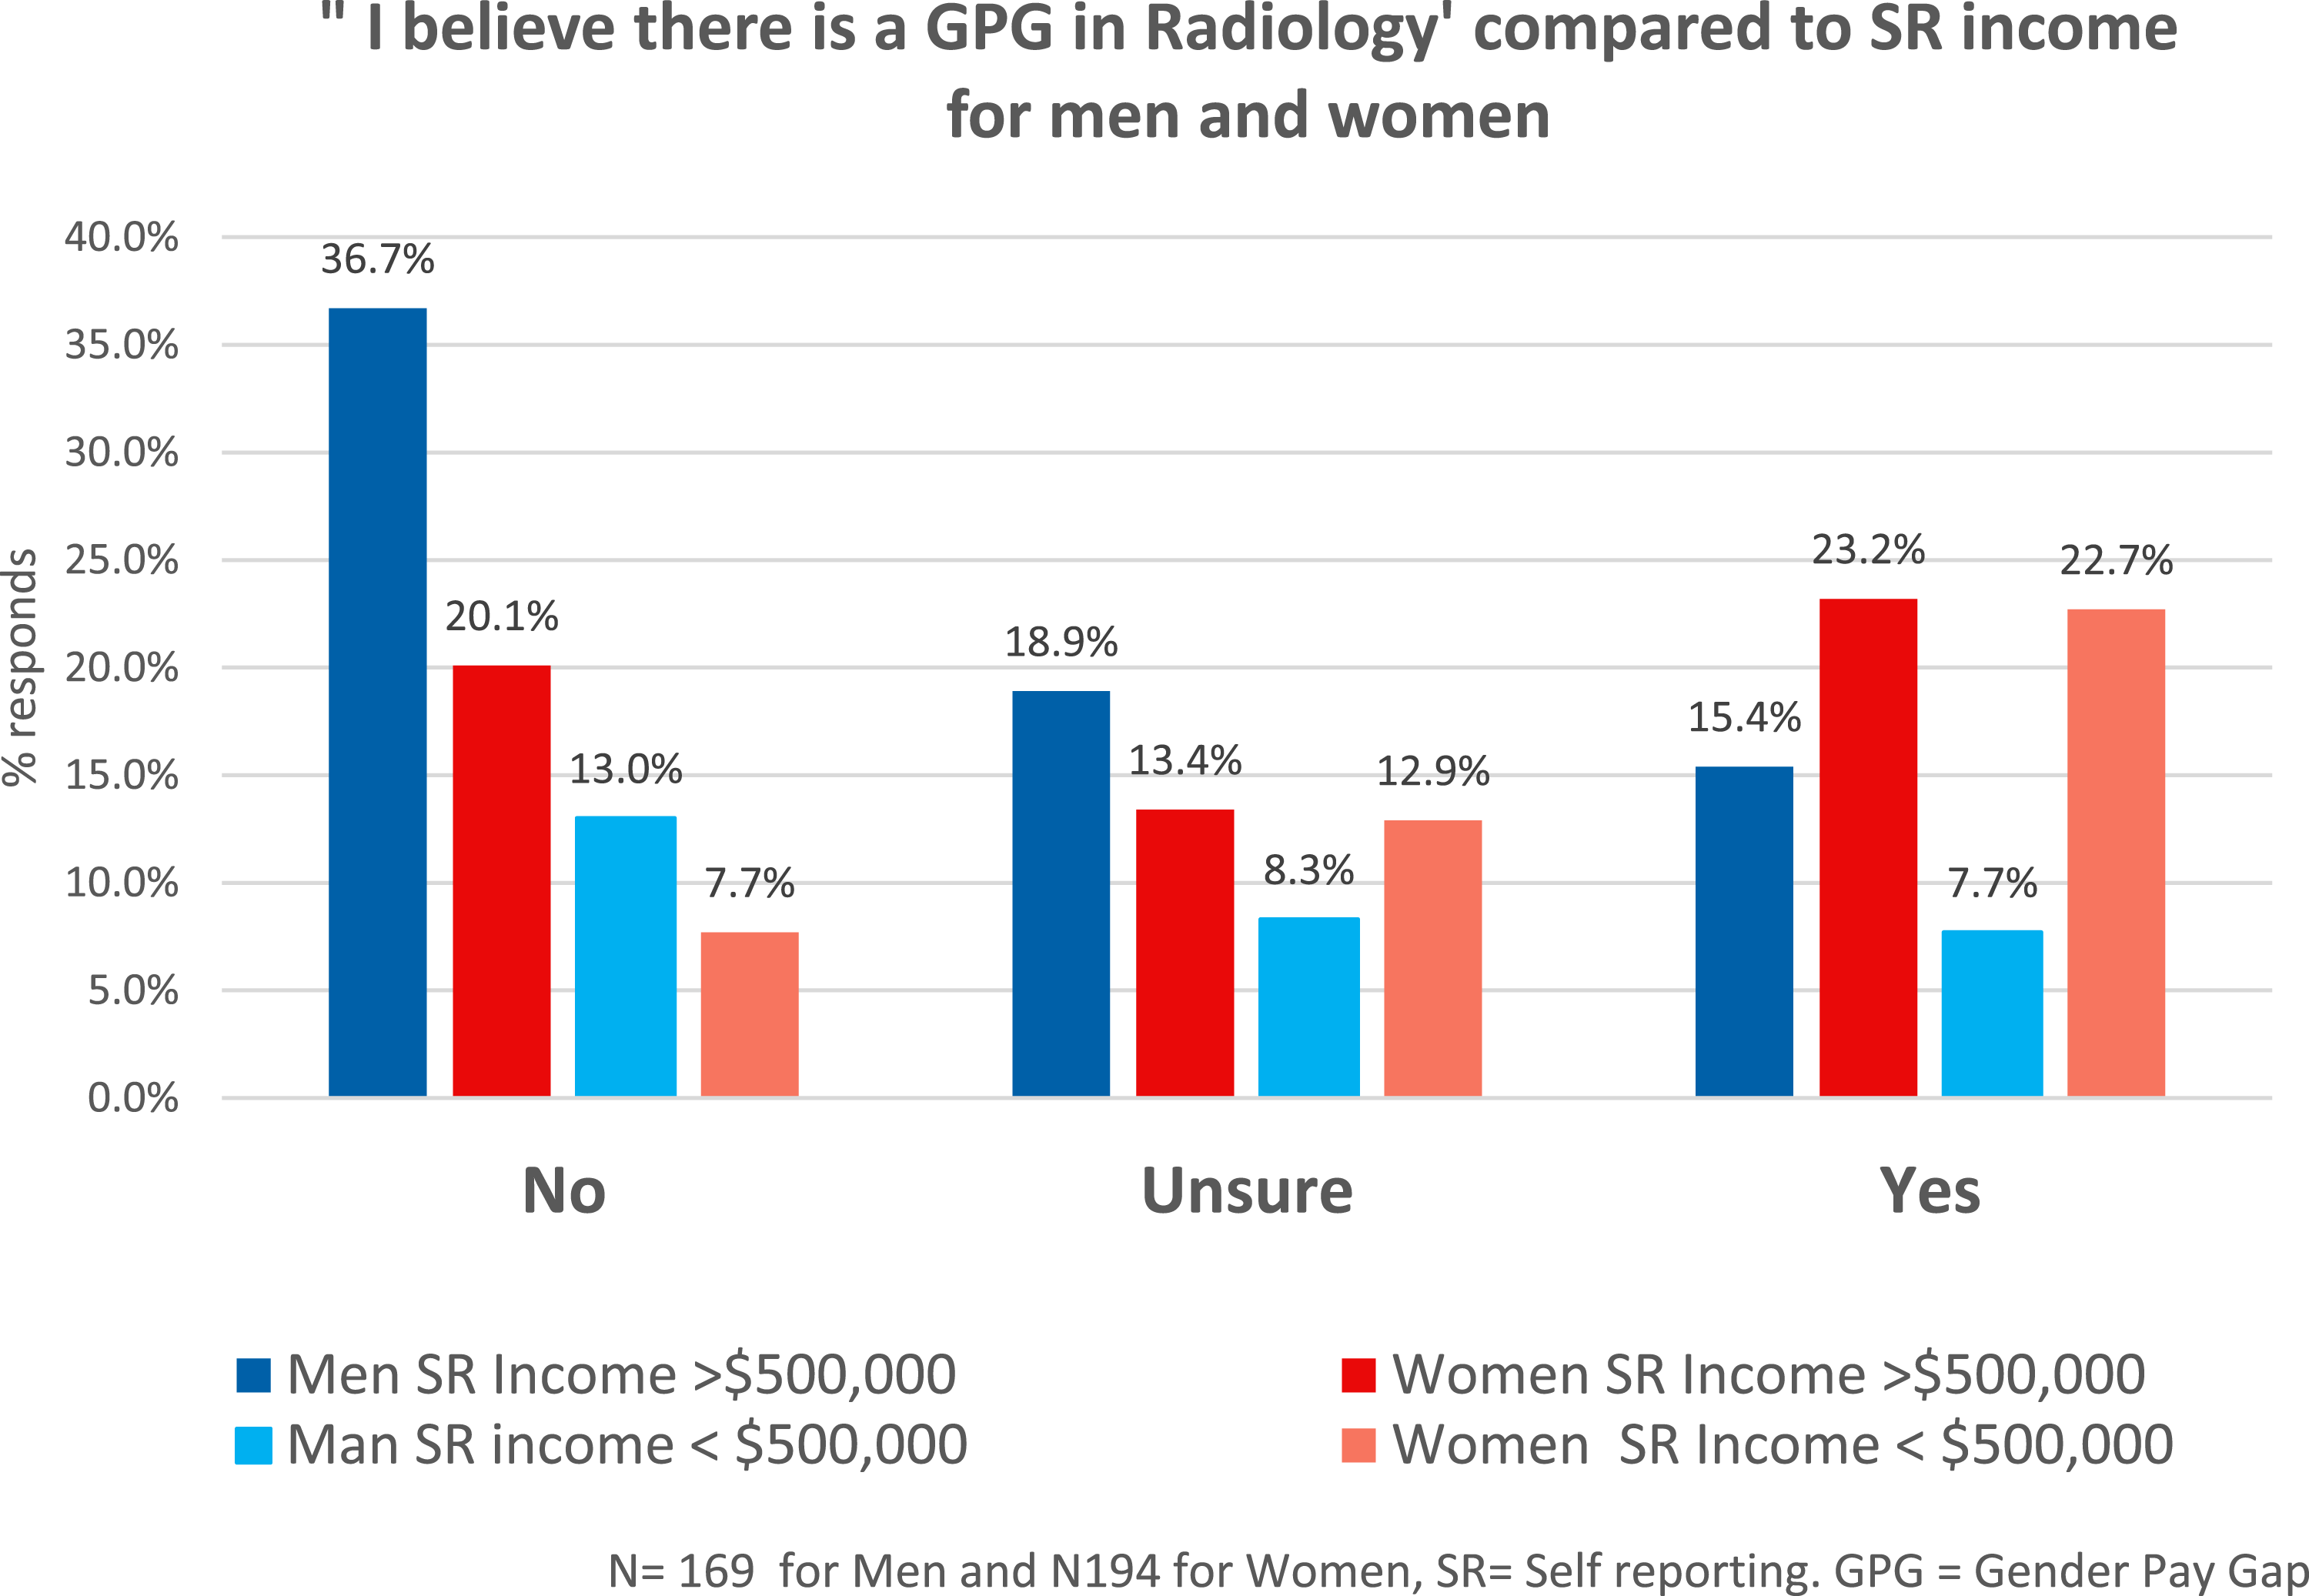
We asked whether the respondent believes a GPG exists in radiology. 48.7% of men responded “no” compared to 23% of women (see Figure 2). Greater number of men than women with self-reported income >$500,000 do not believe that there is a GPG in radiology (see Figure 3). This shows that there is a relationship between level of income and gender and how a GPG was viewed. A self-reported income level above $500,000 may influence male and female responses differently (Table 4). In addition, there is a moderate correlation between “addressing the GPG is important” and the opinion that CAR should collect demographic data. This information should encourage our national organization to initiate these efforts. Further work in this area is justified to better understand attitudes towards the GPG in Canadian radiology. Answer to question “I believe there is a gender pay gap in radiology.” Answers to question “I believe there is a gender pay gap in radiology” compared to SR income for men and women.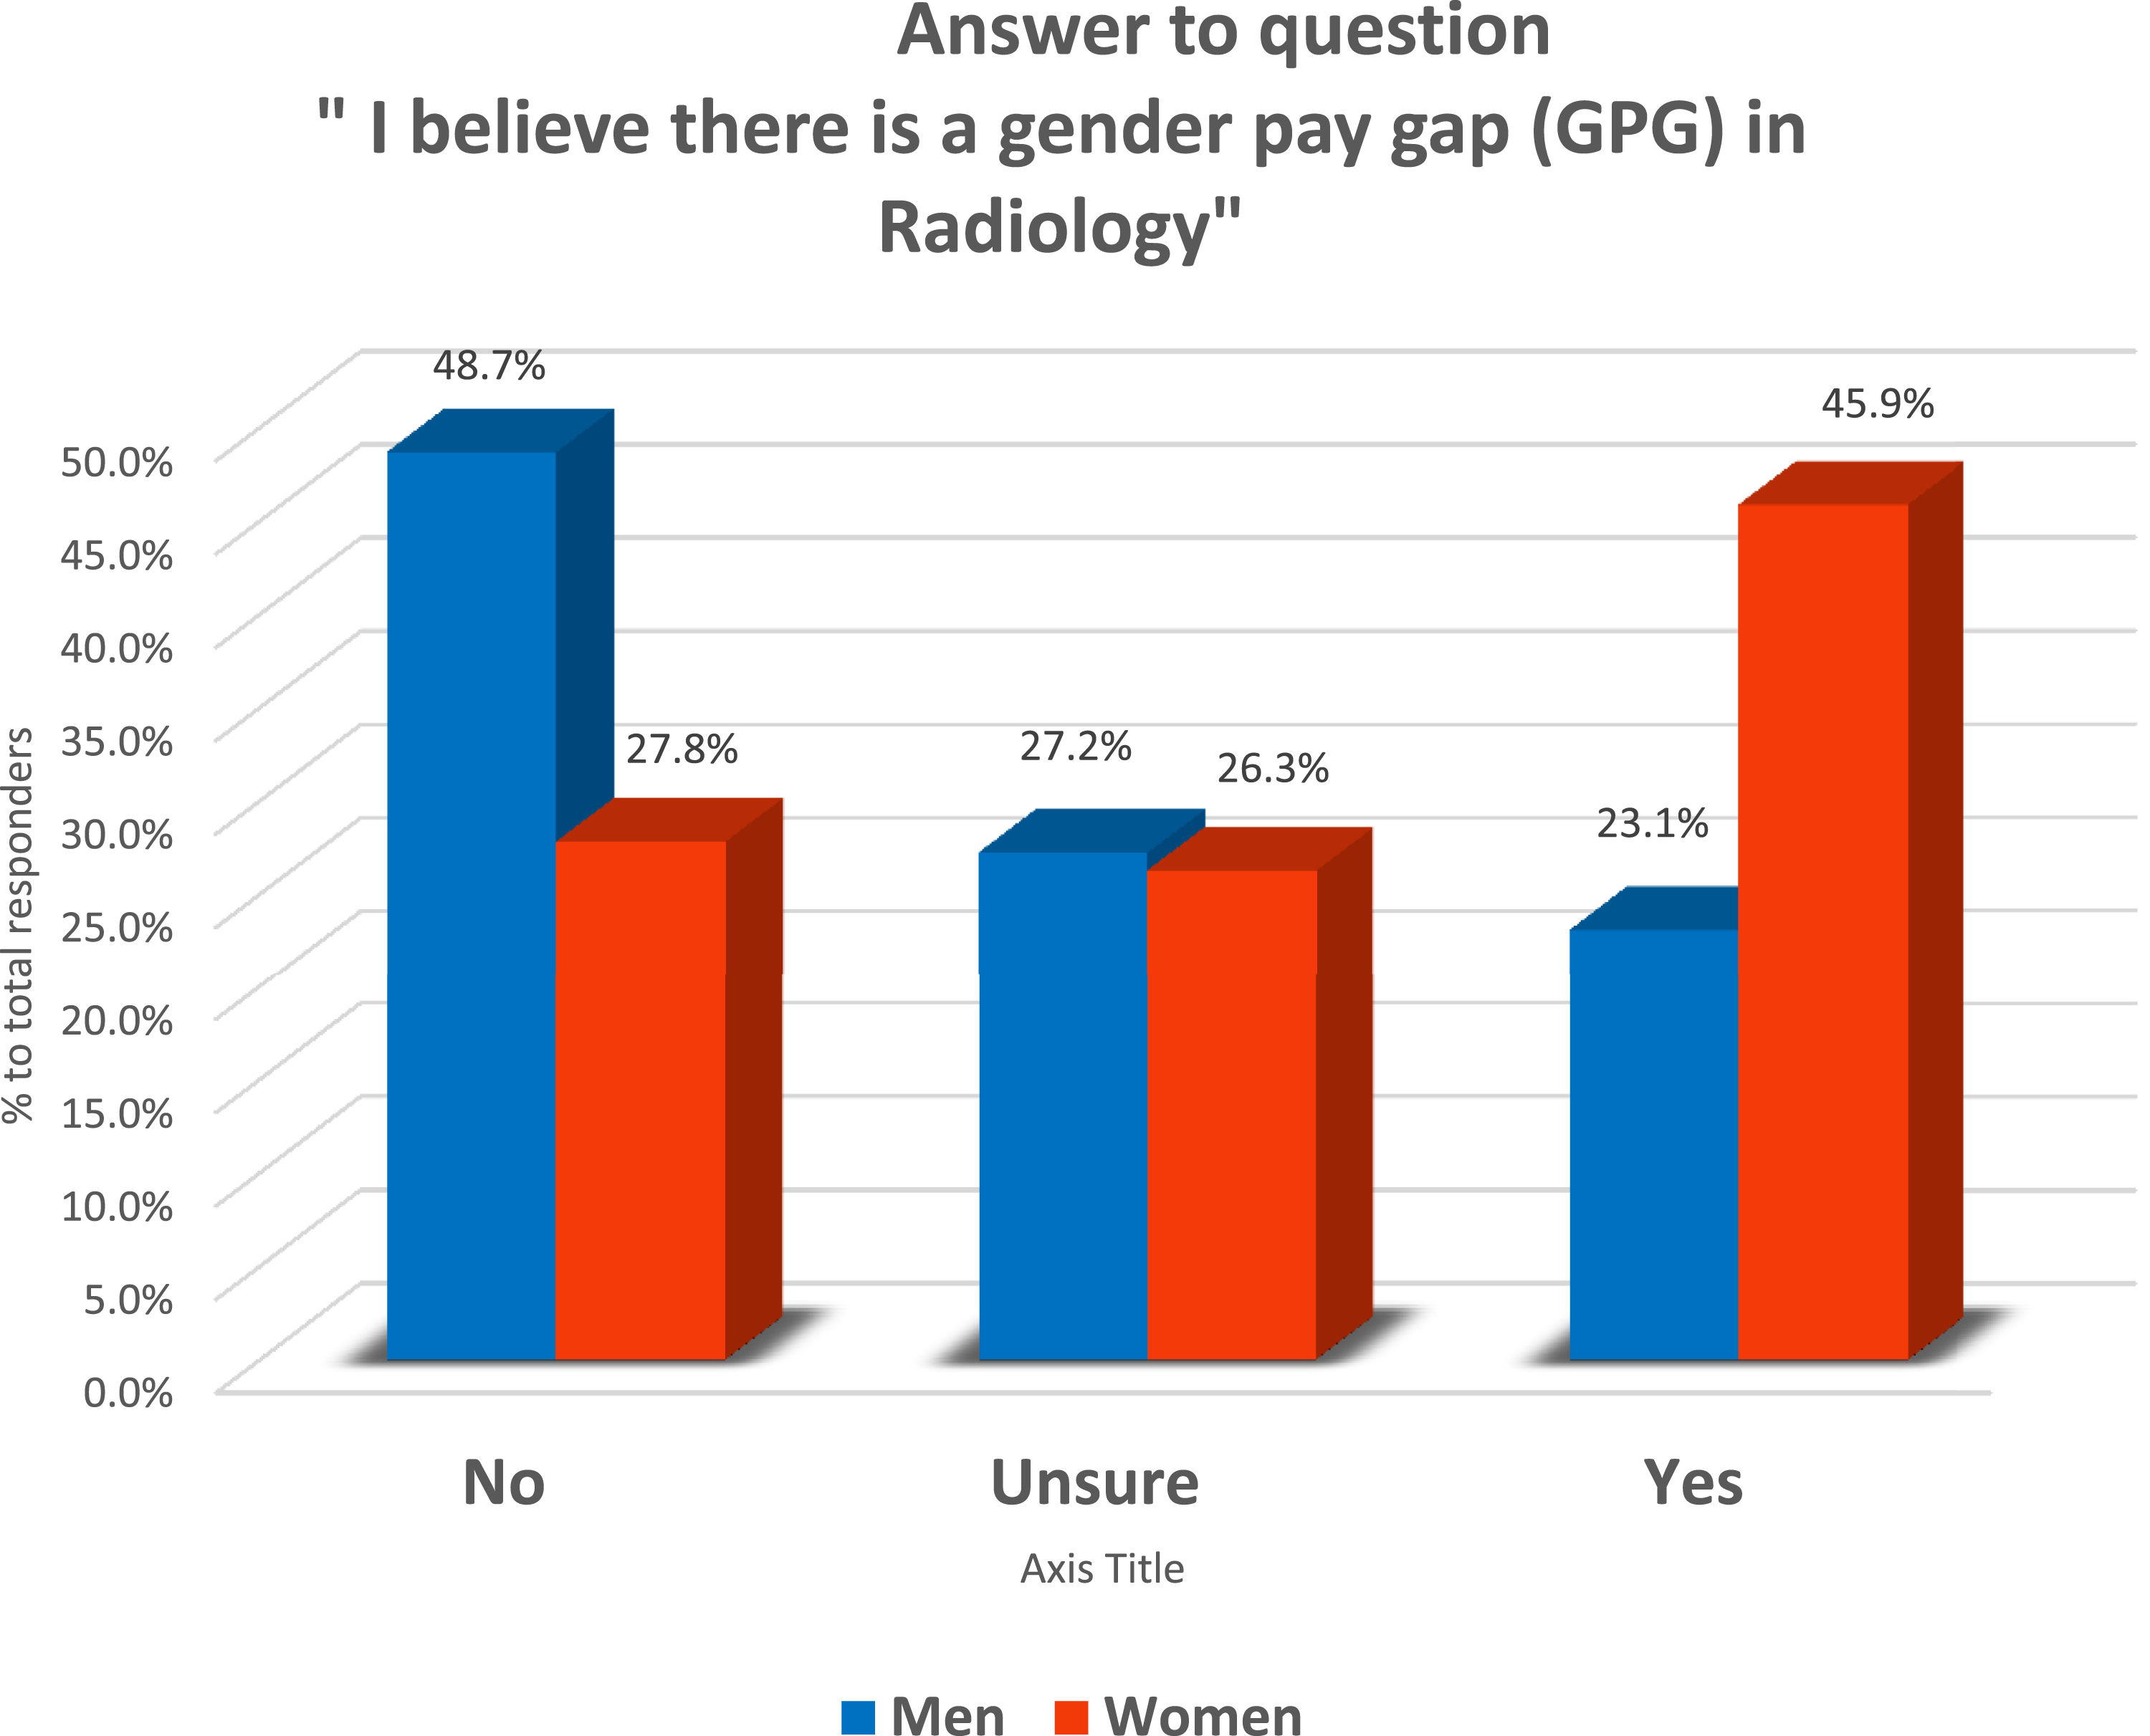
The study has several limitations. Our response rate is 20–25% based on estimated number of Canadian Radiologists and although this is relatively low, the absolute number of respondents, except for some subgroups, was generally sufficient to examine the primary research question. The low response rate for non-binary gender identity, non-existent LGBTQ+ respondents is notable, as was the low response rate for different ethnic groups. This could be because of the lower response rate in general, low number of sexual and ethnic minorities in radiology, or could be because respondents were uncomfortable revealing their minority status. Several respondents chose “prefer not to say” for demographic questions.
The income data are self-reported and our sample size across different subgroups only allowed us to examine two income levels, which may have limited our ability to detect differences, potentially within income brackets greater than $500,000. Our survey did not specify gross vs net income, methods of remuneration (fee-for-service, pooled-income vs alternative payment). Supplemental income from academic or leadership positions were also not included. As many radiologists in Canada are in group practices with pooled-income, further analysis to determine if GPC exist in such payment model will be very valuable as in principle, pooled-income should ensure equitable pay for all in the group. This study also has potential for non-response bias and social desirability bias. Most of our responders were from the larger provinces and some provinces were underrepresented. The response rate for non-academic radiologists is lower (23.6%) than for academic radiologists (76.4%). This could be due to our methods of communication regarding the survey, as it was advertised both through social media and national organizations, the latter of which may have greater participation from academic radiologists.
Conclusion
Our results suggest that there is a GPG in Canadian radiology. Although our data are self-reported, our results are consistent with the study published comparing Canadian physicians’ net income adjusting for practices overheads. 23 Obtaining official data for accurate analysis on this topic will be an important first step for the radiology community in further investigating pay difference based on gender and other demographic characteristics. There is a great opportunity for Radiology to narrow the GPG and strive for pay equity.24,25
Footnotes
Declaration of Conflicting Interests
The author(s) declared no potential conflicts of interest with respect to the research, authorship, and/or publication of this article.
Funding
The author(s) received no financial support for the research, authorship, and/or publication of this article.