
Abstract
Purpose:
To examine if tweeting bias exists within imaging literature by determining if diagnostic test accuracy (DTA) studies with positive titles or conclusions are tweeted more than non-positive studies.
Methods:
DTA studies published between October 2011 to April 2016 were included. Positivity of titles and conclusions were assessed independently and in duplicate, with disagreements resolved by consensus. A negative binomial regression analysis controlling for confounding variables was performed to assess the relationship between title or conclusion positivity and tweets an article received in the 100 days post-publication.
Results:
354 DTA studies were included. Twenty-four (7%) titles and 300 (85%) conclusions were positive (or positive with qualifier); 1 (0.3%) title and 23 (7%) conclusions were negative; and 329 (93%) titles and 26 (7%) conclusions were neutral. Studies with positive, negative, and neutral titles received a mean of 0.38, 0.00, and 0.45 tweets per study; while those with positive, negative, and neutral conclusions received a mean of 0.44, 0.61, and 0.38 tweets per study. Regression coefficients were -0.05 (SE 0.46) for positive relative to non-positive titles, and -0.09 (SE 0.31) for positive relative to non-positive conclusions. The positivity of the title (P = 0.91) or conclusion (P = 0.76) was not significantly associated with the number of tweets an article received.
Conclusions:
The positivity of the title or conclusion for DTA studies does not influence the amount of tweets it receives suggesting that tweet bias is not present among imaging diagnostic accuracy studies. Study protocol available at https://osf.io/hdk2m/
Introduction
The selective citation of articles based on their stated results is prevalent in the scientific literature.1,2 Diagnostic accuracy studies tend to be cited more frequently if they report higher accuracy estimates 3 or make ‘positive’ statements within the title or conclusion (ie: claiming an imaging modality to be accurate or clinically useful). 4 Imaging diagnostic accuracy studies with positive conclusions are also more likely to be published and are published faster. 5 Interestingly, a multivariable analysis identified no association between magnitude of diagnostic test accuracy (DTA) and higher likelihood of publication. 6 As diagnostic imaging studies have a tendency to “spin” their results referring to the reporting practice of accentuating optimism regarding their study topic beyond what the results justify, this citation bias could result in the overinterpretation of accuracy of imaging modalities.7-10 This subsequently can lead to their increased and inappropriate use in clinical practice. 11 This spin has been suggested to be present to some degree in >90% of diagnostic accuracy studies, with overly positive conclusions, not reflecting accurate estimates present in >70% of systematic reviews. 8
Social media platforms are increasingly being used by the scientific community for research dissemination among colleagues.12-14 In particular, Twitter is commonly used for scholarly communication. 14 If a tweet bias were to exist, where there was a preference to share articles with more positive statements, then this could also overinflate the perceived clinical utility of imaging modalities. Altmetric, a database which tracks, collects, and displays metrics on where published research is mentioned online, is used to quantify various social media metrics from a variety of sources (such as Twitter and Facebook).15,16 These “alternative metrics” or “altmetrics” have been previously used to explore factors, such as discipline, number of authors and country of origin, that impact the rate of tweets about a scholarly article.17,18 In addition, a weak positive correlation exists between citation and tweet rates suggesting that Twitter-based metrics could reflect different dissemination information than previously shown by citation rates.19,20 Thus, these altmetrics have been suggested to be complementary to traditional methods of capturing a study’s impact.21,22
Within diagnostic imaging research, the topic of tweeting bias has not been previously explored. The purpose of this study is to evaluate if tweeting bias exists in diagnostic imaging research by assessing if studies with positive titles or conclusions are tweeted more frequently than their non-positive (negative or neutral) counterparts.
Methods
Research ethics board approval is waived at our institution for bibliometrics analyses. Study protocol available at https://osf.io/hdk2m/
Search Strategy and Selection
A convenience sampling strategy was employed, where primary studies were identified for inclusion from 2 previously collected diagnostic accuracy imaging systemic reviews.3,22 Medline was searched for systematic reviews or meta-analysis of diagnostic test accuracy studies between January 1, 2005 to April 30, 2016 with the following search strategy “systematic review” and “English” filters plus “diagnostic test accuracy OR DTA[tiab] OR sensitivity AND specificity[MH] OR specificit*[TW] OR “false negative”[TW] OR “accuracy[TW]”. Search results were restricted to radiology, medical imaging, and nuclear medicine journals, as defined by Clarivate Analytics Journal Citation Reports. 3 Again, Medline was searched between January 1 to December 31, 2015 for systematic reviews of diagnostic accuracy studies, by applying the search filter systematic[sb] AND (sensitivity and specificity[mesh] OR sensitivit*[tw] OR specificit*[tw] OR accur*[tw] or ROC[tw] or AUC[tw] or likelihood[tw]). Search was restricted to imaging and radiology journals, as defined by Thomson Reuters’ Journal Citation Reports.3,23 Studies were included if they evaluated the diagnostic accuracy of one or more imaging tests and reported at least 1 set of both sensitivity and specificity estimates (or complete 2 x 2 data). Studies were excluded if they solely evaluated the accuracy of predictive or prognostic tests, published prior to October 1st, 2011 (since Altmetric only has data available from this point onwards), written in languages other than English, not indexed in the Web of Science database (citation data unable to be extracted), duplicate occurrences of an included study in another meta-analysis, retracted studies, those with no abstracts, and if authors were unable to locate or access the full text through institutional subscriptions.
Data Collection
The article title, continent of the corresponding author, publication date, journal, sensitivity, and specificity were extracted in 2 previous studies.3,23 The 2018 journal impact factor and open access status was extracted from Clarivate Analytics Journal Citation Reports (the most recent data available). Default values were assigned in cases where the complete publication date was not available. In cases where the day of publication was unavailable, the 16th day of the month was assigned as default; when the day and month of publication was unavailable, June 30 was assigned as default. Altmetric was used to derive the number of Twitter posts made about an article within 100 days since publication. This was used rather than total tweets over a study’s lifetime since tweets are known to follow a highly skewed power law distribution, which will cause the tweet rate of more recently published articles to be inflated. 24 Article DOIs were used to query the Altmetric Details Page API, version v1. 15 If DOIs were not available, the PubMed ID was used in Altmetric Explorer. For articles missing information, an imputation with a linear regression model using the MICE package in R software (version 3.5.1, R Foundation for Statistical Computing) was conducted.25-28
Assessment of Title and Conclusion Positivity
Title and conclusion positivity were extracted from 2 previous studies.3,23 The title and conclusion positivity was assessed using an adaptation of a previously validated scoring system for diagnostic accuracy research in duplicate with conflicts resolved by consensus. 8 The scoring system classified titles and conclusions as either positive, positive with qualifier, neutral, or negative. Two components of the conclusions were analyzed in order to assess positivity, which included the summary statement and implication for practice. The summary statement directly refers to the diagnostic accuracy of a given test from the results obtained within the study. The implication for practice refers to statements not directly reflected in the results, but provides insight into how the results are applicable to a given field of study. This information was obtained from the appropriate section of the abstract where applicable. As these sections are most likely to represent the author’s main conclusions, the full text was not required to be evaluated. In cases of an unstructured abstract, the statements following the results were assigned as the conclusion.
Statistical Methods
A negative binomial regression analysis (with separate models for title and conclusion positivity) was conducted to determine whether an association is present between conclusion or title positivity and number of tweets a study received. The following confounding variables were controlled for as they are known to influence the dissemination of an article: year of publication, Youden’s index (sensitivity + specificity - 1), 2018 journal impact factor, open access status (open access vs. subscription-based), and the continent of corresponding author. 4
The threshold for positivity of the main outcome of the studies included the titles or conclusions which were classified as positive and positive with qualifier. A sensitivity analysis was performed by organizing titles deemed as positive with qualifier with those deemed as neutral, varying the threshold for positivity to include only positive titles and conclusions.
Using R software for analysis (version 3.5.1, R Foundation for Statistical Computing), the P values for the association of title and conclusion positivity with tweets were obtained by means of likelihood ratio testing with a chi-square model, and a value of 0.05 was used as the threshold for significance.
Results
Study Selection
Of the unique 1,513 identified diagnostic imaging studies, 354 (23%) met the inclusion criteria. The process of study selection is as outlined in Figure 1.
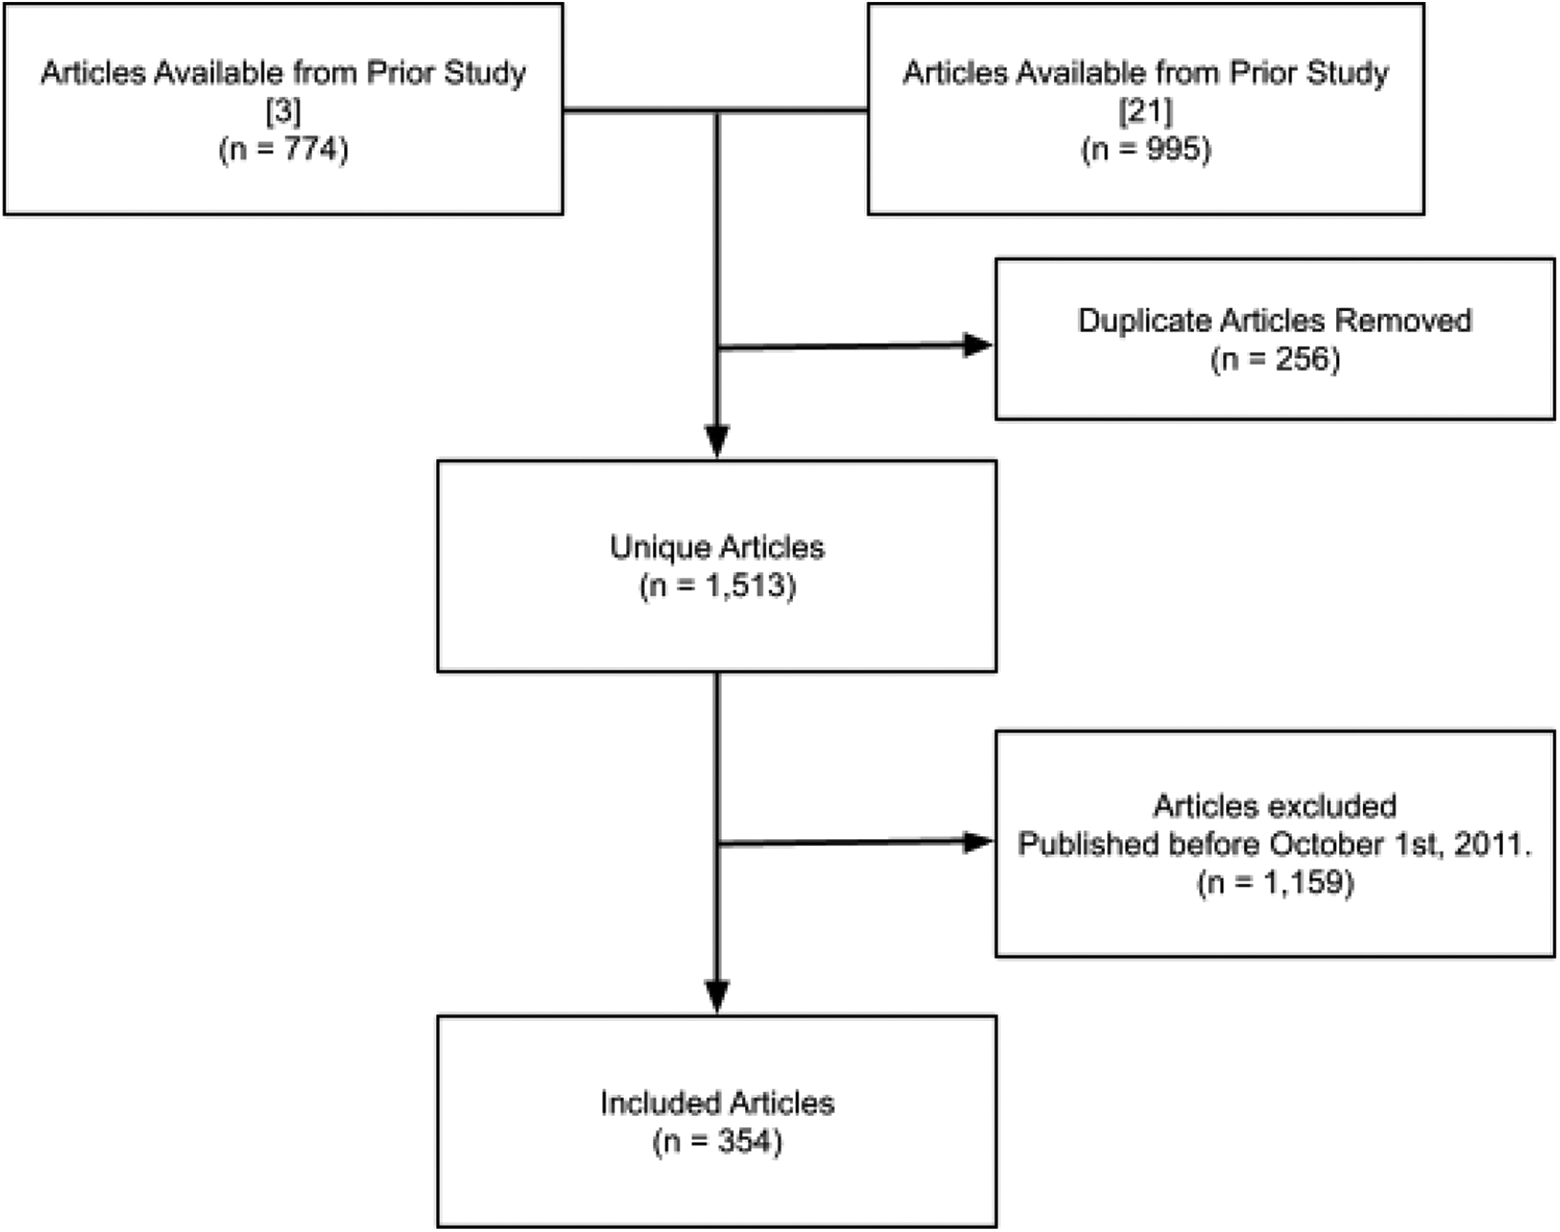
Flow diagram showing article selection and exclusions.
Study Characteristics
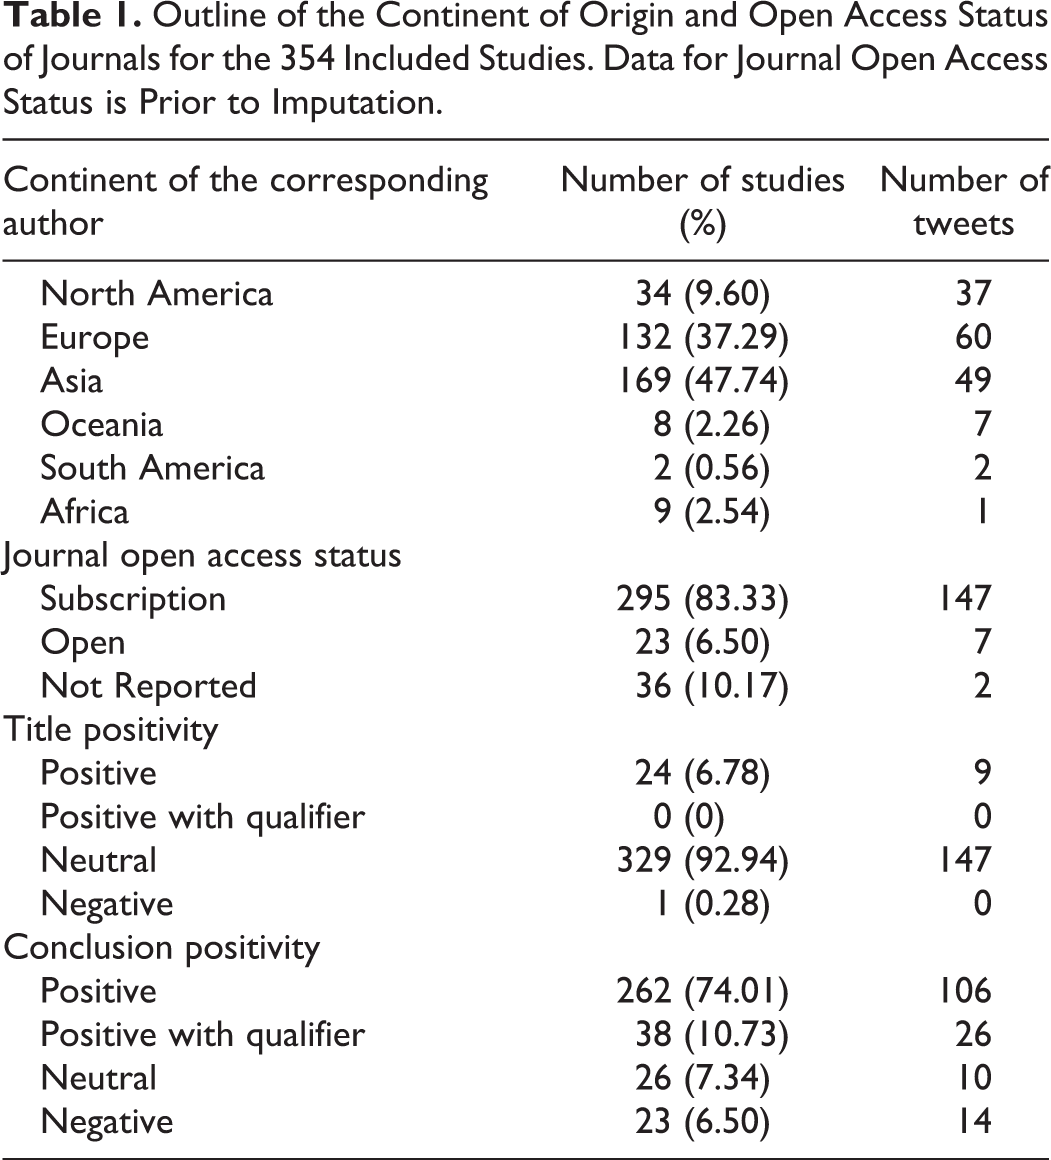
The number of studies from each continent, journal open access status, and positivity analysis can be found in Table 1. Thirty-six of these studies had missing open access status which was adjusted for with the linear regression imputation resulting in the number of subscription and open access journals of 325 and 29. The journal dates ranged from October 1st, 2011 to May 19, 2015. The mean Youden’s Index was 71.89 (STD 18.78) with a median of 75.40. The mean 2018 journal impact was 4.31 (STD 4.57) with a median of 2.95. The range of tweets made about included studies within 100 days of their publication was 156 with the mean number of tweets per article of 0.44 (STD 1.56) and a median of 1.15. The range of tweets per article were 0 to 15, with 261 articles receiving no tweets at all within 100 days since publication.
Outline of the Continent of Origin and Open Access Status of Journals for the 354 Included Studies. Data for Journal Open Access Status is Prior to Imputation.
Tweet Analysis
A negative binomial regression model found that title and conclusion positivity did not have a significant relationship with the number of tweets a study received. Further, the 2018 journal impact factor had a statistically significant positive relationship with the number of tweets a study received with a regression coefficient of 0.09 (P < 0.001). The year of publication, Youden’s index, open access status, and continent of the corresponding author all were not associated with the number of tweets a study received, as shown in Table 2. These findings persisted in sensitivity analysis when ‘positive with qualifier’ were grouped with non-positive studies (Table 3).
Association of Multiple Study Characteristics With Tweets Made in the 100 Days Post Publication, as Determined by Negative Binomial Regression.a
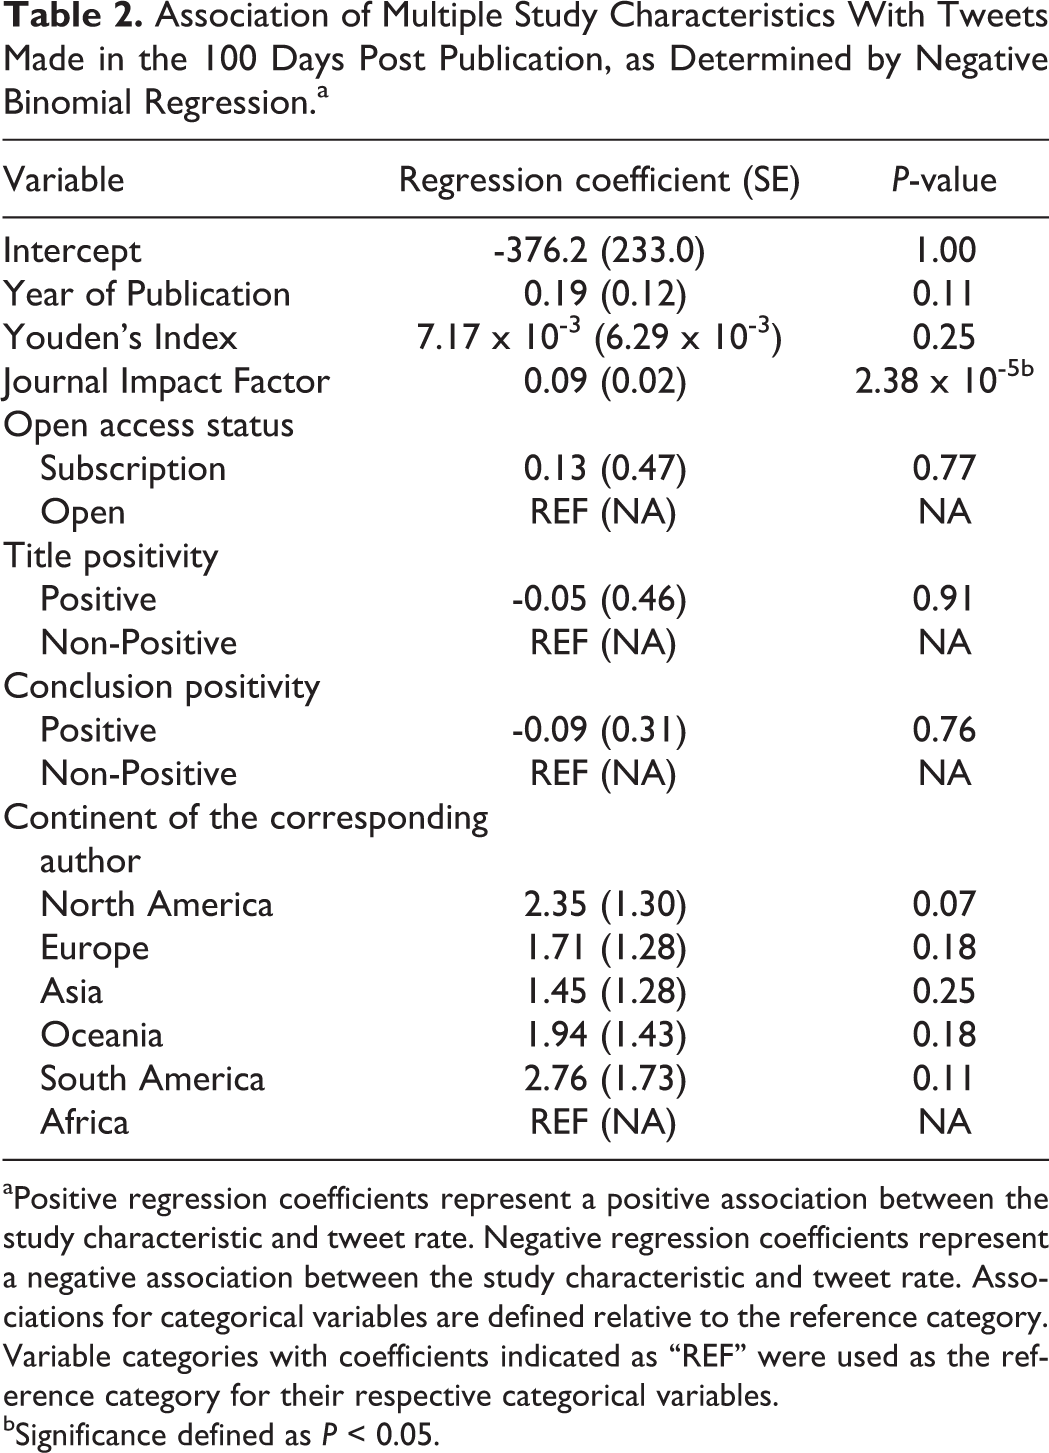
aPositive regression coefficients represent a positive association between the study characteristic and tweet rate. Negative regression coefficients represent a negative association between the study characteristic and tweet rate. Associations for categorical variables are defined relative to the reference category. Variable categories with coefficients indicated as “REF” were used as the reference category for their respective categorical variables.
bSignificance defined as P < 0.05.
Sensitivity Analysis, Taking Positive with Qualifier to be Assigned Non-Positive, Looking at Association of Multiple Variables with Tweets Made in the 100 Days Post Publication, as Determined by Negative Binomial Regression.a
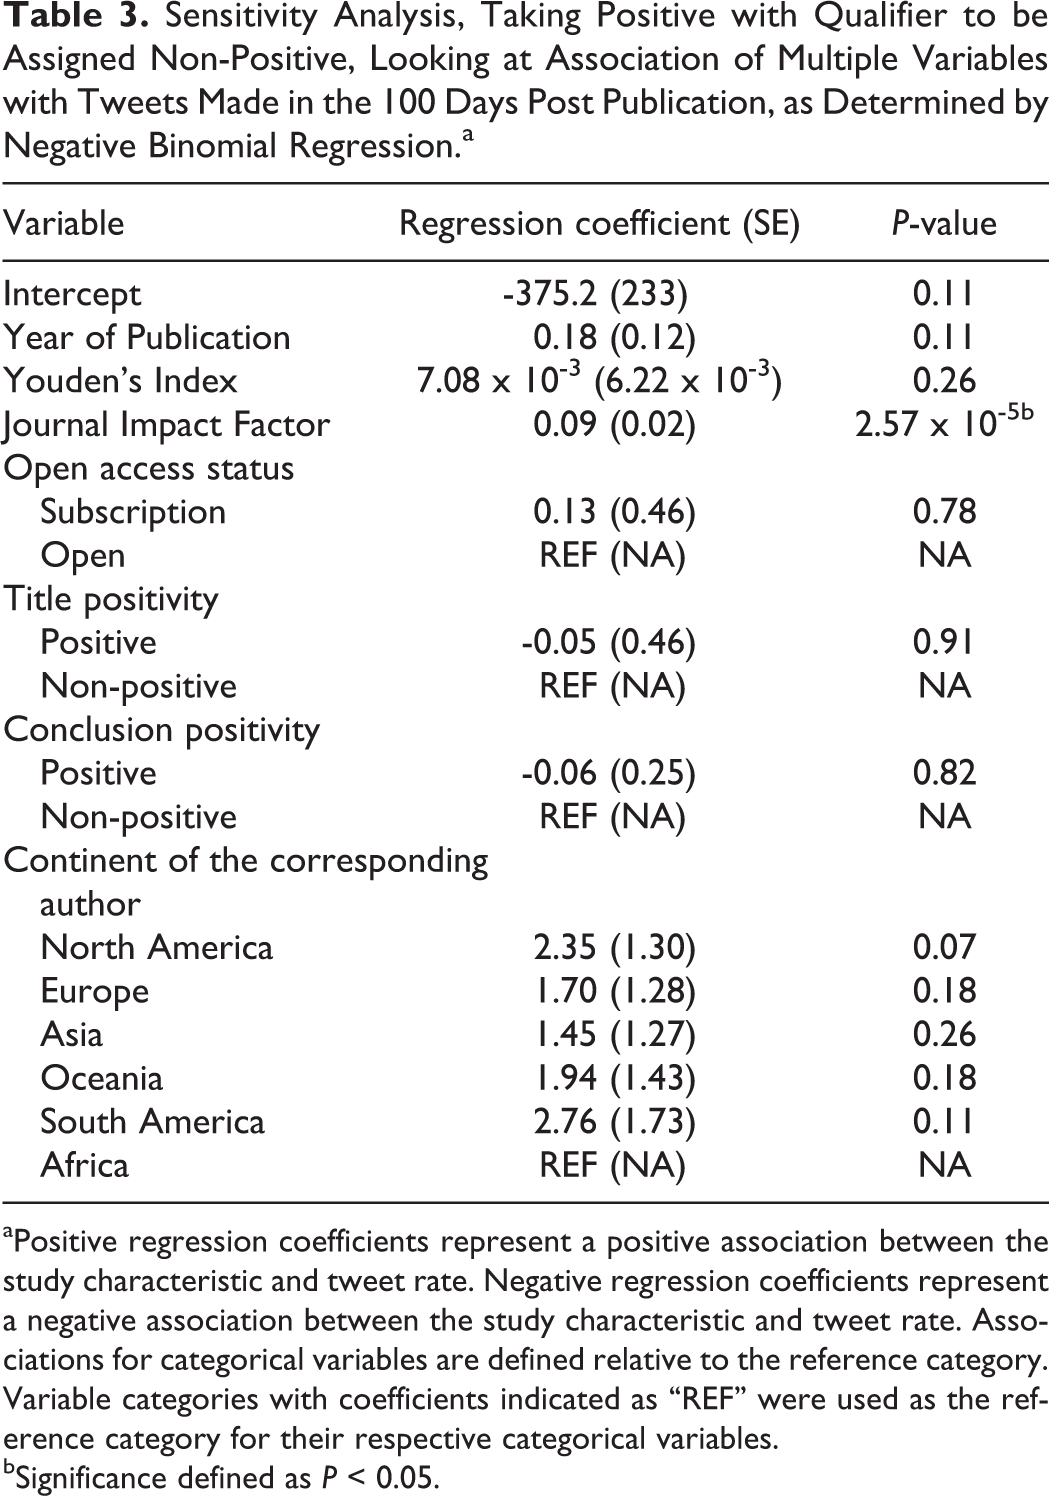
aPositive regression coefficients represent a positive association between the study characteristic and tweet rate. Negative regression coefficients represent a negative association between the study characteristic and tweet rate. Associations for categorical variables are defined relative to the reference category. Variable categories with coefficients indicated as “REF” were used as the reference category for their respective categorical variables.
bSignificance defined as P < 0.05.
Discussion
The objective of this study was to assess for the presence of tweeting bias in DTA literature by assessing if studies with positive titles or conclusions were tweeted more frequently than their non-positive counterparts. Previous research by Treanor et al. identified the presence of selective citation practices in DTA studies, which suggests the presence of a citation bias.4,18 Interestingly, in this cohort of imaging DTA studies, tweeting bias was not observed.
We found that there were substantially more positive titles (n = 24) and conclusions (n = 300) compared to negative titles (n = 1) and conclusions (n = 23).29,30 The high prevalence of positive studies in DTA research can be explained by their preferential submission and publication relative to studies with nonpositive titles or conclusions. 31 Alternatively, this high prevalence of positive studies can be related to the tendency of researchers to “spin” their results in DTA research where the titles and conclusions represent a level of optimism that is not justified by the results of their study.7,8 These practices are abundant in DTA research, with a prevalence of over 90% for potential overinterpretation of research findings.8,32,33 This is partially due to the nature of the results in DTA research where 1 interprets a diagnostic accuracy estimate rather than a threshold for statistical significance (unless a comparative test is available) which allows for an ambiguous conclusion regarding the accuracy of a test. This study also explored other variables which may be associated with the number of tweets an article receives, of which the 2018 journal impact factor was found to be positively associated. This is expected, as a higher impact factor may be associated with both a more extensive journal resources and a larger audience of readers, which increases a study’s subsequent likelihood of being tweeted. A study by Frank et al. found that higher accuracy estimates were a driver for citations in DTA research, however, in the present study no analogous association was found for tweets as higher accuracy estimates (Youden index) was not associated with higher amount tweets. 3 Further, despite Twitter’s increasing popularity, no positive association was found between the study’s year of publication and number of tweets. Although studies published in open access journals are more readily accessible than their subscription-based counterparts, no association was present with the number of tweets.
It is reassuring to find that preferential tweeting on the basis of title or conclusion positivity was not found for DTA studies. Preferential tweeting on the basis of title or conclusion positivity is problematic as these studies will be overrepresented, which can influence the perceived effectiveness of a particular diagnostic test.1,34,35 Particularly, it has been found that tweeting results in significantly more article citations over time, demonstrating the impact that social media has on the dissemination of academic literature. 36 This overrepresentation misconstrues the information available for a certain topic which can lead to adverse patient outcomes due to an inappropriate imaging test being used. Thus it is encouraging to not see tweeting bias for DTA research, although the citation bias practices are readily apparent. 4
This study is subject to limitations. Firstly, a post hoc power analysis demonstrated low statistical power; thus future studies with a larger sample size are warranted to reinvestigate the association between title or conclusion positivity and tweets an article received. Also, we were not able to account for the extent that self-promotion (ie: an author or journal tweeting their own study) had on the number of tweets a study received. Moreover, the studies included were limited to those which were published, which does not allow for the control of publication bias as a confounding variable. Also, the sentiment of the tweets was not assessed although it has been demonstrated that 94.8% of tweets linking to scientific studies were neutral. 37 Further, the inherent subjectivity of classifying the positivity of the titles and conclusions was minimized through the use of a previously developed framework, and independently conducting all extractions in duplicate with consensus upon disagreement. In addition, studies published between March 2006 (date when Twitter was founded) and November 2011 could not be accounted for since Altmetric did not collect data for this period of time. Similarly, the data collected ends in May of 2015, making the data set more remote with regards to time. However, due to the time that would be required for data extraction, a convenience sampling strategy was required. Lastly, imputation was performed for missing data which could potentially impact the robustness of the model fit to the data.
In conclusion, positive titles and conclusions are not associated with increased tweets for DTA studies, suggesting that tweet bias is not present among imaging diagnostic accuracy studies. Social media such as Twitter is becoming more prevalent in the research workflow for scholarly communication and the presence of tweet bias can lead to the overrepresentation of a particular diagnostic test. This unjustified increased confidence can lead a clinician to choose an incorrect diagnostic test, leading to adverse patient outcomes. Our findings suggest that social media users can rest assured that the dissemination of DTA studies on Twitter is likely not biased towards positive studies.
Footnotes
Authors’ Note
Registered on the Open Science Framework.
Acknowledgments
The authors would like to thank Dr. Stefanie Haustein for her feedback throughout the manuscript preparation process. This study received funding from the uOttawa Department of Radiology Research Stipend Program and uOttawa Summer Studentship Program.
Declaration of Conflicting Interests
The author(s) declared no potential conflicts of interest with respect to the research, authorship, and/or publication of this article.
Funding
The author(s) disclosed receipt of the following financial support for the research, authorship, and/or publication of this article: This study has received funding from the University of Ottawa Department of Radiology Research Stipend Program and the University of Ottawa Summer Studentship Program. Neither of the funders had any role in the conduct of this study.