
Abstract
This study contributes to applied and theoretical research for schools and districts by exploring data-based evidence of the relationships between the Covid-19 pandemic and student engagement with school. The paper features trend data on student orientation to school assessed via the multi-dimensional Student Orientation to School Questionnaire (SOS-Q). The SOS-Q was initially developed to better understand the reasons for school dropout and has expanded to explicate a wider range of student-school engagement dynamics. This study demonstrates how student orientation to school may be effected by major extraneous factors and demonstrates the value of integrating valuable non-cognitive or affective measures within comprehensive student information and assessment systems augmenting both individual and cohort psychological supports.
Keywords
Perspectives and Conceptual Underpinnings
Educators benefit from informed understanding of factors that help identify at risk students early and can assist in developing effective interventions and motivate students to have a positive school experience. Attitudes linked to motivation can affect achievement very early in a student’s experience of schooling (Hatt, 2012) and can continuously evolve throughout a student’s experience of school (Akey, 2006; Brewet al., 2004; Cleveland, 2011; Greene, 2008; Stiggins, 2001).
Evidence suggests that school contexts make a difference for how students experience school, (Hanson et al., 2022; National Research Council and Institute of Medicine [NRCIM], 2004). Schools can effectively counteract adverse factors in students’ lives by creating stable, safe, supportive and engaging educational, and social environments (Christenson et al., 2012). Experiencing positive relationships with adults and peers and having access to diversified supports is especially important for students who experience adverse conditions, (Croninger & Lee, 2001) as is evident with the impact the Covid-19 pandemic and other viral risks has had on school operations in 2020 to the present. Volante and Klinger (2023) observe that recent wide ranging assessment literature suggests that learning and the academic resilience of students globally have been particularly at risk during the pandemic.
We present empirical evidence that indicates the Covid-19 pandemic has likely affected detectable motivators that encompass students’ orientation to school, namely, affective experiences, especially sense of self-confidence and resilience. Therefore, decision-making directed at improving students’ outcomes would benefit from identifying motivational factors into systematically collected evidence as Foothills School Division has done consistently for the past 7 years.
This paper features recent findings of ongoing research on student orientation to school assessed via the multi-dimensional Student Orientation to School Questionnaire (SOS-Q), (Nadirova et al., 2007). The SOS-Q provides comprehensive, yet succinct user-friendly and time efficient assessment of core facilitators of student engagement, and hence generates solid, consistent grounds to evaluate student orientation to school to supplement anecdotal observations and/or solely cognitive measures. The SOS-Q is aimed at identifying at risk students in upper-elementary and junior/senior (secondary) high school grades and assisting with interventions based on distinct, individual student, and/or cohort profiles.
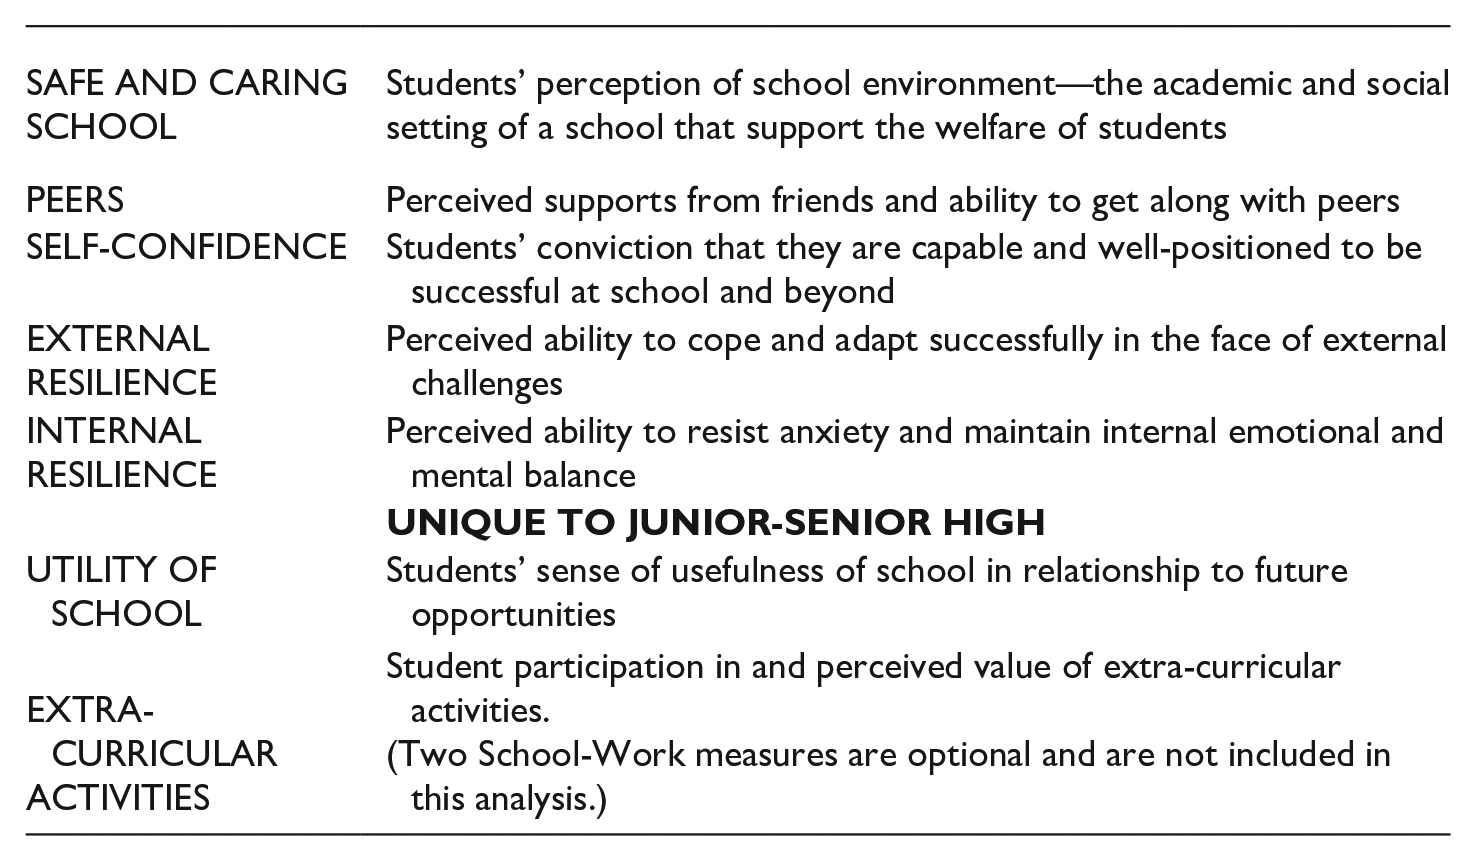
SOS Q: Sub-Scales
The underlying SOS-Q premise is that students are engaged in school when they feel that they belong there, can succeed and find it meaningful (NRCIM, 2004). The SOS-Q constructs (sub-scales) include:
Objectives and Limitations
The purpose of the current paper is a detailed examination of trend SOS-Q data from 2019 to 2023 to assess how the Covid-19 pandemic may have affected students’ disposition toward school. The internal measurement properties of the SOS-Q (factor structure and reliability) were refined, tested, and reported in previous studies (Burger, Nadirova & Keefer, 2012).
The objectives of the study are to:
(1) Illustrate cohort level SOS-Q data over time to provide an indication of how the Covid-19 pandemic may have influenced students’ attitudes to schooling.
(2) Discuss future directions in research and practical applications associated with individualized student affective assessment tools, such as the SOS-Q, to better support students wellness and reconnecting more positively with school.
Although the impact of the Covid-19 pandemic on student attitudes toward school from such dramatic effects as school closures, mandatory on-line learning, mask mandates, and anxieties around contracting the virus are self-evident, the study design does not permit the demonstration of causal relationships between Covid-19 and student attitudes. As well, other factors operating in the students’ environments could impact schooling attitudes in addition to the direct and indirect effects of the pandemic.
Data and Instrumentation
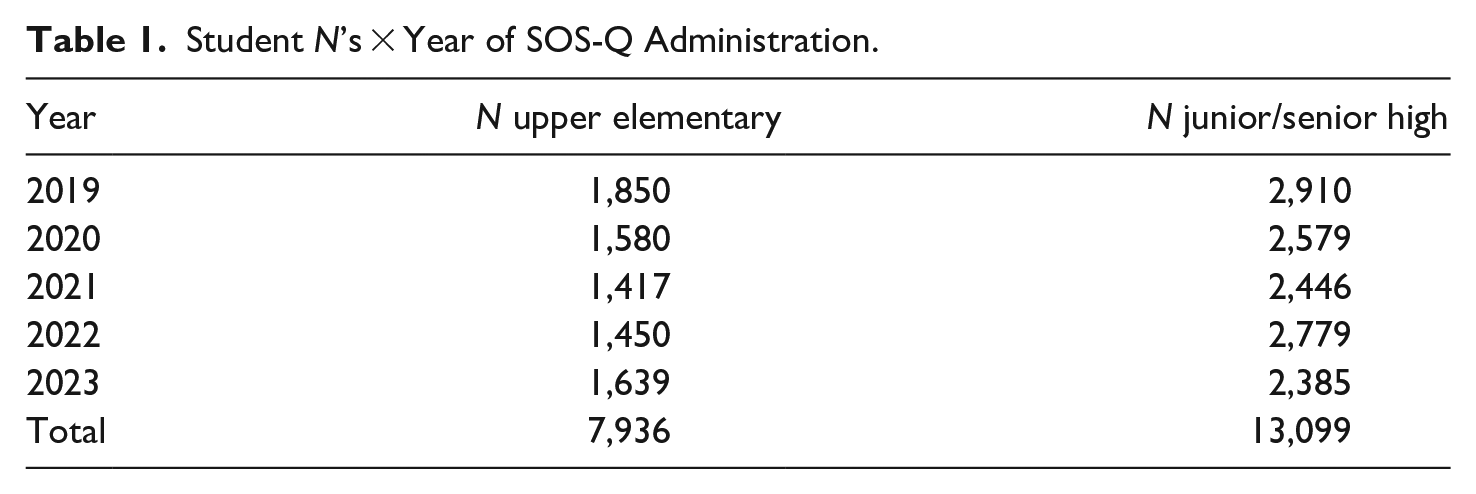
Data for this paper (student n’s) is detailed in Table 1 and consists of thousands of upper elementary and junior and senior high Foothills School Division students who completed the SOS-Q annually in 2019 through 2023. The 2019 data was collected primarily in the fall and is considered pre-Covid. The data from 2020 to 2023 also were collected in the fall of these years and are considered to have been influenced by post-covid experience as well as the more recent impact of Respiratory Syncytial Virus (RSV) and influenza on schools.
Student N’s × Year of SOS-Q Administration.
The 42 items of the upper elementary and the 55 items of the secondary SOS-Q version were rated on a 5-point Likert-type scale, with response options ranging from “strongly agree” to “strongly disagree.” Raw score data were standardized and converted to Z-scores based on national SOS-Q normed data.
Method
The current study uses categorical SOS-Q measures based on pre-Covid-19 and post-Covid-19 time frames. Composite SOS-Q sub-scales were computed based on the five to seven SOS-Q constructs.
The relationships between student orientation to school and years administered are presented as descriptive data and also were tested using SPSS v.26. First, SOS-Q cohort results were graphed for each year showing how SOS-Q construct Z-scores have varied from 2019 to 2023. Next, upper elementary, junior high, and senior high student cohorts in 2019 were compared to corresponding cohorts in 2022 to provide for comparisons of independent samples in pre-Covid-19 (2019) and post-Covid-19 (2022) cohorts. Graphs of the mean upper elementary and secondary SOS-Q Z-scores are also presented across time and each SOS-Q construct.
The variations in the number of students across years of SOS-Q administration are due to the differences in the number of students electing to complete the SOS-Q each year and student grade progression, however, the students incorporated in this study were consistently enrolled in Foothills School Division for the years included.
Results
SOS-Q ranged data is first presented as a series of bar graphs for each sub-scale Z-scores normed on national norms that details how results have varied from 2019 to 2023. The Z-scores are color coded on the graphs as follows: red = less than −2, orange = −2 to −1, yellow −1 to 0, green 0 to +1, and blue +1 to greater than or equal to +2. Upper elementary data is presented first followed by the secondary school data (Figures 1–12).
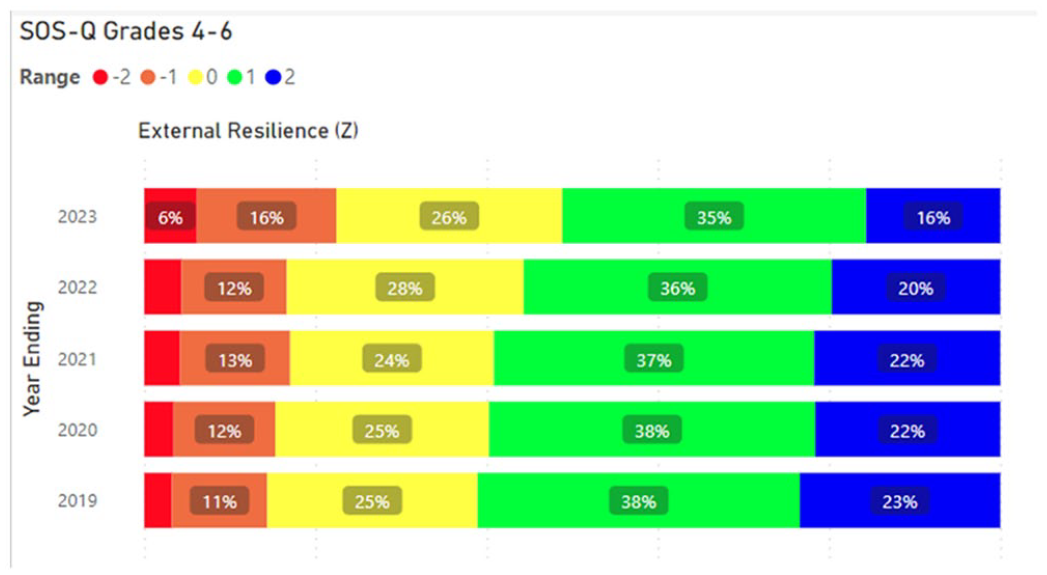
Ranges of standardized Z-scores on Upper Elementary External Resilience.
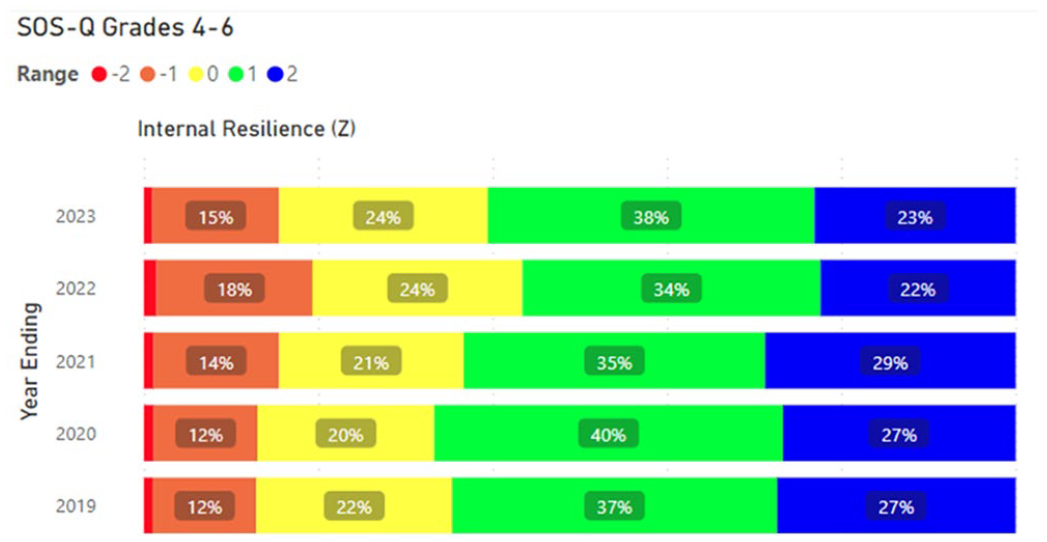
Ranges of standardized Z-scores on Upper Elementary Internal Resilience.
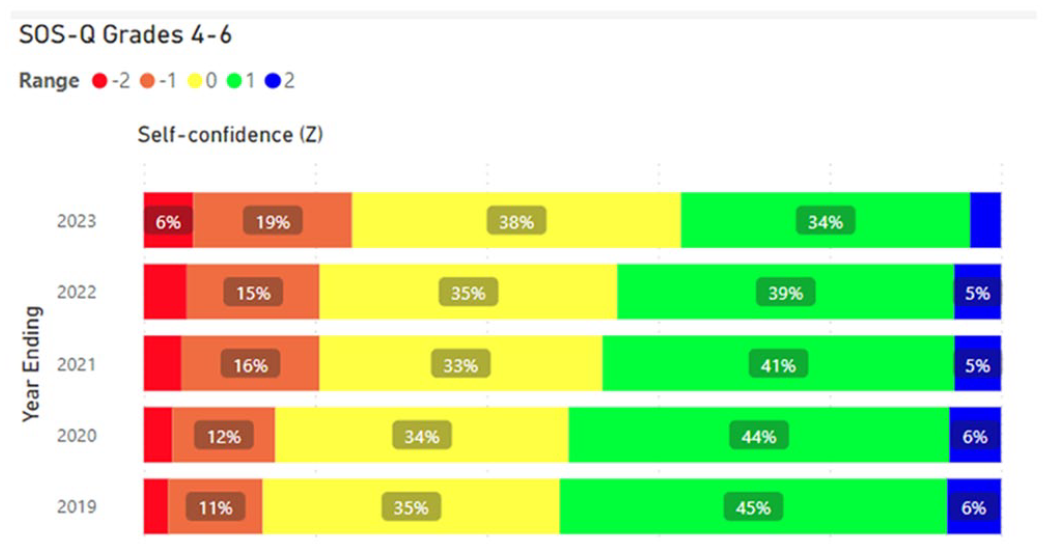
Ranges of standardized Z-scores on Upper Elementary Self-confidence.
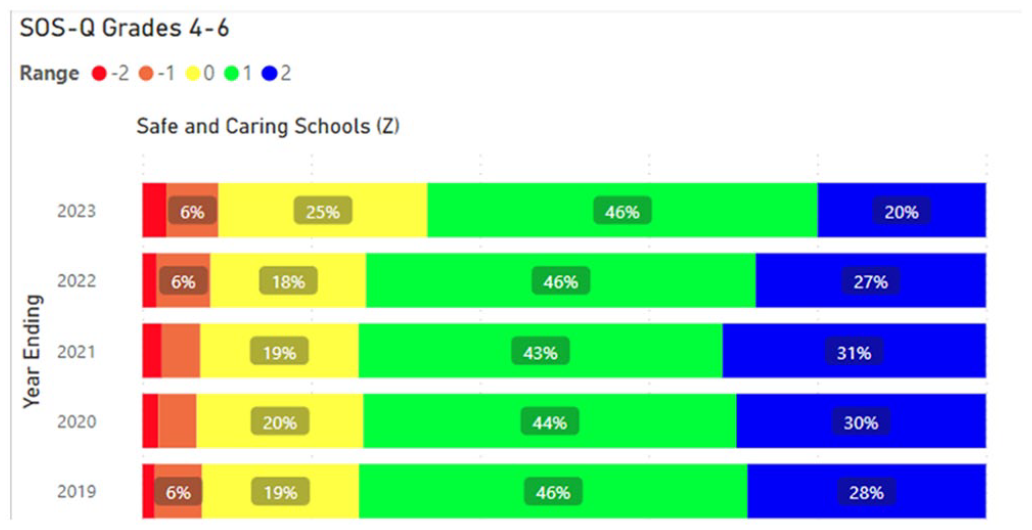
Ranges of standardized Z-scores on Upper Elementary Safe and Caring Schools.
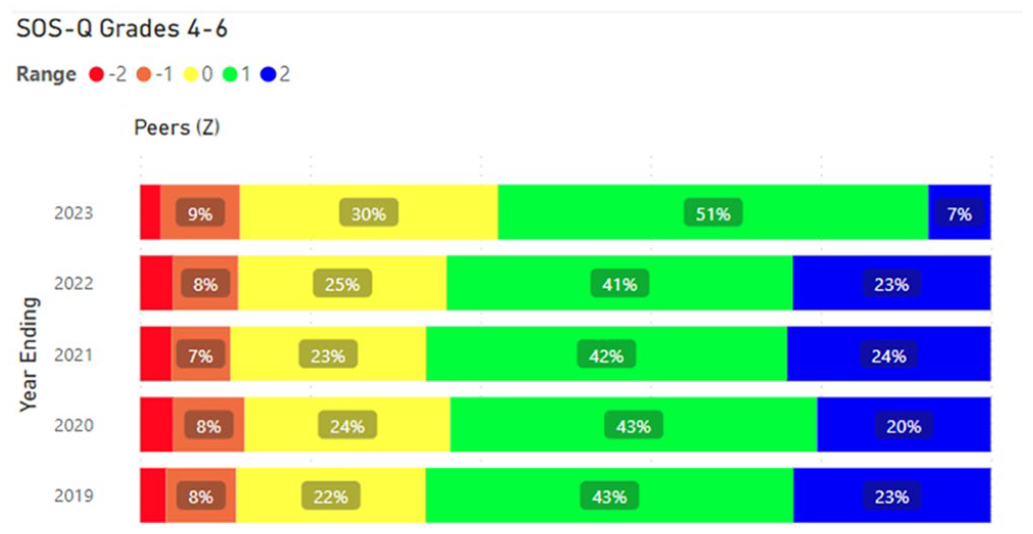
Ranges of standardized Z-scores on Upper Elementary Peers.
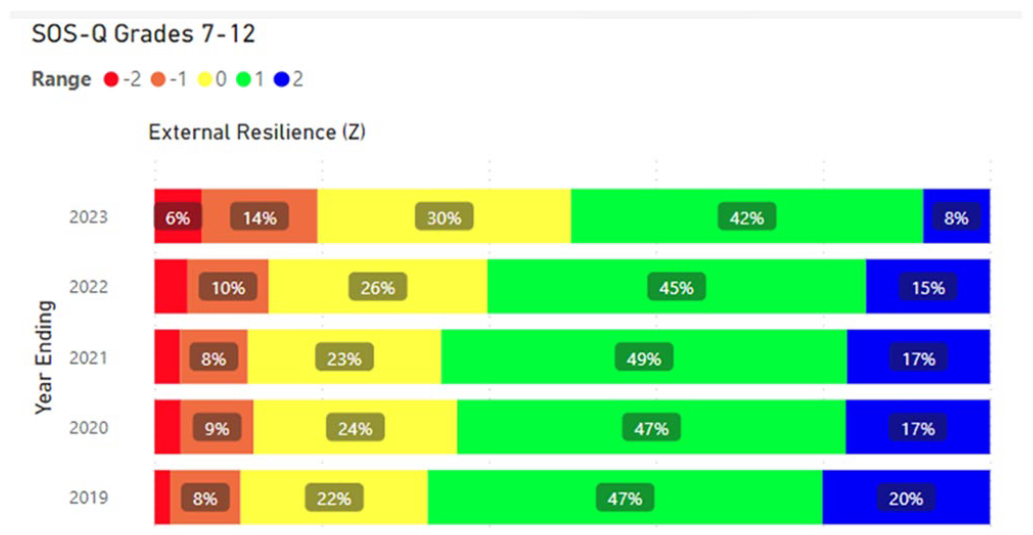
Ranges of standardized Z-scores on secondary External Resilience.
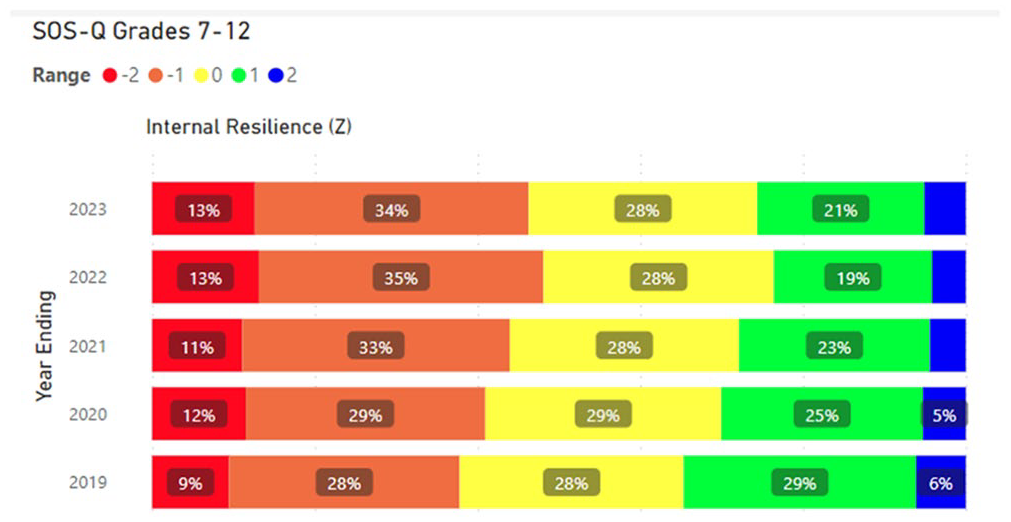
Ranges of standardized Z-scores on secondary Internal Resilience.
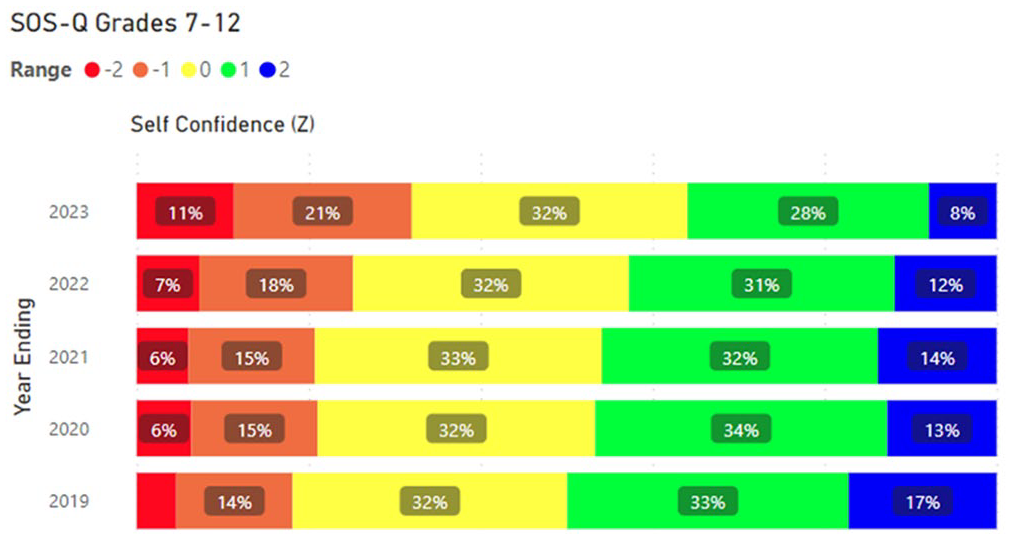
Ranges of standardized Z-scores on secondary Self Confidence.
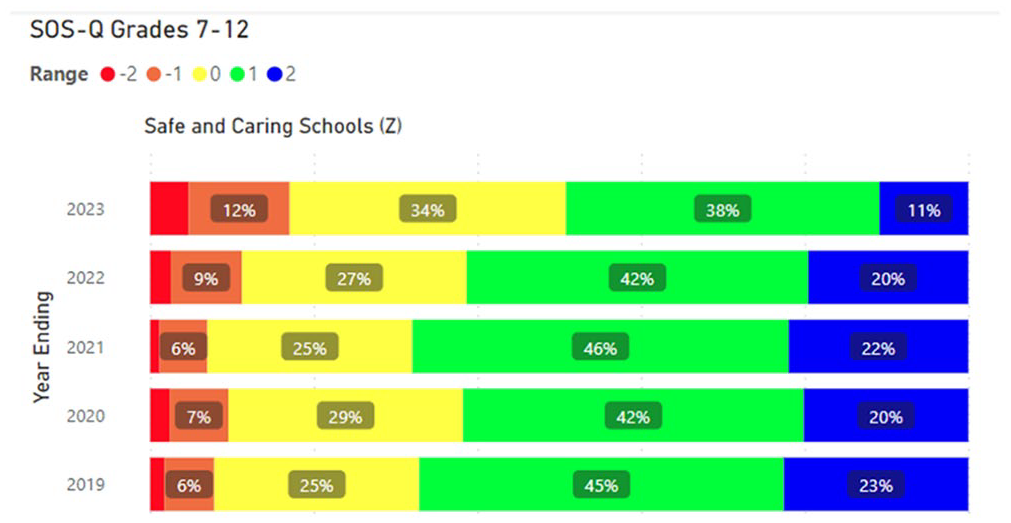
Ranges of standardized Z-scores on secondary Safe and Caring Schools.
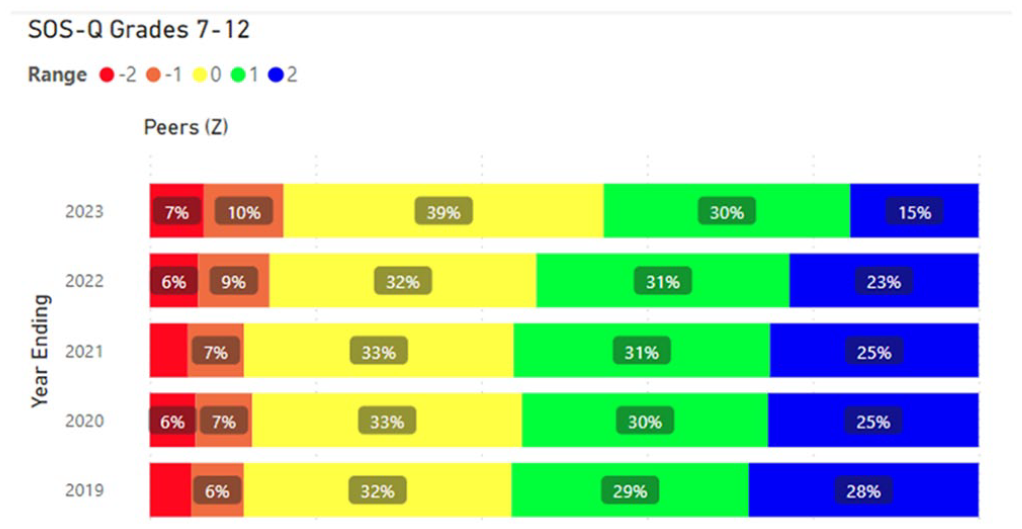
Ranges of standardized Z-scores on secondary Peers.
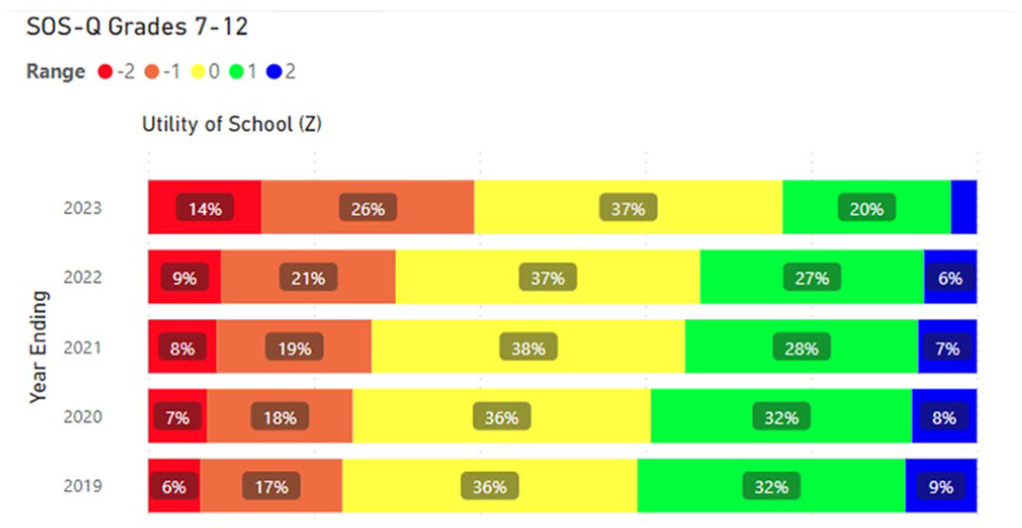
Ranges of standardized Z-scores on secondary Utility of School.
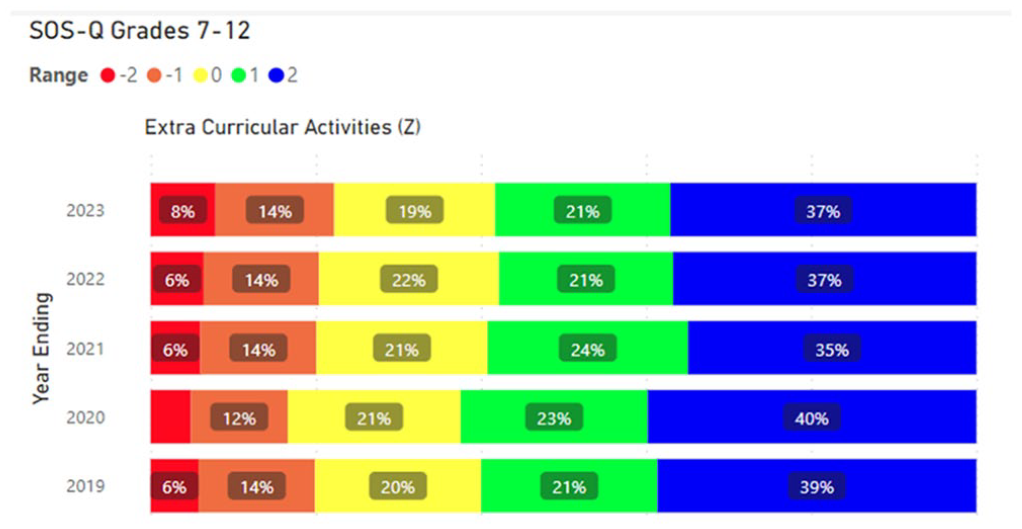
Ranges of standardized Z-scores on secondary Extra Curricular Activities.
Upper Elementary Analysis
We assessed the statistical relationships between time of Covid-19 experience and annual SOS-Q data based on ANOVA results with particular attention on the strength of the relationships across the constructs measured by the SOS-Q as referenced by the F ratios. To control for unequal variances between the annual SOS-Q mean data we assessed SOS-Q results for two independent samples for the upper elementary pre-Covid cohort in 2019 compared to the post-Covid 2022 upper elementary cohort as presented in Table 2. Levene’s test results indicated equal variances for External Resilience, Safe and Caring, and Peers constructs providing some confidence in these findings, but not for Internal Resilience and Self-confidence suggesting caution in these results.
ANOVA – Upper Elementary 2019 and 2022 Independent Cohorts.
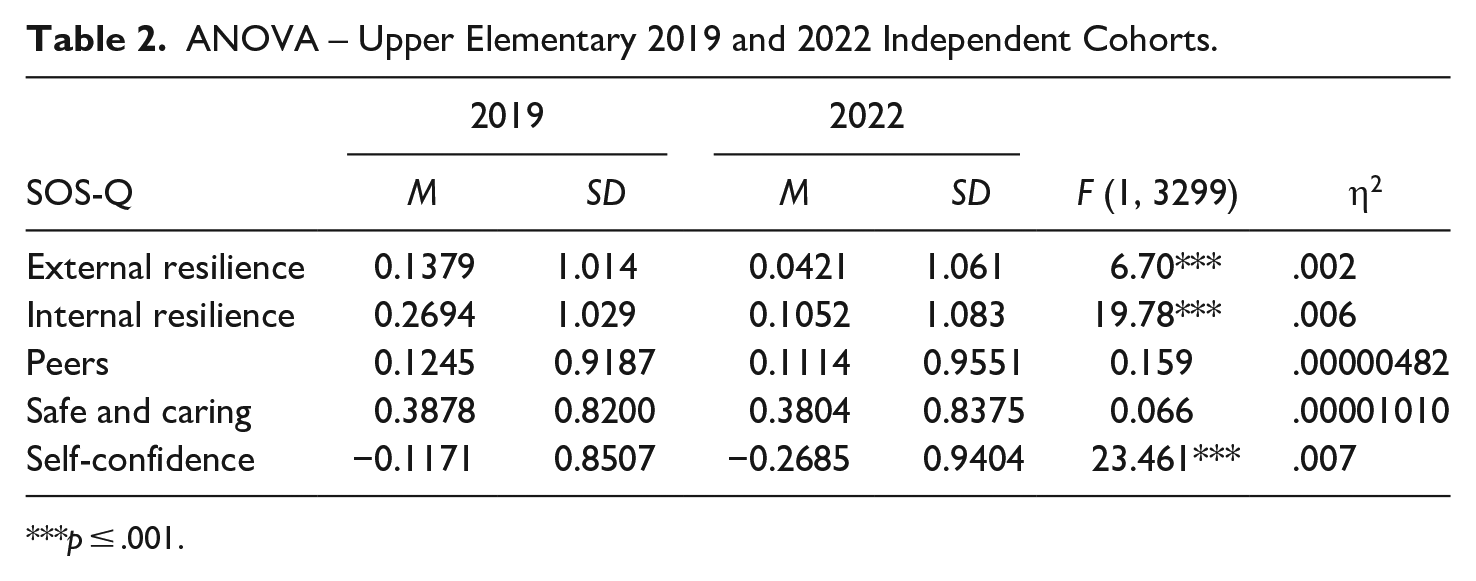
p ≤ .001.
ANOVA is based on analysis of the annual SOS-Q construct means therefore, graphs of the SOS-Q construct means are presented to visually depict these relationships over time. Upper elementary graphs are presented in Figures 13 to 17.
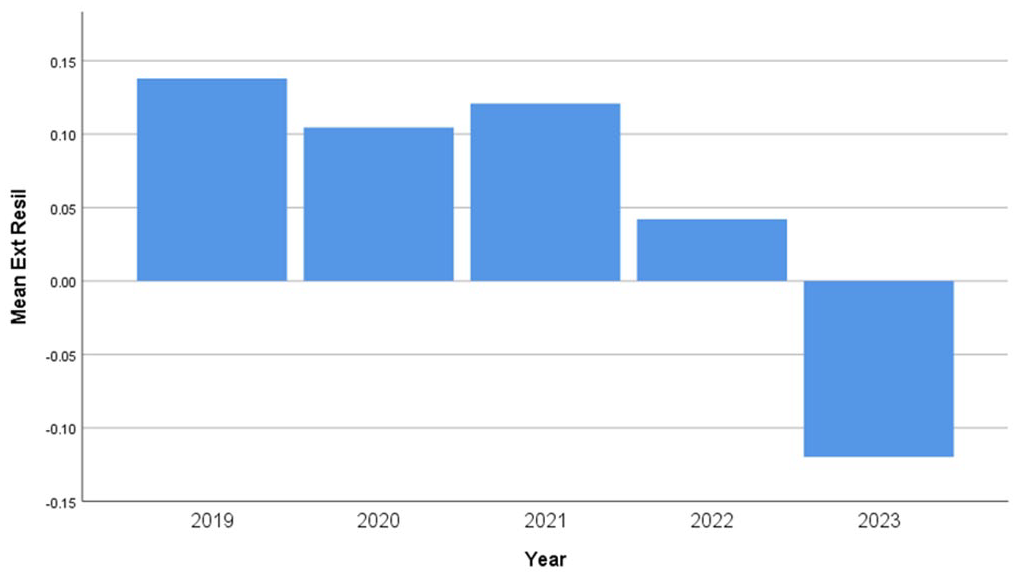
Upper elementary SOS-Q external resilience mean Z-scores.
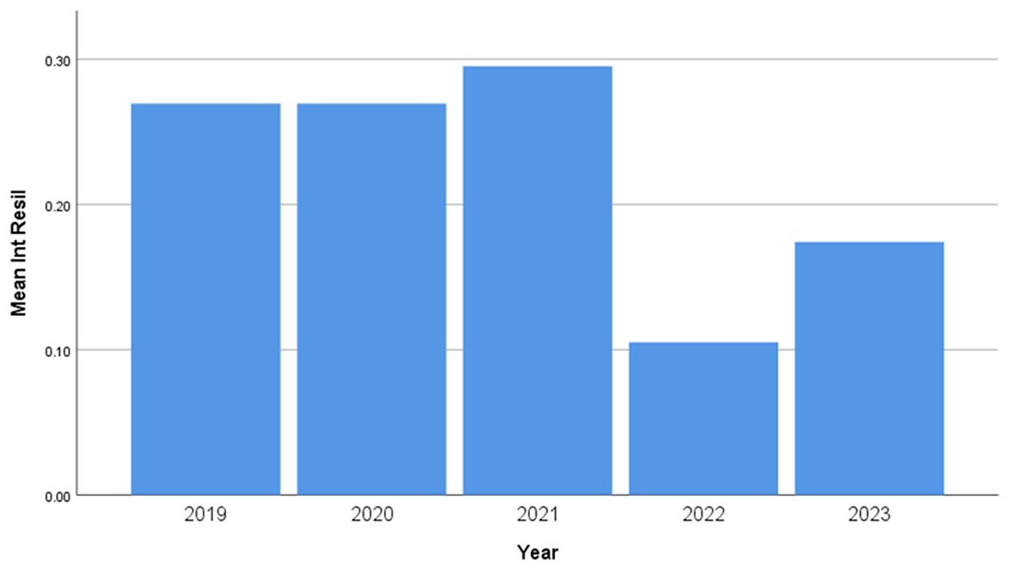
Upper elementary SOS-Q internal resilience mean Z-scores.
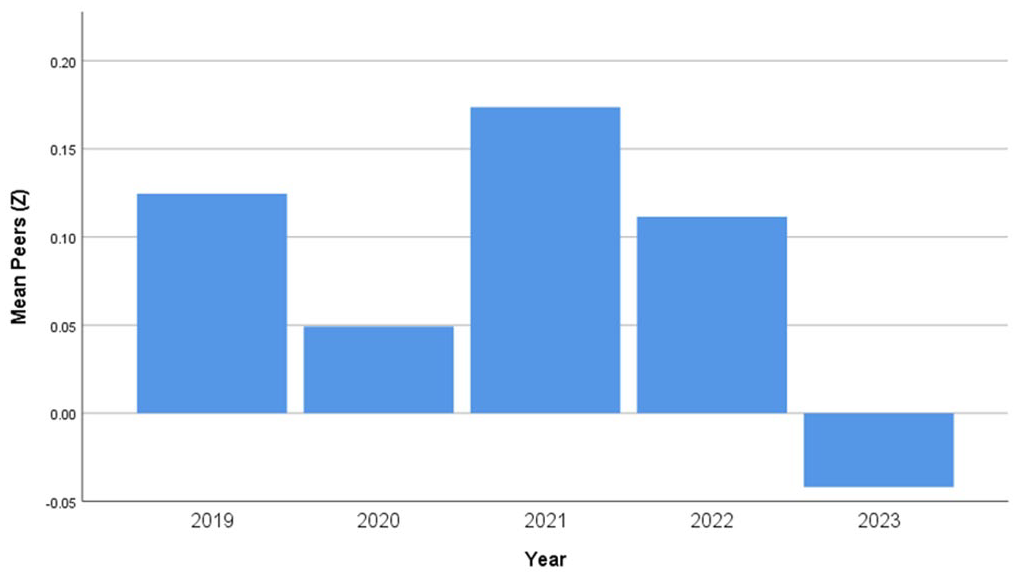
Upper elementary SOS-Q peers mean Z-scores.
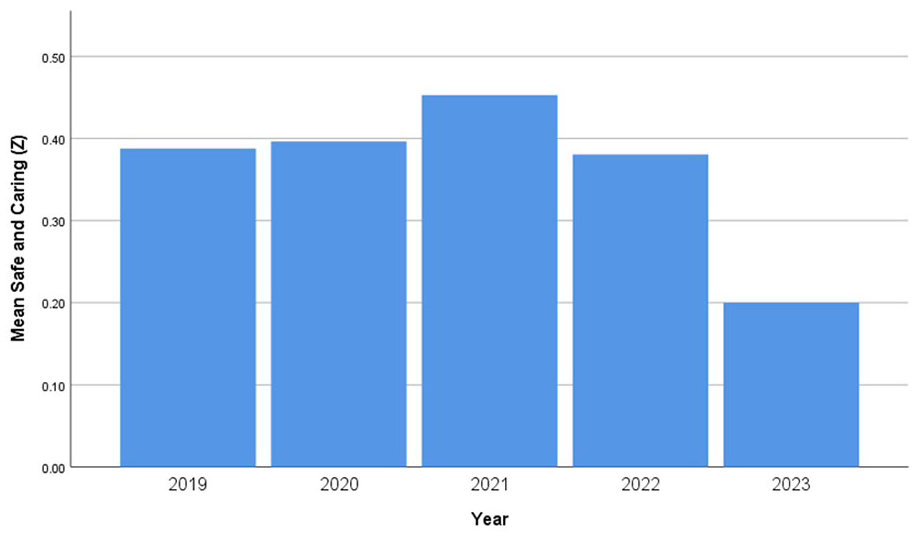
Upper elementary SOS-Q safe and caring mean Z-scores.
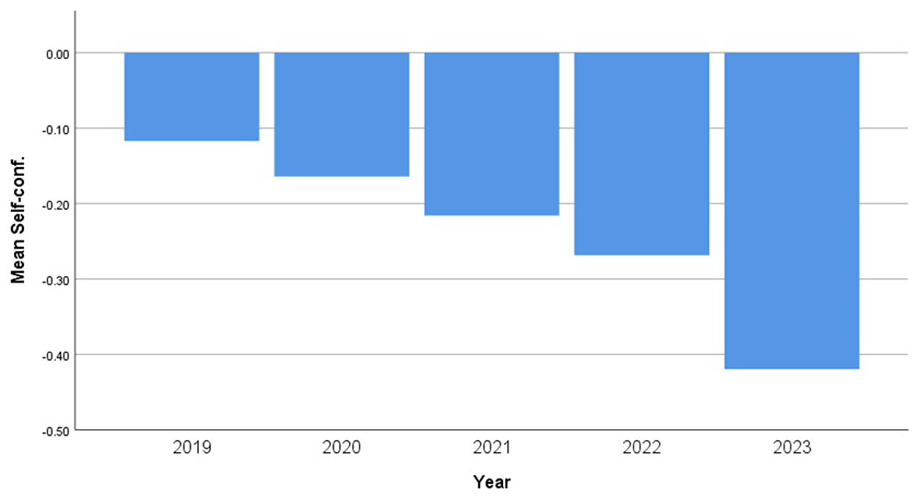
Upper elementary SOS-Q self-confidence mean Z-scores.
Junior and Senior High Analysis
The statistical relationships between junior high and senior high independent cohorts (2019 compared to 2022) are detailed in Tables 3 and 4. In the junior high analysis Levene’s test indicated unequal variances were evident for only one construct, Utility of School, thus providing more confidence in the observed F ratios for all of the other junior high SOS-Q constructs that were all statistically significant at the p less than .001 level.
ANOVA—Junior High 2019 and 2022 Independent Cohorts.
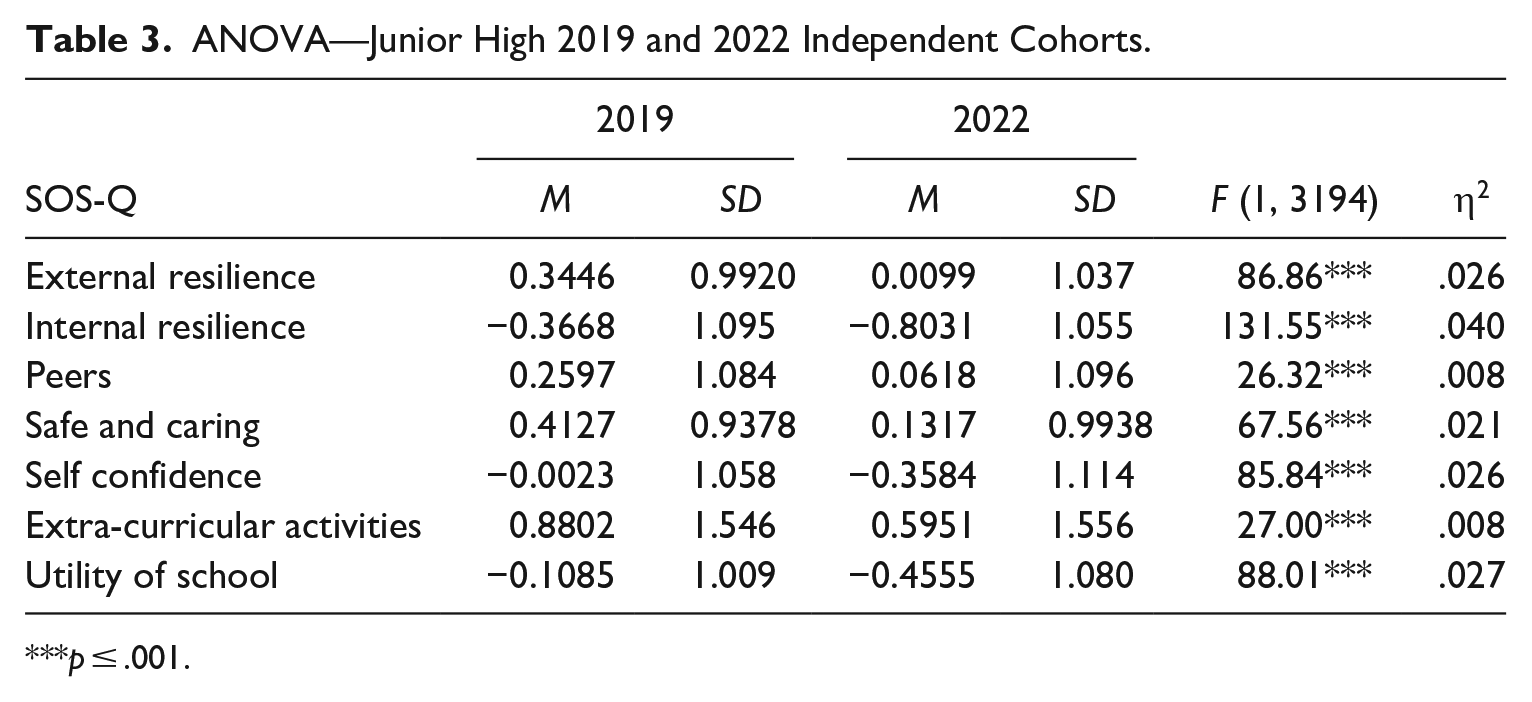
p ≤ .001.
ANOVA—Senior High 2019 and 2022 Independent Cohorts.
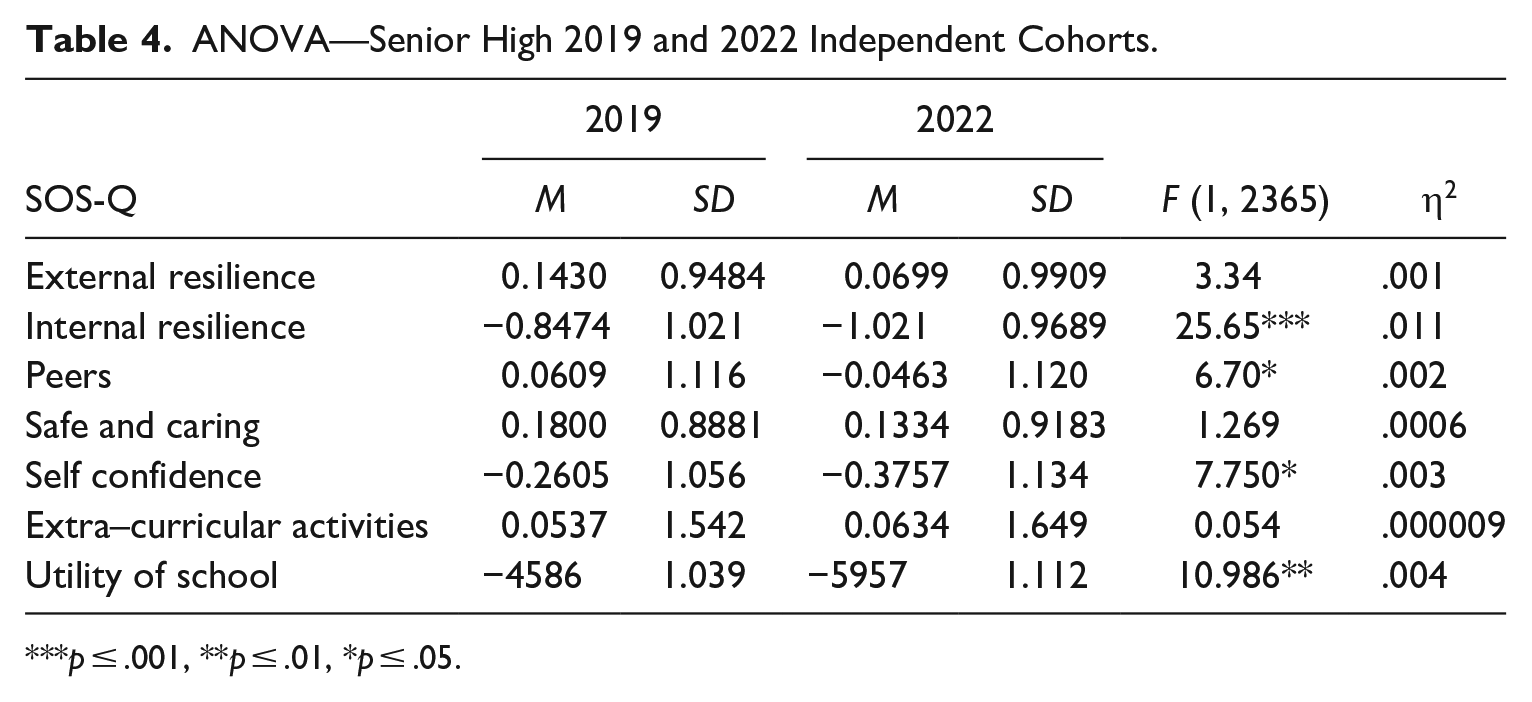
p ≤ .001, **p ≤ .01, *p ≤ .05.
In the senior high analysis Levene’s test indicated unequal variances were evident for four constructs, Internal Resilience, Self-Confidence, Peers, and Utility of School, thus indicating some caution in the observed F ratios for these SOS-Q constructs. However, similar to the upper elementary and junior high data senior high students manifested the strongest declines on the Internal Resilience construct with a notable effect size. Other, less strong but significant F rations were observed for the Self-Confidence, Utility of School, and Peers constructs but with minimal effect sizes.
Graphs of the secondary student SOS-Q Z-score construct means across each year (2019 to 2023 inclusive) are presented in Figures 18 to 24 to visually display these descriptive statistical relationships over time.
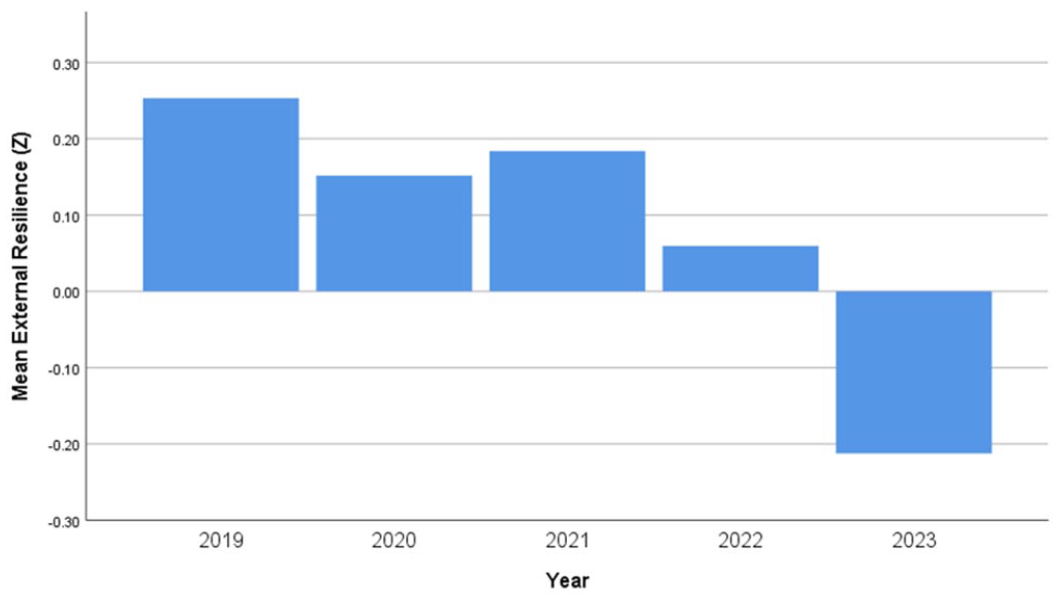
Secondary SOS-Q external resilience mean Z-scores.
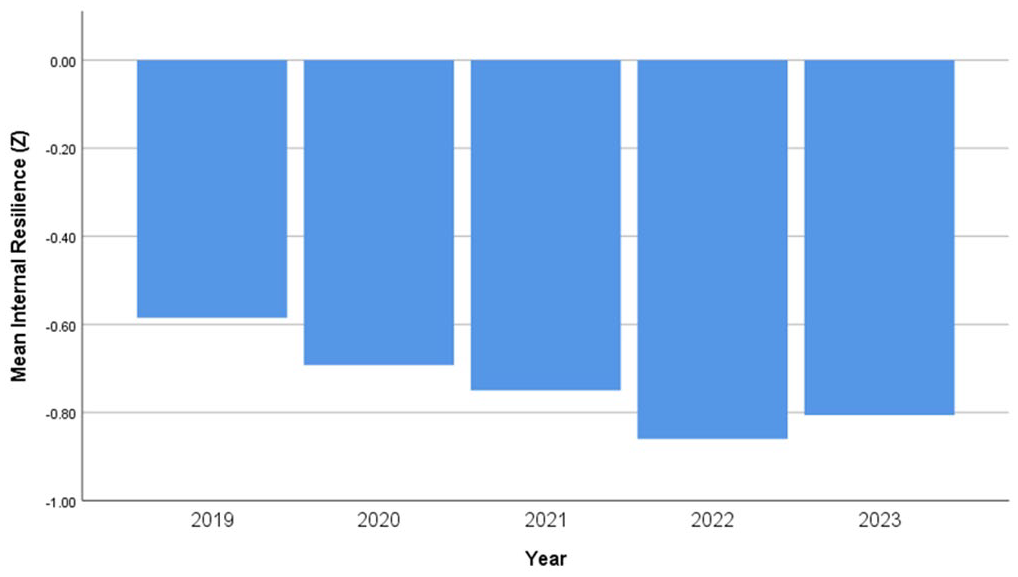
Secondary SOS-Q internal resilience mean Z-scores.
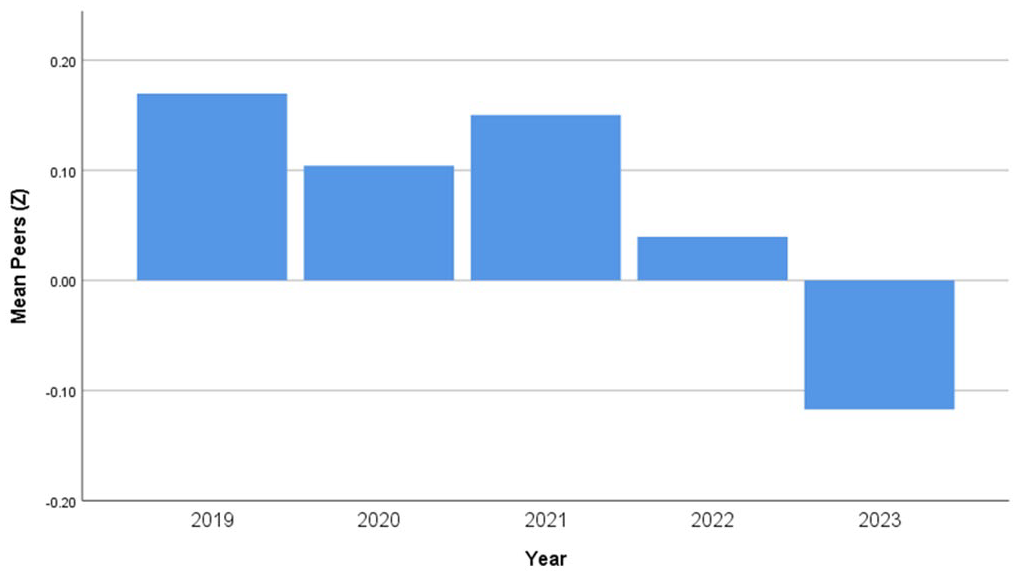
Secondary SOS-Q peers mean Z-scores.
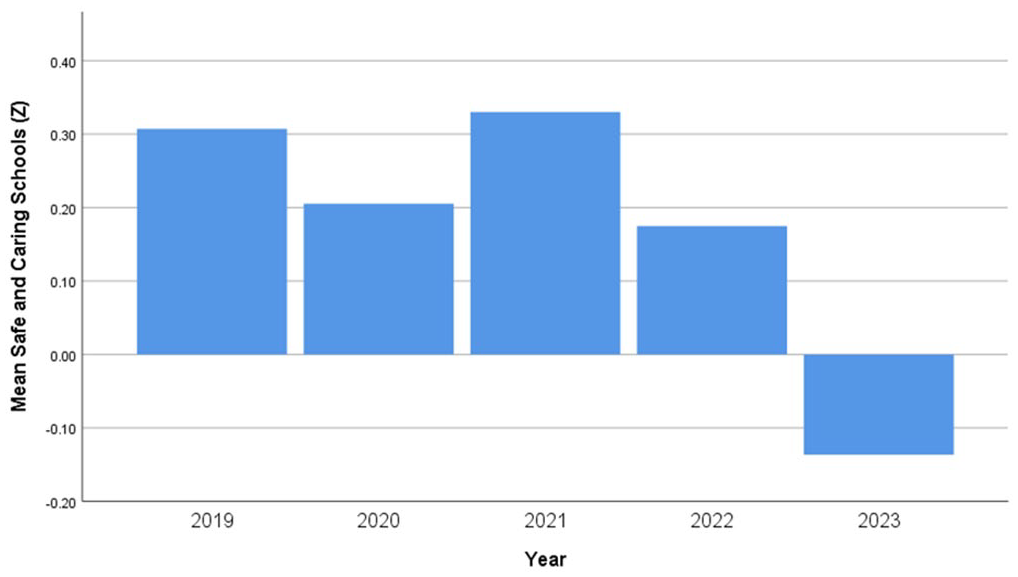
Secondary SOS-Q safe and caring mean Z-scores.
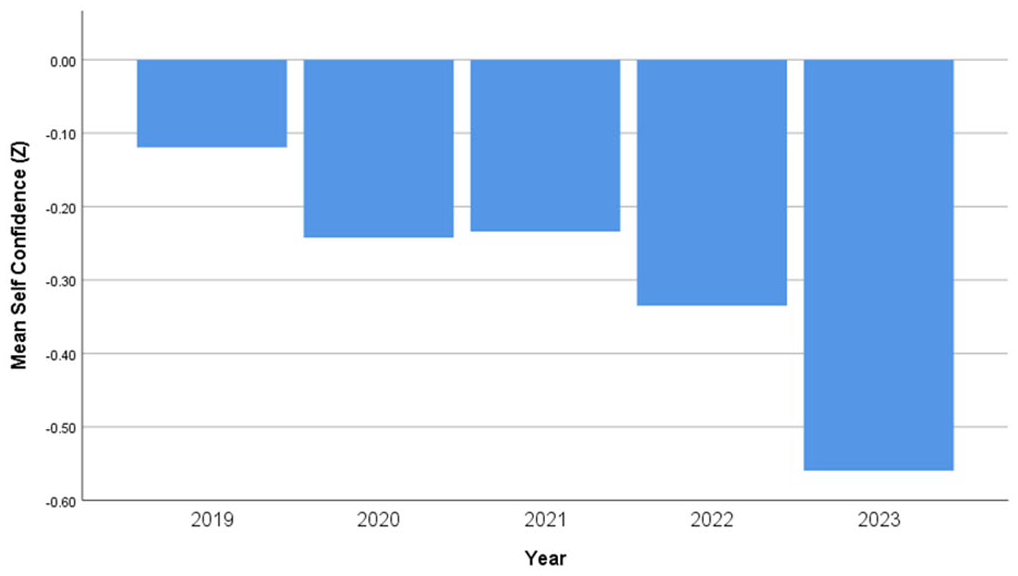
Secondary SOS-Q self-confidence mean Z-scores.
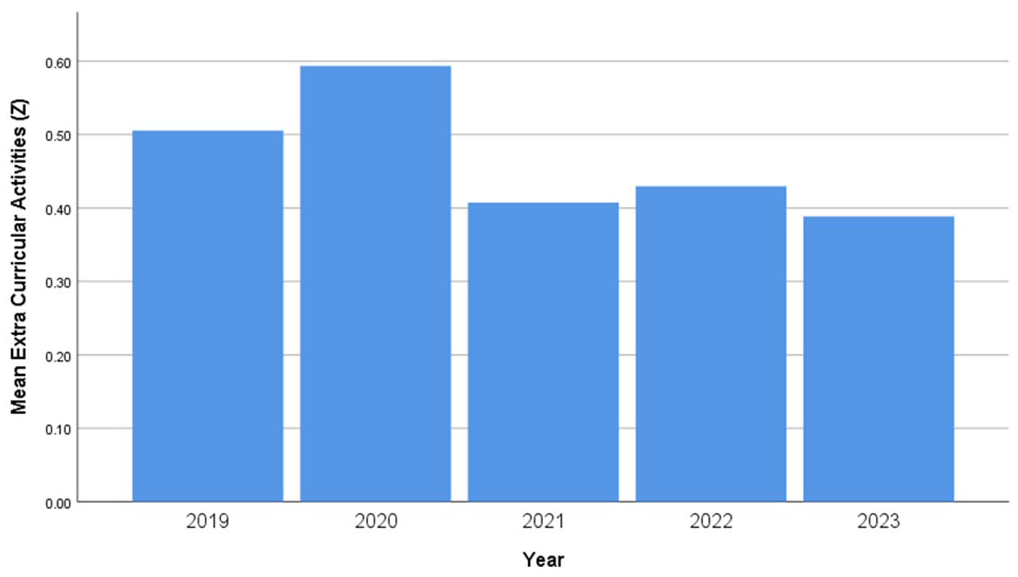
Secondary SOS-Q extra-curricular mean Z-scores.
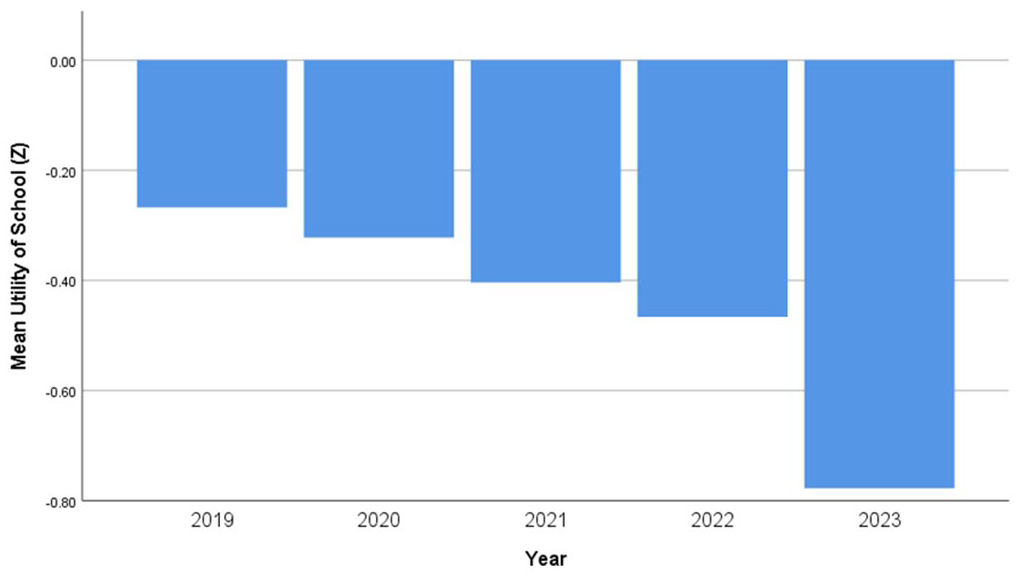
Secondary SOS-Q utility of school mean Z-scores.
Discussion and Conclusions
Observation of both the descriptive annual Z-score ranged distributions and mean Z-score graphs of SOS-Q data present concerning dynamics regarding the cumulative impact of the Covid-19 pandemic on students’ attitudes linked to multiple aspects of schooling interrelationships. The upper elementary graphs demonstrate that students’ Internal and External Resilience has declined relatively consistently from the base, pre-covid 2019 year. Likewise upper elementary students’ Self-Confidence as learners has also declined precipitously over time. The decline in Self-Confidence is particularly concerning given that past research on the relationship with student achievement has consistently demonstrated statistically significant impacts, that is, as Self-Confidence declines so does achievement (Nadirova & Burger, 2015). The upper elementary Peers and Safe and Caring School constructs have been more stable over time with social media potentially filling gaps in Peer Relationships emanating from school closures over the 2020 to 2022 time frame. The decline in several upper elementary level SOS-Q constructs in 2023 may reflect a continuing cumulative impact of the Covid-19 pandemic plus RSV and influenza concerns for students overall since the Covid-19 pandemic started to impact education. Highly significant differences in the Internal and External Resilience and for Self-Confidence in the independent samples analysis is a logical outcome when upper elementary students are faced with a historically major pandemic clearly beyond their control.
Junior high students demonstrated similar patterns (Table 3) as their upper elementary counterparts for the Internal and External Resilience constructs as well as the Self-Confidence construct with equally alarming implications for student well-being and academic success. However, junior high students also demonstrate concerning dynamics for each of the other SOS-Q constructs including, Safe and Caring School, Utility of School, and to a lesser extent with lower effect sizes for Extra-Curricular Activities and Peer Relationships.
Compared to the junior high student results senior high students displayed a pattern of concern, especially regarding the decline in Internal Resilience or anxiety, but overall may have a better capacity to cope with the impact of the Covid-19 pandemic.
However, given the statistically significant effect of the Covid-19 pandemic on all seven SOS-Q constructs for junior high students and several of the constructs for senior high students we raise a concern about the potential impact on leaving school early for an increasing number of students since previous research (Alberta Learning, 2001) has clearly defined dropping out of school as a process over time.
Responding to SOS-Q Results
As noted above, Foothills School Division has been using the SOS-Q as a strategic tool to identify students who may need extra wellness support to re-engage with school. In this section we discuss some of the ways staff have used SOS-Q data to help students in a post- Covid-19 pandemic era.
Foothills School Division leverages the SOS-Q data in four main ways: Identifying Divisional and Community Trends, Narrowing the Focus of Interventions, Examining Effectiveness of Interventions, and Building Equitable Resource Allocation.
Identifying Divisional and Community Trends
Divisional SOS-Q data is analyzed based upon schools, grades, gender, classes, and communities. This data flexibility allows school and divisional leaders to identify trends within specific student cohorts. With these multiple levels of analysis, it is possible to clearly see areas of need that must be addressed as well as areas of success in specific schools, communities, or student cohorts that could be studied and celebrated. These areas of success are then examined in detail to see what supports and strategies are in place that could possibly be replicated to support other schools, communities, and student cohorts.
Narrowing the Focus of Intervention
Supporting student well-being during and after a global pandemic is a challenging endeavor. School and divisional leaders are able to analyze the SOS-Q data to identify specific target areas for intervention. Knowing that students are struggling with Self-Confidence or Internal Resilience is only a preliminary step. Schools provide universal supports for students in these areas, but it is as important that schools are able to easily identify specific students or cohorts of students that need more targeted or individualized supports. Knowing that 25% of your students are struggling with Self-Confidence is not enough information to implement effective interventions. Foothills School Division is able to analyze the SOS-Q data at a deeper level and identify specific cohorts of students for targeted interventions and individual students that may need a range of more intensive individualized interventions.
Examining Effectiveness of Interventions
Foothills School Division has developed a robust continuum of supports and services to support students. This continuum continues to evolve as student needs change, and we learn more about our student population with further data analysis. A significant amount of time and resources are spent attempting to support students that are struggling throughout the division. With this level of human resource and fiscal investment into interventions it is critical that the division can understand what is or is not working. The division and school leaders analyze data based upon intervention cohorts. From this we can track the effectiveness of specific interventions and adjust interventions for students or cohorts where the current interventions are not having the anticipated impact. This ability to leverage SOS-Q data for progress monitoring helps Foothills School Division ensure that resources utilized for intervention are having the anticipated impact for students.
Equitable Resource Allocation
Like most school divisions, Foothills School Division primarily allocates resources based upon student population. In simple terms, the more students in a school the more resources the school will receive. This method may provide an easy way to divide up resources like Family School Liaison Counselors and Educational Psychologists, but it does not take into consideration what the students in the school may be needing for support. Foothills School Division has begun to include SOS-Q data as it plans for Inclusive Learning Allocations for each school as well as to advocate for additional funds, grants, and community supports for schools and students. School-based SOS-Q data is now considered a key element in the development of a school’s Inclusive Learning Needs Profile. The SOS-Q data is considered along with other data points like student population, level of suicidal risk assessments, non-suicidal self-injury reports, and threat assessments to ensure that limited inclusive learning resources are being allocated in the most equitable and effective ways possible.
Relevance to the Practice of School Psychology
Media attention on the impact of the Covid-19 pandemic on students’ physical and mental health has been extensively covered practically from the first restrictions caused by the pandemic. Impacts on schools and the education system have been primarily anecdotal with limited empirical, data-based evidence of how the Covid-19 pandemic has affected student’s thinking and feelings about schooling. This paper has illustrated how schools and school jurisdictions can be more attuned to how their students have been affected by the pandemic and what responses educators might consider to support a student’s psychological stresses more dynamically. Strategies as illustrated by Foothills School Division and resources such as the Alberta Children’s Services’ Well-Being and Resilience Framework (Alberta Children’s Services, 2019) can be useful and critical supports for students.
We don’t make the case here for more funding as a strategic response, but we do call for more applied research with student attitude assessment tools, such as the SOS-Q, as well as a greater directed focus throughout the education system on the relationship between student affect and cognitive application. These linkages are critical when they are being significantly affected by the advent of major issues such as pandemic or endemic threats to student’s sense of well-being.
Additional research on the differential impact of the Covid-19 pandemic on upper elementary and junior high versus senior high students could point to a more strategic and nuanced allocation of resources and psychological supports if such differences were replicated in multiple school settings.
If student drop-out rates increase over the next couple of years due to post Covid-19 fueled dis-engagement with schooling, students will need a range of data-informed interventions and enhanced psychological supports to re-engage at pre-Covid-19 levels for their and societies’ greater benefit. Perhaps the time has arrived for Canadian ministries of education to take leadership by requiring student affective assessment within a broader assessment and school accountability framework.
Footnotes
Author’s Note
Practical Data Solutions holds the copyright to the Student Orientation to School Questionnaire. The views expressed in this paper are those of the authors and not necessarily their employing organization.
Declaration of Conflicting Interests
The author(s) declared no potential conflicts of interest with respect to the research, authorship, and/or publication of this article.
Funding
The author(s) received no financial support for the research, authorship, and/or publication of this article.