
Abstract
A strength-based approach to childhood attention-deficit/hyperactivity disorder (ADHD) research highlights children’s positive attributes that can support their areas of difficulty. However, research on perceptions of a child’s positive attributes is understudied. Specifically, there is little research that examines strength-based perceptions of children with ADHD, and only one known article addresses parent perceptions of their children with ADHD. As such, this study analyzed parent and child-reported strengths in children with ADHD. Parent and child-reported strengths were measured using the Behavioral and Emotional Rating Scale—Second edition, Parent Form and Child Form (BERS-2). Results indicated that parents and children perceived strengths in the interpersonal, intrapersonal, and affective domains to be similar, falling in the Average range. However, children indicated their family involvement and school functioning fell within the Average range, whereas parents rated these domains below average. Positive parental perspectives of their children may promote positive parent-child interactions and serve as an overall protective factor for children with ADHD. Domains which parents and children see as strengths should be utilized to support areas of weakness. Strength-based research for children with ADHD and positive interventions utilizing strengths may benefit families with ADHD, as well as classroom teachers and school psychologists.
Keywords
Attention-Deficit/Hyperactivity Disorder
Attention-deficit/hyperactivity disorder (ADHD) is a neurodevelopmental disorder which presents challenges with inattention, hyperactivity, and/or impulsivity (American Psychiatric Association [APA], 2022). ADHD is composed of developmentally inappropriate inattentive, hyperactive, and impulsive behaviors. Functional impairments, (i.e., inability to stay on task, lack of attentional ability, or high distractibility) impact the child’s home life, academic performance, and/or social relationships (Barkley & Russell, 2014).
ADHD is commonly viewed as a disability that prevents or disrupts one from developing and achieving their full potential (Hai & Climie, 2021). Thus, a strength-based approach in research may be particularly beneficial for children with ADHD. This approach utilizes the child’s strengths to enhance performance while engaging in challenging activities may support greater success for children with ADHD, enhancing their subjective view of themselves, and increasing their potential for desirable outcomes (Climie & Mastoras, 2015). As children with ADHD are perceived more positively, children’s unique capabilities and strengths are utilized and celebrated, supporting their areas of need and encouraging success (Climie & Mastoras, 2015).
In a recent study, parents of 8- to 13-year-olds were asked to quantitatively report if they perceived their child with ADHD as being resilient (i.e., able to withstand adversity), as well as if their child’s resilience was similar to the levels of resilience demonstrated by children without ADHD (Chan et al., 2022). Resilience in this context was measured using the Resiliency subscales on the Behavioral Assessment System for Children, third edition (BASC-3). Overall, 50% of children with ADHD were perceived by their parents as being resilient, while an additional 2.8% of children with ADHD were perceived by their parents as being more resilient than non-ADHD same-aged peers. Together, this study demonstrates that children with ADHD may possess overlapping strengths with non-ADHD children, as children with ADHD were perceived as demonstrating similar resilient qualities as their non-ADHD counterparts.
Despite these findings on resiliency, there is no known research that explores the strength-based perceptions of children with ADHD. However, to demonstrate potential strengths a person with ADHD may use to describe themselves, Mahdi et al.’s (2017) study on adult perceptions of ADHD is discussed. Mahdi et al.’s (2017) found that 71% of their participants indicated there were positives of ADHD. Positives included high energy levels, the ability to hyper-focus, creativity, agreeableness, and willingness to assist others. Additional positives of ADHD were cognitive dynamism, energy, humanity, resilience, and transcendence (Sedgwick et al., 2019). Overall, the strengths used to describe oneself as a neurodivergent individual are extensive. Importantly, neurodivergent people are aware of and can identify their strengths and can appreciate their unique skills and abilities. To address this gap, the current study will examine parent- and child-reported strengths of children with ADHD using a strengths-based perspective.
Positive Psychology and Strengths-Based Research
Positive psychology is a branch of psychology that explores the beneficial aspects of human behaviors (Seligman & Csikszentmihalyi, 2000). Positive psychology addresses how positive emotions, engagement, relationships, meaning, and achievement (collectively acronymized as PERMA), affect an individual’s feeling of fulfillment in life (Park, 2015). In positive psychology, a strength-based focus on research, theory, and practice has arisen. Strength-based research and theory highlight how a person’s strengths can support their PERMA or positive experiences (Norrish & Vella-Brodrick, 2009).
Positive psychology is utilized in multiple settings, such as in schools. At school, emphasizing and educating students about positive psychological principles may be beneficial to one’s functioning. For example, teachers who taught their elementary aged students to think using positive mindsets (e.g., optimism), reported more effective social-emotional development in their students (Benoit & Gabola, 2021). Additionally, positive psychological interventions at school have documented encouraging results. A 2-year intervention led by teachers taught school-aged youth about the principles of positive psychology (e.g., gratitude; Shoshani & Steinmetz, 2014). Significant decreases in anxiety and depressive symptoms as well as increases in self-esteem, optimism, and self-efficacy were reported by students’ post-intervention (Shoshani & Steinmetz, 2014). However, the benefits of utilizing a strength-based approach extends beyond the school setting into the home environment, where parents and children utilize this positive approach. Utilizing a strengths-based perception may be especially important in cases of disability or sickness. For example, a more optimistic perception of meaning in life is associated with better reported health-related quality of life (Park, 2015). Specifically, utilizing strength-based research to understand people with neurodevelopmental disabilities (NDDs) may support not only the individual but also their families and the families’ perception of their disorder. A strengths-based approach to research within a NDD child population encourages positive well-being and achievements that are appropriate for the child’s unique circumstances (Climie et al., 2013; Verma & Sondhi, 2021). While not discounting the child’s individual areas of need, strength-based approaches encourage success through utilizing personal strengths in skills and strategies to support children in areas that they may find difficult (Climie et al., 2015).
Parent Strength-Based Research in the NDD Population
For parents who have children with NDDs, they are all too familiar with research taking on a deficits-based lens, inquiring about the child’s shortcomings. Parents often answer questions in research related to their child’s deficits which can be challenging and discouraging (Climie & Henley, 2016). To avoid the negative perception often associated with these types of questions, strength-based questions alternatively ask parents to report on the positive characteristics that support one’s achievement (Verma & Sondhi, 2021). Therefore, this shift to asking more optimistic questions can positively influence a parent’s affect and outlook as they are less likely to fixate on the negatives that can discourage positive thinking (Climie & Henley, 2016). Further, tailoring information to address the positive characteristics of their children may be beneficial to their well-being (Sabapathy et al., 2017). Parent-child interactions may also improve as a result of positive parental perceptions, serving as a protective factor for the child and the parent-child dynamic (Sabapathy et al., 2017).
Despite the paucity of research, two studies asked parents to qualitatively report on their children’s strengths, where children were diagnosed with a developmental disability (not specified) or ASD (Colavita et al., 2014; Sabapathy et al., 2017). In both studies, parents most frequently reported that their children’s loving/caring/affectionate attitude toward people and animals, their happy demeanor, and their physical fitness to be amongst their greatest strengths. Thus, parents named many positive characteristics that their children possessed regardless of the child’s diagnosis.
Child-Reported Strengths in Children With NDDs
The majority of the child-reported strengths literature has been analyzed within the Autism Spectrum Disorder (ASD) population. Clark and Adams (2020) asked children with ASD three strength-based questions: “What do you like most about yourself?”, “What are you absolutely best at?” and “What do you enjoy the most?”. Children most liked how they were a good friend/person and were good at particular things. They were absolutely best at physical activity and maths/science, and they most enjoyed technology and gaming and social interaction. Although the previous study provides valuable insight into child-reported strengths within an ASD population, there is a paucity of research within the NDD literature pertaining to ADHD. Thus, further research is warranted within the ADHD (and NDD) population. Similarly, research investigating the overlap of parent and child reports is limited when looking at strengths.
Congruence in Strength-Based Parent and Child Reports
Strength-based congruence, or the level of agreement between parent and child reports has been minimally evaluated. Cherry et al. (2020) analyzed the congruency between parent and child reported strengths at home (e.g., “I show that I care about other people in my family”). Results indicated moderate congruence between reports regarding the child’s strengths at home. In addition, Sointu et al. (2012) analyzed child-parent-teacher agreement ratings using the BERS-2, a strength-based measure. Results indicated moderate overall strength index score agreement across the three parties, thus, all parties agreed upon some of the children’s strengths. Further, parent-child-teacher ratings for children enrolled in special education were in greater agreeance across all domains except for Intrapersonal Strength. However, greater agreeance on strengths may be influenced by factors such as time spent with the child and the level of communication between parties (Sointu et al., 2012). Although these studies provide a good preliminary understanding of the level of agreeance across multiple parties on strength-based measures, more research is necessary.
Congruence in Parent and Child Reports With ADHD
Galloway and Newman’s (2017) meta-analysis found that children tended to report that their quality of life (QOL) was better than what their parents reported. In three of the four studies, parents and their children reported greater agreement on physical health than psychosocial health. These results align with previous work done by Klassen et al. (2006) where parent-child reports of children’s health were similar for observable domains (e.g., physical function and bodily pain) and moderate for less observable domains (e.g., mental health and self-esteem). Taken together, these studies demonstrate that there may be discrepancies between parent and child reporting with children with ADHD, warranting further investigation.
Discrepancies Between Parent and Child Ratings
Previous research has hypothesized potential reasoning behind parent-child report discrepancies, including child and parent biases, inaccurate reporting, and/or the domain analyzed. Self-report inaccuracies may result because of the age discrepancies of the participants and their cognitive and/or social understandings and abilities (Brener et al., 2003). Cognitively, children and parents may comprehend, recall, retrieve information, and make decisions differently. Socially, factors such as social desirability may affect ratings (i.e., the tendency for people to report based on what they believe others will find favorable; Brener et al., 2003; van de Mortel, 2008). Environmental factors such as privacy or confidentiality, stigmatization, or moral implications may affect the accuracy of reporting (Brener et al., 2003). Other factors such as one’s culture, gender, perception of the disorder, and domain analyzed may contribute to discrepancies (Davis et al., 2007; Van Roy et al., 2010).
Discrepancies in Parent and Child Reporting in Children With ADHD
One explanation for discrepancies in parent-child reporting is the Positive Illusory Bias (PIB). PIB is where children with ADHD rate themselves as more competent than they are, often resulting in higher ratings than their parents (Hoza et al., 2002). Alternatively, children with ADHD may rate their abilities as lower than non-ADHD children. Factors such as domain and context contribute to the extent children overestimate their abilities (Fefer et al., 2018).
Additional factors affecting parent-child reporting in the ADHD literature include parental stress, psychopathology, and demographics. Parental stress may affect the tolerance a parent has for behaviors and may result in behaviors being deemed as more problematic than before the stressor occurred. Therefore, higher severity in reporting may be due to increased parental stress (Theule et al., 2010). Parental psychopathology may contribute to reporting as children with ADHD are more likely to have parents with a form of psychopathology (Galloway & Newman, 2017). Further, parents with psychopathology and stress may be more likely to report greater severity in children’s behaviors and symptoms compared to parents without other diagnoses (Galloway & Newman, 2017). Lastly, as mothers tend to rate externalizing behavior more severely than fathers, discrepancies may arise depending on which parent is doing the rating (van der Veen-Mulders et al., 2017). Taken together, parent-child agreement of child-specific ratings is variable and may be attributed to a variety of factors.
Current Study
Given the preliminary findings that strength-based research may benefit children with ADHD (Climie & Mastoras, 2015), it is essential to identify how parents and their children with ADHD rate their children’s strengths. The present study aimed to explore parent- and self-reported strengths in children with ADHD. Strength domains analyzed included the child’s interpersonal strengths, school functioning, affective strengths, intrapersonal strengths, and family involvement. To gain a better understanding of parent-child reported strengths in children with ADHD, the following research questions were posed:
How do parents and their children rate the children’s strengths in each of the five BERS-2 domains of strengths: interpersonal strength, functioning in and at school, affective strength, intrapersonal strength, and family involvement?
Previous research reported children’s strengths in social (e.g., Clark & Adams, 2020) and physical domains (Mahdi et al., 2017), and as well highlighted as their positive characteristics and traits (e.g., courage; Mahdi et al., 2017). Given social domain items are included in the BERS-2, such as one’s interpersonal interactions and affective abilities, as well as how one interacts within a family and school environment, this literature alludes to parents and children reporting strengths in these areas. Additionally, as optimistic perspectives about the child’s traits align with intrapersonal abilities, it is presumed that parents and children will report strengths in these areas. Thus, parents and their children may rate their children’s strengths positively if they view their children to resemble these skills and abilities.
2. Are there significant differences between parent and child ratings of interpersonal strengths, functioning in and at school, affective strength, intrapersonal strength, and family involvement?
Previous literature indicates that agreement on strength measures, such as the BERS-2 (the measure in the current study), is generally higher than on deficit-based measures (Lambert et al., 2015). Synhorst et al. (2005) and Sointu et al. (2017) reported moderate to large correlations between parent and youth ratings in education settings. Both generally and on the BERS-2 measure, level of agreement between parents and their youth may differ by domain. Lambert et al. (2015) found that parent-child ratings were more agreeable in Family Involvement strengths than the Affective Strengths domains. However, the amount of difference in the parent-child rating was dependent on if the youth was disabled. In the case of a disability, Affective parent-child reported strengths were more similar. With non-disabled children, School Functioning parent-child reported strengths were more similar. Additionally, Sonitu et al. (2017) reported moderate agreement on the parent-child-teacher ratings of overall strengths on the BERS-2. Taken together, the level of agreement between parents and their children is variable. Therefore, the current study hypothesizes that parent-child agreement on the BERS-2 will vary as a consequence of the domain rated. With this, the reasoning behind why the differences do or do not exist between parent and child ratings is inconclusive. Reasoning as to why these similarities or differences exist will be discussed later.
Methods
Participants
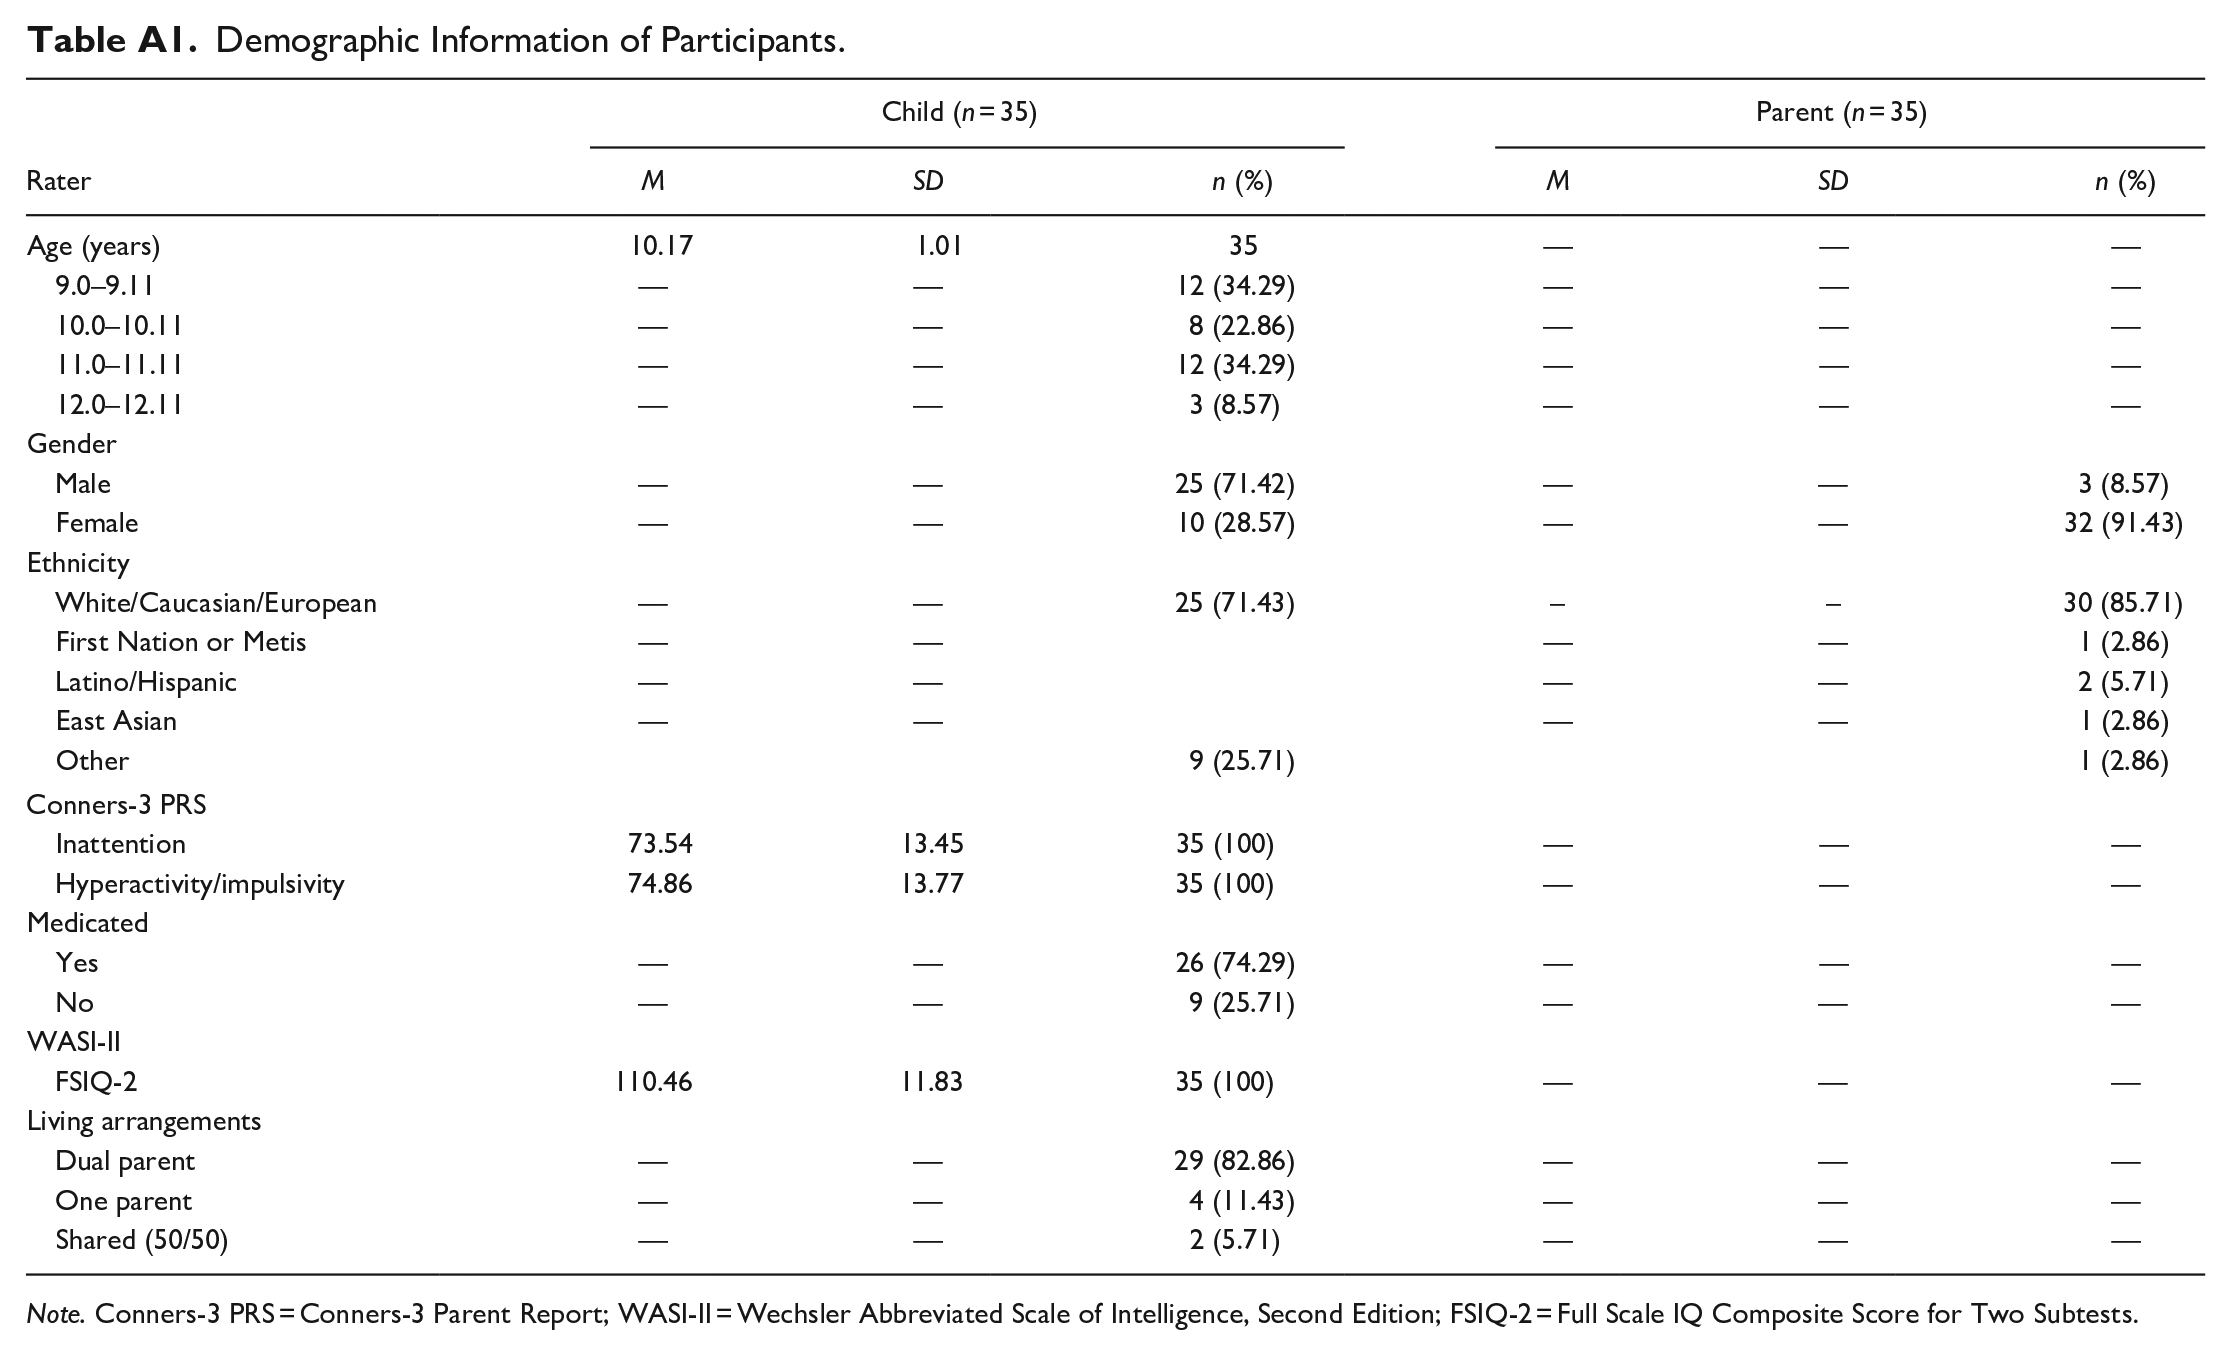
A total of 35 parents (mother or father, but not both) and 35 children with ADHD, all of whom were Canadian residents, participated in the study. See Table A1 for demographic information. The children ranged in age from 9 to 12 years old (M = 10.17, SD = 1.00). The majority of the children identified as male (71.42%) and the remaining children identified as female (28.57%); this ratio is reflective of the ADHD population where more boys are diagnosed with ADHD than girls (roughly 2:1 ratio; APA, 2022). Twenty-five (71.43%) of children identified their ethnicity as White/Caucasian/European and 9 (25.71%) identified as Other. The Other category was composed of children who identified their nationality instead of ethnicity (e.g., Canadian) or who were of mixed race (e.g., Latino and European). The majority of children lived in dual parent homes (82.86%), with a minority living in single parent homes (11.43%) or live in both homes 50% of the time due to shared custody (5.71%). See Appendix A. The majority of parents (n = 32) identified as female (91.43%) and the remaining parents identified as male (n = 3; 8.57%). Although both parents may be involved in the child’s life, only one parent was required to participate and complete the study requirements. Parents identified their ethnicities as 85.71% White/Caucasian/European, 5.71% Latino/Hispanic, 2.86% First Nation or Metis, 3% East Asian, and 2.86% Other (South Asian). Of the parents who participated, 34.3% reported their education level to be a graduate degree, followed by an undergraduate degree (28.6%), college degree (20.0%), some college/university (8.6%), doctorate degree (5.71), and other (2.9%). Regarding income, 60.0% of participating parents reported making over $100,000 a year, demonstrating families in the current study assume higher socioeconomic status. Participants were recruited through printed and online posters, posts on social media sites (e.g., Facebook), and community partners. Families were given a $25 gift card as a token of appreciation for their time. Participants were English speaking with a previous diagnosis of ADHD from a mental health professional or physician. An Average or greater full scale intelligence quotient (FSIQ) score (i.e., a standard score of 80+) on the Wechsler Abbreviated Scale of Intelligence—Second Edition (WASI-II), was also required. Children were excluded if they had co-occurring gross motor or neurological diagnoses (e.g., cerebral palsy and ASD) due to the neurological overlaps with ADHD.
Measures
Parents/legal guardians completed a demographic questionnaire and standardized rating scales independently online and the children completed them virtually with a researcher.
Pre-Screening Survey
Parents/legal guardians were asked to complete a short questionnaire prior to acceptance into the study to ensure inclusion criteria were met. Parents provided information regarding the child’s legal name, age, and language, as well as the parent’s email, living arrangements (with whom does the child live with and for how long), diagnoses (ADHD; and siblings diagnoses), if any neurological or neurodevelopmental conditions were present (e.g., epilepsy and ASD), if motor or sensory impairments were present, and if the child and parent lived in Canada (are Canadian).
Demographic Questionnaires
Parent questionnaires included information regarding their ethnicity, language, gender, level of education, occupation, income, and relationship to child. Parents were then asked to comment on the family’s history of health, as well as their child’s age and if/when they received an ADHD diagnosis (or co-occurring diagnoses), who provided the diagnosis, and their child’s academic performance in each subject. Similarly, child demographics included ethnicity, gender, and age, as well as number of siblings, number of friends, perception of school, and perception of academic performance.
Conners Rating Scale—Third Edition, Parent Short Form (Conners-3 PR)
The Conners-3 PR (Conners, 2008) was administered to assess current ADHD symptomatology, to determine if ADHD criteria continued to be met for each child participant. Given current ADHD symptomatology is necessary to be included in the study, ratings on this scale allowed the authors to determine if the threshold of symptoms is met.
The rating scale is composed of 43 items that measure symptoms associated with ADHD and co-occurring problems in children ages 6 to 18 years. The Conners-3 PR includes six content scales (inattention, hyperactivity/impulsivity, learning problems/executive functioning, defiance/aggression, and peer relations) and symptom scales that are based on the diagnostic criteria outlined in the DSM-IV (APA, 1994). Common inattentive behaviors associated with ADHD may include difficulty concentrating on schoolwork or being easily distracted. Hyperactivity/impulsivity may present as high energy levels and impulsive behaviors. Learning problems/executive functioning may present as struggling academically, needing extra instructions, and demonstrating academic deficits. Learning problems may present as a child struggling with math, reading, and/or writing. Problems with executive functioning may present as poor planning or organizational skills. Defiance/aggression may include behaviors such as physical or verbal aggression, argumentative behavior, and violent/destructive tendencies (e.g., cruel to others). Peer relation problems may include poor or limited social skills and difficulties with developing and maintaining friendships. High scores within the content and symptom scales (t > 70) may indicate that the child presents with characteristics (behavioral, academic, or emotional impairments) associated with ADHD. For the purposes of the current study, only two content scales (inattention and hyperactivity/impulsivity) were utilized to determine if participants surpassed the threshold for heightened behavioral symptoms attributed to ADHD.
The Conners-3 PR utilizes a 4-point Likert-type scale for parents to rate statements regarding their child’s behaviors over the past month according to if the statement described their child or represented the child’s behavior. Parents chose the option not at all (0) if the child did not engage in the behavior, just a little true (1) if the child occasionally engaged in the behavior, pretty much true (2) if the child often engaged in the behavior, and very much true (3) if the child very frequently engaged in the behavior. The Conners-3 PR has demonstrated good reliability and validity, as well as acceptable internal consistency (r = .85–.94) and test-retest reliability (r = .72–.98; Conners, 2008).
Behavioral and Emotional Rating Scale—Second Edition, Parent Form (BERS-2)
The BERS-2 (Epstein, 2004) measures parents’ perspectives of their child’s strengths and competencies in children between 5 and 18 years of age. Within the 59 items, parents rate their child’s strengths in five domains, including interpersonal strength (the ability to control emotions or behaviors in social situations; e.g., is ok with being told “no”), involvement with family (participation in and relationship with family; e.g., is involved in family pastimes), intrapersonal strength (child’s outlook regarding competence and accomplishments; e.g., is excited about their life), school functioning (child’s competence in school; e.g., follows along in class), affective strength (the ability to accept and express affection; e.g., accepts physical touch in the form of a hug), and career strength. However, the items specific to career strengths were not included in this study given the young age group (9–12 years old).
Parents rated their child’s positive behaviors and emotions over the past 3 months according to a 4-point Likert scale. The potential options for parent strength ratings according to each statement included, 0 (not at all like their child), 1 (not much like their child), 2 (like their child), and a 3 (very much like their child). Content scales are reported numerically and descriptively, where scores between 6 and 7 are considered Below Average, 8 to 12 are considered Average, and 13 to 14 are considered Above Average. Thus, high scores within the content scales present greater parent-reported strengths ratings for their child. The BERS-2 demonstrated acceptable test re-test reliability (.80–.94; Mooney et al., 2005). Evidence for convergent validity was shown through comparing the BERS-2 PR to the Social Skills and Rating System (SSRS; Gresham & Elliott, 1990) and the Child Behavior Checklist (CBCL; Achenbach, 1991). Given that all correlation coefficients between the parent forms of the BERS-2 and SSRS were statistically significant, as well as most correlation coefficients between the BERS-2 and CBCL were significant, evidence for convergent validity was provided (Mooney et al., 2005). The BERS-2 parent form also demonstrated strong internal consistency (.84–.93; Buckley et al., 2006).
Child measures
Child participants completed two measures utilized in this study. These measures included the Wechsler Abbreviated Scale of Intelligence, Second Edition (WASI-II; Wechsler, 2011) and the Behavioral and Emotional Rating Scale, Second Edition—Child Form (BERS-2; Epstein, 2004).
Wechsler Abbreviated Scale of Intelligence, Second Edition (WASI-II)
The WASI-II was included to determine if participants were functioning at an age-appropriate intellectual level to ensure question comprehension (Wechsler, 2011). The WASI-II offers a two-subtest administration option to calculate a FSIQ-2 score that eliminates the need for manipulatives, thereby making it an ideal option for virtual administration. The two subtests that make up the FSIQ-2 include Vocabulary, which measures one’s ability to orally define and compare words, and Matrix Reasoning, which assesses one’s ability to detect and apply previous knowledge to solve (novel) problems.
The WASI-II has demonstrated good reliability, test-retest stability, and construct validity (Wechsler, 2011). In the child sample, good to excellent internal consistency coefficients were reported (.87–.91), with internal consistency coefficients in the excellent range for all of the composite scores (.92–.96). With this, the WASI-II FSIQ-2 internal consistency coefficients were excellent (.94, .92, .96, and .93; McCrimmon & Smith, 2013). The WASI-II has acceptable to excellent subtest stability (.79–.90) while composites exhibited good to excellent stability (.87–.95). Concurrent validity was measured by comparing the WASI-II to two similar intellectual measures, the Wechsler Adult Intelligence Scale, Fourth Edition (WAIS-IV) and the Wechsler Intelligence Scale for Children, Fourth Edition (WISC-IV), resulting in acceptable to excellent coefficients (.71–.92; McCrimmon & Smith, 2013).
Behavioral and Emotional Rating Scale—Second Edition, Child Form (BERS-2)
The BERS-2 (Epstein, 2004) measures the child’s self-reported ratings of their strengths and competencies. Children aged 5 to 18 years old can fill in this form, with 52 items that analyze the child’s perspective of their interpersonal strength, involvement with family, intrapersonal strength, school functioning, affective strength, and career strength. Descriptions of the domains can be found in the parent form section. Similarly, career strengths were not included in the study due to the age of the child participants. Descriptions of the 4-point Likert Scale for the child form as well as the numerical and descriptive terms are the same as the parent form. High scores within the content scales present greater self-reported strengths. The BERS-2 child form was normed on 1,301 children (Buckley et al., 2006). Internal consistency of the subscales ranged from .79 to .88 and the test-retest reliability for the strengths index ranged between .84 and .91 (Epstein, 2004). Confirmatory factor analysis validated the five-factor structure (Buckley et al., 2006), and convergent validity was demonstrated by comparing the BERS-2 child form with the Child Behavioral Checklist (CBCL) and the symptoms functioning severity scale (Hurley et al., 2015).
Procedure
Before participating in the study, a short pre-screening survey was sent to the parent/guardian to determine whether inclusion criteria were met. Once criteria were determined to be met, a parent/guardian consent form and child assent form were provided to the participants to read and sign. The parents/guardians were then sent an email which provided them with a questionnaire link to complete a Qualtrics survey that contained all the parent measures (demographic questionnaire, the Conners-3 PR, the BERS-2 PR, and additional measures relevant to the larger project). Parents/guardians were given up to 2 weeks to complete the survey. In the same email, researchers booked a date and time with the child to complete the child-based measures online using secure Zoom student accounts. During Zoom sessions, researchers worked one-on-one with the child, using Qualtrics to answer survey-based questions. Researchers began the session by administering the WASI-II to determine the child’s intellectual score. If the child’s cognitive functioning presented as Average or greater, the session continued, and survey questions were asked. All additional measures were administered in random order.
Results
Data Cleaning and Preliminary Analyses
Data were entered into statistical analysis software (SPSS Version 26). First, data were examined to confirm statistical assumptions and identify potential outliers (Tabachnick & Fidel, 2007). Data were checked for missing values in parent and child responses. No values were missing; therefore, all participants were included in the study. Normality of the data was determined through a visual analysis of histograms and P-P plots, as well as skewness and kurtosis. No violations of normality were observed within the data. Levene’s Test for Equality of Variances resulted in non-significant values, meaning the variance between groups was approximately equal. Box plots were conducted to determine if outliers were present, with no extreme outliers identified. A post-hoc power analysis (.95) was conducted using G*Power3 (Faul et al., 2007). The present sample size was not determined to be sufficient to detect effects; therefore, the results of this study may be impacted by low power. To detect effects, a sample size of 105 for both parents and children is recommended.
Research Questions
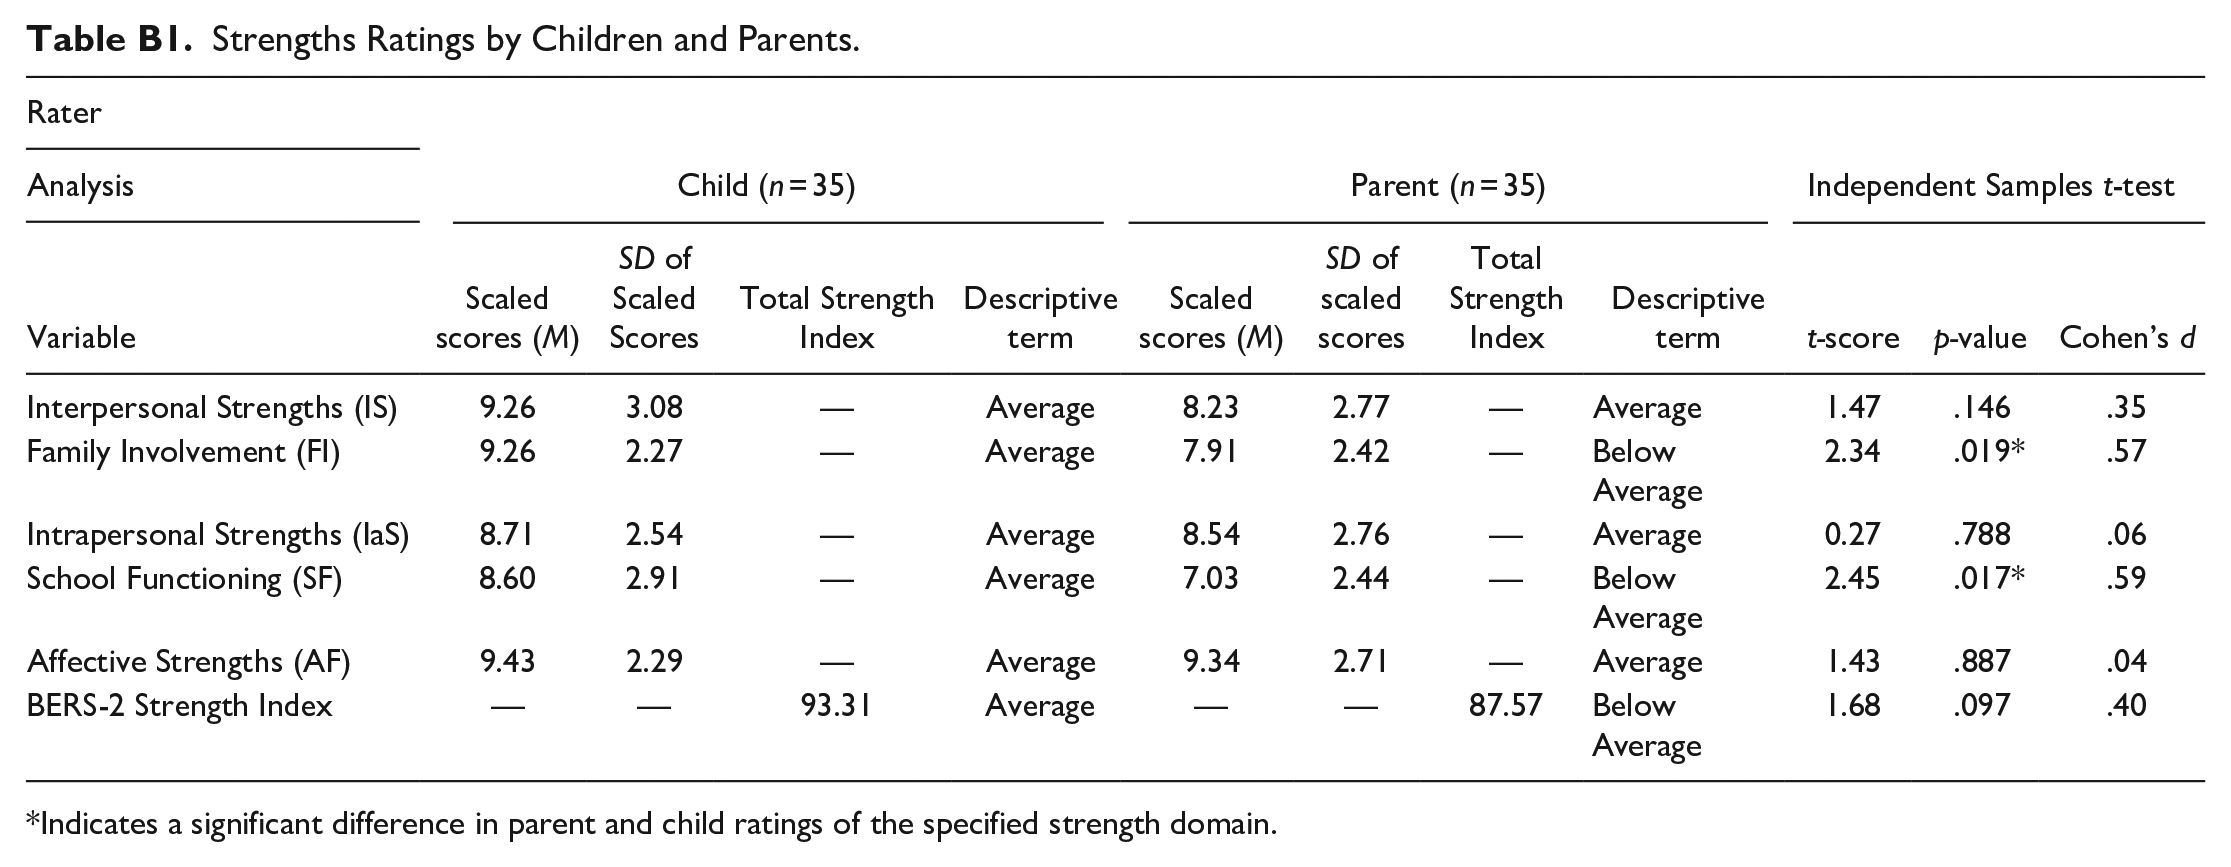
The first research question examined how parents and their children rated their children’s strengths in five domains: interpersonal strength, functioning in and at school, affective strength, intrapersonal strength, and family involvement (see Appendix B). Children perceived all their strengths to be in the Average range (i.e., fell between a standard score of 8–12), including affective (M = 9.43, SD = 2.29), interpersonal (M = 9.26, SD = 3.08), family involvement (M = 9.26, SD = 2.27), intrapersonal (M = 8.71, SD = 2.54), and school functioning (M = 8.60, SD = 2.91) strengths. Thus, children felt their abilities in each domain were like other children of the same gender. Parents ratings were more variable than children’s ratings. Parents believed that their children had Average affective (M = 9.34, SD = 2.71), intrapersonal (M = 8.54, SD = 2.76), interpersonal (M = 8.23, SD = 2.77) strengths, but reported family involvement (M = 7.91, SD = 2.42), and school functioning (M = 7.03, SD = 2.44) strengths as Below Average. Additionally, parent and child overall strengths ratings were examined to better understand how they uniquely see their overall strength profile. Children’s overall index score fell in the Average range (M = 93.31), whereas the parent’s overall index score fell within the Below Average range (M = 87.57).
The second research question examined if there were significant differences between parent and child ratings of the children’s five strength domains. To determine if the children and parents differed in their ratings, an independent samples t-test (two-tailed) was conducted for each strength domain. Results of the t-tests revealed a significant difference in family involvement ratings between parents (M = 7.91, SD = 2.42) and children (M = 9.25, SD = 2.27), t(68) = 2.34, p = .019, Cohen’s d = 0.57 and in school functioning ratings between parents (M = 7.02, SD = 2.44) and children (M = 8.60, SD = 2.91), t(68) = 2.45, p = .017, Cohen’s d = 0.59. No significant differences were found for interpersonal strengths ratings by parents (M = 8.23, SD = 2.77) and children (M = 9.26, SD = 3.08), t(68) = 1.47, p = .146, intrapersonal strengths by parents (M = 8.71, SD = 2.54) and children (M = 8.54, SD = 2.76), t(68) = 0.27, p = .788, or affective strengths by parents (M = 9.34, SD = 2.71) and children (M = 9.45, SD = 2.29), t(68) = 1.43, p = .887. An independent samples t-test was conducted to determine if there were significant differences in ratings on the overall strength index score. No significant differences were found between parents (M = 93.31, SD = 14.49) and children (M = 87.57, SD = 14.05), t(68) = 1.68, p = .097. See Table B1. Given the exploratory nature of this study and the smaller sample size, Bonferroni corrections were not applied. Thus, results should be interpreted with caution given this limitation.
Discussion
The purpose of the study was to investigate parent-child reported strengths in children with ADHD. Two research questions were investigated: (1) How do parents and their children rate the children’s strengths in each of the five BERS-2 strength domains? and (2) Are there differences between parent and child ratings on the five BERS-2 strength domains?
The first research question examined how parents and their children with ADHD rated the children on five strength-based domains as well as children’s overall strengths. Affective strengths are defined as the ability to accept and express affection with others (Epstein, 2004). An Average rating indicates that the children’s levels of affection and intimacy with others were deemed to be sufficient. As ADHD is associated with affective impairments (i.e., emotional expression; Jusyte et al., 2017; Schneidt et al., 2019), more optimistic affective strength ratings provide alternative understandings of the affective capabilities of children with ADHD. Thus, children with ADHD proficiently acknowledge and utilize affective strengths.
Intrapersonal strengths encompass the child’s positive characteristics, outlook, competence, and accomplishments (Epstein, 2004). Both groups’ ratings indicated Average intrapersonal abilities, meaning children were rated as having similar successes and positive outlooks to their peers. Despite the daily challenges that children with ADHD may face, they demonstrate similar positive reflections and expectations as other children. Thus, they may see their characteristics, experiences, and potential as equal to peers. Additionally, average ratings by parents may indicate that they view their children’s accomplishments through an optimistic lens. Parents acknowledging their children’s positive characteristics may also support the parents’ well-being. Specifically, positive parent perceptions of their child are associated with positive maternal affect and well-being (Lickenbrock et al., 2011).
Interpersonal strengths are broadly defined as how one relates and reacts to others (Epstein, 2004). Emotional regulation is necessary when reacting appropriately and taking responsibility for one’s actions. Children with ADHD are reported to experience emotional dysregulation, with difficulties modifying their emotions to fit the context (Staff et al., 2021). However, Average interpersonal ratings imply that children with ADHD react and take accountability for their actions similar to their peers. Although children with ADHD have a greater potential for increased emotional dysfunction or dysregulation, their overall perceived interpersonal skills are viewed as similar to peers. Climie et al. (2019) reported that children with ADHD demonstrate Average abilities to identify emotions and feelings, control their emotions, and utilize emotions when problem-solving. Similarly, children’s emotions in various contexts are not reported to be significantly different from non-ADHD children. This result may be because children with ADHD often develop coping strategies and skills to support their emotions and reactions in various contexts.
Strengths in family involvement include the child’s familial relationships and their participation in family life (Epstein, 2004). Children perceived their family involvement to be Average, indicating they were satisfied with the time they spent with their families. Conversely, parents reported Below Average ratings, indicating their children’s family involvement was lower than other children. As families with ADHD experience more conflict (Climie & Mitchell, 2017), families may spend less time together. Lastly, ADHD-related symptoms may affect or limit the activities families can participate in (e.g., parents feel they cannot take their children to certain activities due to the challenges associated with their behavioral symptoms), reflected in family involvement ratings.
School functioning strengths involve the children’s participation in school tasks, including task completion, time management, attention, and perceived academic achievement (Epstein, 2004). These areas are ones that children with ADHD tend to struggle with due to their symptom presentation and executive functioning challenges (Tamm et al., 2021). Interestingly, in this study, children with ADHD believed that their school functioning is similar to classroom peers. However, parents’ ratings were less optimistic, as children’s school functioning was rated in the Below Average range. Parents believed their children were underperforming both academically and behaviorally at school. Research has shown that children with ADHD frequently underachieve in school and are at greater risk of achieving lower grades and struggling with reading and mathematics (Daley & Birchwood, 2010; Langberg et al., 2011). Further, the prevalence of academic difficulties in at least one subject for children with ADHD is between 33% to 63% (Condo et al., 2022). Considering the above, it is likely that parents’ ratings on school functioning are related to real difficulties their children have in school.
Overall, children’s positive perspectives throughout strength domains demonstrate their optimistic attitudes toward their abilities. Even though children may be cognizant of their challenges related to ADHD, their hopeful perspectives emulate the characteristics of positive psychology as they believe they possess equal strengths to their peers. Although parents rated their children’s functioning in some strength domains as lower than the children did, parents reported many strengths regarding their children’s multifaceted abilities. Parents noted areas where they believed their children were stronger, which may help to foster and promote their children’s continued growth and success in particular domains. For example, encouraging children to use their interpersonal skills to support school functioning may strengthen the children’s communication while also building school-related skills. Thus, this study provides exciting preliminary findings regarding parent-child strength ratings.
Lastly, the BERS-2 measure provided an overall strength index score. Parent-child classification of ratings differed, as children had an overall strength index score of Average, whereas parents indicated Below Average. However, no significant statistical differences were found between overall ratings. Thus, perceptions of overall abilities by parents and their children are similar. Knowing members within a family view children’s strengths similarly allows for greater ease of implementation and integration of a system of supports to continue to build on the children’s strengths and abilities.
The second research question examined if there were statistical differences in parent-child ratings on the BERS-2 strength domains. There were significant differences in the family involvement and school functioning ratings where children rated both domains as significantly higher than their parents did. Children perceived their abilities to be within the Average range, while parents reported the children’s abilities in the Below Average range. The moderate difference in ratings indicates that there is a real-world contrast between how parents and their children view their abilities. Therefore, further exploration in perceptions of family and school functioning would be beneficial.
Family Involvement Rating Discrepancies
Parental stress or family conflict may influence parent ratings. Children with ADHD often present with greater behavioral challenges, contributing to parental stress and frustration (Climie & Mitchell, 2017). Further, children with ADHD’s co-occurring disorders (e.g., behavioral disorders) may amplify conflict. Children with ADHD may not spend as much time with their parents, potentially because of ADHD-specific factors like increased family conflict.
Noteworthy, children with ADHD may believe it is desirable to participate in family activities, thus providing a socially desirable Average rating (Brener et al., 2003; van de Mortel, 2008). Contrastingly, as these children are entering adolescence, they may value their friendships more and spend more time with peers than with their families (Nickerson et al., 2005). Further, as most of the raters in this study were mothers, family involvement ratings were based on one perspective, largely without father input. Future research should consider receiving parent ratings from both parents to ensure accurate ratings.
It may be the case that both the children and parents are reporting the children’s strengths as accurately as possible. Given results indicated medium effect sizes for the difference in parent- and child-reported strengths in family involvement, these findings may be applicable to families with children with ADHD and the level of optimism they perceive toward their children’s family involvement. Although encouraging, given the small sample size, the difference size reported needs to be interpreted with caution and should be replicated by a larger sample. Regardless, these results indicate a distinction between the parent and child perceived roles and expectations within the family context. Regardless, the distinction between ratings provides parents and children with opportunities to communicate about and clarify family expectations. Families may be interested in modifying the home environment to encourage greater family involvement. For families that have children with ADHD, potential positive modifications include adding structure and routine into the home to increase stability and utilizing external support when necessary (e.g., counseling; Moen & Hall-Lord, 2019).
Taken together, the significant difference between parent and child ratings of family involvement demonstrates inconsistencies in family dynamics. As such, targeting family involvement through research and interventions may encourage a more cohesive and supportive family environment.
School Functioning Rating Discrepancies
Given results indicated medium effect sizes for the difference in parent- and child-reported strengths in school functioning, these findings may be applicable to families with children with ADHD and the level of optimism they perceive toward their children’s school-related skills and abilities. Although encouraging, given the small sample size, the difference size reported needs to be interpreted with caution and should be replicated by a larger sample. Regardless, it is imperative to review why discrepancies may occur.
Parent and child discrepancies in school functioning ratings may transpire for several reasons. Children with ADHD may view themselves through an overly positive lens, over-reporting the positive aspects of their functioning (Owens et al., 2007). Thus, children with ADHD may perceive their school abilities as being more competent than their actual abilities. Consequently, children would rate their abilities as falling in the Average range, even if they objectively are not. Alternatively, children may be unaware of the discrepancies in performance and behaviors between them and peers. For example, if children with ADHD receive acceptable grades but require support to complete tasks, they may not see their added support as a consequence of reduced school functioning. Lastly, social desirability may also influence children’s scores if they feel they should have similar school functioning to their peers.
In a school setting, parents may be better informed than students regarding school functioning if they maintain open communication with the staff. By doing so, parents may know first-hand about the supports, goals, and experiences the child has at school. Alternatively, as parents are not physically present at school, they understand their children’s experiences through reports from others (i.e., school staff). As such, the accuracy of reporting may be affected. Future research should include the teacher’s perspective of the children’s school functioning to better determine the accuracy of the school functioning ratings.
Together, children with ADHD were reported as performing slightly below peers in school functioning; thus, with support and intervention they may be able to gain the skills necessary to perform similarly to peers. Further, as children with ADHD were reported to have Average strengths in interpersonal, intrapersonal, and affective domains, they may demonstrate intrinsic and extrinsic strengths such as motivation, emotional regulation, and social support that can aid in their school functioning success (Smith et al., 2019).
Limitations
Sample Limitations
The different presentations of ADHD (i.e., ADHD-HI, ADHD-IA, and ADHD-C) were analyzed as one ADHD group. Differences in reported strengths may exist between the three presentations of ADHD. Strengths or descriptions of ADHD from a child/parent may differ in a family that has an ADHD-HI presentation from an ADHD-C presentation. Future research should consider the potential differences in reported strengths between parents and their children with separate presentations. With this, the majority of the children (74.29%) were on medication to support their ADHD symptoms and functioning. The current study did not evaluate differences in reported strengths for those taking medication versus those not taking medication. As medication may reduce the impact that symptoms of ADHD have on one’s daily functioning, medication usage may be associated with more optimistic child strength ratings. In the future, researchers could control for the effect of medication to evaluate potential differences in reported strengths between children taking medication and not taking medication. Similarly, co-occurring disorders were not identified or analyzed in the study. Given the high heterogeneity of ADHD with other mental health disorders, it is recommended that future research account for co-occurring disorders and medication usage in relation to strength ratings.
The small sample size may have limited the power to detect statistically and clinically significant differences between parent and child reports of strengths. Future research should replicate the study with a greater sample size to increase power to allow differences to be detected. Additionally, as most of the parents were mothers, the parent perspective may not have been overall represented, indicating future research in this area is necessary to promote generalizability.
The sample consisted of primarily White parents and their children, with stable living arrangements, higher educational levels, and higher income levels. Therefore, the sample represented in this study largely does not include individuals with lower SES and may not reflect the perspectives of strengths reported by parents and their children in a broader population. As greater economic pressure may be associated with increased parental stress and parent-child conflict, as well as decreased parental knowledge (Zheng & McMahon, 2022), strength ratings in areas such as family involvement, may be consequently impacted. Given that factors such as culture, ethnicity, gender roles and responsibilities, and familial functioning may similarly impact self and parent-reported strengths, future research is needed to analyze these factors in relation to strengths ratings.
Lastly, the sample recruitment was limited as only those who saw the online or in-person posters were aware of the study. This discounts families who did not have access to the posters, whether that be in-person or online, as well as families who were unaware or unable to refer to the community partners that advertised the study.
Measurement Limitations
Only one measure (BERS-2) was used to assess parent-child reported strengths. It may be advantageous to include additional or alternative strengths measures that elicit greater understanding of strengths domains beyond the BERS-2. Moreover, the BERS-2 is limiting as children’s strengths are not normed by age. Children develop rapidly and undergo several social, emotional, and cognitive changes during childhood (Rubin et al., 2004). Children’s perceptions of their abilities may shift as they develop (Fredricks & Eccles, 2002); thus, their perceptions of their strengths may also shift. Therefore, assuming one’s perceptions of strengths are consistent across childhood, without exploring age, limits the depth of the study.
Relevance to the Practice to School Psychology
Shifting school psychologists’ perception of ADHD to one that promotes optimistic outlooks may contribute to student success. Positive views of students with ADHD may promote stronger rapport, increasing the child’s motivation and attention to participate in activities. Also, collaboratively identifying and acknowledging a child with ADHD’s positive characteristics, relationships, and emotional and behavioral functioning may empower the child to continue to perform to the best of their abilities (Frame, 2003). Additionally, increased empowerment and support while working alongside a school psychologist may motivate children with ADHD to address and/or overcome the challenges they face. In turn, an increase in optimism may reduce the likelihood of negative outcomes associated with ADHD symptomology, including mental health issues (Frame, 2003). The results also suggest that a school psychologist should analyze the parent-child relationship and parent’s perception of the child. As parents understand where strengths of children with ADHD lie, parents can work with the school psychologist to advocate for their children’s strengths while supporting areas of need. Further, school psychologists may benefit from addressing family dynamics to support the family with navigating services that may increase positive family involvement (Herbell et al., 2020). With this, school psychologists may can be better informed when recommending ways in which school personnel can promote the student’s success. Lastly, educating teachers about a strength-based approach may support the student-teacher relationship and may provide the teacher with direct practices that promote the student’s interpersonal and academic abilities.
Footnotes
Appendix A
Demographic Information of Participants.
| Rater | Child (n = 35) | Parent (n = 35) | ||||
|---|---|---|---|---|---|---|
| M | SD | n (%) | M | SD | n (%) | |
| Age (years) | 10.17 | 1.01 | 35 | — | — | — |
| 9.0–9.11 | — | — | 12 (34.29) | — | — | — |
| 10.0–10.11 | — | — | 8 (22.86) | — | — | — |
| 11.0–11.11 | — | — | 12 (34.29) | — | — | — |
| 12.0–12.11 | — | — | 3 (8.57) | — | — | — |
| Gender | ||||||
| Male | — | — | 25 (71.42) | — | — | 3 (8.57) |
| Female | — | — | 10 (28.57) | — | — | 32 (91.43) |
| Ethnicity | ||||||
| White/Caucasian/European | — | — | 25 (71.43) | – | – | 30 (85.71) |
| First Nation or Metis | — | — | — | — | 1 (2.86) | |
| Latino/Hispanic | — | — | — | — | 2 (5.71) | |
| East Asian | — | — | — | — | 1 (2.86) | |
| Other | 9 (25.71) | 1 (2.86) | ||||
| Conners-3 PRS | ||||||
| Inattention | 73.54 | 13.45 | 35 (100) | — | — | — |
| Hyperactivity/impulsivity | 74.86 | 13.77 | 35 (100) | — | — | — |
| Medicated | ||||||
| Yes | — | — | 26 (74.29) | — | — | — |
| No | — | — | 9 (25.71) | — | — | — |
| WASI-II | ||||||
| FSIQ-2 | 110.46 | 11.83 | 35 (100) | — | — | — |
| Living arrangements | ||||||
| Dual parent | — | — | 29 (82.86) | — | — | — |
| One parent | — | — | 4 (11.43) | — | — | — |
| Shared (50/50) | — | — | 2 (5.71) | — | — | — |
Note. Conners-3 PRS = Conners-3 Parent Report; WASI-II = Wechsler Abbreviated Scale of Intelligence, Second Edition; FSIQ-2 = Full Scale IQ Composite Score for Two Subtests.
Appendix B
Strengths Ratings by Children and Parents.
| Rater | Child (n = 35) | Parent (n = 35) | Independent Samples t-test | ||||||||
|---|---|---|---|---|---|---|---|---|---|---|---|
| Analysis | |||||||||||
| Variable | Scaled scores (M) | SD of Scaled Scores | Total Strength Index | Descriptive term | Scaled scores (M) | SD of scaled scores | Total Strength Index | Descriptive term | t-score | p-value | Cohen’s d |
| Interpersonal Strengths (IS) | 9.26 | 3.08 | — | Average | 8.23 | 2.77 | — | Average | 1.47 | .146 | .35 |
| Family Involvement (FI) | 9.26 | 2.27 | — | Average | 7.91 | 2.42 | — | Below Average | 2.34 | .019* | .57 |
| Intrapersonal Strengths (IaS) | 8.71 | 2.54 | — | Average | 8.54 | 2.76 | — | Average | 0.27 | .788 | .06 |
| School Functioning (SF) | 8.60 | 2.91 | — | Average | 7.03 | 2.44 | — | Below Average | 2.45 | .017* | .59 |
| Affective Strengths (AF) | 9.43 | 2.29 | — | Average | 9.34 | 2.71 | — | Average | 1.43 | .887 | .04 |
| BERS-2 Strength Index | — | — | 93.31 | Average | — | — | 87.57 | Below Average | 1.68 | .097 | .40 |
Indicates a significant difference in parent and child ratings of the specified strength domain.
Declaration of Conflicting Interests
The author(s) declared no potential conflicts of interest with respect to the research, authorship, and/or publication of this article.
Funding
The author(s) received no financial support for the research, authorship, and/or publication of this article.