
Abstract
The relation between answer behaviour and measurement error has been studied extensively. Answer behaviour may be considered undesirable, like answering ‘don’t know’ or ‘won’t tell’. It is not clear to what degree undesirable answer behaviour from the same respondents is present across different surveys. In this study, we investigated to what extent respondents show undesirable answer behaviours consistently over multiple surveys. First, we investigated to what extent the answer behaviours occurred in ten large general population surveys of CentERdata and Statistics Netherlands. Second, we explored the respondent variances and respondent-survey interaction variances to obtain an indication for respondent consistency for each answer behaviour. The results showed that respondents only occasionally give ‘don’t know’– and ‘won’t tell’-answers. An indication for respondent consistency was found for fast responding, slow responding, and ‘won’t tell’-answers in particular. We recommend follow-up research to investigate the relation between respondent characteristics and consistent answer behaviour.
Introduction
The relation between survey answer behaviour and measurement error has been studied extensively. Various forms of answer behaviour are considered undesirable, like answering ‘don’t know’ (Beatty and Herrmann, 2002; Shoemaker et al., 2002). The extent to which undesirable answer behaviour of the same respondents is present across different surveys is unclear. When a respondent only incidentally shows a behaviour, for example for one specific survey, it is not to say whether that behaviour is typical for that respondent. The behaviour may then be the result of taking shortcuts in the question-answering process, also known as satisficing (Krosnick, 1991, 1999; Krosnick et al., 1996), but may just as well be truly attributed to the respondent. When a respondent shows the behaviour across different and multiple surveys, it becomes more likely that the behaviour is typical for that specific respondent. In other words, the respondent may have a stable personal tendency to show specific undesirable behaviour, regardless of survey topic or design. In this article, we investigate to what extent respondents show consistency in expressing potentially undesirable answer behaviour across multiple surveys. The term ‘consistency’ refers to a pattern of answer behaviour that is shown over several moments in time, across multiple surveys. To answer our research question, we use a large number of panel respondents and a large number of different surveys.
We need to note that we explore consistent answer behaviour across surveys without considering characteristics of respondents, surveys, or survey items: we are neither trying to identify individual or subgroups of respondents, nor taking into account survey topic or design. First, by including many different surveys, variation will be present in survey topic and design. As a result of this variation, we assume that each survey has its own specific effect on the answer behaviours. In our study, we want to distinguish respondent behaviour that is survey-specific from behaviour that occurs consistently across surveys. In order for respondent consistency to appear, it needs to predominate a single survey topic or design effect by definition. In other words, we need the full presence of topic and design variability to investigate behaviour consistency across various surveys. Thus, for the purpose of our study, it is sufficient to presume variability in survey topic and design without taking these into further account.
Second, in case of little or no respondent consistency, the presence of specific types of respondents showing specific behaviour across surveys is unlikely. It may then not be recommendable to further investigate the role of respondent characteristics in relation to consistent undesirable answer behaviour and measurement error. Only in case of a substantial degree of respondent consistency in showing specific behaviour, it may be worthwhile for further research to investigate to what extent subgroups of respondents share the same stable characteristics. Therefore, we want to execute an exploration of respondent consistency without differentiating between types of respondents first. Subsequently, future research may focus on the relation between stable respondent characteristics and undesirable answer behaviour across surveys. This relation could then be used by survey constructors and administrators to control for measurement error.
It is important to emphasize that when we speak of undesirable answer behaviour, we refer to potentially undesirable answer behaviour. Our idea is that the more consistently the behaviour is present over the more surveys, the more likely it is that the behaviour is typical. In this study, we only include answer behaviours that are relatively straightforward to consider in checking the answering options from survey response data. For instance, answering ‘don’t know’ and primacy responding can be coded by respectively selecting the ‘don’t know’ answers and the first two options of an answering scale. To empower finding potential respondent consistency, we use ten large national population surveys administered by CentERdata in the LISS Panel. These surveys vary broadly in topic and contain many different kinds of items. With this broad range of surveys, we aim to present a complete overview of the prevalence of several typical answer behaviours.
First, we investigate the frequency of potentially undesirable answer behaviours in the different surveys. Second, we investigate to what extent respondents are consistent over multiple surveys in showing these behaviours. We analyze various forms of answer behaviours, as motivated in section 2. In section 3, we present the included surveys of Statistics Netherlands and the LISS Panel, and elaborate on the programming and operationalization procedure, the consistency methodology, and the statistics. In section 4, we show all statistical results and give answers to our research questions. In section 5, we conclude with a discussion of these results and make suggestions on how to proceed.
Answer Behaviours: Selection and Motivation
In this section, we elaborate on seven relevant answer behaviours, selected from the literature: answering ‘don’t know’, answering ‘won’t tell’, primacy responding, recency responding, straightlining, slow responding, and fast responding. Below, we give a short overview of the literature for each answer behaviour. We motivate their inclusion by elaborating on why they may be referred to as undesirable and how they may be related to measurement error.
Answer Behaviours
Answering ‘Don’t Know’ and ‘Won’t Tell’
The answering options ‘don’t know’ or ‘won’t tell’ are often added to the substantive answer categories. Research shows that sensitive questions are likely to receive more refusals and that questions requiring more cognitive effort are likely to receive more don’t knows (Shoemaker et al., 2002). On the one hand, respondents may not give a substantive answer in case; they are relatively inexperienced as a respondent (Binswanger et al., 2013); they are reluctant or lacking motivation to answer (Beatty and Herrmann, 2002; Roßmann et al., 2017); items ask for sensitive information (Bradburn et al., 1978; Tourangeau et al., 2000). On the other hand, respondents may give an actual answer without knowing the answer or having an opinion (Bishop et al., 1986; Beatty and Herrmann, 2002). This implies that a non-response option should only be included when deemed a realistic plausible option (Vis-Visschers et al., 2008). In these situations, measurement error can be the result, which may be mode-dependent (Fricker et al., 2005; Roberts, 2007).
Primacy and Recency Responding
Depending on the order in which answering options are offered, response order effects may occur; an increased probability that an option will be chosen at the beginning or end of a list, respectively called a primacy and a recency effect (Krosnick and Alwin, 1987). Primacy effects may be expected in case items are presented visually (Krosnick and Alwin, 1987; Krosnick, 1991; Galesic et al., 2008) and recency effects in case items are presented orally (Krosnick and Alwin, 1987; Krosnick, 1991). Both situations may lead to measurement error.
Straightlining
Questions followed by a common answer scale are often clustered together (Krosnick, 1991). This may lead respondents to differentiate to a smaller extent between the questions in their answers (Krosnick and Alwin, 1989). Straightlining, or non-differentiation, refers to giving the same answers to a series of questions arranged in a grid format (Schonlau and Toepoel, 2015). Straightlining seems more common towards the end than the beginning of a questionnaire (Krosnick, 1991). It tends to increase for respondents who give answers very quickly or ‘speed’ (Zhang, 2013; Zhang and Conrad, 2013) or had relatively longer panel experience (Schonlau and Toepoel, 2015). The behaviour may partly be dependent on the type of survey topic or question (Schonlau and Toepoel, 2015) or whether the questions were constructed in grid versus item-by-item design (Roßmann et al., 2017).
Fast and Slow Responding
Response times might be indicative for problems in the response process and linked to measurement error (Olson and Smyth, 2015; Yan and Olson, 2013). Spending relatively much or little time in filling out a survey may be of concern. Filling out survey items very rapidly, known as ‘speeding’ (Zhang and Conrad, 2013; Greszki et al., 2015), may refer to poor processing of the items (Malhotra, 2008) and is associated with lower data quality (Revilla and Ochoa, 2014); filling out survey items very slowly may mean that respondents have potential difficulty in processing the items (Yan and Tourangeau, 2008; Couper and Kreuter, 2013). Variation in interview duration can be explained by internet experience (Yan and Tourangeau, 2008) and longer online survey experience (Toepoel et al., 2008; Yan and Tourangeau, 2008).
Hypotheses
As far as we know, respondent consistency has not been investigated by means of a panel consisting of many respondents across the broad range of ten national population surveys. For the purpose of this study, we assume that showing undesirable answer behaviour may be attributed substantially to part of the respondent. This means that we presume that respondents either do not show or do show a specific behaviour consistently across surveys. Therefore, in case an answer behaviour occurs in the applicable surveys to some extent at all, we expect the behaviour to occur consistently across the surveys to a substantial degree.
Method
Surveys and LISS Panel
We selected ten Dutch general population surveys that were administered by CentERdata to the same respondents of the Longitudinal Internet studies for the Social Sciences (LISS) Panel. This was done in the time period between June 2012 and December 2013. The surveys were the first wave of the Dutch Labour Force Survey from Statistics Netherlands and nine of the core studies from CentERdata. All surveys were administered in computer-assisted format. These surveys cover a broad range of topics in the field of general population statistics. See Table 1.
Overview of All Surveys, a Description of their Content, and their Response Rate (and the Number of Respondents)
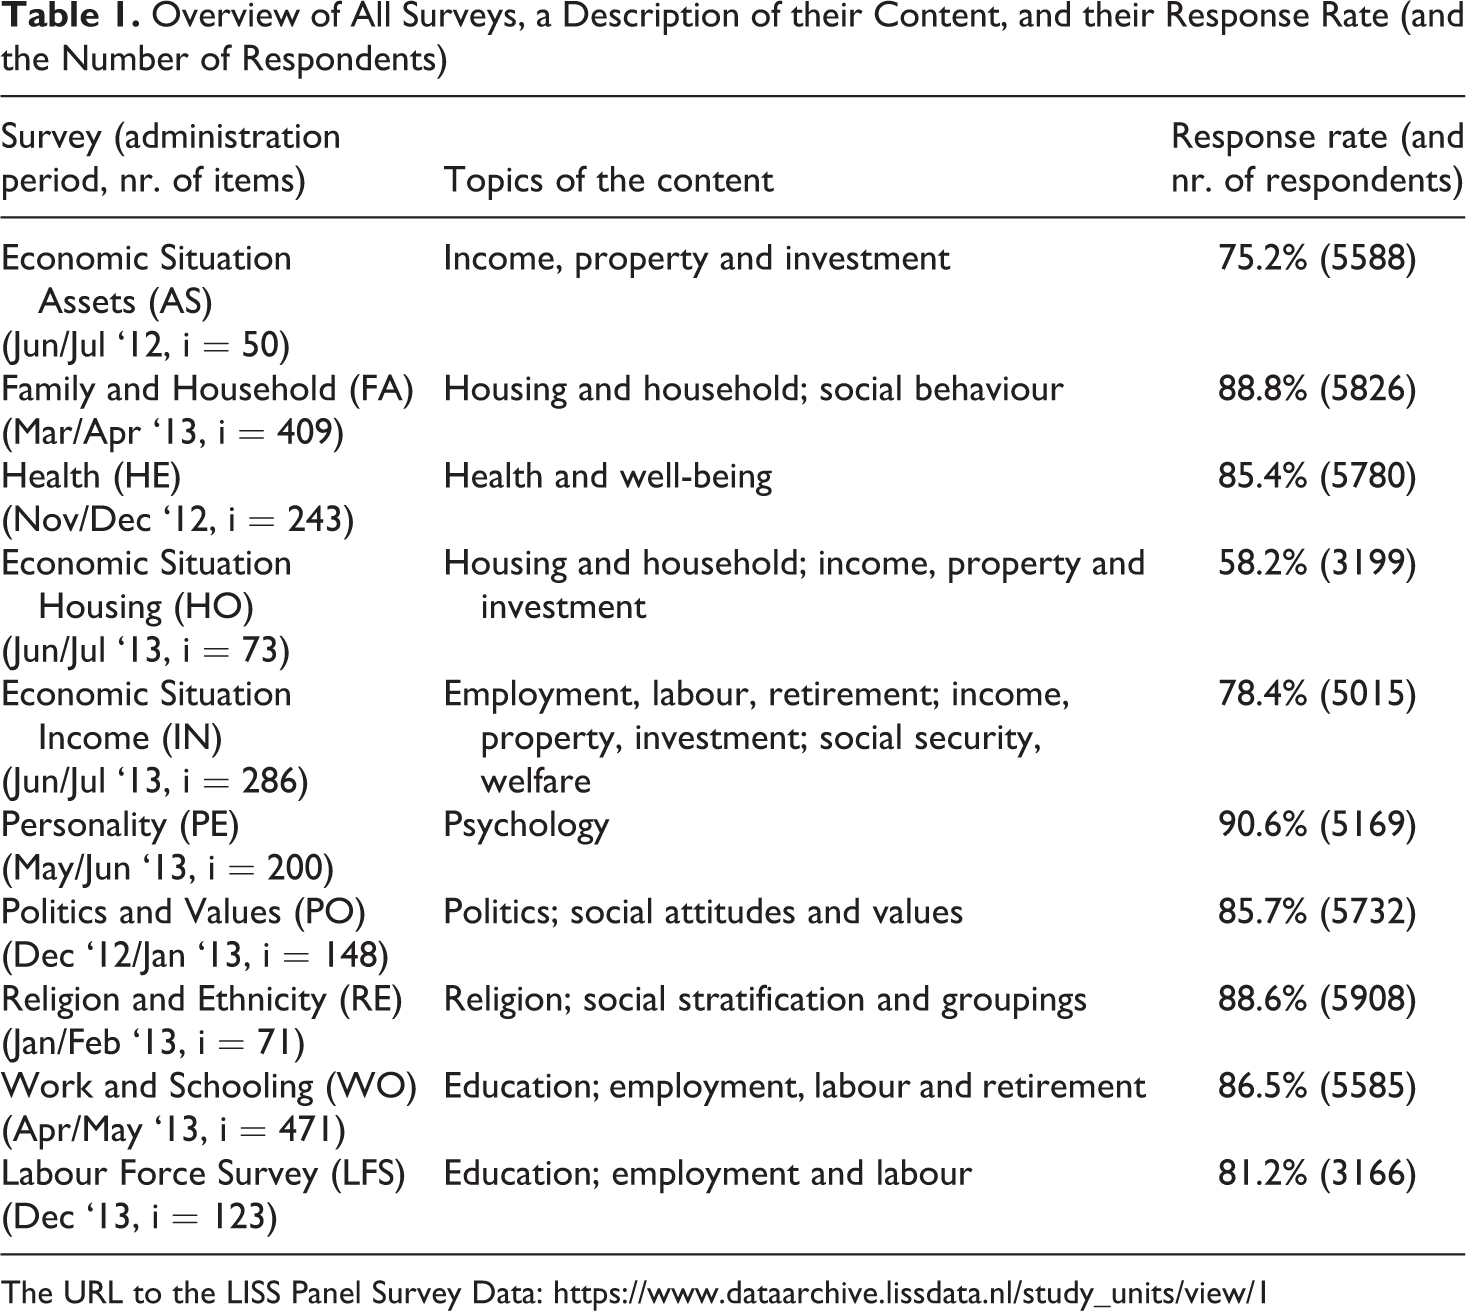
The URL to the LISS Panel Survey Data: https://www.dataarchive.lissdata.nl/study_units/view/1
The LISS Panel consists of about 7000 individuals from about 4500 households and is based on a probability sample of households. This sample is drawn from the population registry by Statistics Netherlands. All panel members were invited for all surveys included in this study. The first administration period for each survey was approximately a month. In case of initial nonresponse, the respondent was sent one or two reminders within this period. To increase the response rate, a second administration period of about a month including one or two reminders was executed for each survey. The respondents were paid for each survey that they completed. The number of respondents that filled out a specific survey differed per survey and the number of surveys that respondents filled out varied across respondents. The average number of surveys filled out by a respondent was 8. Altogether, the surveys contain 2074 items that were used to cover the seven possible answer behaviours as presented in section 2.
Coding the Answer Behaviours
To come to the factual occurrence of the behaviours, all items of the ten surveys were investigated on whether they were eligible for the selected answer behaviours first. For instance, this means that only items that actually present the don’t know-option are eligible for the behaviour answering don’t know. For the items that appeared eligible, the accompanying answer categories were coded for each specific answer behaviour. In case a category was filled out for which the behaviour occurred, the response was coded as 1; in case a category was filled out for which the behaviour did not occur, the response was coded as 0. For all behaviours, the coding was relatively straightforward. For instance, for answering ‘don’t know’ and ‘won’t tell’, the don’t know- and won’t tell-options were coded as 1, while all other options were coded as 0. For primacy and recency responding, the first two and the last two options respectively were coded as 1, while all other options were coded as 0. The coding method was based on Medway and Tourangeau (2015).
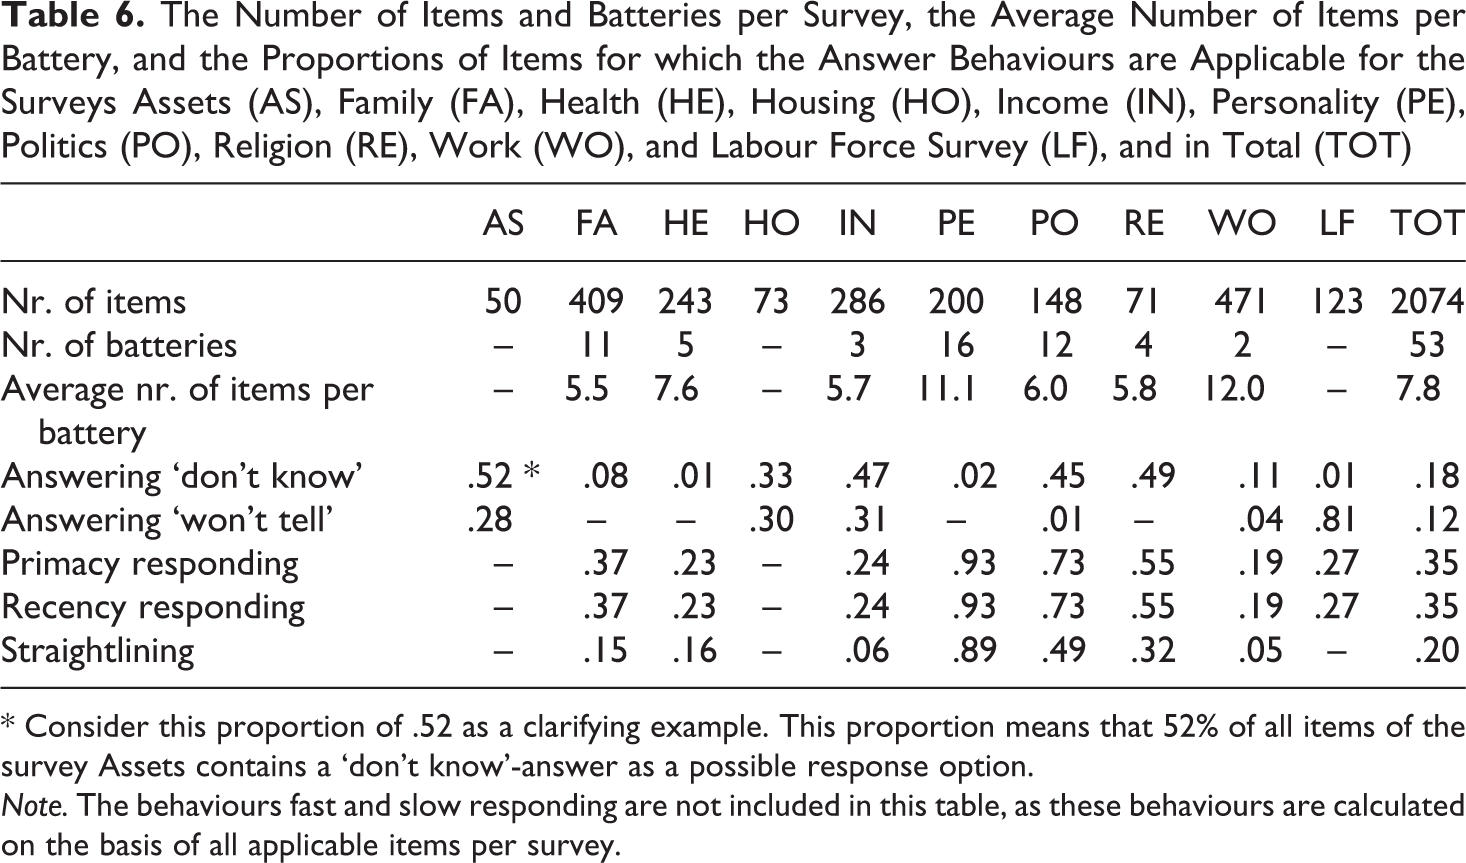
After coding all eligible items for all behaviours, the relative frequencies for the behaviours were calculated. A relative frequency refers to the proportion of behaviour occurrence. For instance, consider a respondent who fills out 100 eligible survey items for the behaviour ‘answering don’t know’. And suppose that the respondent fills out ‘don’t know’ for 20 of these 100 items and a non-’don’t know’-answer for the other 80 items. Then the relative frequency is 20/100 or 0.20. See Table 2 for an overview of the answer behaviours, the kind of eligible items, and the operationalization for each behaviour in calculating the relative frequencies. See Table 6 in Appendix A for the numbers and proportions of items for which each answer behaviour is applicable for each survey and in total. From here, we discuss the coding process of the answer behaviours that need more elaboration.
The Form of Answer Behaviour, the Kind of Items Eligible for the Answer Behaviour, and the Operationalization of the Answer Behaviour
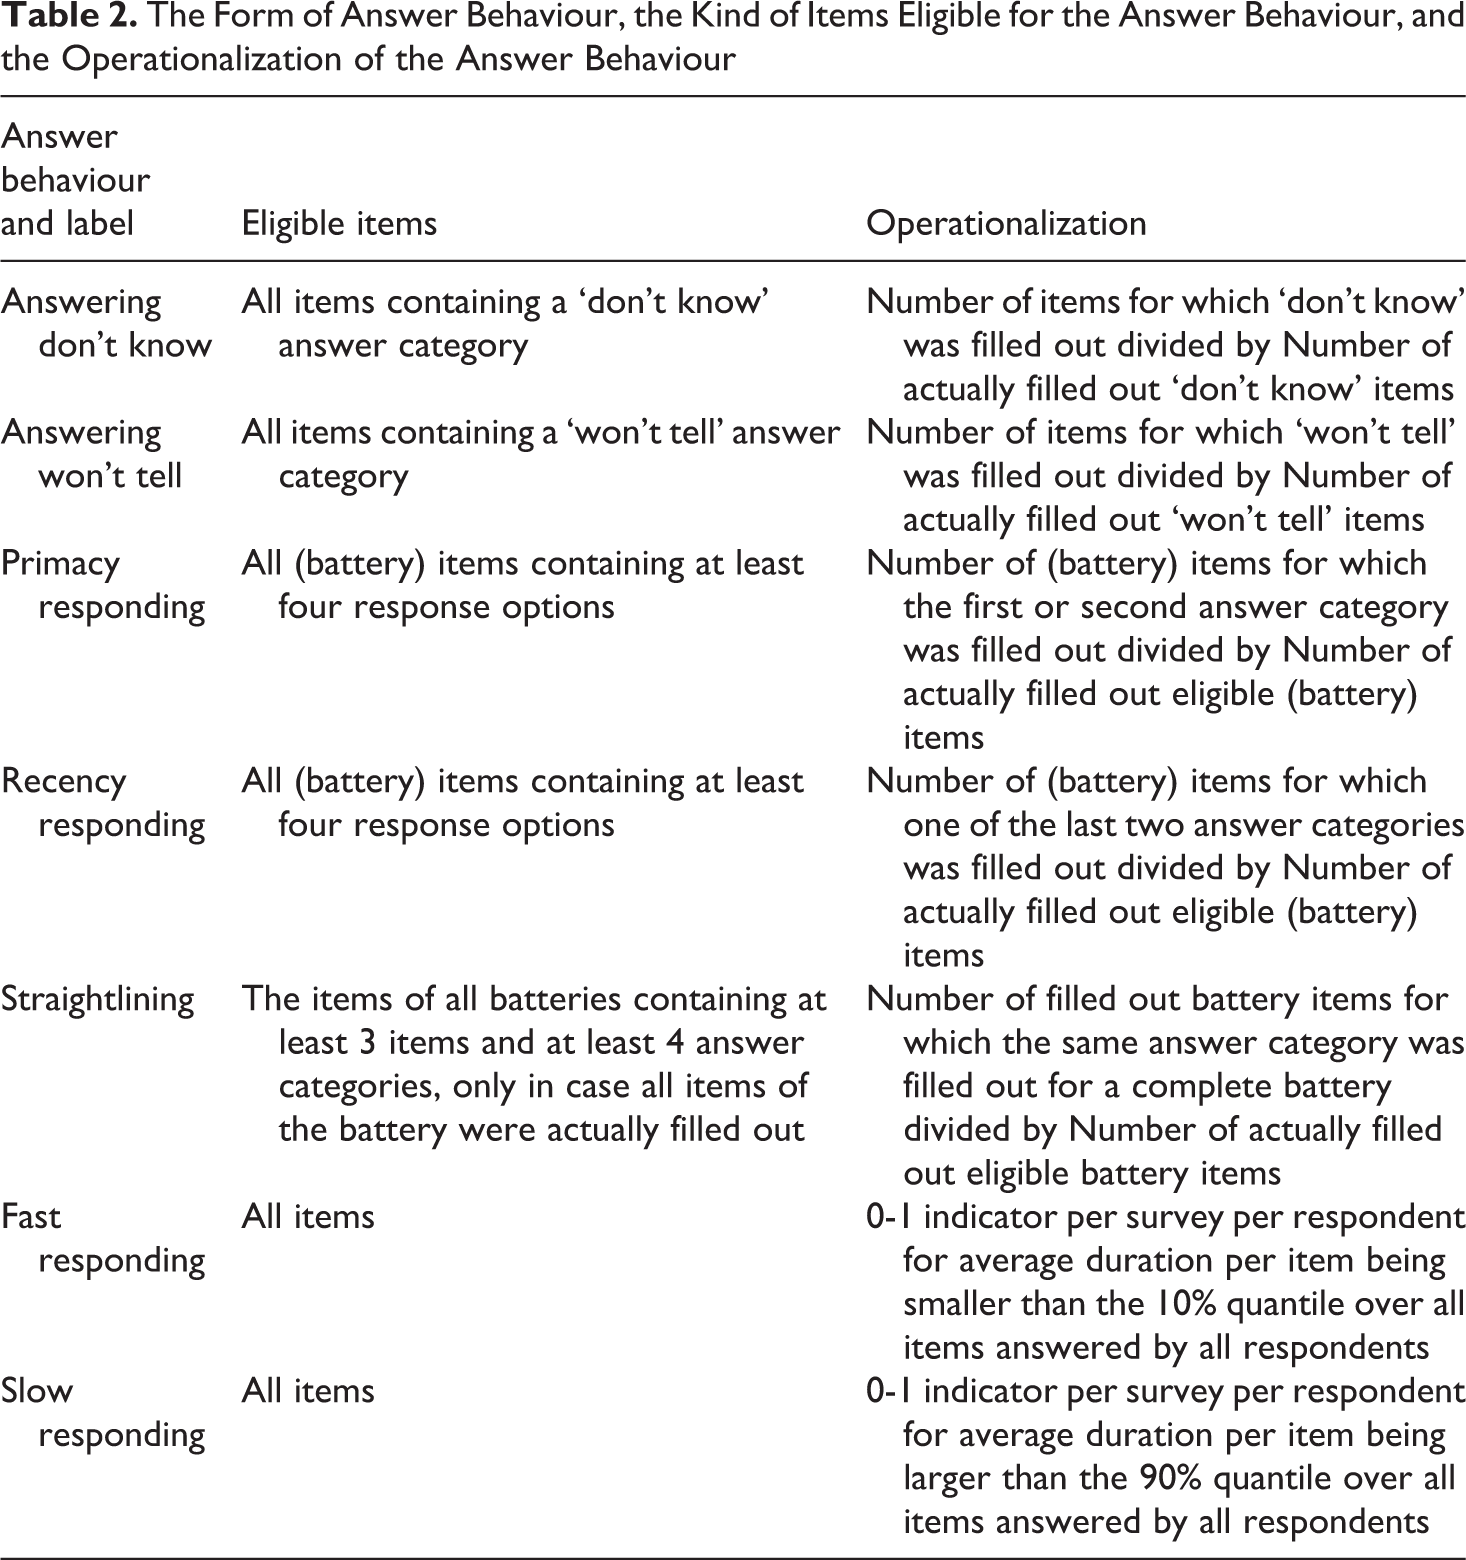
Straightlining: Choosing the Same Answer Category for all Items in a Battery
All batteries for all surveys were investigated on straightlining. Our idea was to consider straightlining for a battery only when the very same answering options were filled out for all its items (see Schonlau and Toepoel, 2015). When this is the case, the number of times that a ‘1’ is coded is equal to the number of items that the battery consists of. For instance, the occurrence of straightlining for a battery of five items received the code ‘1’ five times. This means that we took into account the length of the battery for this behaviour. Note that we considered the concept of straightlining as it is defined by Krosnick (1991), as the full non-differentiation between the categories of a set of battery items. We did not consider diagonal answering patterns in batteries, as we argue that responding in a straight diagonal line involves relatively more effort for the respondent and may not occur very often. We also did not consider seemingly random answering patterns in batteries, as such patterns are difficult to distinguish from non-random patterns.
Responding Faster or Slower than Average
We were able to determine the duration of filling out an item of a survey for respondents on average, but we did not have the duration of filling out each specific item separately. This means that we did not consider response time of particular items, but only of each survey as a whole. We constructed an absolute response time threshold for fast and slow responding that was the same for each survey. We chose these thresholds so that the proportion of ‘fast’ and ‘slow’ respondents differed per survey and was roughly 0.10 on overall average. We chose to use overall quantiles instead of survey-specific quantiles to avoid a survey variance of zero in the analyses.
Model for Variance Decomposition and Consistency Indication
First, the number of eligible items differs per behaviour and per survey. Second, most surveys contain routing of questions. This means that the number of responses differed per respondent and per survey. These responses, consisting of 0’s and 1’s, were used for the analyses per answer behaviour. Therefore, we chose for logistic data analyses with answer behaviour as the dichotomous dependent variable. We considered both ‘respondent’ and ‘survey’ as two higher order levels that are not unambiguously hierarchical or nested, but that are cross-classified (Hox, 2010). This means that we used two-way cross-classified logistic multilevel models to estimate the variance components of the random intercepts for respondent, survey, and respondent-survey interaction (simply called ‘interaction’ from here).
The larger the respondent variance and survey variance, the more respondents and surveys respectively differ in showing specific answer behaviour. The random interaction intercept refers to the extent to which the occurrence of behaviour for respondents is dependent on the survey level. Hence, a relatively high interaction variance means that the occurrence of that behaviour differs for respondents and, depending on the respondent, also differs for surveys. To discover potential respondent consistency, the behaviour must be shown; 1) to a certain degree at all, and; 2) for relatively many to all surveys. In the scenario of ultimate consistency, respondents either rarely or frequently show the behaviour over all (or many) surveys. Hence, in order to find such consistency, answer behaviour should not be dependent on the survey level. This means that interaction variance needs to be absent or low relative to respondent variance. In summary, an indication for respondent consistency in answer behaviour over surveys would be relatively large respondent variance and relatively small interaction variance. Note that we are not interested in behaviour that is consistently rare or absent, but in behaviour that is clearly present across surveys. Only undesirable answer behaviour that actually and consistently occurs is of concern considering potential measurement error.
As we want to obtain these variances and give an indication about respondent consistency across surveys, note that we assume that our surveys are a representative sample of all possible surveys. We justify this assumption by emphasizing that we have the substantial number of ten large surveys that broadly vary in topic. As we stated in the introduction, we deliberately do not control for survey topic or design effect. By our multilevel model, we obtain pure variances for respondents, surveys, and their interactions for an indication of behaviour consistency across surveys that vary in topic and design. Again, also note that we deliberately do not incorporate respondent characteristics into our multilevel model. This study is to explore the presence of respondent consistency without differentiating between types of respondents.
In our study, consistency refers to showing about the same relatively high occurrence for an answer behaviour over multiple surveys and within each survey over multiple items. One cannot speak of consistent answer behaviour over surveys by including only one survey or only a few items. Therefore, for each separate answer behaviour and analysis, we chose to include respondents who filled out at least two surveys, for which they filled out at least five items each. For instance, the behaviour answering ‘won’t tell’ can occur only in the surveys Assets, Housing, Income, Work and Schooling, and the Labour Force Survey. Only respondents who filled out at least five eligible items from at least two of these surveys are included for the analysis of this behaviour.
Statistical Analyses
We calculated the relative frequencies of each answer behaviour in proportions per survey and in total over all surveys together. In calculating the relative frequencies for the total over all surveys together, we considered all items of all surveys as if they were all part of one large survey. For response time, we did not calculate average response times because of extreme outliers that refer to respondents who distributed filling out a survey over multiple days. While including all outliers, we calculated the median response time for each survey and in total. For fast and slow responding, we calculated the proportions of respondents answering faster or slower than the fixed absolute response time threshold per survey and in total over all surveys together. For the total over all surveys, all items of all surveys were considered together as if they were all part of one large survey. As each survey differed in the amount of time that was needed to answer an average item, the fixed threshold ensures survey variation in the proportions of fast- and slow-answering respondents.
By means of the multilevel models, we calculated respondent, survey, and interaction variances, and their profiled confidence intervals (see Venzon and Moolgavkar, 1988). Profiled confidence intervals examine the likelihood of a single parameter separately, holding all other model parameters constant. The intervals refer to a robust method for estimating non-symmetric likelihood functions about the variances (Joshi, 2015). Finally, we calculated the intraclass correlation coefficients (ICCs) to present the proportions of explained variance. This is done for each variance component and answer behaviour separately over all surveys.
Results
Before answering our research questions, we address the potential influence of the administration period during which respondents filled out the surveys on the results. The idea is that respondents who filled out all or most of their surveys during the second administration period may deviate in their answer behaviour from respondents who did so during the first administration period. Concretely, it may be that respondents who repeatedly need multiple invitations/reminders to fill out a survey may show other or more undesirable response patterns than respondents who do not repeatedly need multiple invitations/reminders. Therefore, we briefly explored the percentages of surveys that were filled out during the second administration period for each respondent. Here, a relatively large group of respondents who filled out all or most of their surveys during the second administration period may be of concern. The exploration shows that only 0.1%, 0.2%, and 1.3% of all respondents filled out all, more than 75%, and more than 50% of their surveys respectively in the second administration period. We consider these percentages too small to make a significant potential difference with respect to our study results. Therefore, we decided not to further investigate the influence of administration period on the results.
From here, we elaborate on the occurrence of answer behaviours by evaluating the observed relative frequencies of the behaviours resulting from Table 2. See Table 6 in Appendix A for the maximum proportions of items for which each answer behaviour can factually occur. See Table 3 for the relative frequencies of all answer behaviours per survey and in total.
Relative Frequencies for the Answer Behaviours and Median Response Times (in seconds) for the Surveys Assets (AS), Family (FA), Health (HE), Housing (HO), Income (IN), Personality (PE), Politics (PO), Religion (RE), Work (WO), and Labour Force Survey (LF), and in Total (TOT)
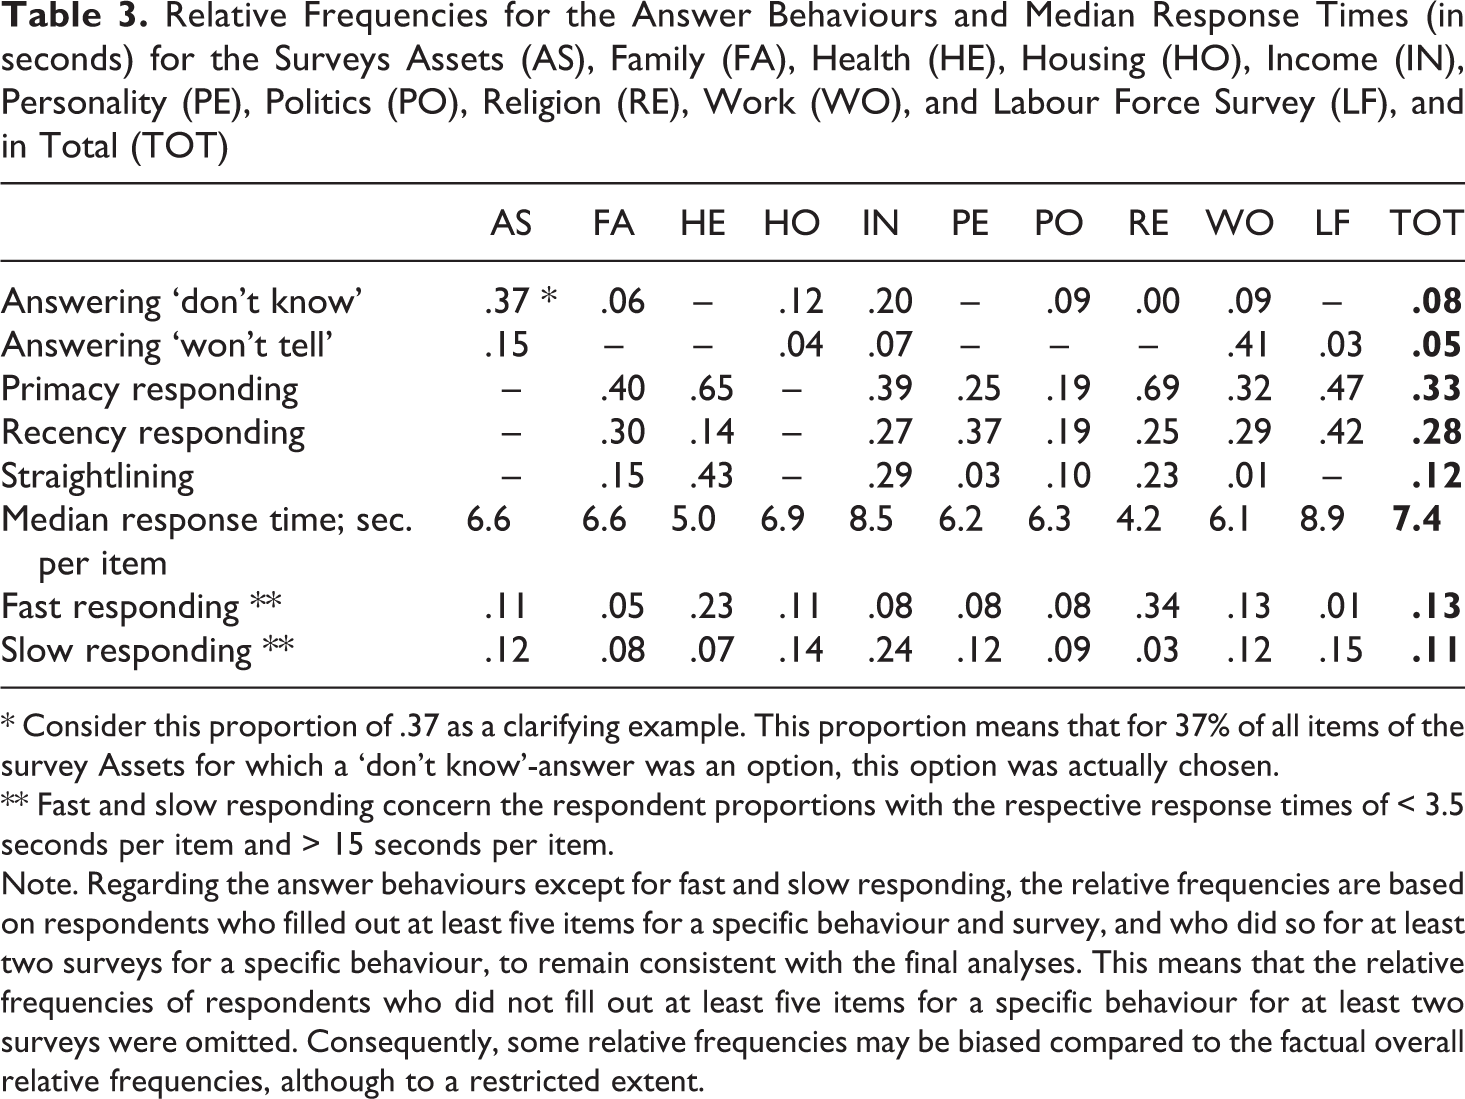
* Consider this proportion of .37 as a clarifying example. This proportion means that for 37% of all items of the survey Assets for which a ‘don’t know’-answer was an option, this option was actually chosen.
** Fast and slow responding concern the respondent proportions with the respective response times of < 3.5 seconds per item and > 15 seconds per item.
Note. Regarding the answer behaviours except for fast and slow responding, the relative frequencies are based on respondents who filled out at least five items for a specific behaviour and survey, and who did so for at least two surveys for a specific behaviour, to remain consistent with the final analyses. This means that the relative frequencies of respondents who did not fill out at least five items for a specific behaviour for at least two surveys were omitted. Consequently, some relative frequencies may be biased compared to the factual overall relative frequencies, although to a restricted extent.
Prevalence of Answer Behaviour
See Table 3. Overall, some answer behaviours were filled out more frequently than others and the relative frequencies clearly differ per survey. Answering ‘don’t know’ and ‘won’t tell’ did not occur frequently. In general, respondents had the tendency to answer ‘don’t know’ in the surveys Assets (AS) and Income (IN). These surveys may be relatively difficult to fill out. Further, it is striking that the relative frequency of answering ‘don’t know’ is almost zero in the survey Religion and Ethnicity (RE). It is not clear how this may be explained. The presence of answering ‘won’t tell’ was clear in the surveys Assets (AS) and especially Work and Schooling (WO). This seems plausible considering the sensitive topics in the former, but is less clear concerning the latter. Primacy and recency responding appeared relatively frequently overall. Straightlining occurred relatively frequently in the surveys Health (HE), Income (IN), and Religion and Ethnicity (RE).
See Table 3 for the median response time in seconds per item and for the proportions of respondents who were faster than 3.5 seconds and slower than 15 seconds per item in filling out a survey respectively. These thresholds roughly conform to the 10% and 90% quantiles of response times over all surveys and respondents. The median response time per item was relatively high for the survey Income (IN) and the Dutch Labour Force Survey (LF). This may be explained by topic complexity for the former and by relatively many difficult terms in both questions and answering categories for the latter. The survey Income (IN) stands out with a high respondent proportion of .24 that answered slower than 15 seconds per item. A low respondent proportion of .01 answered faster than 3.5 seconds per item for the Dutch Labour Force Survey (LF).
The median response time per item was relatively low for the surveys Health (HE) and Religion and Ethnicity (RE). This may be explained by a relatively good health and the non-religious nature of many respondents respectively. These may result in rapid negative responses about illness and religion respectively for many batteries of items in these surveys. High respondent proportions of .23 and .34 answered faster than 3.5 seconds per item for the surveys Health (HE) and Religion and Ethnicity (RE) respectively. A low respondent proportion of .03 answered slower than 15 seconds per item for the survey Religion and Ethnicity (RE).
Variance Components and Behaviour Consistency
In this section, we elaborate on the model variance components and respondent consistency for each behaviour. First, we compared various multilevel models to test whether variance components should be included into the model. See Appendix B for an elaboration on these models. See Table 7 in Appendix B for the results of the likelihood ratio tests (LRTs) for the model comparisons. See Table 8 in Appendix B for the variances and their profiled confidence intervals of the final models. Second, we calculated the intraclass correlation coefficients (ICCs) for the final models to present their proportions of explained variances. See Table 4. Note that the ICC for a single variance component coincides with the variance partition coefficient (VPC) -the proportion of explained variance- in multilevel models with only random intercepts (see Leckie, 2013). See Appendix B for an elaboration on calculating the ICCs. Also note that a separate multilevel model is used for the analysis of each answer behaviour. This means that for each behaviour, only those surveys that contain sufficient eligible items for that specific behaviour are included in the analysis.
Proportions of Explained Variances (ICCs) for the Answer Behaviours for the Final Models over All Surveys Together
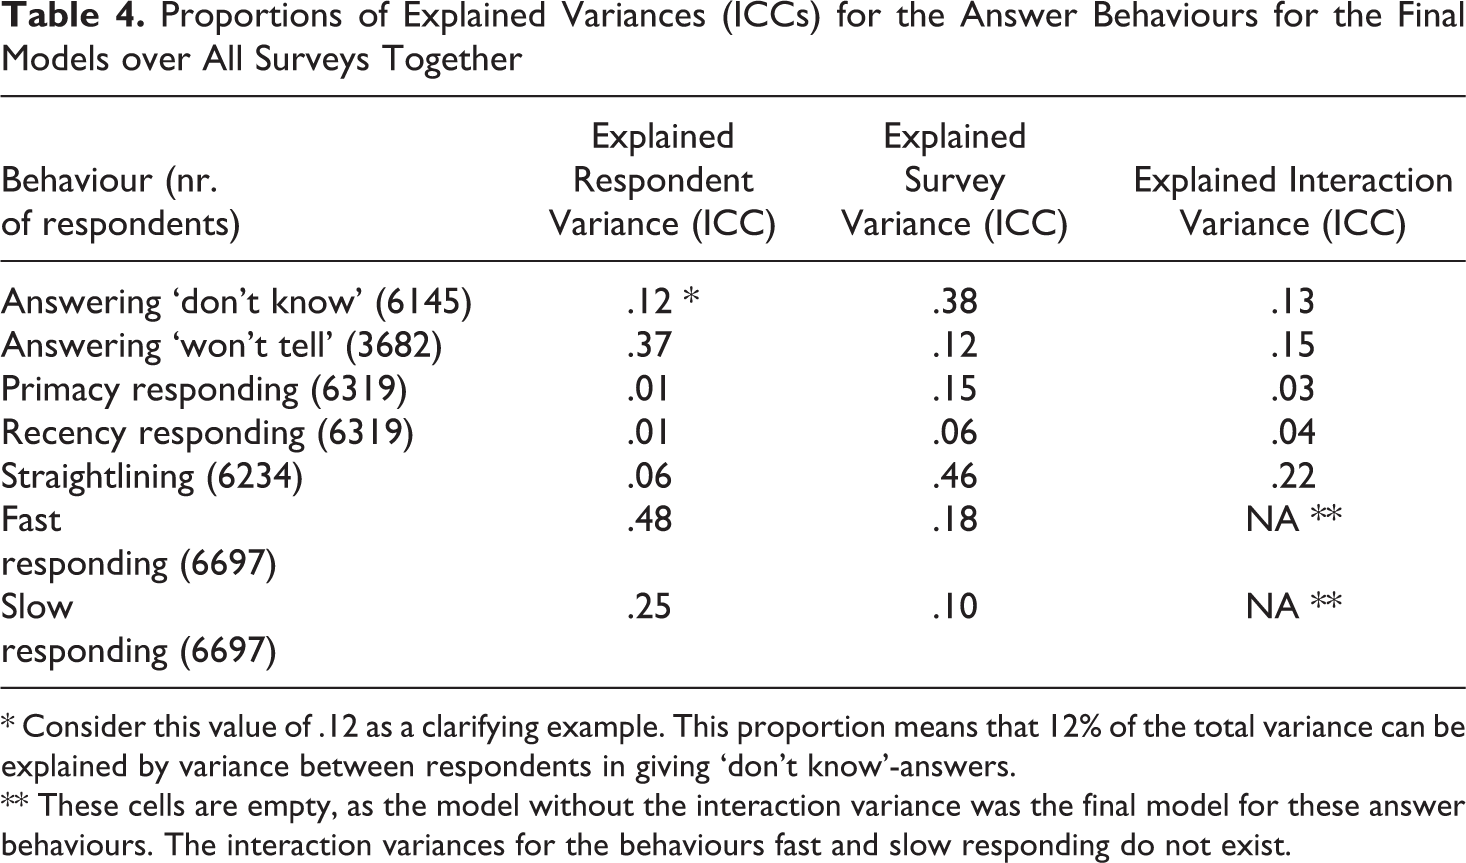
* Consider this value of .12 as a clarifying example. This proportion means that 12% of the total variance can be explained by variance between respondents in giving ‘don’t know’-answers.
** These cells are empty, as the model without the interaction variance was the final model for these answer behaviours. The interaction variances for the behaviours fast and slow responding do not exist.
Consistency of Answer Behaviour
(See Table 4). For the behaviours answering ‘don’t know’ and answering ‘won’t tell’, the respondent ICCs were relatively large. Especially for answering ‘won’t tell’, the respondent ICC was large, also clearly when compared to the relatively small interaction ICC. This means that respondents varied in their frequency of answering ‘won’t tell’ and that this variance was not particularly dependent on survey level. Therefore, it is likely that part of the respondents who answered ‘won’t tell’ relatively frequently did so over the same and multiple surveys. This indicates the presence of consistency in showing this behaviour for part of the respondents. For answering ‘don’t know’, this interpretation seems less convincing, as the interaction ICC was about as large as the respondent ICC.
For the behaviours primacy responding and recency responding, the respondent ICCs were close to zero. Therefore, it is not likely that a substantial part of the respondents showed consistency in expressing these behaviours over the surveys. For these behaviours, the combination of relatively high frequencies, a relatively small respondent variance, and a relatively large survey ICC implies that respondents roughly followed the same overall behaviour pattern per survey. This means that respondents overall tended to show the behaviour; less frequently for surveys that show a relatively lower occurrence of the behaviour, and more frequently for surveys that show a relatively higher occurrence of the behaviour. Additional evidence for this were the relatively small interaction ICCs. These imply that the survey differences in showing the behaviour were not dependent on the respondent level.
For the behaviour straightlining, the respondent ICC was a bit smaller than the survey and interaction ICC. In case of a relatively low respondent ICC in combination with an interaction ICC about equally high or higher, relatively much of the small respondent variance can be attributed to the survey level. Considering the low respondent ICC and the relatively modest occurrence, respondents who showed these behaviours did so for only a restricted number of surveys and above all for different surveys. This means that the occurrence of straightlining may be related to survey topic or difficulty and that consistency in showing the behaviour was not likely.
Concerning fast and slow responding, the interaction variances and accompanying ICCs were lacking, as we assigned each respondent only one 0 or 1 per survey. This resulted in an unidentifiable within-respondent variance. This means that the model without interaction variance was the final model for these behaviours. Here, the relatively large respondent ICCs indicate that respondents were ‘fast’ or ‘slow’ for a variable number of surveys. This means that relatively many respondents may have a stable tendency to be either fast or slow in answering survey items overall.
In summary, respondent consistency only seems evident for answering ‘won’t tell’. And to a lesser extent, respondent consistency may be indicated for fast and slow responding. For these behaviours, our expectations regarding the presence of respondent consistency across surveys were confirmed to some degree. For the behaviours answering ‘don’t know’, primacy responding, recency responding, and straightlining, these expectations were not met.
Discussion
In this study, we investigated seven typical survey answer behaviours on their occurrence and on the extent to which respondents seem to show them consistently across different and multiple surveys. For this purpose, we used data from 2074 items of ten Dutch general population surveys that broadly vary in topic. Overall, the answer behaviours ‘answering don’t know’ and ‘answering won’t tell’ occurred relatively rarely with respective frequencies of .08 and .05. The behaviours ‘primacy responding’, ‘recency responding’, and ‘straightlining’ had moderate frequencies of .33, .28, and .12 respectively. Considering the behaviours ‘fast responding’ and ‘slow responding’ overall, the surveys Health, and Religion and Ethnicity were filled out relatively rapidly. The surveys Income and the Labour Force Survey were filled out relatively slowly.
For our study, we used two-way cross-classified logistic multilevel models. By these models, we were able to investigate the amount of variance between respondents, between surveys, and in their interaction with respect to the occurrence of answer behaviour. The respondent and survey variance referred to the differences in answer behaviour between respondents and surveys respectively. The variance in their interaction referred to the degree to which the behaviour occurrence for respondents is dependent on the survey level. To detect consistent presence of answer behaviour across multiple surveys, we stated two conditions. First, the behaviour must be shown to a substantial extent at all. This means that a relatively large respondent variance would indicate that the behaviour is shown by at least part of the respondents. And second, when the behaviour is shown at all, this is done for many to all surveys. This would indicate that the behaviour is absent for part of the respondents, while consistently present across surveys for another part of the respondents. This means that we would expect an absent or small interaction variance, as the behaviour is not dependent on the survey level in this case.
Hence, we used a multilevel model to investigate the variation between respondents and the respondent-survey interaction variation in showing each answer behaviour across surveys. Our idea was to detect relatively much respondent variation in combination with relatively little interaction variation. This refers to specific respondents filling out behaviour more frequently than other respondents, doing so over the same and multiple surveys. This would indicate respondent behaviour consistency across surveys. This indicative consistency appeared for the behaviours fast responding, slow responding, and especially answering won’t tell. There was more respondent than survey variance present for fast and slow responding. For these three answer behaviours in particular, it may be useful to investigate what kind of respondent characteristics, such as age or education, could be attributed to respondents who are consistent in showing the behaviour. In case groups of consistent respondents can be linked to the same characteristics, the resulting relations could be used to control for measurement error.
It is crucial to state that the results of our study are not based on certainty but on likelihood. First, the nature of the respondent consistency is above all indicative. Relatively large respondent variation and relatively little interaction variation refer to respondents varying in their frequency of filling out the behaviour and doing so over the same and multiple surveys. It is however not straightforward for how many or what type of respondents, or for how many or which surveys this is the case. Yet, in spite of the indicative nature of the consistency and the necessity to identify types of respondents, our results disentangle the different respondent, survey, and interaction variations for each behaviour (see Table 4 in section 4).
Second, the undesirable answer behaviours are above all potential, as there is no straightforward relation between answer behaviour and measurement error. For instance, in case a respondent filled out don’t know-answers relatively frequently for a specific survey, it is unknown to what extent this behaviour may be attributed to a stable respondent tendency. The respondent either may indeed not know much about a certain topic, or was perhaps struggling with a temporary lack of motivation to answer with respect to the specific survey content. However, the potentially undesirable nature of behaviour becomes likely as the behaviour is clearly shown over multiple surveys. Hence, the same behaviour may be associated with a stable respondent tendency. This tendency to express a specific behaviour across surveys might then predominate the occurrence of different behaviours for different survey topics and designs. In summary, our research presented an informative overview on the relative frequencies for the selected surveys and resulted in insightful variations for these behaviours. This gives us suggestions about which behaviours may need further investigation. See Table 5 for a brief overview of future recommendations in response to this discussion section.
Future Recommendations for the Answer Behaviours
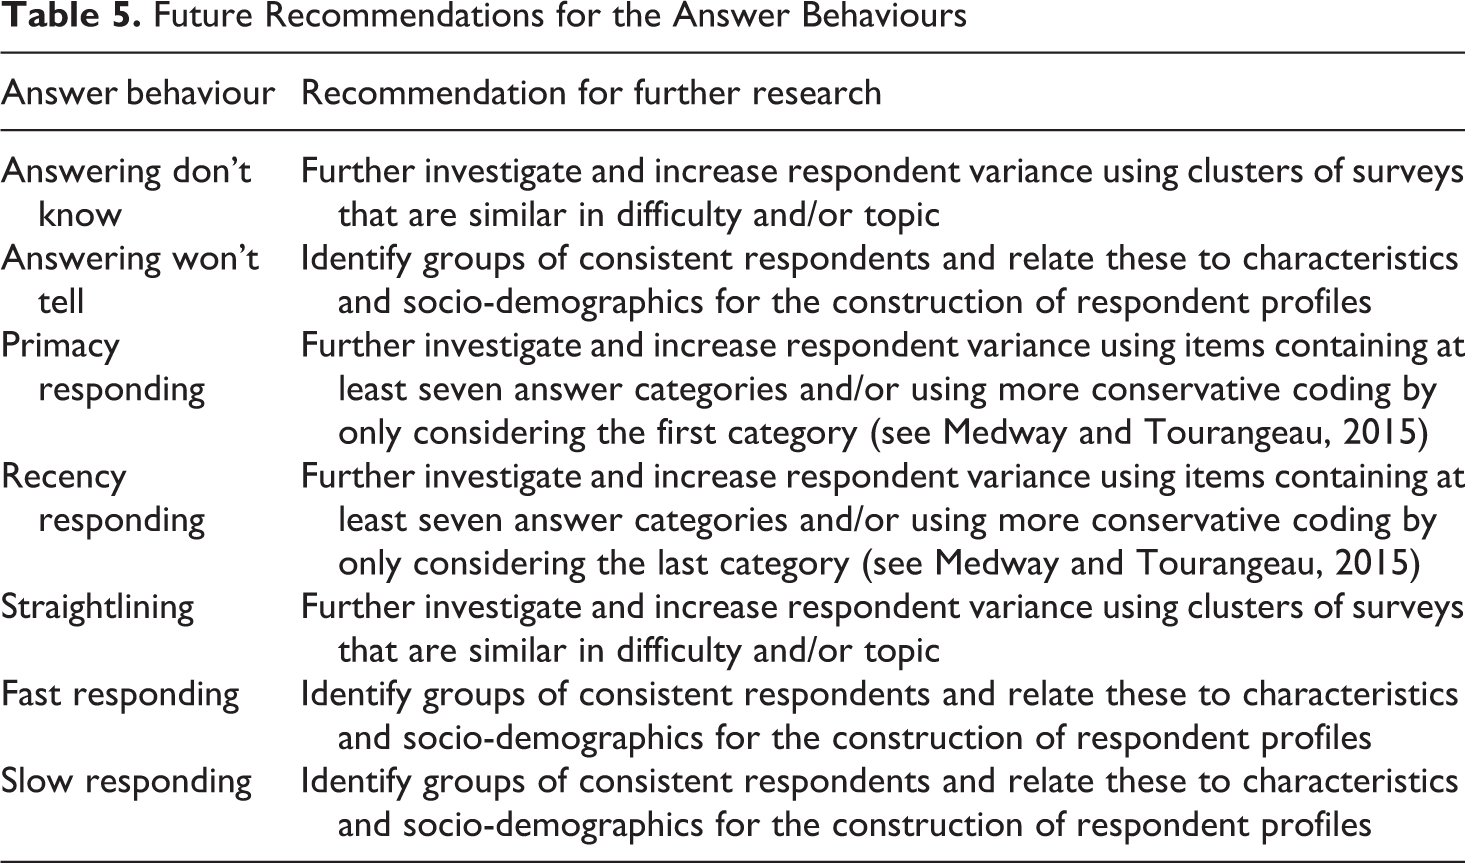
Besides the answer behaviours used in this study, it seems obvious to include clusters of behaviours in further research that logically belong together. One of the most plausible clusters would be satisficing. Satisficing may be divided into weak versus strong satisficing (Krosnick, 1991) and could be clustered by means of the behaviours used in the current study (see Roßmann (2017) for an example of such a satisficing cluster). Consider for instance the behaviours answering don’t know and straightlining, both indicators of strong satisficing (Krosnick, 1991), together as a simple example of a satisficing cluster. Some respondents might have a personal tendency either to answer ‘don’t know’ or to straightline without necessarily being ‘satisficers’, but it is also plausible that other respondents satisfice more globally. Such ‘global satisficers’ may be likely to either answer ‘don’t know’ or to straightline for any item for which one of these behaviours is possible. In this way, not only respondents who either tend to answer don’t know or straightline are distinguished, but also respondents who satisfice more generally could be detected. In other words, where respondents may not be considered a don’t know answerer or straightliner, they could be identified as a ‘strong satisficer’ taking these two behaviours together.
Future research has the challenge to investigate such potential clusters of behaviours and the behaviours for which relatively much respondent variation and relatively little interaction variation was found in the current study. It is worthwhile to try to identify respondents who show consistency for these behaviours and to attribute characteristics to potential groups of respondents showing the same behaviour pattern over surveys. Such characteristics could refer to customary variables like gender, age, and education, but also to for instance current employment status, total income, or household composition. When characteristics could be identified for groups of respondents being consistent in showing specific behaviour, respondent schemes could be constructed. These respondent schemes would consist of the specific types of respondents, the identified characteristics, and the accompanying answer behaviours that are likely to relate to measurement error because of their consistent nature. The respondent schemes may be used to immediately look into the presumable undesirability of particular answer behaviour for specific types of respondents. This idea could be extended to survey items and questionnaires as well. The item characteristics of a questionnaire can be connected to undesirable answer behaviour. A scheme for the questionnaire could be constructed for an instant overview on the relation between its items and measurement error.
Supplementary material
Supplemental Material, sj-pdf-1-bms-10.1177_0759106320939891 - Investigating Response Patterns Across Surveys: Do Respondents Show Consistency in Undesirable Answer Behaviour over Multiple Surveys?
Supplemental Material, sj-pdf-1-bms-10.1177_0759106320939891 for Investigating Response Patterns Across Surveys: Do Respondents Show Consistency in Undesirable Answer Behaviour over Multiple Surveys? by Frank Bais, Barry Schouten and Vera Toepoel in Bulletin de Méthodologie Sociologique
Footnotes
Supplementary material
The B appendix cited in this article is available on the BMS website. It can be downloaded as ‘supplementary material’ from the online version of this article.
Acknowledgements
We would like to thank Robert van de Walle for the coding of several answer behaviours and Damien Cartron for his assistance in finalizing the manuscript.
Declaration of conflicting interests
The author(s) declared no potential conflicts of interest with respect to the research, authorship, and/or publication of this article.
Funding
The author(s) received no financial support for the research, authorship, and/or publication of this article.
Appendix A
The Number of Items and Batteries per Survey, the Average Number of Items per Battery, and the Proportions of Items for which the Answer Behaviours are Applicable for the Surveys Assets (AS), Family (FA), Health (HE), Housing (HO), Income (IN), Personality (PE), Politics (PO), Religion (RE), Work (WO), and Labour Force Survey (LF), and in Total (TOT)
| AS | FA | HE | HO | IN | PE | PO | RE | WO | LF | TOT | |
|---|---|---|---|---|---|---|---|---|---|---|---|
| Nr. of items | 50 | 409 | 243 | 73 | 286 | 200 | 148 | 71 | 471 | 123 | 2074 |
| Nr. of batteries | – | 11 | 5 | – | 3 | 16 | 12 | 4 | 2 | – | 53 |
| Average nr. of items per battery | – | 5.5 | 7.6 | – | 5.7 | 11.1 | 6.0 | 5.8 | 12.0 | – | 7.8 |
| Answering ‘don’t know’ | .52 * | .08 | .01 | .33 | .47 | .02 | .45 | .49 | .11 | .01 | .18 |
| Answering ‘won’t tell’ | .28 | – | – | .30 | .31 | – | .01 | – | .04 | .81 | .12 |
| Primacy responding | – | .37 | .23 | – | .24 | .93 | .73 | .55 | .19 | .27 | .35 |
| Recency responding | – | .37 | .23 | – | .24 | .93 | .73 | .55 | .19 | .27 | .35 |
| Straightlining | – | .15 | .16 | – | .06 | .89 | .49 | .32 | .05 | – | .20 |
* Consider this proportion of .52 as a clarifying example. This proportion means that 52% of all items of the survey Assets contains a ‘don’t know’-answer as a possible response option.
Note. The behaviours fast and slow responding are not included in this table, as these behaviours are calculated on the basis of all applicable items per survey.
References
Supplementary Material
Please find the following supplemental material available below.
For Open Access articles published under a Creative Commons License, all supplemental material carries the same license as the article it is associated with.
For non-Open Access articles published, all supplemental material carries a non-exclusive license, and permission requests for re-use of supplemental material or any part of supplemental material shall be sent directly to the copyright owner as specified in the copyright notice associated with the article.