
Abstract
Circadian rhythms—self-sustained, ~24-h oscillations in transcript and protein levels—are generated by a cell-autonomous molecular clock. These rhythms shape how individual cells respond to external signals, influencing key decisions such as differentiation and apoptosis. However, current tools for visualizing circadian rhythms at the single-cell level often rely on genomic engineering and clonal expansion, limiting their accessibility and applicability. We present fluorescent circadian reporters based on the murine REVERBα/Nr1d1 gene, delivered via lentiviral transduction and compatible with time-lapse single-cell microscopy. These reporters produce oscillatory signals that depend on a functional circadian clock and can be used to determine a cell’s circadian dynamics parameters, such as circadian phase. Their simple and efficient delivery should make them suitable for a wide variety of cell types, greatly expanding opportunities to study single-cell circadian dynamics and their impact across diverse biological processes and systems.
Keywords
The environment of most organisms is shaped by the recurring changes in sunlight intensity between day and night. In response, the majority of species have evolved timekeeping mechanisms—circadian clocks—that drive rhythmic physiology, metabolism, and behavior, enabling them to anticipate and adapt to these cycles. These circadian rhythms are self-sustained and persist in the absence of external cues. Circadian oscillations are evident at the organismal (e.g., sleep-wake cycles; hormone secretion, de Assis and Kramer, 2024; immune activity, Scheiermann et al., 2013) and tissue level (e.g., rhythmic hepatic enzyme expression, Bolshette et al., 2023). However, these rhythms originate from a molecular oscillator present in nearly every cell. Tissue- and organ-level rhythms emerge through paracrine and endocrine communication among these individual cellular clocks (Abraham et al., 2010; Finger et al., 2021). At the core of this oscillator is a transcriptional-translational feedback loop (TTFL). The BMAL1/CLOCK transcription factor dimer activates expression of core clock and clock-controlled genes, including those encoding PERIOD (PER1-3) and CRYPTOCHROME (CRY1-2) proteins. PERs and CRYs inhibit BMAL1/CLOCK, thereby repressing their own transcription until they degrade, allowing the cycle to restart (Finger and Kramer, 2021). Another clock-controlled factor, REVERBα (encoded by Nr1d1), feeds back into the loop by rhythmically repressing Bmal1 transcription (Preitner et al., 2002).
Studying circadian rhythms at the single-cell level—where they originate—offers deeper insights into the circadian network hierarchy and enables detection of phase-dependent variations in cellular responses, such as time-of-day sensitivity to drugs, toxins, or chemotherapeutics (Mihelakis et al., 2022; Ector et al., 2024). While many studies have relied on synchronized cell populations (Brown et al., 2008), relating the response of each single cell to its own internal clock allows for higher temporal precision with less experimental complexity, as cells in various phases can be analyzed within the same sample (Manella et al., 2021; Gabriel et al., 2024). However, tools for such single-cell circadian studies remain limited. Most approaches require longitudinal measurement of a reporter signal in individual cells. Early studies measured circadian oscillations of luciferase reporters in individual fibroblasts (e.g., Welsh et al., 2004; Liu et al., 2007). However, detecting luciferase activity at the single-cell level requires specialized equipment to overcome low resolution. Refining this approach using fluorescent circadian reporters in time-lapse microscopy enables a high-resolution, high-throughput parallel detection of multiple fluorescence proteins, and, therefore, a broader range of applications.
In fluorescence microscopy, a common method involves genetically engineering cells or animals to express oscillating proteins such as PERs or CRYs as fluorescent fusions (Gabriel et al., 2021; Smyllie et al., 2025), but this requires intensive genetic manipulation and clonal expansion. An alternative strategy employs a reporter plasmid driven by the rhythmically expressed Nr1d1 locus, leading to oscillatory REVERBα-based fluorescence in transfected cells (Nagoshi et al., 2004). Despite offering insights into how the clock governs cell growth and differentiation (Zhang et al., 2022; Gutu et al., 2025), the use of this approach is constrained by the large plasmid size (~18 kb), which reduces transfection efficiency and necessitates clonal selection. Consequently, only a few reporter cell lines based on this construct have been established over the past 2 decades.
To overcome these limitations, we generated fluorescent reporters of circadian rhythms that can be delivered by lentiviral transduction. They are based on the REVERBα reporter and allow the generation of reporter cells within a few days. The reporter signal oscillates in a circadian clock dependent manner and can be used to determine circadian dynamics parameters such as circadian phase and period at the single-cell level.
Results
Construction of a Lentiviral Fluorescent Circadian Reporter
To record circadian rhythms from single cells without the need for clonal isolation, we designed a lentiviral circadian fluorescence reporter plasmid based on the well-established REVERBα-Venus reporter (hereafter referred to as the “full-length reporter”). This reporter was generated by Nagoshi et al. (2004) 2 decades ago. The reporter construct consists of the entire Nr1d1/REVERBα gene locus, spanning the region from approximately 6 kb upstream of the transcription start site (TSS) to 3.6 kb downstream of the last of 8 exons, with a destabilized nuclear Venus protein (Venus-NLS-PEST) expression cassette replacing a region of exon 2-5 (Figure 1a, yellow box), giving the construct a total size of approximately 18 kb.
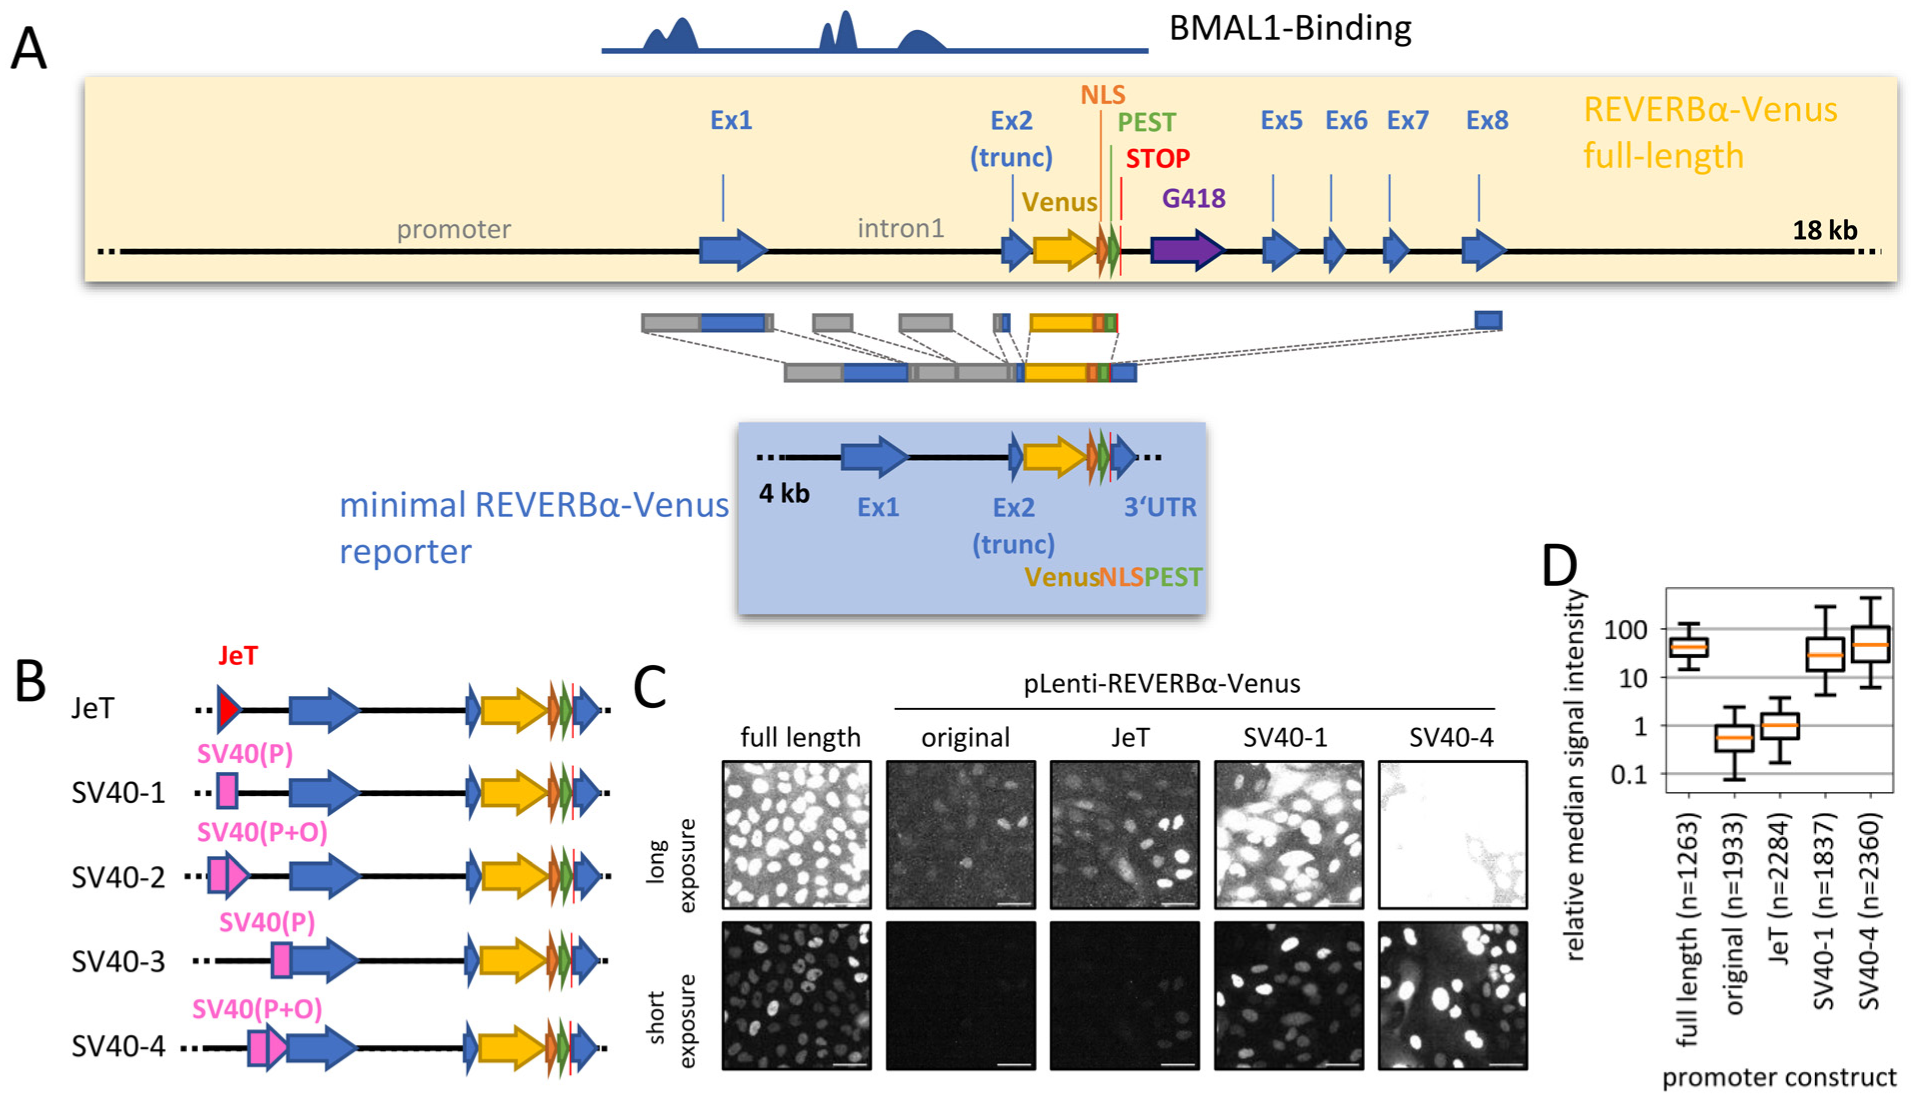
Construction of lentiviral fluorescent REVERBα reporters. (a) Schematic representation of the minimal REVERBα-Venus reporter (lower part) and the full-length REVERBα-Venus construct (upper part) as previously described (Nagoshi et al., 2004). BMAL1 binding regions are indicated based on data from Koike et al. (2012). (b) Brighter reporter variants were generated by introducing either the synthetic JeT promoter, the SV40 minimal early promoter (P), or a combination of promoter and SV40 origin (P + O), positioned either proximal or distal to the REVERBα promoter. (c) Representative Venus fluorescence in U-2 OS cells either stably transfected with full-length REVERBα-Venus construct or transduced with the indicated lentiviral reporter variants. Short exposure: 200 µs, long exposure: 800 µs. Scale bar: 50 µm. (d) Background-subtracted median reporter fluorescence intensities per single-cell time series (68 h), normalized to median of JeT-construct. n = number of cells. Data representative of 2 experiments, whiskers = 5%-95%.
To fit into a lentiviral plasmid, we reduced the regulatory part of the reporter to the regions reported to be bound by BMAL1 (Chip-seq data from Koike et al. (2012)), that is, 600 bp of the proximal promoter and 2 regions within the first exon. Furthermore, we retained the sequence of the 3′-untranslated region (UTR), as these regions often contain sequences that regulate expression. Together with the Venus-NLS-PEST, this resulted in a reporter of ~4 kb that fits a lentiviral backbone (Figure 1a, blue box). The complete reporter sequence was synthesized and sub-cloned into a lentiviral expression plasmid containing a puromycin resistance cassette. The resulting ~11 kb plasmid is within the upper size range usually regarded suitable for effective lentiviral packaging (Park, 2007).
When we transduced this minimal lentiviral reporter into U-2 OS cells (an osteosarcoma and circadian model cell line), we observed fluorescence signals in the nuclei of the cells. This indicates that the Venus-NLS-PEST sequence is produced from the truncated reporter. However, the Venus signals were very close to the background level and approximately 50-100 times lower than those observed in a U-2 OS clone that stably expresses the full-length reporter (Figure 1c). This suggests that the lentiviral reporter lacks regions from the Nr1d1-locus that, although not bound by BMAL1, play a role in regulating REVERBα expression levels.
We wondered whether we could enhance the expression of the reporter to facilitate detection and to enhance robustness against technical noise. To this end, we added either the synthetic JeT promoter (Tornoe et al., 2002) or parts of the SV40 early promoter (the SV40 minimal early promoter alone or in combination with the SV40 ori) either proximal or distal to the Nr1d1 promoter region (Figure 1b). The addition of the JeT promoter resulted in a ~2-fold increase in signal (Figure 1c), whereas the addition of SV40 promoter (partial or total sequence) led to an additional 30- to 50-fold increase (Figure 1c and 1d and Suppl. Fig. S1). Interestingly, the fluorescence intensity of individual cells fluctuated substantially over the course of days (Suppl. Video SV1), suggesting that reporter expression is still subject to circadian regulation despite the increase caused by the constitutive promoters.
Reporter Signals Are Shaped by the Circadian Clock
Next, we aimed to establish whether these fluctuations are in fact caused by circadian regulation, that is, whether they depend on an intact circadian clock. To this end, we introduced the lentiviral reporters into wild-type (WT) U-2 OS cells as well as cells in which the circadian oscillator is disrupted by knocking out both CRYPTOCHROME proteins CRY1 and CRY2 (Bording et al., 2019). When we sorted the reporter signal time series from hundreds of single WT cells by their maximum (see Suppl. Fig. S2 for methodology and Suppl. Fig. S3 for examples of single-cell traces), oscillatory patterns emerged (Figure 2a), which show up as reoccurring diagonal bands in the heatmaps of single-cell time series (Figure 2a), or as oscillations of the average signals when the timescale of each timeseries was set relative to the timepoint of maximal signal (Figure 2b). In contrast, introducing the same reporters into CRY-deficient cells resulted in the absence of recurring diagonal bands, indicating a lack of oscillatory patterns at both the single-cell and population levels; the remaining single diagonal line simply reflects sorting of the normalized traces by their time of maximum value (Figure 2c and 2d). This demonstrates that the observed signal oscillations primarily depend on a functional circadian clock, suggesting that the reporters’ signals are driven by the core circadian mechanism. This is further supported by the finding that peaks of WT, but not of knock-out cells—signals temporally aligned after a pulse of dexamethasone—a strong Zeitgeber that can synchronize circadian oscillations in cell populations in vitro (Suppl. Fig. S4). Furthermore, the observed oscillatory patterns do not arise solely from cell division, as they persist in data from non-dividing cells (Suppl. Fig. S5). Nonetheless, we observed some association between cell division and reporter signal with respect to peak timing and signal intensity (Suppl. Fig. S6), which was most pronounced for the full-length reporter and weakest for the JeT-containing reporter.
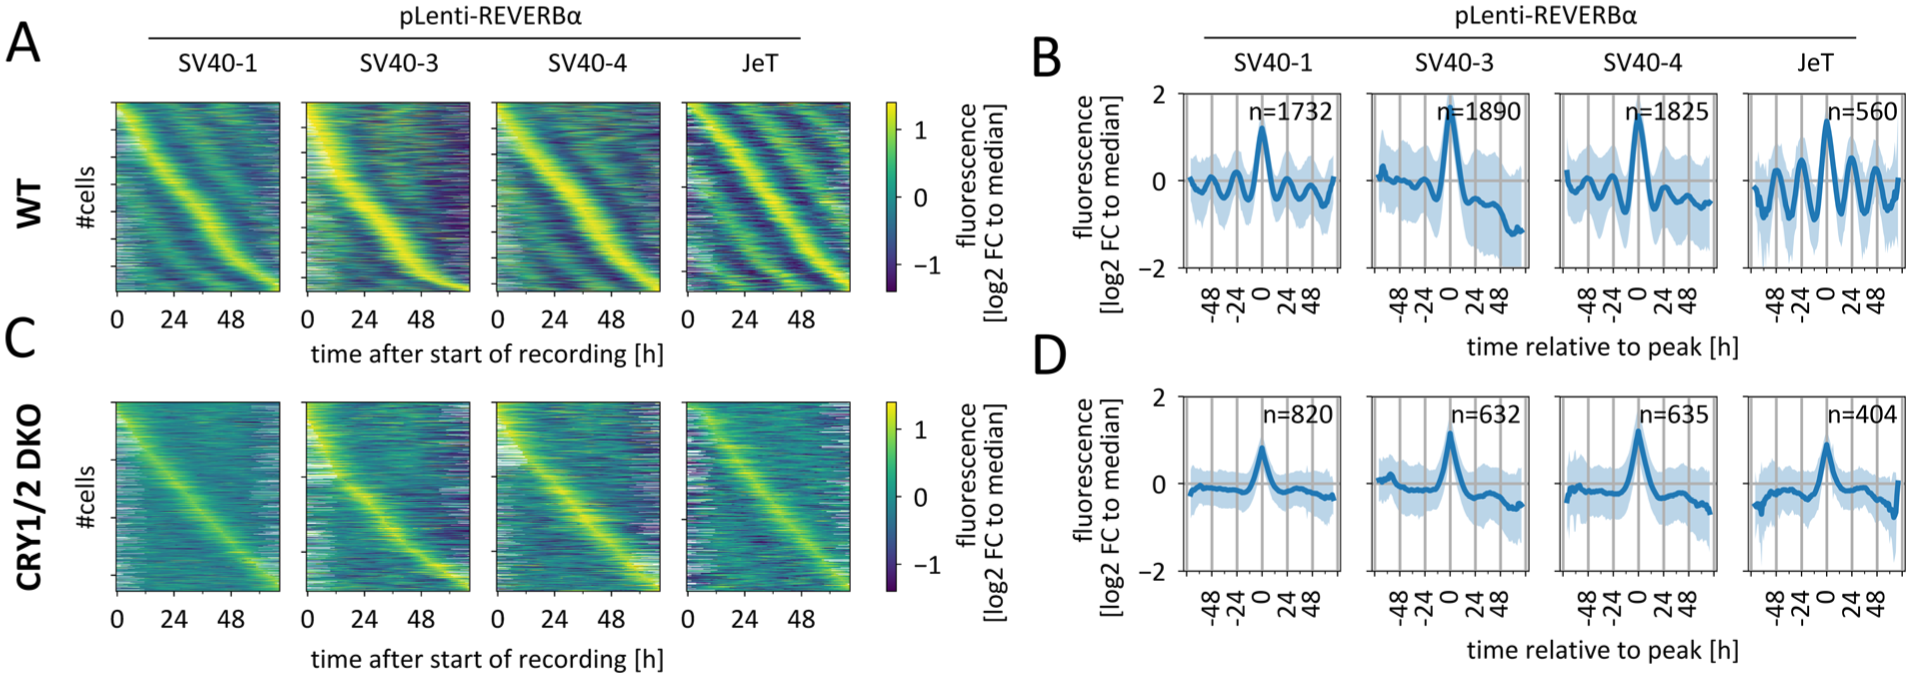
Reporter oscillations depend on a functional circadian clock. (a) Heat maps showing normalized fluorescent signal oscillation from the indicated pLenti-REVERBα circadian reporters in individual unsynchronized wild-type cells. Time series were normalized to their respective median signal and filtered for the 50% most rhythmic time series of each population. Traces are sorted by the timepoint of maximal signal. Y-axis ticks indicate every 250th cells. (b) Mean ± SD of data from (a) with timepoint of maximal signal for each time series set to 0. n = number of time series from a single experiment. (c) Heat maps showing normalized fluorescent signal oscillation as in (a) from CRY1/2 double knock-out cells. (d) Mean ± SD of data from (c) with timepoint of maximal signal for each time series set to 0. For (b) and (d), data is composed from overlapping 3-day time series. For more details, see Suppl. Fig. S2.
Determination of Circadian Parameters in Single Cells
To evaluate the ability of the lentiviral reporters to accurately report circadian rhythms in individual cells, we compared their expression dynamics with those of the full-length reporter and with the circadian proteins CRY2 and PER1 within the same cells. To this end, we replaced the Venus protein in the lentiviral reporters with the red fluorescent protein mScarlet-I3 and transduced them into (1) a clone that expresses the full-length reporter coupled to Venus and (2) knock-in cells that express yellow fluorescent PER1-mClover3 or CRY2-mClover3 fusion proteins from the endogenous locus (the cell lines were generated with the strategy described in Gabriel et al. (2024), see Method section for details). We recorded fluorescence in both channels over the course of 3 days and extracted nuclear fluorescence time series for each cell (examples shown in Figure 3a-3f). Sorting the time series by peak expression time again revealed oscillatory patterns (Figure 3g), that were remarkably similar to those of the full-length REVERBα reporter (Figure 3h) and the knock-in fusion proteins (Figure 3i).
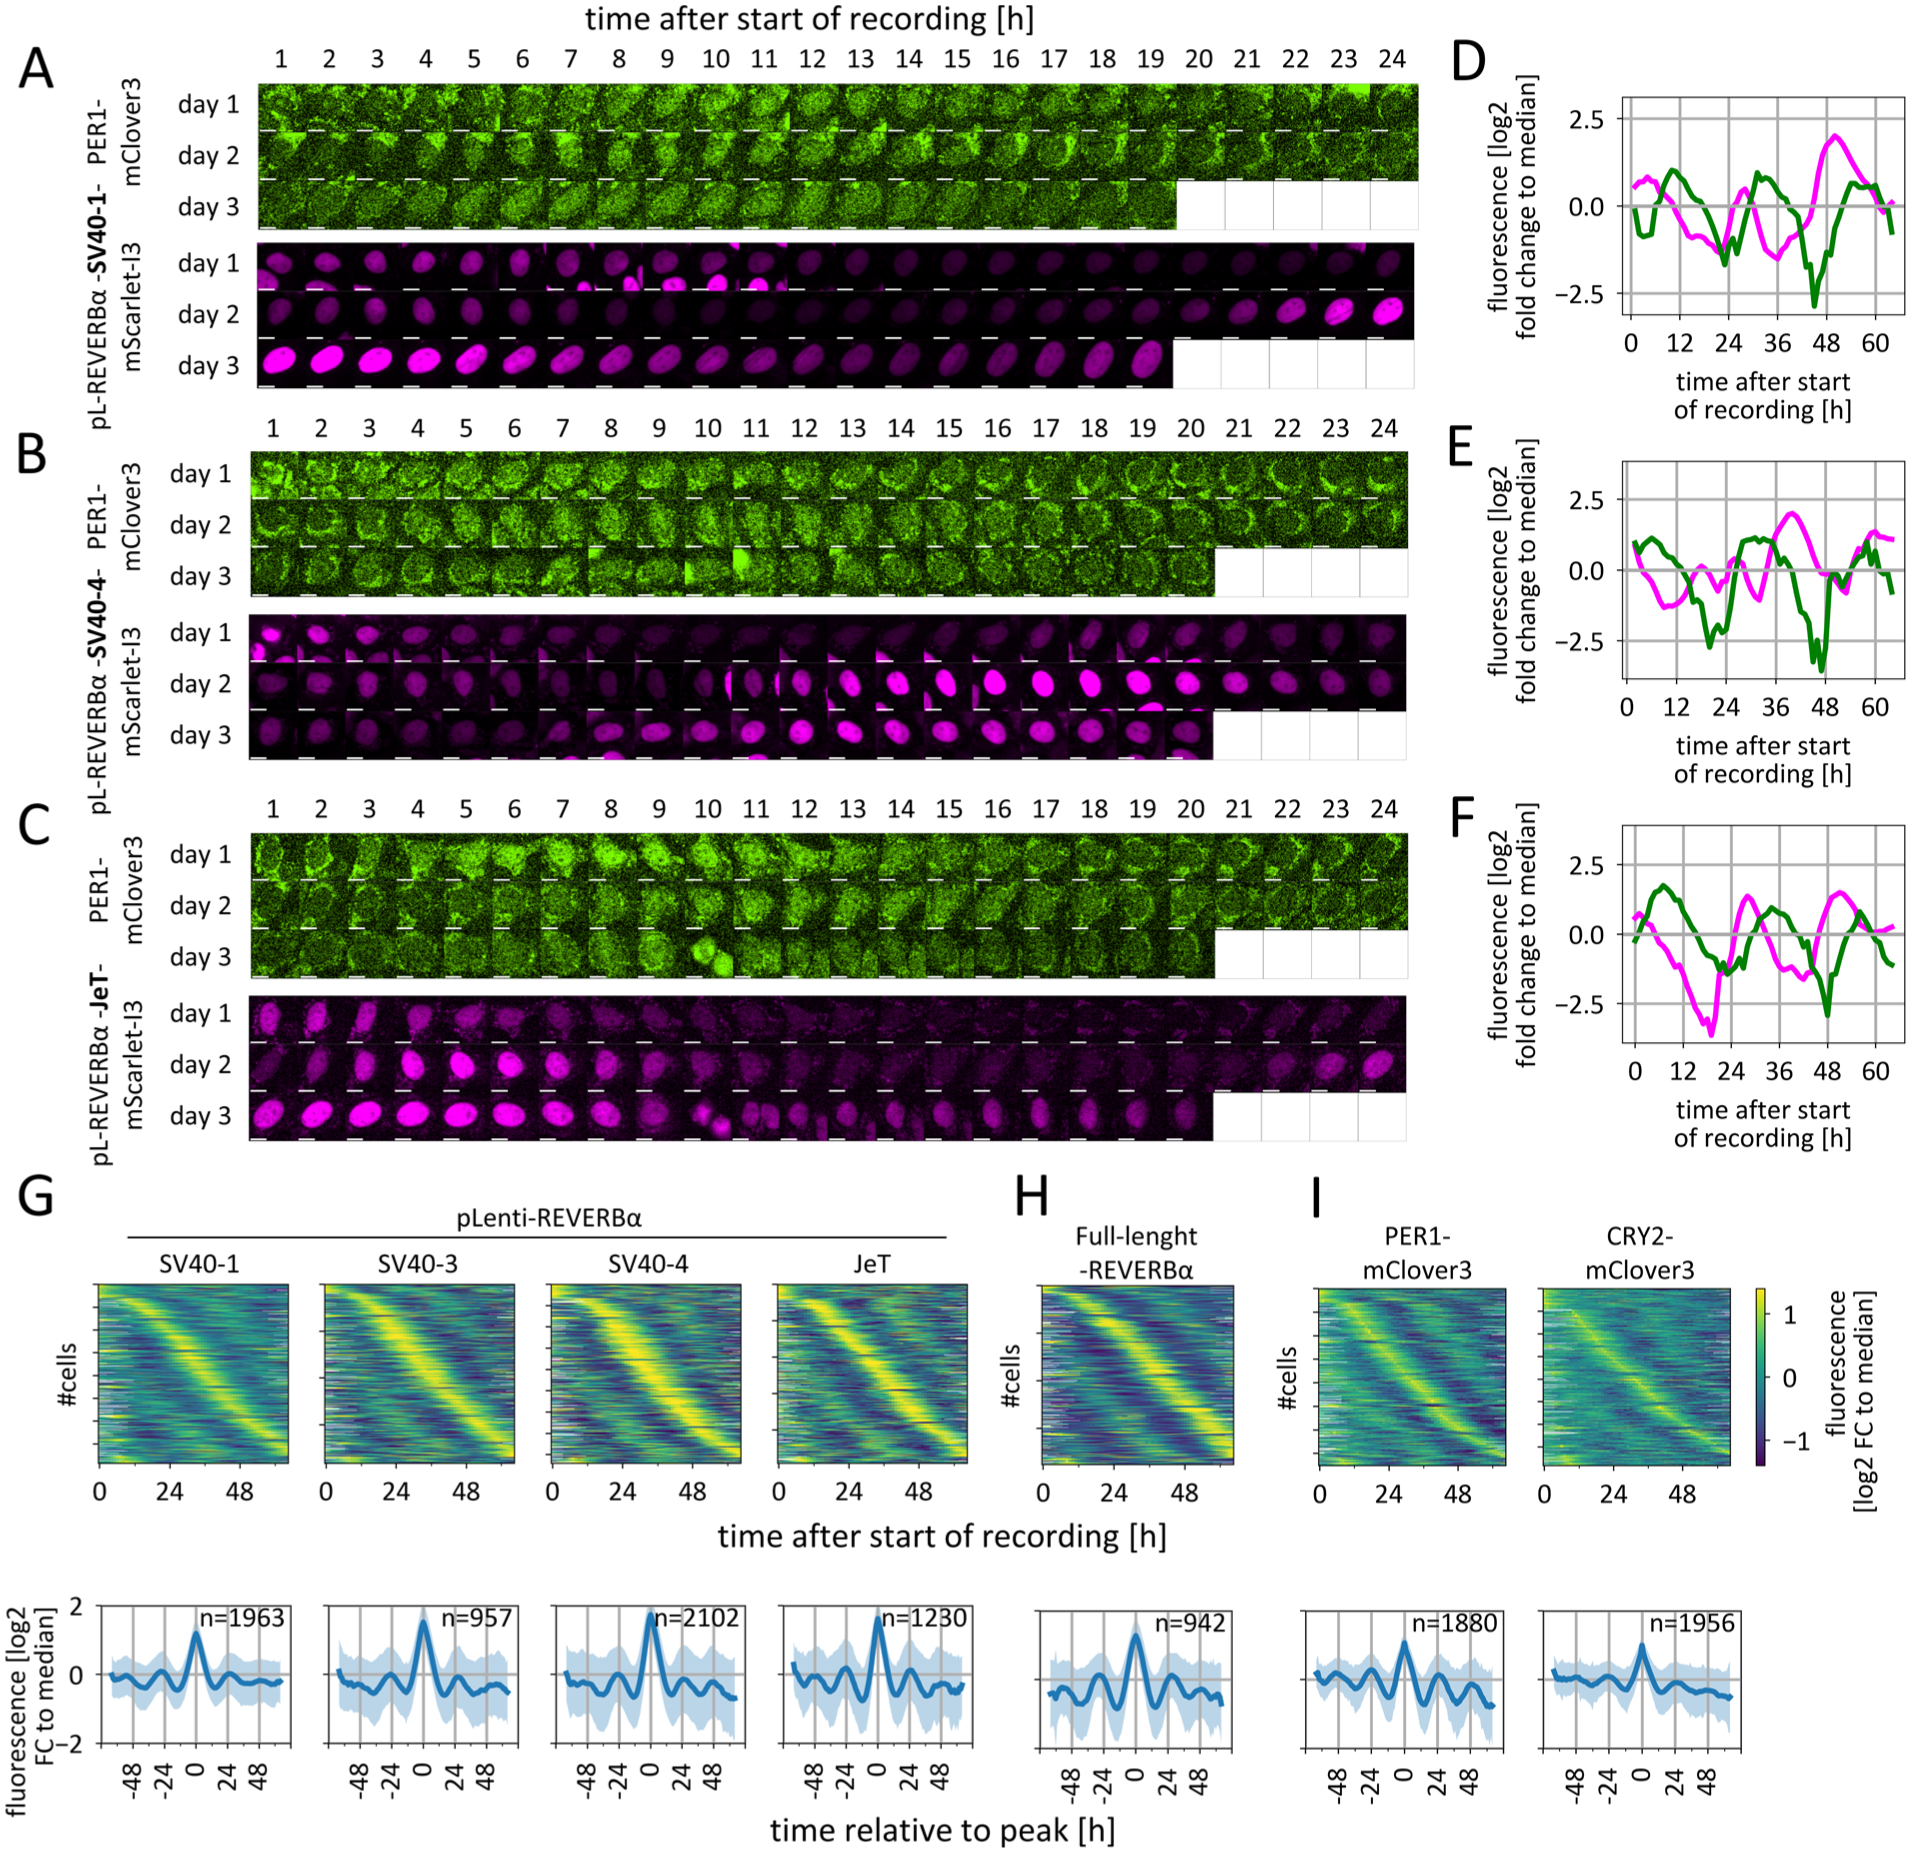
Generation of cells with 2 circadian fluorescence reporters. (a, b, c) Dual-color time-lapse recordings of nuclear fluorescence in single cells (background subtracted). Green: PER1-mClover3 fusion protein. Magenta: pLenti-REVERBα-mScarlet-I3 with SV40-1 (A), SV40-4 (B), or JeT (C) promoter. Scale bar: 10 µm. (d, e, f) Mean fluorescence signals from single-cell nuclei shown in (A, B, C), plotted as log2 fold change relative to the median of each time series. (g, h, i) Heat maps of normalized single-cell fluorescence time series (upper panels) and mean ± SD of population data with timepoint of maximal signal for each time series set to 0 (lower panels) from the indicated pLenti-REVERBα circadian reporters (g), the full-length REVERBα-Venus reporter (h), and CRY2- or PER1-mClover3 fusion proteins in unsynchronized dual-reporter single cells (i). All time series were filtered to retain the 50% most rhythmic time series within each group and sorted by time of maximal signal. Y-axis ticks of heat maps indicate every 250th cells, n = number of time series from a single experiment. For lower panels, data is composed from overlapping 3-day time series. For more details, see Suppl. Fig. S2. Furthermore, the data shown in panels g–i are derived from populations containing different reporters in the second fluorescence channel; for analyses separated by reporter, see Suppl. Fig. S7.
We analyzed single-cell time series using wavelet analysis (Schmal et al., 2022), extracting circadian period, amplitude, average wavelet power (which serves as a measure of rhythmicity), and phase at 36 h after the start of the recording. Since the analysis of noisy single-cell circadian oscillations is not yet standardized, we compared these results with those obtained from Cosinor analysis of the same data and observed strong correlations for rhythmicity, period, amplitude, and phase (Suppl. Fig. S8). This concordance indicates that both methods are equally suitable for analyzing this type of single-cell circadian time series.
We then compared phase, amplitude, and period of the most rhythmic time series (average wavelet power >7 for both reporter types, Suppl. Table S1).
While the circadian periods measured using SV40 promoter–containing reporters correlated significantly with those derived from the full-length construct (Spearman correlation coefficient: 0.35-0.53), correlations with PER1- or CRY2-mClover periods were weak to negligible (correlation coefficients: 0.05-0.29) (Figure 4a). Conversely, the JeT promoter–containing construct showed stronger correlation with PER1 than with the full-length REVERBα reporter (Figure 4a).
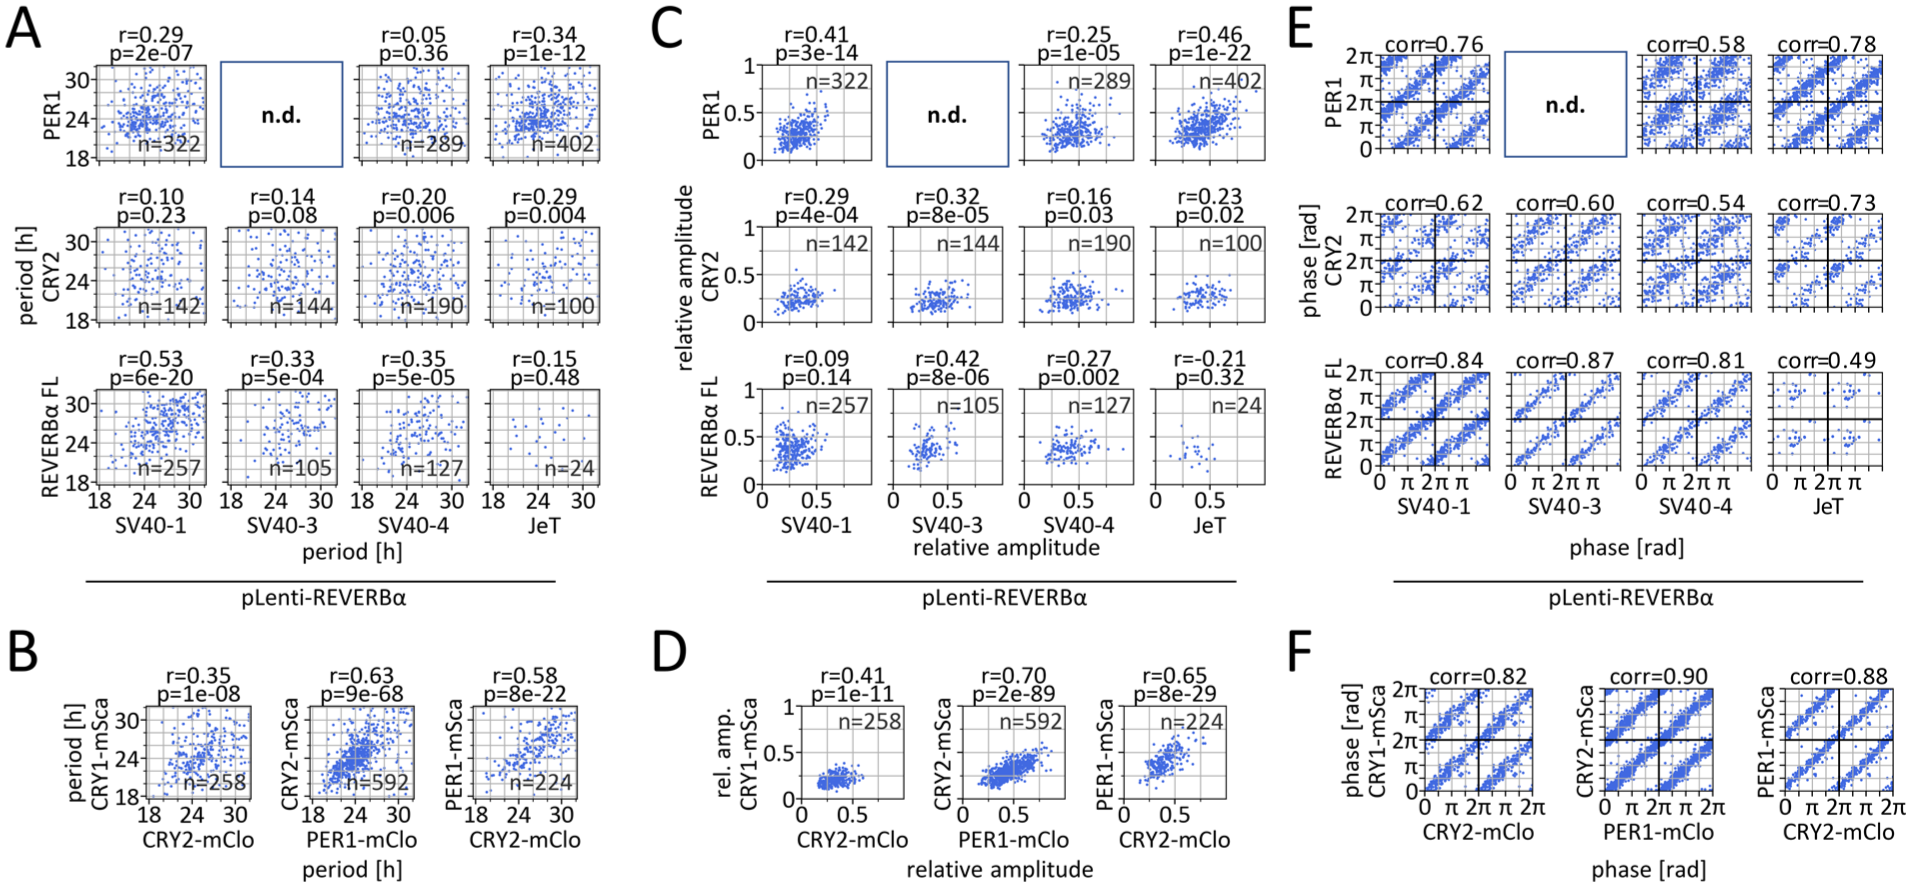
Correlation of circadian dynamics parameters between different reporters in single cells. (a, b) Correlation of circadian periods, (c, d) relative amplitudes, and (e, f) circadian phases (36 h after recording onset), calculated from time series of the 2 indicated circadian fluorescent reporters expressed in the same single cells. Phase is determined in rad as with cosine waves (0/2π = peak, π = trough). Only cells exhibiting rhythmic signals in both reporters were included in the analysis. Phases are double-plotted along both axes. p, r: Spearman correlation, corr: circular moment of phase differences, FL: full-length REVERBα–Venus reporter.
In general, the relative amplitudes of the lentiviral reporters align more closely with those of the fluorescence-tagged repressors than with the full-length reporters. Notably, the correlations of periods and amplitudes between SV40-1 or JeT-containing reporters and the PER1 protein reporter were not significantly different from those observed for periods and amplitudes of CRY1 and CRY2 proteins in double knock-in cells, respectively (p = 0.38-0.96, Fisher Z-test; Suppl. Table S2). In contrast, correlations between PER1 and CRY2 in double knock-in cells were significantly stronger (p < 0.001, Fisher Z-test, Figure 4b and 4d and Suppl. Table S2). Phases derived from the SV40 promoter–containing reporters more closely matched those of the full-length reporter, whereas the JeT-driven variant showed greater similarity with the endogenous fusion proteins (Figure 4e). In particular, the JeT and SV40-1 variants showed notable phase correlations with the endogenous proteins (Figure 4e and 4f). Correlation analysis led to highly similar results when performed on parameters obtained by Cosinor analysis (Suppl. Fig. S9).
Taken together, the lentiviral REVERBα reporters are suitable to accurately determine circadian dynamics parameters such as circadian phase and, to a lesser extent, circadian period and amplitude in individual cells. Among the constructs tested, the lower-expressing JeT-driven reporter outperformed those driven by SV40 promoters.
Discussion
Here, we report on the creation of a lentiviral fluorescent reporter of circadian rhythms, based on the murine Nr1d1/REVERBα gene. The choice of lentiviral delivery ensured high and stable transduction efficiencies, as well as a high capacity for DNA integration, which was useful for the integration of the minimal Nr1d1 reporter in combination with different constitutive promoters.
While retaining primarily BMAL1 bound sites was sufficient to allow for regulation by the circadian clock machinery, the expression levels of the minimal reporter were significantly lower than those of the full-length reporter that includes a much larger proportion of the genomic locus. Adding constitutive promoters enhanced the reporter signal without overriding it. As shown in Figure 2, oscillations are clearly present in the WT cells but not in knock-out cells, demonstrating that these oscillations are primarily governed by the circadian clock rather than the constitutive promoters.
Surprisingly, the correlation of periods derived from different reporters was relatively low, even in double knock-in cells expressing 2 tagged clock proteins. However, it is unlikely that, for example, CRY1 and CRY2 oscillate with significantly different periods in the same cell. Rather, day-to-day period variability and/or transcriptional noise likely introduce uncertainty in period calculation, producing the apparent divergence. When analyzing comparatively short time series (2-3 days) differences in 1 or 2 measurement values may greatly affect the calculated period.
However, the JeT- and SV40-1-containing reporters proved particularly effective in estimating circadian phases at the single-cell level. This is demonstrated by the high correlation with phases derived directly from circadian core clock proteins (CRY2 and PER1), with the level of agreement almost reaching that of 2 core clock proteins (Figure 4). Accurate phase determination in individual cells allows researchers to determine whether a cell’s response to a stimulus depends on its circadian phase. This could help identify, for example, the most efficient times for chemotherapeutics (Ector et al., 2024), or optimal windows for cell differentiation (Zhang et al., 2022).
The ease with which the lentiviral REVERBα reporters can be delivered should enable visualization of single-cell circadian rhythms in a broad range of cell types using a simple protocol, as clonal selection is not required. This also extends to primary cells, thus enabling screening for circadian phase-dependent drug or toxin effects in complex, physiologically relevant cell culture systems. We hope that our lentiviral circadian reporters will open up the field of single-cell circadian rhythms and their significance to a wide range of research questions and applications.
Methods
Cells
U-2 OS (RRID:CVCL_0042, human, female, ATCC HTB-96) cells were cultured in Dulbecco’s Modified Eagle Medium (DMEM) supplemented with 10% fetal bovine serum (FBS) (Life; lot 2453915), 25 mM HEPES, and penicillin/streptomycin at 37 °C and 5% CO2. The U-2 OS CRY1/2 double knock-out cells were described before (Bording et al., 2019). U-2 OS cells stably expressing an NR1D1::VNP fusion protein were provided by Michael Brunner (University of Heidelberg). A single subclone was used for experiments. To allow automated detection of nuclei, all clones were transduced to express a histone-2B-iRFP720 fusion protein, which results in nuclear expression of the infrared protein miRFP720 (RRID:Addgene_128961), and cells were sorted for high expression by fluorescence-activated cell sorting (FACS).
Generation of Knock-in Cells
The generation and validation of single and double circadian reporter U-2 OS knock-in cells using CRISPR has been described in detail in Gabriel et al. (2021, 2024). In brief, cells are transfected by electroporation with 3 plasmids containing (1) Cas9 and sgRNA targeting CRY2 or PER1 downstream of the stop codon (RRID:Addgene_189989, RRID:Addgene_189987), (2) a template for homology-directed repair (HDR) that will result in a fluorophore (mClover3) integrated C-terminally (RRID:Addgene_189979, RRID:Addgene_189983), and (3) an inhibitor of non-homologous end-joining to enhance HDR (pCAG-i53 bp, a gift from Ralf Kuhn and derived from RRID:Addgene_74939). After positive selection, negative selection, and CRE-mediated removal of selection cassettes, CFP- and CD4-negative sorted cells were clonally expanded and screened for fluorescent clones. Knock-in specificity is controlled by polymerase chain reaction (PCR) and by using shRNA targeting either PER1 or CRY2, and intactness of the circadian clock is tested by analysis of signals from a transduced mBmal1-promoter-driven luciferase reporter (Maier et al., 2009). For this study, CRY2-mClover3 and PER1-mClover3 single knock-in cells were generated from WT U-2 OS cells, CRY1-mScarlet-I/CRY2-mClover3 cells from CRY1-mScarlet-I single knock-in cells (described in Gabriel et al. (2021)), PER1-mScarlet-I/CRY2-mClover3 from PER1-mScarlet-I clone #1, and CRY2-mScarlet-I/PER1-mClover3 from CRY2-mScarlet-I clone #1 single knock-in cells (both described in the work by Gabriel et al. (2024)).
Construction of the Lentiviral REVERBα Reporters
The basic version of pLenti6-puromycin-mREVERBα-Venus-NLS-Pest (pL6-RAV-ori) was synthesized by VectorBuilder. The reporter sequence was based on the mREVERBα-Venus reporter plasmid published by (Nagoshi et al., 2004) and the murine Nr1d1 gene (NC_000077.7, chromosome 11, complement strand (position 98657636 to 98667353). It included the following parts: 633 bp upstream of the TSS (98666866 to 98666234), exon-1 (98666233 to 98665544), intron-1 (bp 1-24, 528-971, 1480-2051; 98665543 to 98665520, 98665013 to 98664571, 98664061 to 98663491), exon-2 (bp 14-138; 98662974 to 98662827) coupled to Venus—SV40-nuclear localization signal (NLS) with destabilization domain from ornithine decarboxylase, and the 3′UTR (last 288 bp of exon 8; 98659045 to 98658758).
The JeT promoter sequence (Tornoe et al., 2002) was synthesized (MWG Eurofins) with flanking restriction sites for KpnI and EcoRI. The SV40 promoter or minimal promoter sequence was amplified from a lentiviral expression plasmid using primers creating overhangs for restriction enzymes. The promoters were inserted either into the EcoRV site ~500 bp upstream of the TSS or the KpnI site ~70 bp downstream of the TSS by restriction enzyme cloning and sequences verified by Sanger sequencing. Promoter sequences are listed in Suppl. Table S3.
The fluorophores mScarlet-I3, mClover3, SYFP2, miRFP713 Electra2 were amplified from Addgene plasmids #197230, #189763, #179479, and #179441 and used to replace the Venus protein by restriction enzyme cloning using XbaI and MluI. All plasmid and the corresponding sequences can be obtained from Addgene (RRID:Addgene_240105-240118).
Lentivirus Production
HEK293T cells were transiently transfected in a T75 flask with 8.6 μg lentiviral expression plasmid, 6 μg psPAX2, and 3.6 μg pMD2G (gift from Trono lab, RRID:Addgene_12259 and RRID:Addgene_12260) packaging plasmid using the CalPhos Mammalian Transfection Kit (Takara). The next day, culture medium was replaced with 12.5 mL of DMEM medium, and lentiviral supernatant was collected after 24 and 48 h. The combined supernatant was passed through a 0.45-μm filter (Filtropur S 0.45) and either used directly or stored in aliquots at −80 °C. For transduction, cells were seeded into lentivirus-containing supernatant supplemented with 8 μg/mL protamine sulfate. The next day, lentivirus-containing supernatant was aspirated and cells were cultured in complete culture medium for another 24 h before antibiotic selection of transduced cells, which required 2-5 days.
Live-cell Fluorescence Microscopy
For microscopy, cells were seeded on glass bottom #1.5H-N 96-well plates (Cellvis, USA) coated with 50 µg/mL human serum fibronectin (Merck, Germany). Cells were left untreated or synchronized with 100 nM dexamethasone 3 h prior to recording for 20 min, washed with and supplemented with fresh medium. Image acquisition was done in FluoroBrite medium (Gibco, Thermo Fisher Scientific, USA) supplemented with 2% FBS, 1:100 PenStrep, and 1× GlutaMax at 37 °C and 5% CO2. Imaging was performed on a Nikon Widefield Ti2 equipped with a pco.edge 4.2 USB sCMOS camera (Excelitas pco, Germany) and an incubator with environmental control (Okolab Bold Line, Italy). Illumination was provided by a SpectraX LED system (Lumencor, USA) on the following microscope presets: The following light sources (LEDs) and emission filters and settings were usually used for the different channels: GFP (mClover3, Venus), excitation 475/28 nm, 57 mW, 50% intensity, 200 ms (Figures 1d, 3, 4a, and 4c), emission 519/26 nm; YFP (mClover3, Venus): excitation 511/16 nm, 12.3 mW, 25% intensity, 100 ms (Figure 2)/50% intensity, 800 ms (Figure 1c), 30% intensity, 1 s (Figure 4b and 4d), emission 540/30 nm; RFP (mScarlet-I, mScarlet-I3) excitation 555/28 nm, 145 mW, 40% intensity (Figure 2)/50% intensity, 100 ms (Figures 1d, 3, 4a, and 4c)/50% intensity, 800 ms (Figure 4a and 4c: JeT-REVERBα-FL)/12% intensity, 2 s (Figure 4b and 4d), emission 642/80 nm; iRFP: excitation: 625/22 nm, 38.9 mW, 100% intensity, 200 ms, emission 697/50 nm. The used dichroic mirrors for presets “GFP,” “RFP,” “iRFP” were a quad dichroic mirror ET435/33, 526/20, 595/38, 695/63 and for “YFP” a quad dichroic mirror ET475/25, 537/30, 644/92, 806/100. Objectives: 20x Plan Apo, NA 0.75, WD 1000 µm (Nikon, Japan) (Figure 2), 40x Plan Apo, NA 0.95, WD 250 μm (Nikon, Japan) (Figures 1, 3, and 4). Time-lapse images were acquired with a 1-h interval for up to 3 days.
Single-cell Tracking
Cell tracking was performed automatically by the help of ImageJ-Fiji (Schneider et al., 2012) and the TrackMate plugin. Two macros were used for preprocessing and for segmentation/tracking, respectively.
Preprocessing: For uneven illumination correction, 100 images from buffer only wells were used to generate relative illumination patterns for each channel, and every image was corrected for non-uniform illumination by dividing pixel by pixel by the previously generated patterns. The background of the illumination-corrected RFP and YFP images was determined as the modal value of a gaussian filter (size = 50) smoothened image and subtracted.
Segmentation/Tracking: The TrackMate plugin of Fiji was used for segmentation and tracking of nuclei (Ershov et al., 2022). The iRFP channel was used for segmentation of nuclei in each image using the StarDist module (Schmidt et al., 2018), and objects were filtered by size (min = 3 µm). Subsequently, objects were tracked using the LAP algorithm (maximal range = 30 µm, no gaps allowed). Finally, the mean fluorescence intensity for each tracked nucleus for each timepoint was extracted from all channels. After cell division, tracking continued with one daughter cell, while the other daughter cell was considered a newly emerging object.
For quality control of tracking, we used a Python Script as described in the work by Gabriel et al. (2024) and available from GitHub that sorts out most mis-segmented cells and tracking errors. Fluorescence intensities at cell division and subsequent timepoints were linearly extrapolated from neighboring timepoints, because detachment of dividing cells produced fluorescence artifacts. Visual inspection of a set of 50 tracks confirmed correct segmentation and tracking for 48 of these tracks.
Data Analysis
RFP-channel fluorescence values were compensated for Venus bleed-through into the RFP channel in REVERBα-FL expressing cells (Figures 3 and 4). Signals whose median fluorescence signal did not surpass that of 99% of non-fluorescent cells were filtered out.
We used the python based pyBOAT toolkit (Schmal et al., 2022) to analyze rhythmicity in single-cell time series by wavelet analysis. We allowed periods to fall between 18 and 32 h, detrended raw data using sinc_detrend (T_c = 50), calculated ridge_data with power_threshold = 0 and smoothing_wsize = 4, and extracted instantaneous phases at indicated timepoints. Ridge data was cropped by disregarding values from the first and last 9 present timepoints before calculating average wavelet power as the mean of the maximal power of the ridge, (average) period as the median of instantaneous period, and (average) absolute amplitude as the mean of instantaneous amplitudes from the remaining timepoints. Relative amplitudes were calculated by dividing absolute amplitudes by mean expression intensity. We defined time series as rhythmic if average wavelet power of a 3-day time series surpasses 7, based on analysis of negative control datasets (autofluorescence and tracking marker intensity time series).
Cosinor analysis was performed using the CosinorPy package (https://www.doi.org/10.1186/s12859-020-03830-w). For each time series, 141 cosine models with periods ranging from 18.0 to 32.0 h were fitted, and the best-fitting model was selected based on the residual sum of squares (RSS). Time series with a q-value < 0.000144 were classified as rhythmic, corresponding in stringency to an average wavelet power > 7.0 (Suppl. Fig. S8). Relative amplitudes were calculated by dividing the fitted amplitude by the median of the time series, and phases at specific time points were derived from the acrophase and period of the fitted model.
We excluded time series that were considered rhythmic, but whose calculated period exactly matched the input limits (18-32 h), as these were most likely to contain oscillations longer or shorter than these limits. For data from dexamethasone-treated cells, the first 18 h of recording were omitted for wavelet analysis.
Correlation analysis was done for data from those cells which had rhythmic signals from both reporters. For correlation of phase data, we calculated phase differences of the 2 reporters for each cell at a single timepoint and calculated the circular moment of the phase differences using the circmoment method of the python module astropy.stats.circstats (Price-Whelan et al., 2018). This tests whether the 2 reporters have a defined phase relation, considering that they can be phase-shifted. Period and amplitude correlations were tested by Spearman correlation. All plots were generated using the pandas, scikit-image, and matplotlib python libraries.
Supplemental Material
sj-pdf-1-jbr-10.1177_07487304261431992 – Supplemental material for A Lentiviral Fluorescent Reporter to Study Circadian Rhythms in Single Cells
Supplemental material, sj-pdf-1-jbr-10.1177_07487304261431992 for A Lentiviral Fluorescent Reporter to Study Circadian Rhythms in Single Cells by Christian H. Gabriel, Luis Lehmann, Joana Ahlburg and Achim Kramer in Journal of Biological Rhythms
Supplemental Material
sj-zip-2-jbr-10.1177_07487304261431992 – Supplemental material for A Lentiviral Fluorescent Reporter to Study Circadian Rhythms in Single Cells
Supplemental material, sj-zip-2-jbr-10.1177_07487304261431992 for A Lentiviral Fluorescent Reporter to Study Circadian Rhythms in Single Cells by Christian H. Gabriel, Luis Lehmann, Joana Ahlburg and Achim Kramer in Journal of Biological Rhythms
Footnotes
Acknowledgements
We thank Michael Brunner and Emi Nagoshi for providing material. We acknowledge the support of the FCCF at the German Rheumatism Research Center. We also thank the Advanced Medical Bioimaging Core Facility (AMBIO) of the Charité for assistance with the acquisition of imaging data. This work was funded by the German Research Foundation (DFG)—project numbers 278001972 and 541063275—TRR 186 and TRR 418.
Author Contributions
C.H.G. and A.K. conceived the project. C.H.G. designed and performed experiments with assistance from L.L. and J.A. C.H.G. developed image analysis pipelines and performed quantitative data analysis. A.K. supervised the study and secured funding. C.H.G. wrote the manuscript with input from all authors. All authors reviewed and approved the final version of the manuscript.
Conflict of Interest Statement
A.K. is a member of the Editorial Board of the Journal of Biological Rhythms. The author did not take part in the peer review or decision-making process for this submission and has no further conflicts to declare.
AI
Artificial intelligence was used to enhance language and readability of the text (DeepL Translator). The text was checked by the authors for correctness afterward.
Data and Material Availability
Fluorescence time series data to reproduce the figures are provided in Supplementary Tables S4 and S5. Fluorescent measurements were performed at hourly intervals. Imaging raw data is available from the authors upon request. All plasmids are available from Addgene (Plasmids 240105-240118). All code is available at ![]() ).
).
Notes
References
Supplementary Material
Please find the following supplemental material available below.
For Open Access articles published under a Creative Commons License, all supplemental material carries the same license as the article it is associated with.
For non-Open Access articles published, all supplemental material carries a non-exclusive license, and permission requests for re-use of supplemental material or any part of supplemental material shall be sent directly to the copyright owner as specified in the copyright notice associated with the article.