
Abstract
Circadian (24 h) rhythmicity is a nearly-ubiquitous property of eukaryotic cells, and the mechanisms that generate this rhythmicity have been studied in a number of organisms for many years. However, there are still gaps in our understanding of the generation and regulation of rhythms. Although transcription/translation feedback loops (TTFLs) are said to be essential to generating rhythmicity in eukaryotes, there are many examples of rhythmicity seen in organisms without functioning TTFLs. Our lab previously found that two genes that function in the TOR (Target of Rapamycin) pathway, vta and gtr2, are essential for non-TTFL rhythmicity in the fungus Neurospora crassa. These two mutants were also shown to dampen the output rhythm of spore-formation (conidiation) and the rhythm of the TTFL component protein FRQ, and dampen the amplitude of the underlying oscillator in strains with functioning TTFLs. Therefore, we are interested in the role of TOR in generating and/or sustaining rhythmicity in both the presence and absence of a functioning TTFL. Here we report the development and validation of an improved assay for TOR activity in Neurospora, and using this assay we demonstrate that TOR activity displays circadian rhythmicity in strains with functioning TTFLs. The period of TOR rhythmicity is affected by a long-period mutation in a TTFL component (frq7), and the TOR rhythm is dampened in the vta and gtr2 knockouts. The mean level of TOR activity (mesor) in the vta and gtr2 knockout mutants is within the range of the TOR rhythm in wild type, indicating that it is rhythmicity of TOR, not a constant level of activity, that is required to sustain output rhythmicity. These results establish Neurospora as a valuable model for investigating the role of TOR in circadian rhythmicity and implicate TOR activity as a rhythmic state variable of the circadian system.
Molecular mechanisms of circadian (24 h) rhythmicity have been intensively investigated for many decades (Pittendrigh, 1960), but there are still fundamental questions left unanswered in the quest to describe a complete circadian system in a eukaryote. Most research focusses on describing transcription-translation feedback loops (TTFLs) that are said to be the basis for molecular rhythmicity in almost all organisms. In its most basic “canonical” form, as studied in Drosophila and mammals (Patke et al., 2020), a TTFL consists of a “clock gene” that is transcribed and translated, and its protein product then negatively feeds back on its own expression by inhibiting the activity of a protein complex that activates its transcription. Additional interlocked transcriptional loops may be added to the models to further regulate clock gene expression. Posttranslational modifications of the TTFL proteins are increasingly a focus of attention as mechanisms for generating the kinetics of the loops (Brenna and Albrecht, 2020; Srikanta and Cermakian, 2021).
In the fungus Neurospora crassa, the canonical TTFL model is centered on the frq (frequency) gene and its regulation by the white-collar transcription complex (WCC) (Bell-Pedersen, 2000; Lakin-Thomas et al., 2011; Baker et al., 2012). Although Neurospora strains carrying null alleles of the frq gene appear arrhythmic under some conditions, rhythms in the absence of FRQ function can be seen under various growth conditions or in various mutant backgrounds (Lakin-Thomas, 2006b; Lakin-Thomas et al., 2011). These FRQ-less rhythms must be driven by one or more FRQ-less oscillators (FLOs) (Iwasaki and Dunlap, 2000). Our lab is focused on identifying the FLO(s) driving FRQ-less rhythmicity in Neurospora.
In our search for components of the FLO, we identified mutations that disrupt FRQ-less rhythmicity in strains carrying frq knockout alleles. In an unbiased mutagenesis screen (Li et al., 2011), we identified the vta gene (formerly uv90) as essential for the FLO, and we then reported that knockout of a binding partner of the VTA protein, GTR2, has a very similar phenotype to the vta knockout (Eskandari et al., 2021). Both of these mutations also affect rhythmicity in frq-sufficient strains. The rhythms of amount and phosphorylation of the FRQ protein are severely damped in both the vta and gtr2 knockout strains, indicating that the VTA and GTR2 gene products are required to maintain normal rhythmicity of the FRQ protein (Li et al., 2011; Eskandari et al., 2021). The most conspicuous output of the Neurospora circadian clock, the rhythm of conidiation (asexual spore formation), is also severely damped in both mutants and the residual rhythms display small but statistically significant changes in the period length (Li et al., 2011; Eskandari et al., 2021). Critically, this damping of the conidiation rhythm is not simply an effect on an output pathway: In a vta mutant strain, the altered response of the conidiation rhythm to phase resetting by both light and heat stimuli indicated that the mutation decreases the amplitude of the underlying oscillator (Li et al., 2011).
The VTA and GTR2 proteins are components of the TOR (Target of Rapamycin) pathway (Ratnayake et al., 2018; Eskandari et al., 2021), an essential signaling pathway in eukaryotes that responds to nutritional and stress signals to regulate growth and stress responses. The TOR pathway is well characterized in yeast and mammals (González and Hall, 2017; Saxton and Sabatini, 2017) but has not been studied in detail in Neurospora. The TOR Ser/Thr protein kinase is found in two protein complexes, TORC1 and TORC2, in association with several other proteins that regulate TOR activity. TORC1 phosphorylates substrates that activate anabolic processes such as ribosome biogenesis and protein translation and inhibit catabolic processes such as autophagy. TORC2 function has diverged in different organisms, and may control plasma membrane processes and stress responses. TORC1 is activated by stimuli for growth and survival, including insulin and growth factors in mammals and nutritional signals, particularly amino acids, in both mammals and yeast. In Neurospora, we identified the VTA gene product as homologous to EGO1 in yeast and LAMTOR1 in mammals, which are components of membrane complexes that anchor activated TORC1 to the vacuolar/lysosomal membrane (Ratnayake et al., 2018). We identified GTR2 as a binding partner of VTA and a homolog of Gtr2 in yeast and RAG C/D in mammals, which are Rag GTPases that form complexes with EGO/LAMTOR at the vacuolar/lysosomal membrane and activate TORC1 in response to amino acid sufficiency (Eskandari et al., 2021). Knockouts of either vta or gtr2 are deficient in growth response to added amino acids, indicating that the amino acid sensing functions of the EGO/LAMTOR and Rag GTPase complexes are conserved in Neurospora (Ratnayake et al., 2018; Eskandari et al., 2021).
The TOR pathway has been implicated in circadian rhythmicity in several organisms (Lakin-Thomas, 2023). For example, inhibition or activation of TOR can affect the period of rhythms in Drosophila (Zheng and Sehgal, 2010), Arabidopsis (Zhang et al., 2019) and mammalian U2OS cells (Feeney et al., 2016). Cao and associates have demonstrated TOR effects on rhythms in the mammalian SCN (the central brain clock), and on clock gene expression in isolated mammalian hepatocytes and fibroblasts (Cao, 2018). These reports, and our identification of vta and gtr2 as clock-affecting genes, motivated us to explore the role that the TOR pathway may play in supporting or generating circadian rhythmicity in Neurospora. The work reported here focusses on TOR in the context of a functioning FRQ-based TTFL.
In this paper we report the development of a novel assay for TOR activity in Neurospora, and we use this assay to demonstrate rhythmic TOR activity in strains with functional frq genes. This circadian rhythm of TOR activation is tightly correlated with the observed clock output of rhythmic spore formation. The TOR rhythm is modulated by both the canonical TTFL (as shown by the effects of a long-period frq mutation) and by components of the TOR-associated nutritional sensing mechanism (VTA and GTR2). Crucially, mutations in the TOR pathway damp out rhythmic TOR activity as well as the output rhythms, implicating TOR rhythmicity as essential for the circadian oscillator. The TOR pathway appears to be situated as both an input to, and an output from, the circadian system in Neurospora, and fulfills several criteria for a state variable of the circadian system.
Methods
Strains
Construction of FLAG-Tagged S6 Protein
The FLAG epitope tag was inserted at the C-terminus of the endogenous S6 gene according to the knock-in methods of Honda and Selker (2009) using recombination mediated plasmid construction in S. cerevisiae and the Neurospora transformation methods of Colot et al. (2006). The S6 gene was identified in the fungiDB database as “40S ribosomal protein S6,” crp-14, NCU08502. Plasmids pRS426 (shuttle vector) and p3xFLAG::hph::loxP (FLAG module), S. cerevisiae strain FY834, and N. crassa strain Δmus51:: bar; his-3 were obtained from the Fungal Genetics Stock Center. PCR primers (Table 2) were designed to amplify a 1132 bp sequence at the 3’ end of the ORF (without the stop codon), with a 5’ overlap of 29 nt homologous to the pRS426 shuttle vector and a 29 nt 3’ overlap with the 5’ end of the 10XGly-FLAG cassette. A second PCR product was designed with 766 bp of the 3’ flanking sequence of the S6 gene with a 5’ 29 nt overlap homologous to the 3’ end of the FLAG cassette and a 3’ 29 nt overlap with pRS426. The two PCR products, the linearized pRS426 and the linearized FLAG cassette were transformed into yeast to create the final plasmid by homologous recombination. The resulting pS6::FLAG::hph::loxP plasmid was amplified in E. coli and used as a PCR template to amplify the knock-in cassette for transformation into the N. crassa strain Δmus51:: bar+; his-3. Transformed conidia were selected by hygromycin resistance and verified heterokaryons were crossed to a N. crassa strain carrying csp-1; chol-1 rasbd to remove bar+ and his-3 and introduce the S6-FLAG knock-in allele into our standard laboratory genetic background.
Strains
The vtako (Ratnayake et al., 2018) and gtr2ko strains (Eskandari et al., 2021), the prd-1 strain (Li and Lakin-Thomas, 2010) and the frq7 strain (Lakin-Thomas, 1998) were previously described. The tagged S6-FLAG allele was introduced into our laboratory strains by standard crossing methods. All strains utilized in this paper carry the rasbd, csp-1 and chol-1 mutations. “Wild type” indicates a csp-1; chol-1 rasbd strain with no additional mutations, with or without S6-FLAG as indicated. The rasbd mutation (Belden et al., 2007) makes conidiation resistant to the repressing effect of carbon dioxide, allowing the development of rhythmic conidiation bands in closed cultures such as race tubes. The CSP-1 gene product is a transcriptional repressor (Sancar et al., 2015); the csp-1 mutation is used in our lab for convenience to prevent conidial separation, reducing self-contamination of cultures. Strains carrying the chol-1 mutation require choline for normal growth and rhythmicity (Lakin-Thomas, 1996); all culture media in this paper contain a sufficient concentration of choline to repair the defect in chol-1 strains. The chol-1 mutation is maintained in our strains to provide a standard genetic background for experiments in which these strains may be compared to FRQ-less strains under low choline conditions where the FRQ-less rhythm is assayed (Lakin-Thomas and Brody, 2000).
Growth Media and Culture Methods
Growth Media
All fungal growth media contained 1X Vogel’s salts (minimal medium) and 100 µM choline. Liquid medium used in method development and validation (Figure 1) contained 2% glucose. This medium was chosen to provide a high level of TOR activation in order to display all phosphorylated forms of S6 during method development. Solid agar medium used in race tubes and plates (MA, maltose-arginine medium) contained 0.5% maltose, 0.01%
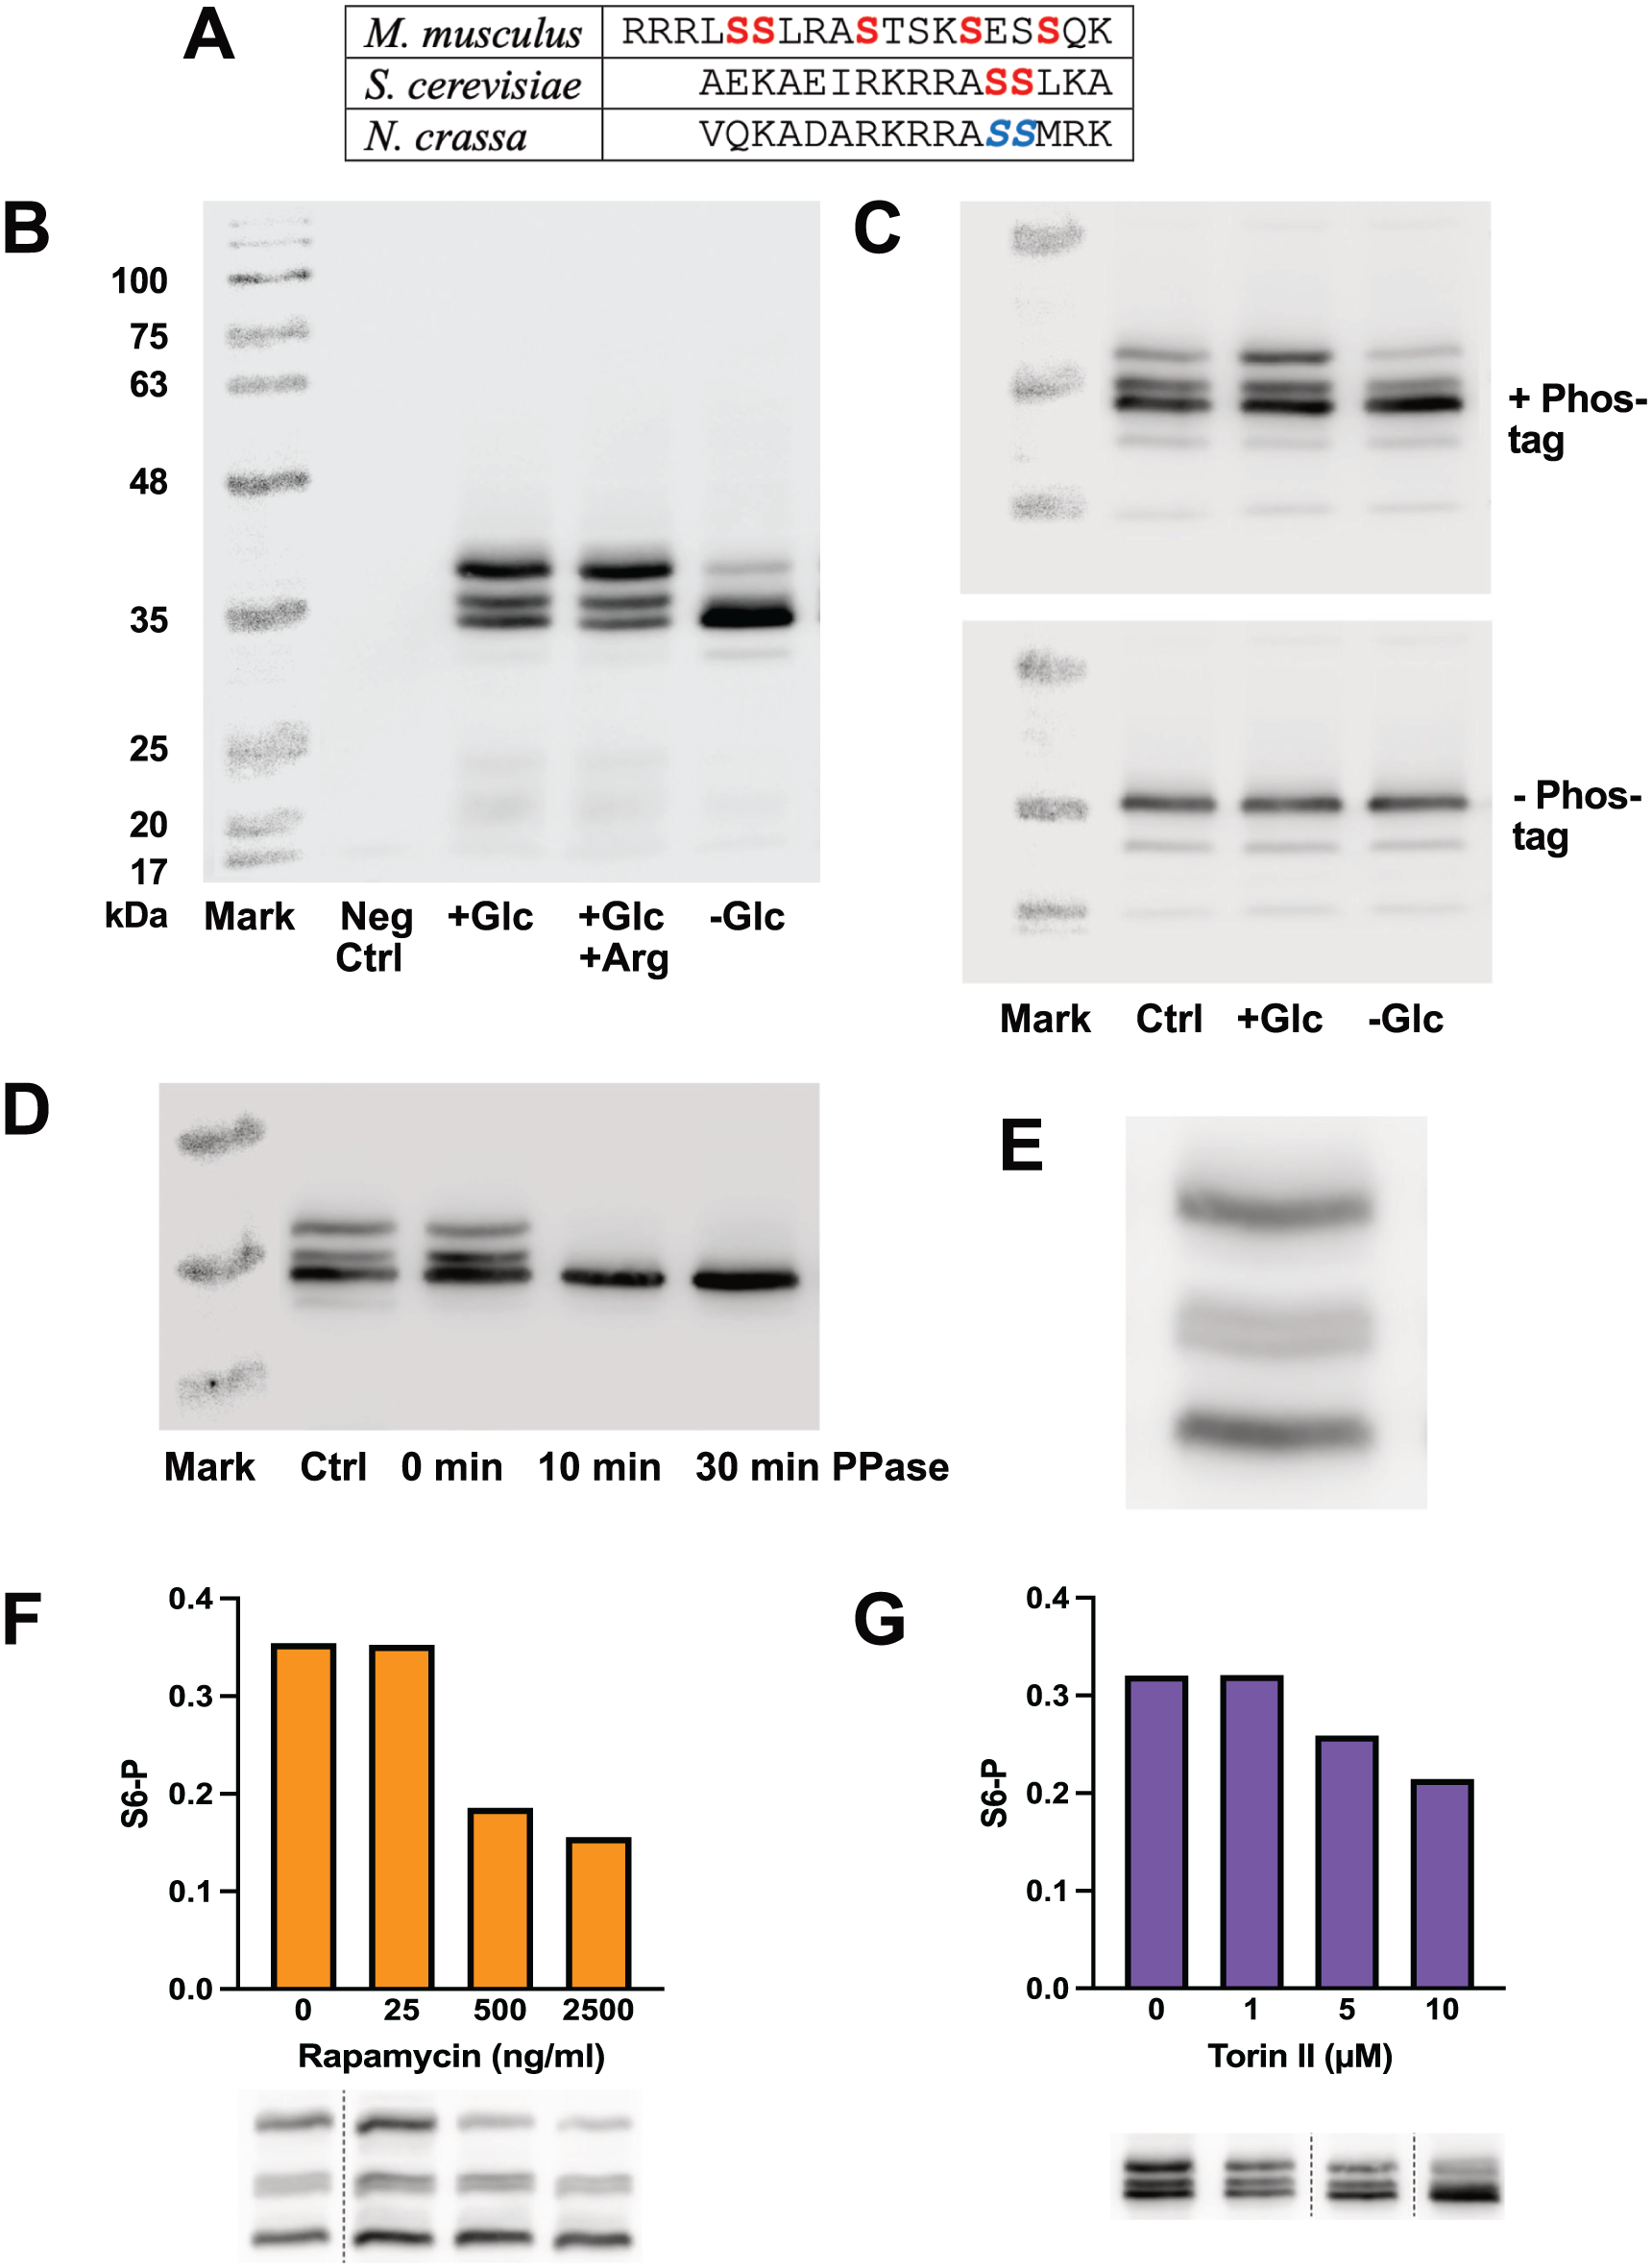
Validation of the S6P assay. (a) Sequence comparison of S6 protein from mouse (M. musculus), yeast (S. cerevisiae) and Neurospora crassa (NCU08502). Phosphorylated residues are in bold, and putative phosphorylated residues are in bold and italics. (b) Immunoblot of S6-FLAG phosphorylation in response to nutritional changes. Lane 1: Molecular weight markers. Lane 2: Negative control strain not carrying the FLAG epitope on S6. Lanes 3-5: FLAG-tagged strain grown for 2 days in high glucose medium in LL and transferred for 4 h into treatments in fresh media. Lane 3: High glucose treatment. Lane 4: High glucose plus arginine treatment. Lane 5: Starvation treatment in medium without glucose. Note that molecular weight markers are not accurate in the presence of phos-binding reagent. (c) Phos-tag is required for band separation. The same samples were run on two gels: upper gel included Phos-tag, lower gel did not. Lane 1: Molecular weight markers. Lane 2: Culture grown for 48 h in medium with 2% glucose. Lane 3: Culture as for lane 1 transferred to fresh 2% glucose medium for 4 h before harvest. Lane 4: Culture as for lane 1 transferred to starvation medium without glucose for 4 h before harvest. (d) Effect of phosphatase treatment on S6 phosphorylation. Fungal samples were grown in high glucose medium and protein was extracted using either our standard SDS-containing extraction buffer followed by boiling (lane 2), or on ice using an SDS-free buffer containing protease and phosphatase inhibitors (lane 3), or on ice using the SDS-free buffer containing protease inhibitors followed by incubation with phosphatase for 10 min (lane 4) or 30 min (lane 5). Molecular weight markers are in lane 1. (e) Magnification of a set of S6 bands showing a double middle band. This lane is taken from a gel containing a higher amount of Phos-tag than usual (50 µl per 5 ml gel). (f & g) Effect of Rapamycin and Torin II on S6 phosphorylation. Fungal samples grown in high glucose medium in LL were treated for 1 h with the indicated concentration of Rapamycin (ng/ml) (f) or Torin II (µM) (g). Protein extracts were assayed for S6 phosphorylation by immunoblotting and the fraction of total S6 protein in the top band (S6P) was plotted. Data are from single experiments. The immunoblot lanes are shown below the corresponding quantitations; dotted lines indicate lanes deleted from the gel image for clarity.
Liquid Media Cultures
Conidiospores were inoculated into 2 ml of liquid medium in 12-well multi-well plates and were grown at room temperature and LL (constant light). After 2 days of growth, the fungal mats were pressed between two layers of sterile filter paper to remove excess medium and then transferred to fresh media for 4 h, and either harvested or transferred to additional treatments, as required. The fungal mats were harvested over filter paper on a vacuum and washed with distilled water, then aspirated until almost dry and frozen in microfuge tubes in liquid nitrogen. Samples were stored at −80 °C until extraction.
Rapamycin and Torin II Treatments
Fungal cultures were grown in liquid media as above and transferred to fresh media for 4 h, then transferred to media containing the required concentration of inhibitor for 1 h before harvest. Inhibitors were dissolved in dimethyl sulfoxide (DMSO) and an equal amount of DMSO was added to all treatments (10 µl per 5 ml media).
Solid Agar Media Cultures
Growth rates and periods of S6-FLAG strains were determined by race tube analysis, as previously described (Adhvaryu et al., 2016). Race tubes contained 6 ml of MA medium plus choline. Cultures were inoculated from conidiospores, germinated for 24 h in LL at 30 °C, then transferred to DD (constant darkness) at 22 °C and the growth fronts were marked daily on the underside of the tubes using red safelight. Growth rates and periods were calculated using in-house software as previously described (Lakin-Thomas, 1998). The density of conidiation was assayed as described previously (Lakin-Thomas, 2006a) by scanning the underside of the race tubes and using Fiji (ImageJ, NIH) software to plot a profile of pixel brightness down the length of the image of the tube. This was converted from pixel brightness versus distance to pixel brightness versus time by using the growth front marks for calibration. The density traces of five replicate race tubes were averaged for each strain.
Cultures for S6-FLAG immunoblotting were grown in 150 mm Petri plates on MA plus choline medium overlaid with cellophane, as previously described (Li et al., 2011). Conidiospores were inoculated onto agar plates without cellophane and grown for 48 h in LL at 30 °C. Small plugs of agar were punched at the growth front and transferred to the edge of plates overlaid with cellophane. Inoculated cellophane plates were incubated at 30 °C in LL for various lengths of time between 4 and 24 h and transferred to DD at 22 °C to initiate rhythmicity. At appropriate times, the most recent 1 cm of growth was scraped off of the cellophane with a plastic spatula and immediately frozen in liquid nitrogen. Total growth time on cellophane plates was between 44 and 96 h. The interval between transfer to DD and harvest is reported as “hours in DD.”
Cultures for assaying the rate of mass increase were grown in Petri plates on cellophane as above for immunoblotting. After transfer to DD, the growth fronts were marked once a day. After 3 days in DD, the most recent 2 days of growth (52 h) was collected from an arc at the growing front 5 cm wide, placed in a pre-weighed foil boat, dried at 80 °C for 2 days and weighed. The slow-growing prd-1 strain was allowed to grow for 5 days in DD and the most recent 4 days of growth (100 h) was collected for weighing. The rate of mass increase was calculated as the dry weight produced per cm width of culture front per hour of growth, averaging from five replicate plates.
SDS-PAGE With Phosphate-Binding Reagent and Immunoblotting
Protein Extraction and Sample Preparation
Total protein was extracted by grinding frozen fungal samples in liquid N2 in a pre-cooled mortar and pestle and extracting protein by boiling for 5 min in a volume of Protein Extraction Buffer (PEB) equivalent to the fungal powder volume. PEB contained 50 mM tris pH 6.8, 2% SDS, 1 mM PMSF and 10% glycerol. Note that EDTA was omitted as it will interfere with the phos-binding reagents during electrophoresis. Crude extracts were centrifuged at 25 °C, 12,000g for 5 min and the supernatants were recovered as the total protein extract. Protein was assayed using BioRad DC reagents and 10 µg of total protein in 10 µl PEB with 0.1 M DTT was boiled 5 min and loaded on the gel.
SDS-Page
Electrophoresis was carried out using mini-gels in the Laemmli discontinuous buffer system (Tris-glycine-SDS) according to the methods recommended by the suppliers for Phos-tag Acrylamide (Wako Chemicals, Product AAL-107) and Phos Binding Reagent Acrylamide (ApexBio, Product F4002). The amount of phosphate-binding reagent added to the separating gel must be empirically determined for the specific protein to be separated. We found that between 25 and 50 µl phosphate-binding reagent (with an equal volume of 10 mM MnCl2) added to a 5 ml gel recipe with 12.5% acrylamide was optimal for separating the phosphorylated forms of S6. We found some variability between batches of phosphate-binding reagent such that the amount of reagent sometimes needed to be adjusted when starting a new batch of reagent.
Immunodetection
After electrophoresis, the gel was washed 3 times 15 min in Cathode buffer (25 mM tris, 40 mM glycine, 10% methanol, pH 9.4) with 10mM EDTA to remove MnCl2 which interferes with transfer, according to the phosphate-binding reagent suppliers’ directions. Proteins were transferred to a PVDF membrane (Millipore Immobilon-P transfer membrane) using Anode buffer Ⅰ (0.3 M tris base, 10% methanol, pH 10.4), Anode buffer Ⅱ (25 mM tris base, 10% methanol, pH 10.4), and Cathode buffer. The transfer was performed on a semi-dry blotter at 2 mA per cm2 of the gel area for 45 min. The S6-FLAG protein was immunodetected with a monoclonal anti-FLAG M2 antibody (Sigma-Aldrich) and HRP-conjugated goat anti-mouse secondary antibody (OriGene), using 1% BSA in TBST as blocking buffer.
Phosphatase Treatment
A fungal sample grown in high-glucose liquid medium was harvested, frozen, and powdered in liquid N2 as described above. The powder was divided into three aliquots. One aliquot was added to PEB, boiled and centrifuged to recover the supernatant as described above. A second aliquot was added on ice to SDS-free phosphatase buffer (50 mM HEPES, 100 mM NaCl, 2 mM DTT, 1% Triton X-100, plus protease inhibitors PMSF and protease inhibitor cocktail [NEB]). A third aliquot was added to phosphatase buffer with added PhosSTOP (phosphatase inhibitor cocktail from Sigma-Aldrich). Phosphatase buffer samples were centrifuged at 12,000g at 4 °C for 5 min to recover the supernatants and the extracts were left on ice. Two aliquots of the phosphatase buffer sample which was extracted without PhosSTOP were incubated on ice for 10 or 30 min, using 16.7 µl protein extract, 23.3 µl water, 5 µl of 10X NEBuffer for protein MetalloPhosphatase, 5 µl of 10 mM MnCl2 and 1 µl of Lambda Protein Phosphatase (NEB). After protein assays of the extracts, 10 µg of protein from each of the incubated samples was run on a gel with Phos-tag reagent.
Quantitation of S6-Phosphorylation
The phosphate-binding reagent separates S6 into at least three bands, with the middle band a doublet that is usually not clearly resolved (as described in Results). We assume that the top band represents the fully phosphorylated active form of S6 protein. The bands were quantitated using Fiji (ImageJ) software (NIH) to measure the mean gray value of a region of interest of constant size slightly larger than one band. After background subtraction the ratio of active S6 was calculated as the top band divided by the sum of all three bands and is reported as our assay of TOR activation. Because this ratio is calculated by measuring the relative brightness of the bands within one lane, the amount of total protein loaded on the gel is not relevant to the assay.
To quantitate S6 protein relative to total protein, immunoblot membranes were stained after immunodetection with Colloidal Gold Total Protein Stain (Bio-Rad) according to the manufacturer’s directions. Stained membranes were scanned and a representative region of the gel was quantitated using Fiji software by measuring the pixel density in a region of interest of constant size. After background subtraction, the ratios were calculated for total S6 protein (from immunodetection) to total protein (from gold staining), or S6 top band to total protein. Because this is an arbitrary number that depends on the staining intensity of the membrane, absolute ratios cannot be compared between membranes. To facilitate comparisons, the values obtained for a complete timecourse (from 20 to 80 h in DD) blotted onto one membrane were normalized to give a mean value for the timecourse of 1.0. For a timecourse from 0 to 96 h that required more than one membrane, two samples were repeated on both membranes to allow calibration of the measurements of protein staining intensity. The normalized datasets from three biological replicates were then averaged to give the mean timecourse.
Statistical Analysis
Three biological replicate timecourses were carried out for each strain. At each timepoint, the mean value of each variable was calculated with standard error of the mean (SEM) for N = 3. For ANOVA and cosinor analysis, only the data from 20 to 80 h in DD were used from the wild-type 0-96 h timecourse to facilitate comparison to the mutant timecourses where data were collected from 20 to 80 h. Statistical analyses were carried out in GraphPad Prism or R Studio. The Cosinor test was performed with the R circacompare package (Parsons et al., 2020), which uses nonlinear regression to fit a cosine curve to the data. The default parameters were used for circacompare. Data sets analyzed by cosinor analysis were the top band as percent of total S6. Damping was analyzed by using nonlinear regression to fit a damped cosine curve to the data for S6P as percent of total S6, or S6P relative to total protein, for 20-80 h, assuming exponential decay of the amplitude.
Results
Development and Validation of the TOR Activity Assay
To investigate the possibility that TOR activity is rhythmic, we developed and validated a new assay for TOR activity in Neurospora. In other organisms, TOR activity is generally assayed by detecting the phosphorylation of TOR substrates by immunoblotting using phospho-specific antibodies against either the S6 kinase that is one of the immediate targets of TOR phosphorylation (Hong and Inoki, 2017), or the S6 ribosomal protein phosphorylated by the S6 kinase (Hanrahan and Blenis, 2006). Phospho-specific antibodies against these substrates are not available for Neurospora. An assay for changes in TOR activity in Neurospora in response to exogenous activators/inhibitors was developed in another laboratory (Diernfellner et al., 2019) by using a humanized S6 sequence expressed in an ectopic location from a high-expression promoter. S6 phosphorylation was detected by immunoblotting using the commercially available phospho-specific antibody against the human protein (Diernfellner et al., 2019). This approach would not be optimal for assaying endogenous regulation of TOR activity.
We chose to take a different approach to assaying the phosphorylated state of S6 protein in Neurospora. The S6 protein from mammals is phosphorylated at five sites, while the yeast protein has only two phosphorylation sites (Ruvinsky and Meyuhas, 2006). The C-terminal sequences of mammalian, yeast, and Neurospora S6 are compared in Figure 1a. Based on sequence analysis, the S6 protein from Neurospora is predicted to have two phosphorylation sites, similar to yeast and unlike mammalian S6. Because of the relatively small size of the Neurospora S6 protein (27 kDa) and the presence of only two putative phosphorylation sites, we predicted that it should be possible to separate the phosphorylated forms of the protein by SDS-PAGE using a phosphate-binding reagent in the gel.
To detect S6 protein by immunoblotting, we knocked in a C-terminal FLAG epitope tag at the endogenous S6 sequence. This tagged construct was then crossed into a series of strains carrying mutations that affect the circadian rhythm of conidiation (spore formation). S6 is an essential ribosomal protein and any perturbation of the protein’s function would be expected to affect viability. We therefore assessed growth rate and rhythmicity of the FLAG-tagged S6 strains and found no major differences between tagged and untagged strains (Suppl. Table S1, Fig. S1). The S6-FLAG tag decreased growth rate by about 12% across all strains, confirming that the FLAG tag did not seriously disrupt S6 protein function. We speculate that this small decrease in growth rate may be a consequence of a slight inhibition of protein synthesis by the tagged S6 protein. Increases in period length were seen when comparing tagged versus untagged strains in most genetic backgrounds (Suppl. Table S1), and this may also reflect a pleiotropic effect of a general inhibition of protein synthesis.
Protein extracts from FLAG-tagged strains were run on SDS-PAGE in gels containing the phosphate-binding reagent “Phos-tag,” or its chemical equivalent “Phos Binding Reagent,” and S6 was detected on immunoblots using a commercial anti-FLAG antibody. Figure 1b demonstrates that we could detect three bands of S6 on Phos-tag gels. Glucose and arginine are activators of TOR in yeast (González and Hall, 2017). We found that the upper band was prominent in high glucose media with or without arginine and was greatly reduced in starvation conditions, indicating that the bands behaved as predicted for phosphorylated S6. Figure 1c compares samples run on gels with and without the addition of Phos-tag, demonstrating that Phos-tag is required to see the separation of the three bands.
To confirm that the three bands represent different phosphorylated forms of S6, we treated a protein extract with phosphatase before running the gel. In Figure 1d, the last two lanes were treated with phosphatase and only the lowest band is visible on the gel. This result demonstrates that the upper bands represent phosphorylated forms of S6. The sample boiled in our standard SDS-containing protein extraction buffer (lane 2) and the sample extracted on ice in buffer without SDS but containing protease and phosphatase inhibitors (lane 3) were very similar, confirming that our method of immediately boiling powdered fungal samples in SDS-containing buffer effectively prevents degradation by proteases and phosphatases.
S6 is predicted to have two phosphorylation sites, which would theoretically produce four possible phosphorylated forms: unphosphorylated, fully phosphorylated (both sites), or phosphorylation at only one site (two possible locations). Using our standard gel conditions (25 µl phos-binding reagent per 5 ml gel solution) we did not usually see more than three bands. In Figure 1e we increased the Phos-tag to 50 µl per 5 ml gel and ran the gel longer to get better separation. Under these conditions it is possible to distinguish a double middle band, as predicted if each band represents a single phosphorylation event. For our standard conditions we have not attempted to quantitate the two middle bands separately but have measured them as a single quantity. We therefore quantitate TOR activity by measuring the mean pixel brightness (minus background) of all three S6 bands (top, middle, and bottom) and reporting the ratio of the top band (fully phosphorylated S6, to be referred to as S6P) to the sum of all three bands (total S6 protein).
If S6 phosphorylation is an output of TOR activity, then TOR inhibitors should reduce S6 phosphorylation. We treated fungal samples for 1 h with the TOR pathway inhibitor rapamycin (Figure 1f) and the specific TOR kinase inhibitor Torin II (Figure 1g) and observed the expected dose-dependent decrease in S6 phosphorylation. We conclude that the phosphorylation state of S6 as assayed by this method is a useful reporter of the activation state of TOR kinase.
TOR Activity Is Rhythmic in the “Wild-Type” Strain
Using the TOR activity assay we have developed, we investigated the rhythmicity of TOR activity in samples harvested from cultures growing on solid agar plates overlaid with cellophane to facilitate harvesting the fungal mycelium from the growth front. Cultures were transferred from LL (constant light) to DD (constant dark) at different times to set the phase at harvesting. We have previously reported that FRQ protein and TOR-associated GTR2 protein, but not TOR-associated VTA protein, are rhythmic in this culture system (Li et al., 2011; Ratnayake et al., 2018; Eskandari et al., 2021). We assayed S6 phosphorylation from 0 to 96 h in DD, and quantitated the percentage of total S6 in each of the three bands, as shown in Figure 2. Representative gels of a complete timecourse are shown in Supplementary Figure S2. Figure 2a presents the results of three biological replicates for the top band (fully phosphorylated S6, S6P), demonstrating the reproducibility of the rhythm. The pooled data from the three replicate experiments are presented in Figure 2b for all three bands. The middle band shows a relatively low-amplitude rhythm, while the top and bottom bands show relatively higher amplitude rhythms that are almost mirror images of each other. On closer inspection it can be seen that there is a progression in the peak timings, from top to middle to bottom and back to top band. This suggests a rapid phosphorylation from the unphosphorylated bottom band to fully phosphorylated S6 in the top band, and then a slower dephosphorylation to the mono-phosphorylated forms in the middle band and then to the unphosphorylated bottom band.
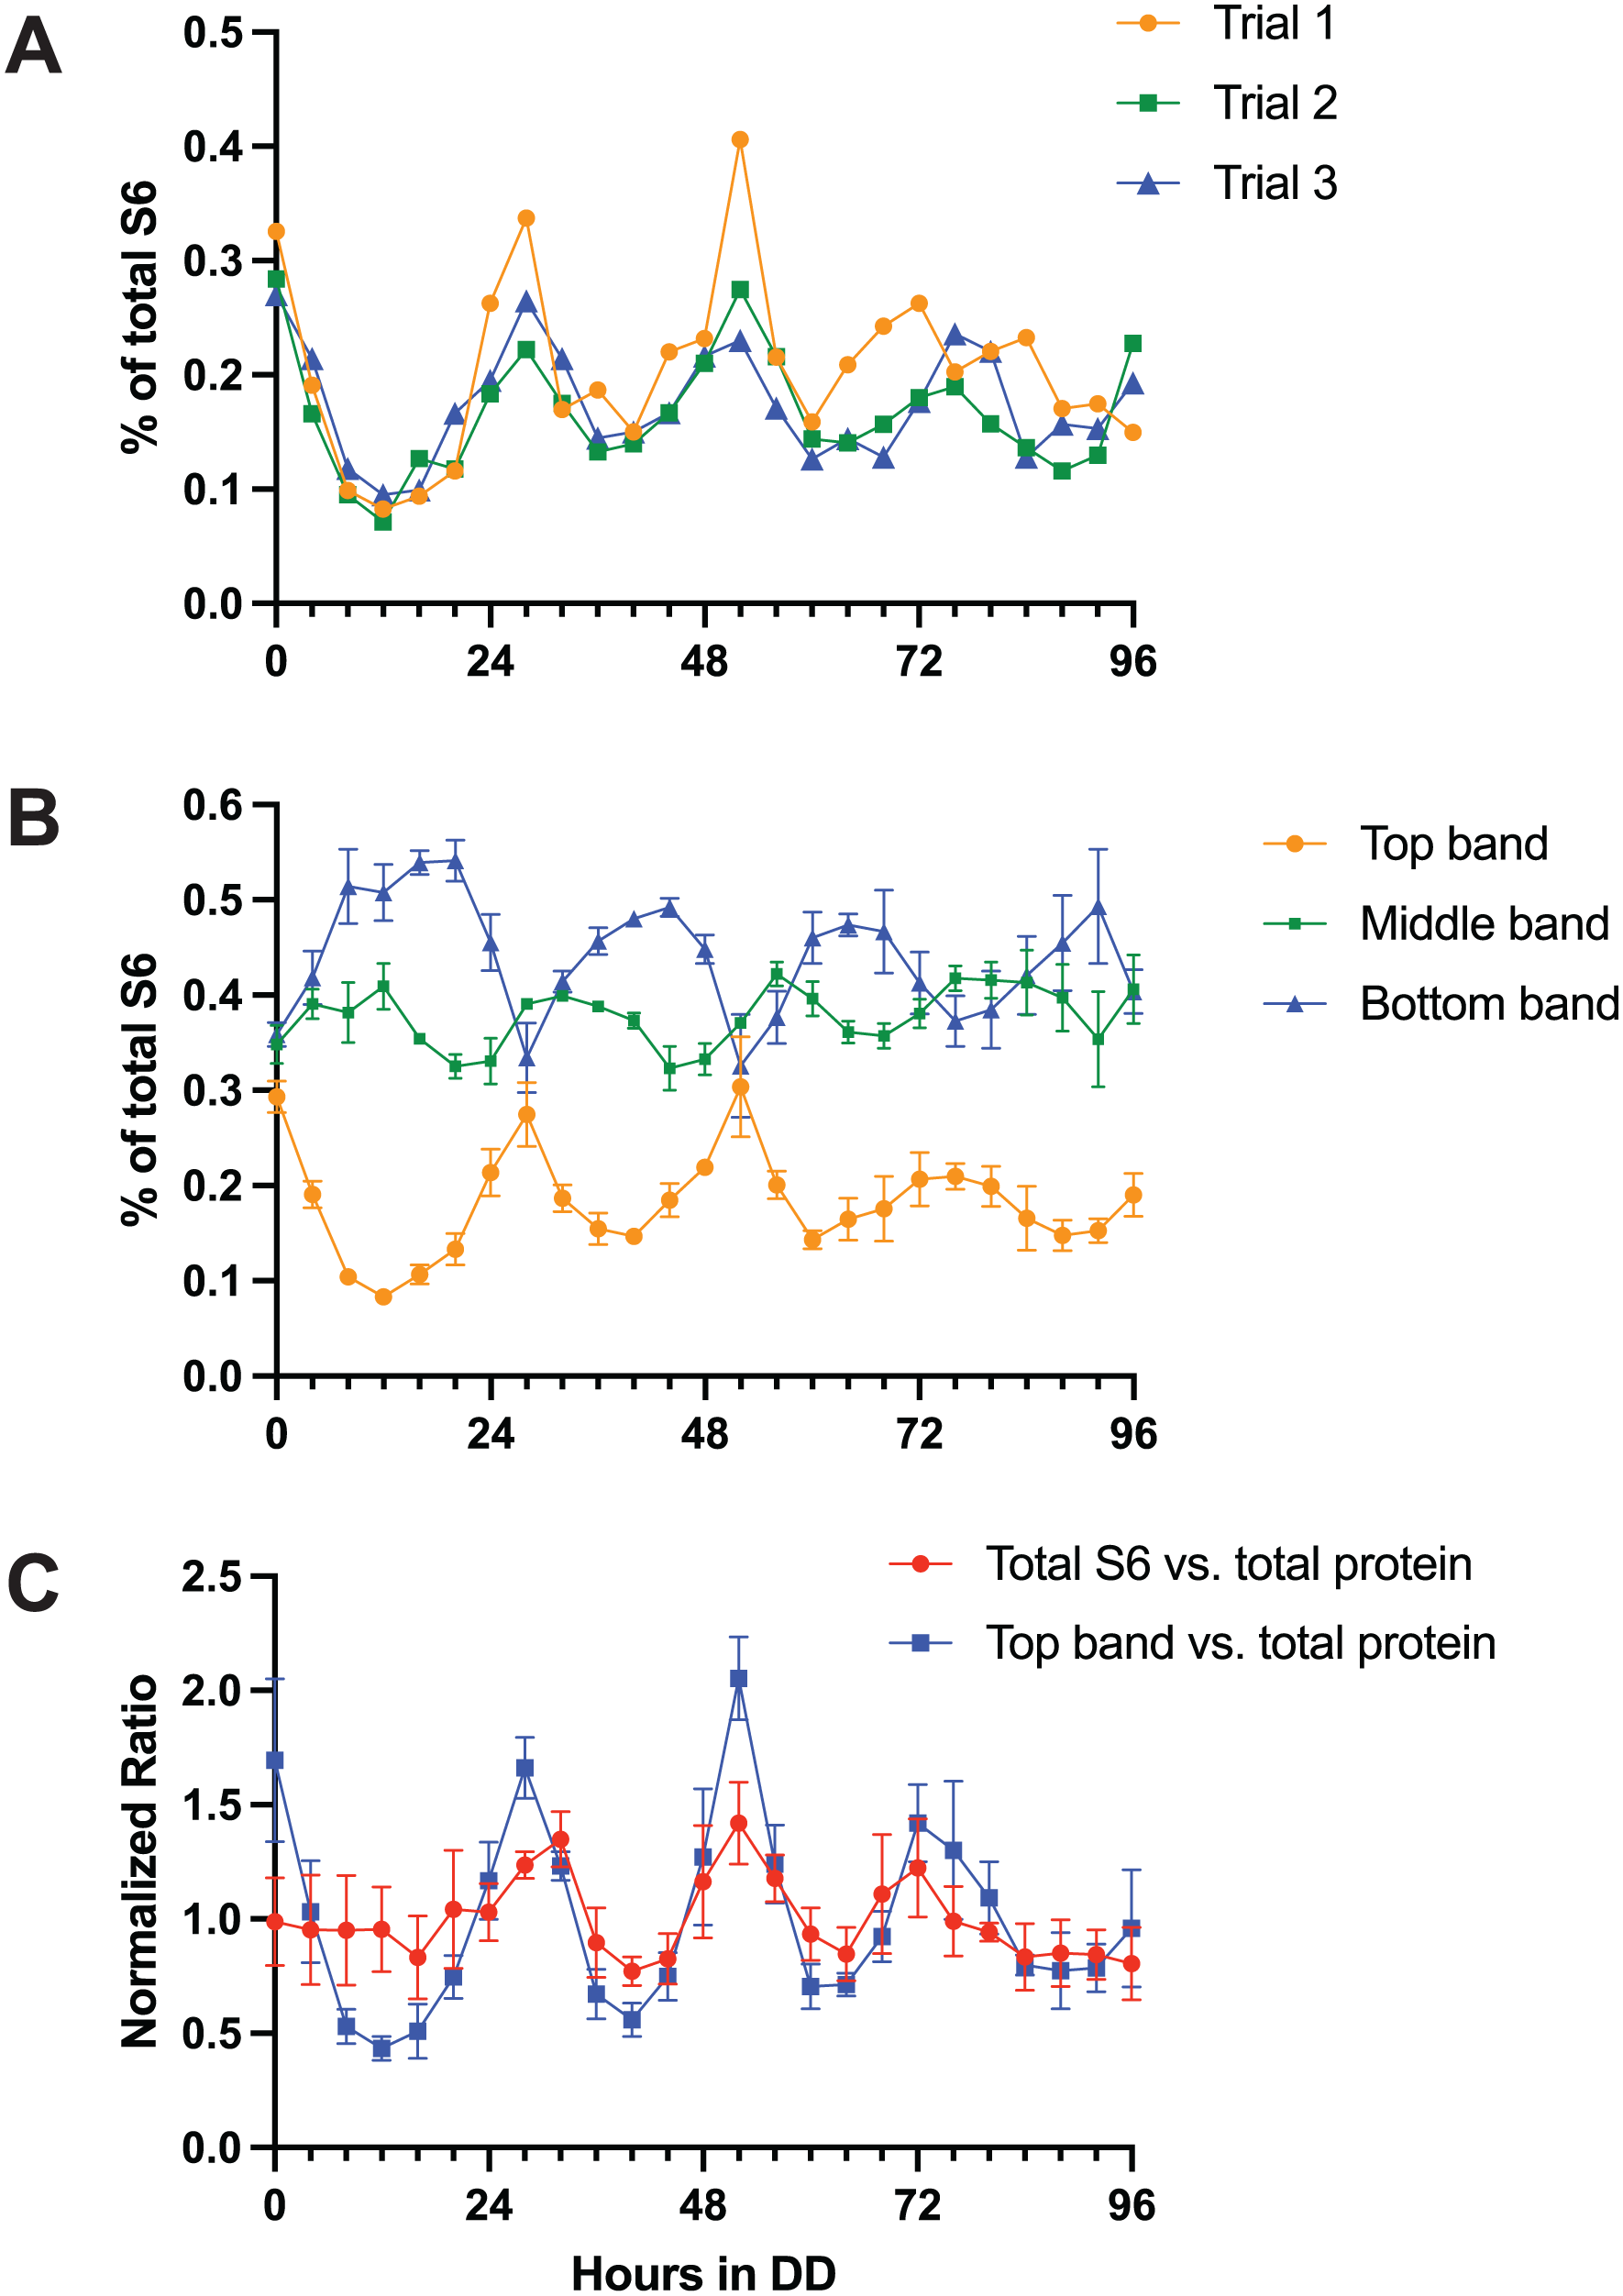
S6 phosphorylation rhythm of the “wild-type” strain from 0 to 96 h in DD. The “wild-type” strain carries the rasbd, csp-1 and chol-1 mutations and the FLAG-tagged S6 gene. (a and b): The anti-FLAG immunodetection data are plotted as the fraction of each band relative to total S6. (a) Results of three independent experiments for the top band only. (b) Mean ± SEM of three biological replicates for all three bands. (c) S6 protein relative to total protein. S6 protein immunodetection band intensities are calculated relative to total protein in that lane on the gel, assayed by the intensity of colloidal gold staining. For b and c, error bars indicate SEM for N = 3 biological replicates. For c only, each time-course is normalized to its own mean.
As a comparison to the calculation of S6 phosphorylation as a fraction of total S6 protein (Figure 2a and 2b), we have also calculated the ratio of S6 protein to total cellular protein (Figure 2c). Total S6 protein shows a rhythm relative to total protein, indicating a rhythm in synthesis and/or degradation of S6 protein. The top band of S6 (S6P) shows a higher-amplitude rhythm relative to total protein (Figure 2c) that is in phase with the rhythm of the top band relative to total S6 (Figure 2b). This confirms the conclusion that there is a rhythm in the amount of fully phosphorylated S6 present in the cell. It also indicates that there are two mechanisms contributing to the peak of S6P: an increase in total amount of S6 protein and an increase in the percentage of total S6 that is phosphorylated. Note that because S6 is a structural component of the ribosome (Shen et al., 2021), the ratio of S6P to total protein will be influenced by both the activity of TOR and the abundance of ribosomes relative to total protein.
Clock and TOR Mutations Affect Rhythmicity of S6P
The effects of mutations in clock genes and TOR-related proteins on the rhythm of S6 phosphorylation were assayed by crossing the S6-FLAG construct into previously constructed strains. Timecourses were assayed from 20 to 80 h in DD rather than 0 to 96, as this time interval was sufficient to capture three peaks of activity in the wild-type (Figure 2) while requiring a more manageable number of samples.
The frq7 strain produces a long-period variant of the FRQ protein (Gardner and Feldman, 1980), which is the central component of the FRQ/WCC TTFL. The TOR activity rhythm in this strain also displayed a long period of approximately 34 h (Figure 3a, Table 1), with a delayed phase relative to wild-type (Figure 2) as expected for a long-period mutant. Notably, the amplitude of the S6P rhythm was low relative to wild-type (Table 1). The prd-1 mutant was identified as a clock-affecting mutant with a long period (Gardner and Feldman, 1981); prd-1 was also found to disrupt FRQ-less rhythms (Li and Lakin-Thomas, 2010). The PRD-1 protein is a DEAD-box RNA helicase that localizes to the nucleus (Emerson et al., 2015; Adhvaryu et al., 2016) and whose localization depends on nutritional state (Emerson et al., 2015). The prd-1 mutant has a high-amplitude S6P rhythm relative to wild-type with a period of approximately 27 h (Figure 3b, Table 1).
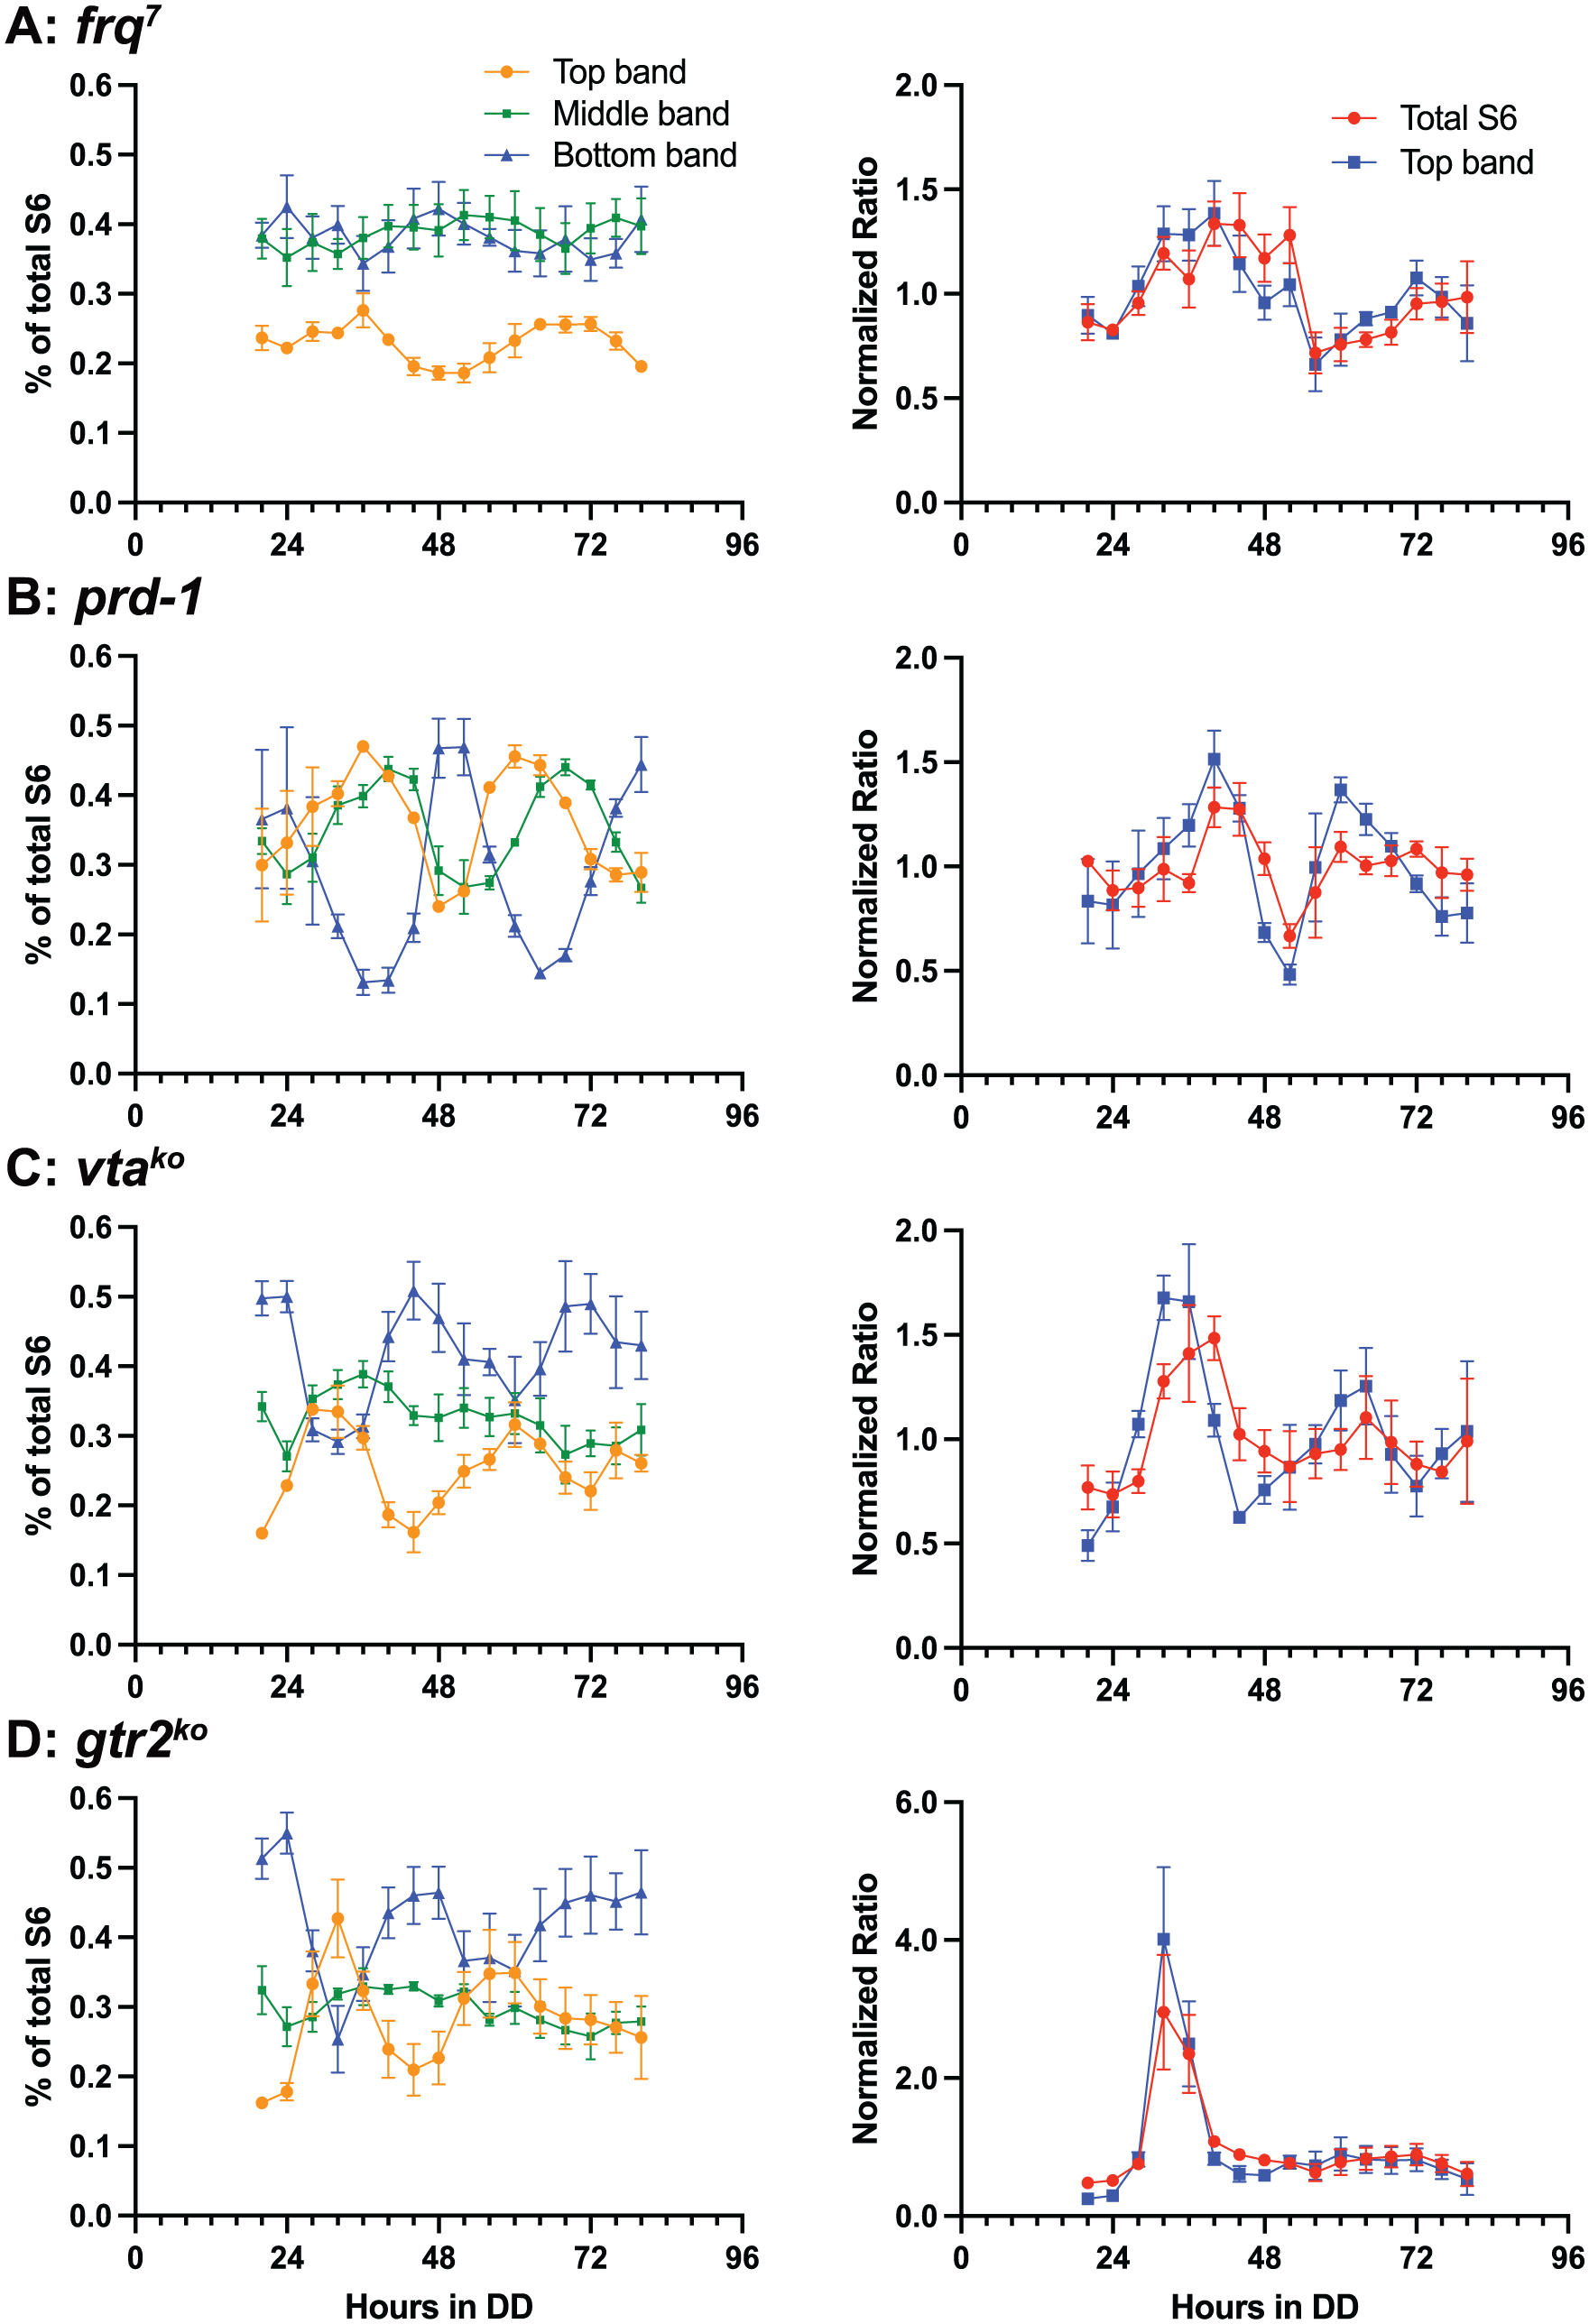
S6 phosphorylation rhythm of mutant strains from 20 to 80 h in DD. All strains carry the rasbd, csp-1, and chol-1 mutations and the FLAG-tagged S6 gene in addition to the indicated mutations. Error bars indicate SEM for N = 3 biological replicates. Representative gels are shown in Supplementary Figure S3. a: frq7; b: prd-1; c: vtako; d: gtr2ko. Left column: The anti-FLAG immunodetection data are plotted as the fraction of each band relative to total S6. Right column: S6 protein relative to total protein. S6 protein immunodetection band intensities are calculated relative to total protein on the gel, assayed by colloidal gold staining. For the right column only, each replicate time-course is normalized to its own mean. Note the change in Y-axis scale for gtr2ko in the right column.
Analyses of S6P rhythmicity.
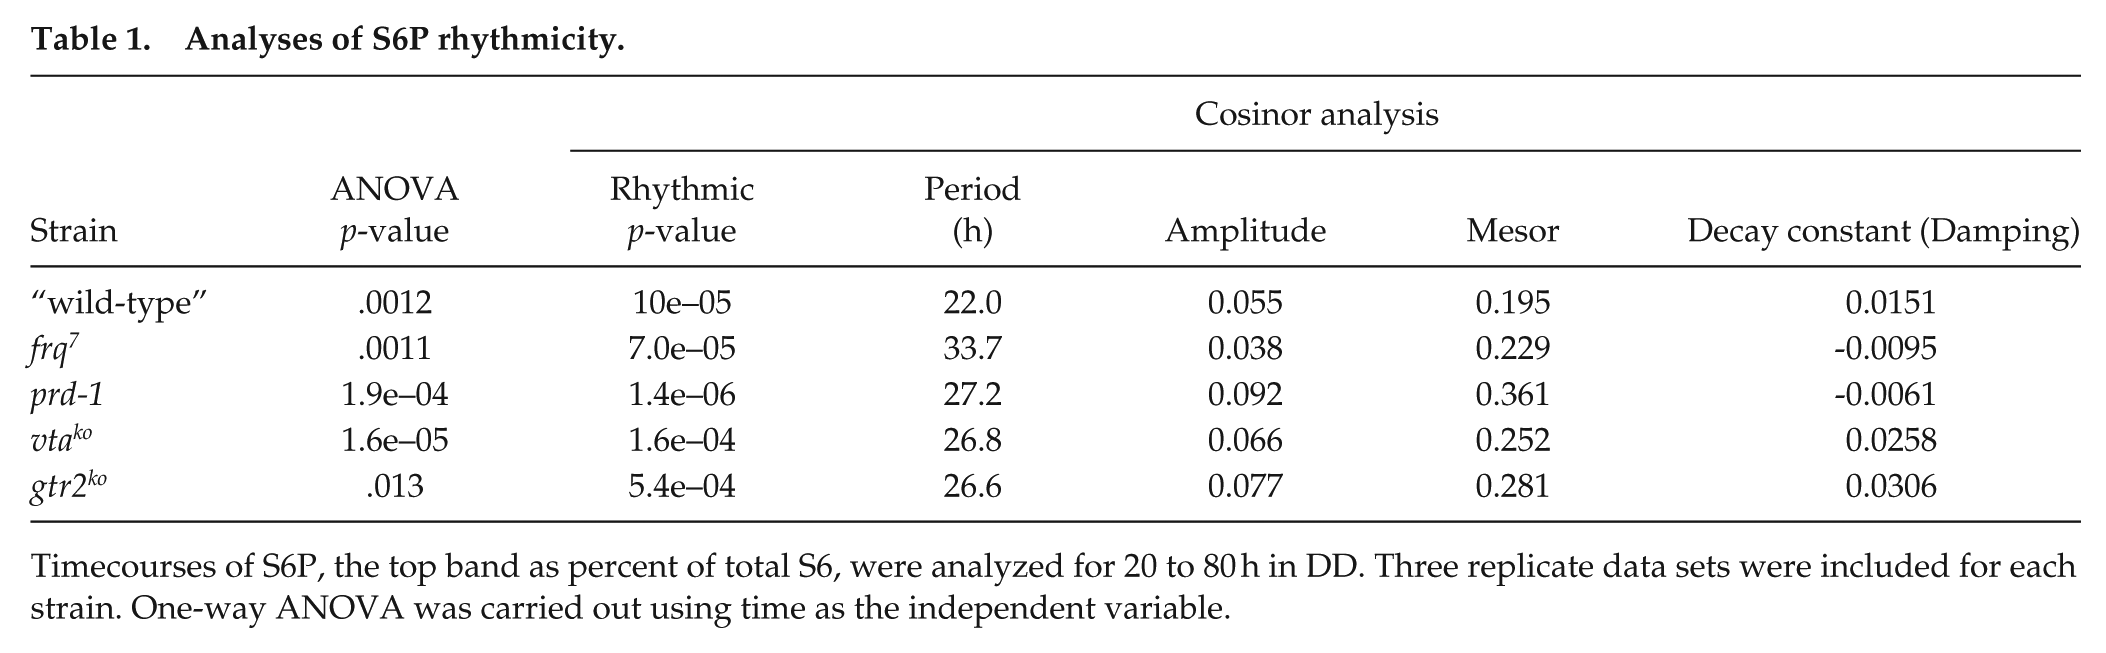
Timecourses of S6P, the top band as percent of total S6, were analyzed for 20 to 80 h in DD. Three replicate data sets were included for each strain. One-way ANOVA was carried out using time as the independent variable.
PCR primer sequences for construction of S6-FLAG.
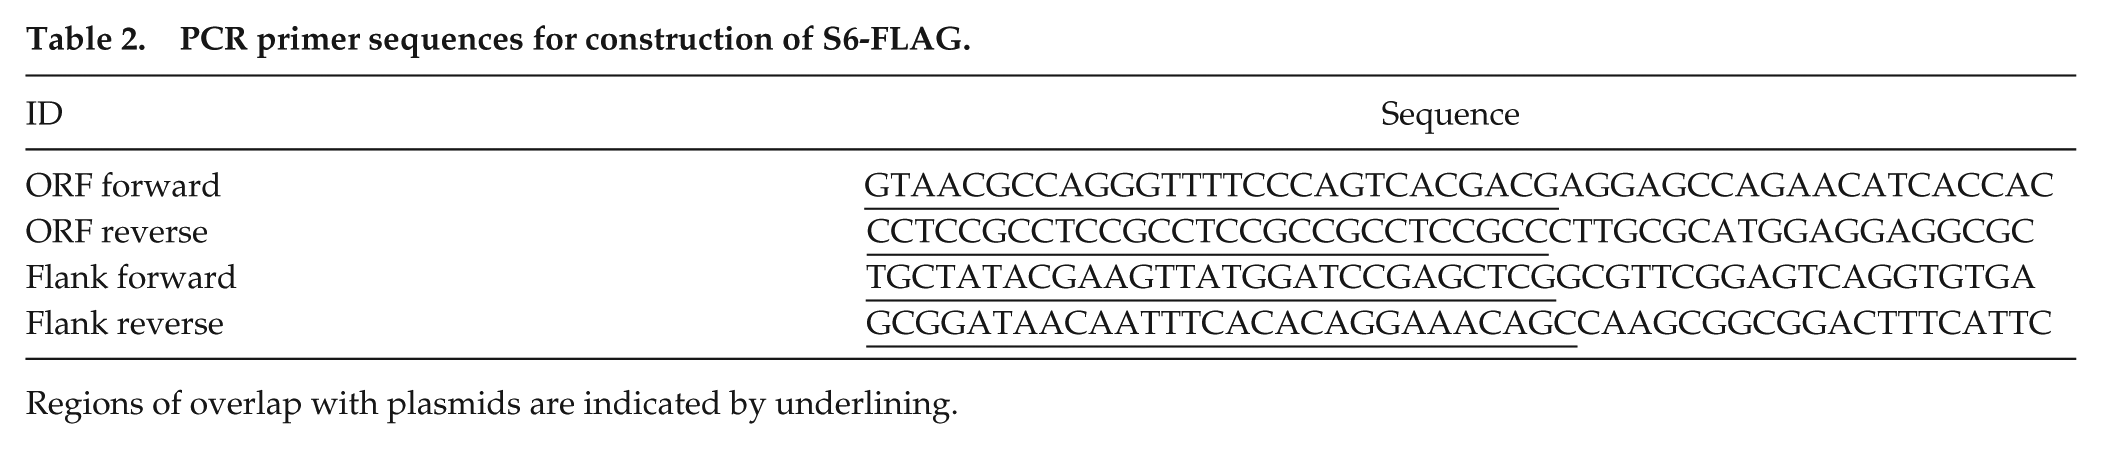
Regions of overlap with plasmids are indicated by underlining.
We have previously characterized two components of the TOR pathway, VTA and GTR2, as essential for FRQ-less conidiation rhythms in frq knockout strains (Li et al., 2011; Eskandari et al., 2021). These two gene products are also required to maintain the amplitude of the FRQ protein rhythm and the amplitude of the output rhythm of conidiation in frq-sufficient strains (Li et al., 2011; Eskandari et al., 2021) and the VTA gene product is required to maintain the amplitude of the phase-resettable circadian oscillator (Li et al., 2011). Similarly, we find that these gene products are required to maintain the amplitude of the S6P rhythm. In both knockout strains, the S6P rhythms rapidly dampen (Figure 3c and 3d); this is especially clear in the gtr2ko strain (Figure 3d). A damped cosine curve was fitted to the S6P data for all strains, assuming exponential decay of the amplitude, and the decay constants reported in Table 1 confirm this observation: the decay constant for the wild-type indicates some damping, the frq7 and prd-1 strains have very small negative decay constants and are therefore essentially undamped, while the decay constants for the vtako and gtr2ko strains are the highest indicating the most rapid damping.
We have also fitted damped cosine curves to the S6P versus total protein data and the decay constants are reported in Supplementary Table S2. The decay constants indicate little damping in the wild type and prd-1 strains, increased damping in frq7 and vtako, and the greatest damping in gtr2ko. Bearing in mind that the ratio of S6P to total protein will be influenced by both the activity of TOR and the abundance of ribosomes, these results support the conclusion that the TOR pathway mutants vtako and gtr2ko cause damping of the TOR activity rhythm.
Comparing Figure 2a with Figure 3c and 3d, it can be seen that the peaks and troughs of the damped oscillation of TOR activity (S6P relative to total S6) found in the vtako and gtr2ko strains are within the range of the wild type TOR oscillation. This finding provides information about the role of TOR activity in the circadian system: It is the rhythmicity of TOR activity, not merely a constant mean level within a “normal” range, that is required for maintaining the amplitude of the circadian oscillator. This implicates TOR activity as a rhythmic state variable in the circadian system, and not simply an essential constant parameter.
S6P Timecourses Show Significant Rhythmicity
To confirm rhythmicity of the timecourses, one-way ANOVA was carried out on each strain’s “top band” data set (S6P as percent of total S6) using time as the independent variable. As shown in Table 1, the p-values indicate that time was a significant variable at the level of .01 for all strains, except gtr2ko at the level of 0.05. Rhythmicity was assessed using cosinor analysis. Table 1 indicates p-values for rhythmicity of <.001 for all strains, indicating all timecourses were significantly rhythmic. Estimates of period confirm long periods for the frq7 and prd-1 strains, as well as long periods for the two TOR component knockouts vtako and gtr2ko. Amplitude estimates confirm that the strain with the greatest amplitude is prd-1 and the smallest is frq7.
TOR Activity Is Not Correlated With Period or Growth Rate
From Figures 2 and 3, it appears that the average level of S6P (the mesor of the rhythm) differs between strains. The average mesor was calculated for the three replicate timecourses for each strain and in Figure 4a the mesors are plotted against the periods estimated from the cosinor analyses. It can be seen that the periods and mesors are very similar for the two TOR mutants vtako and gtr2ko. It can also be seen that there is no correlation between period and mesor (Pearson r = .12, p = .85), indicating that the average level of TOR activation (assayed by S6P) is not predicted by the circadian period. This makes it unlikely that there is a simple causal relationship between the period and TOR, such as the possibility that longer circadian cycles might lead to higher TOR activity.
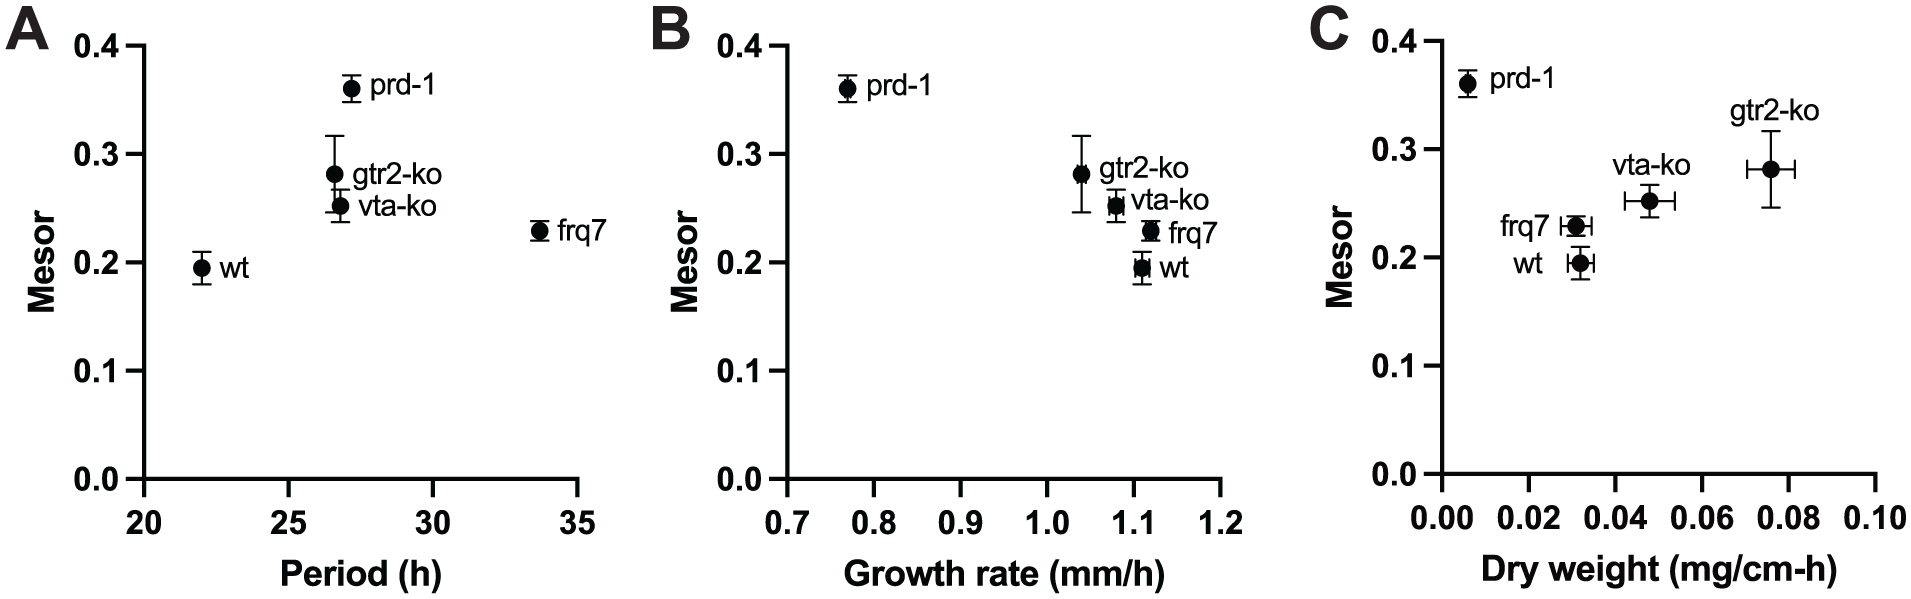
Mean value of S6P versus period and growth rate. The average values of S6P across the 20-80 h timecourses (the mesors of the rhythms) are plotted against the period as estimated by cosinor analysis (a) or against the linear growth rates of each strain in race tubes (b) or against the rate of mass increase on Petri plates (c). Error bars indicate SEM for N = 3 biological replicates for mesors, and N = 5 for linear growth rates and mass increase. SEMs for growth rate in B are smaller than the plot symbols.
Because activation of TOR might be assumed to drive growth, we investigated the relationship between the average mesors and growth rates. In Figure 4b the mesors are plotted against the linear growth rates of the respective strains assayed on solid agar medium in race tubes (Suppl. Table S1). Surprisingly, the linear growth rate is significantly negatively correlated with the mesor (Pearson r = −.94, p = .019). This indicates that, counterintuitively, as linear growth rate increases, TOR activity decreases. Linear growth rate does not always correlate with mass increase, and therefore we also measured the rate of mass accumulation on solid agar media under conditions similar to the TOR activity assays. As seen in Figure 4c, mass increases with the TOR activity mesor for some strains but not all, with prd-1 being the greatest outlier, and the correlation is not significant (Pearson r = −.29, p = .63).
S6P Rhythmicity Is Closely Correlated With Conidiation Rhythmicity
The standard assay for the state of the circadian system in Neurospora is the rhythm of conidiation (spore formation), assayed by growth on solid agar medium in long culture tubes known as race tubes. To assess the relationship between the rhythm of S6P and circadian conidiation, cultures were grown on race tubes and the rhythm of conidiation was analyzed by scanning the race tubes and measuring the density of conidiation along the length of the tube. Representative race tubes are shown in Supplementary Figure S1. The density traces are compared to the S6P timecourses in Figure 5. Regions of high density indicate “bands” of conidiation, and low density indicates “interbands” with little conidia production. In all strains, the peak of S6P occurs before the peak of conidiation, and S6P is decreasing when conidiation density is highest. The amplitudes of the density traces are correlated with the S6P rhythm: relatively high or low amplitudes in prd-1 and frq7, respectively, and damped rhythms in vtako and gtr2ko. TOR activity is therefore closely associated with circadian conidiation.
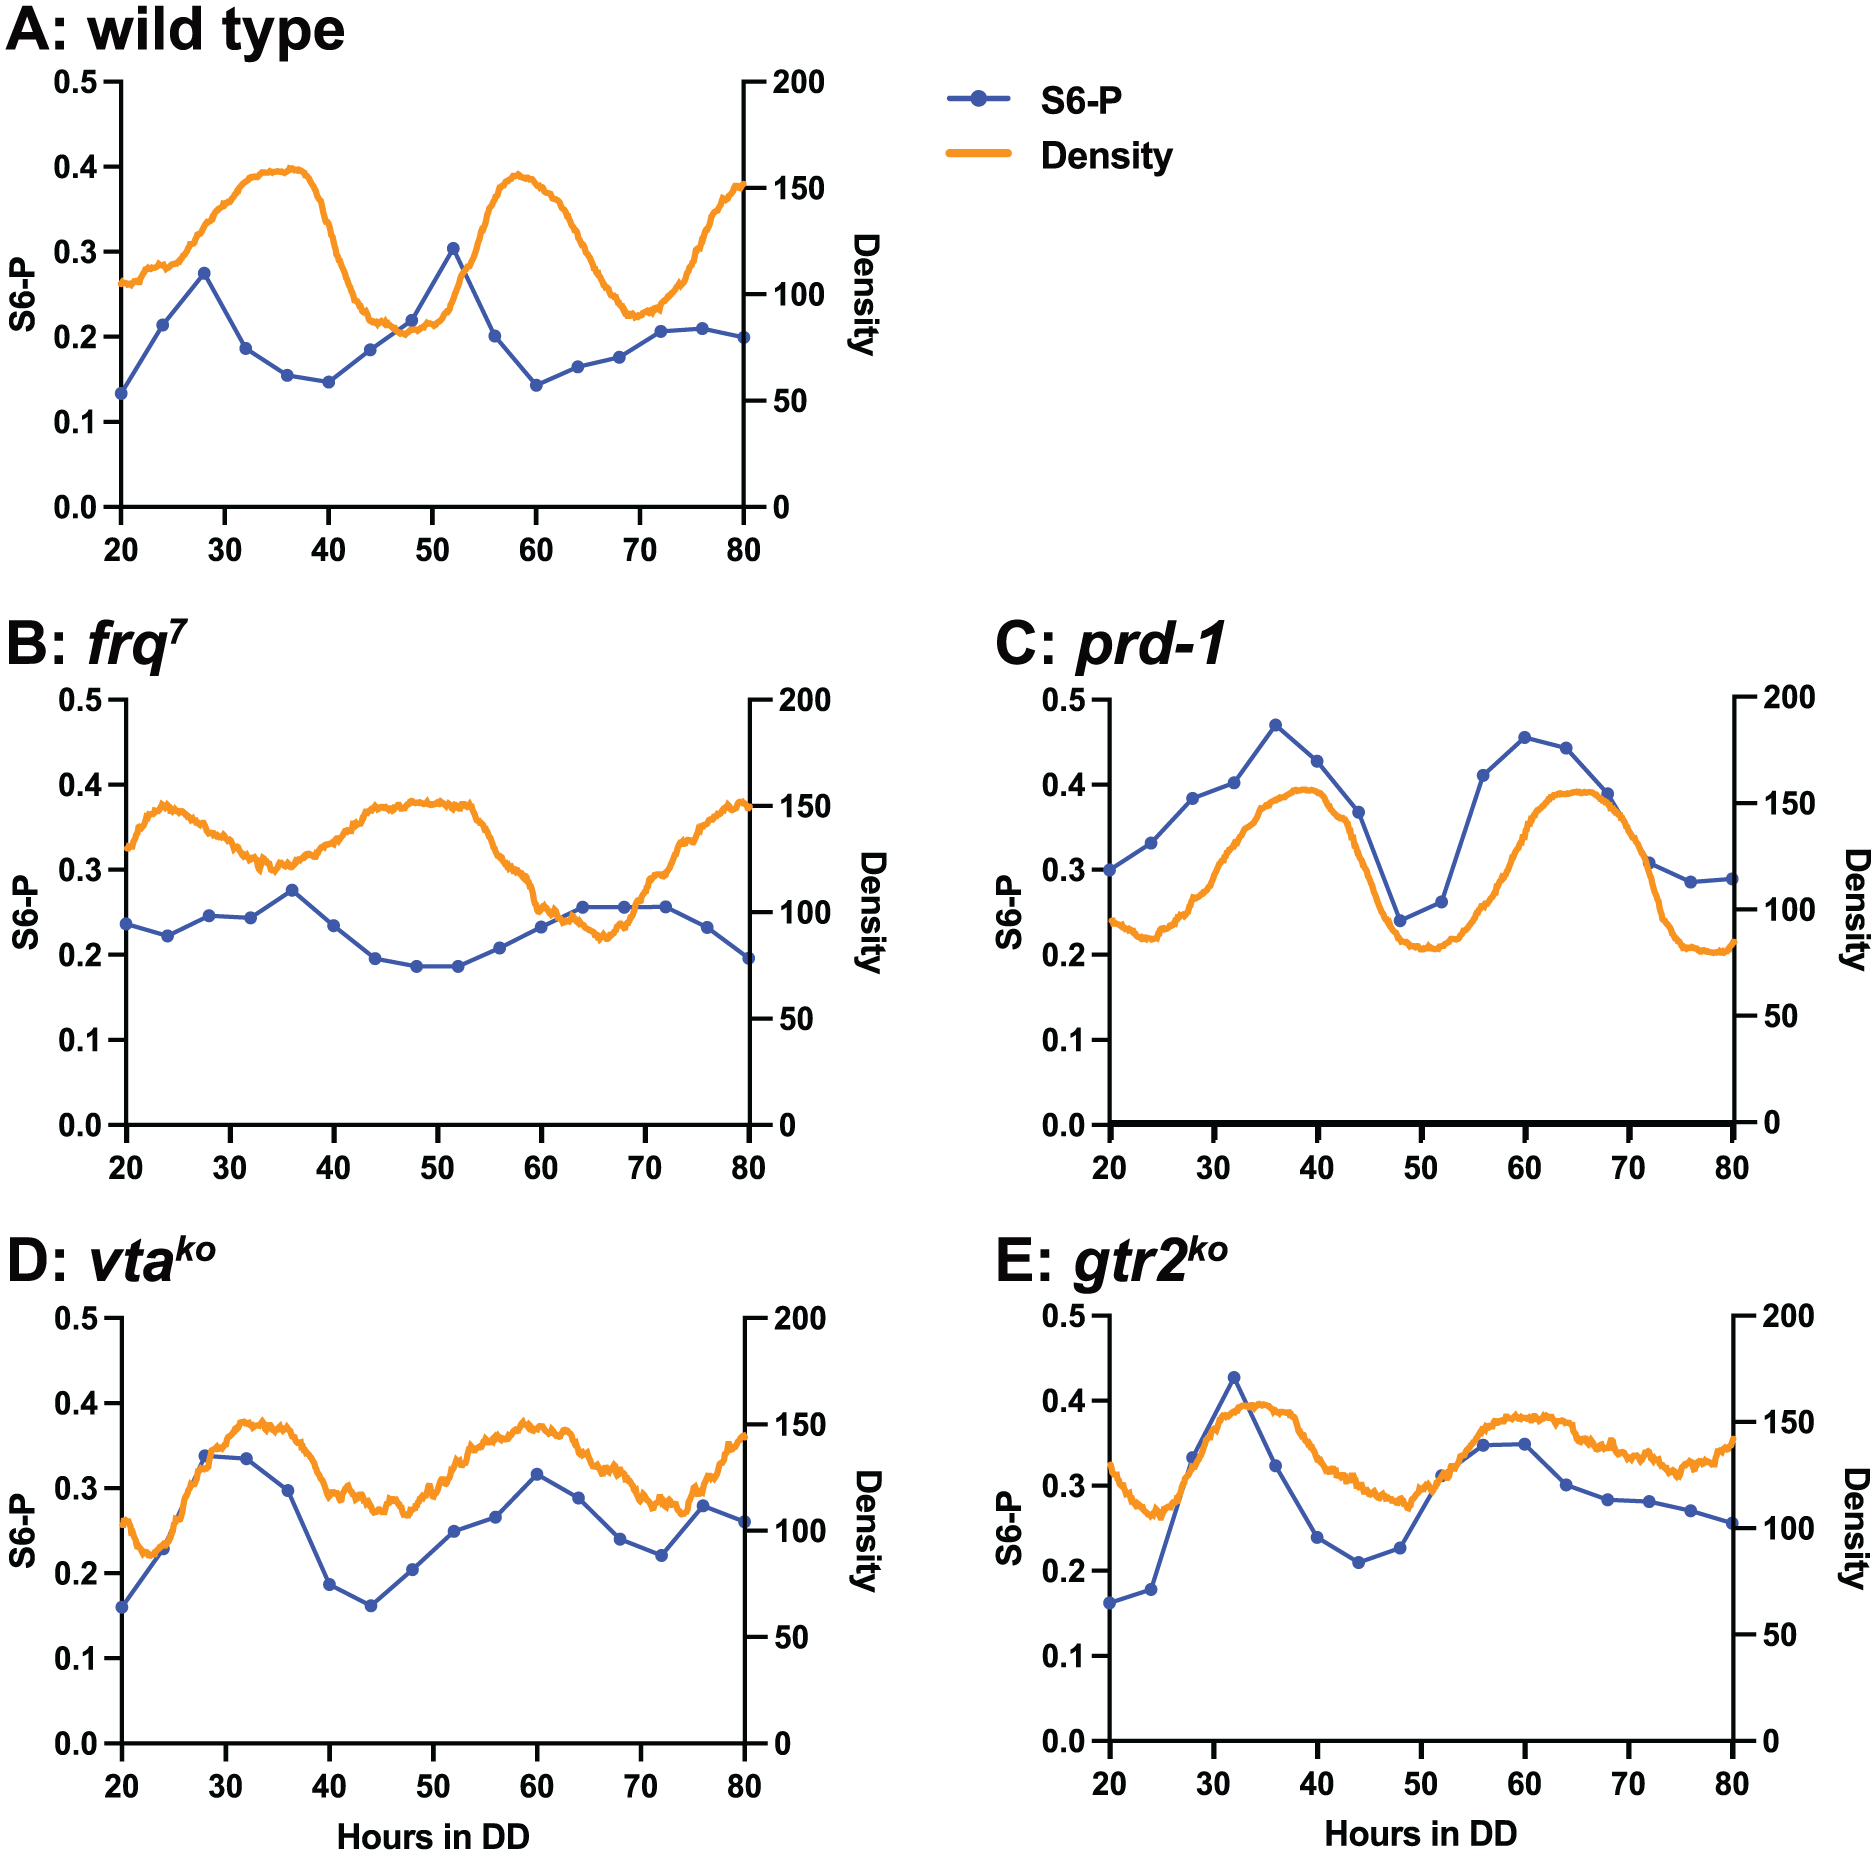
Conidiation density compared to S6P timecourses. Thick curves: Mean density of conidiation from scans of five replicate race tube cultures. Thin lines with plot symbols: S6P rhythm (top band as percent of total S6), mean of three biological replicates from Figures 2 and 3. a: wild-type; b: frq7; c: prd-1; d: vtako; E: gtr2ko.
Discussion
In this paper, we have developed and validated an assay for TOR activity based on phosphorylation of a FLAG-tagged TOR output target, ribosomal protein S6. This is an improvement over previous assays in several ways. It does not require an antibody specific for the phosphorylated form of either the S6 protein or an S6 kinase, but instead uses the commercially available anti-FLAG antibody. It reports all forms of S6, including the unphosphorylated form, allowing precise quantitation of the fraction of S6 in each phosphorylated form. This quantitation is independent of the total protein loading on the gel. Unlike the assay developed for Neurospora by Diernfellner et al. (2019), using a humanized S6 sequence expressed in an ectopic location from a high-expression promoter, our assay reports levels of the endogenous protein expressed in situ from its native promoter, and can be used to assay changes in S6 protein levels compared to total cellular protein as well as relative phosphorylation state.
Our results demonstrate a robust rhythm of TOR activity when assayed as the ratio of di-phosphorylated S6 (top band) to total S6 (Figure 2a and 2b, and Figure 3 left column). It is a formal possibility that the rhythm of S6 phosphorylation could be driven not by changes in TOR kinase activity but by changes in the activity of an unknown phosphatase, or by other unidentified rhythmic kinases acting on a pathway that converges on S6. However, our evidence suggests that the contribution of other kinases or phosphatases would be minor, based on the suppression of the amplitude of the rhythm by the vtako and gtr2ko mutants, which should affect only the activation of TOR.
A rhythmic pattern is also seen when either the top band or total S6 are calculated relative to total cellular protein (Figure 2c, and Figure 3 right column). This indicates that at the peak of TOR activity, there is both more S6 protein and a higher ratio of S6 phosphorylation. The rhythm of S6 protein amount could be driven by rhythmic synthesis or degradation or both; our results do not provide any insight into the mechanisms involved.
S6 is an integral component of the 40S ribosomal subunit (Shen et al., 2021) and therefore changes in total S6 relative to total protein can also be used to assess changes in total 40S ribosomal subunits relative to total protein. The rhythm we report in total S6 relative to total protein (Figure 2c) suggests a rhythm in ribosome abundance. A rhythm in ribosome biogenesis has been reported in other organisms such as mouse liver (Sinturel et al., 2017) and quiescent fibroblasts (Seinkmane et al., 2024), and a rhythm in ribosome numbers was confirmed in mouse liver (Sinturel et al., 2017) but was not seen in fibroblasts (Seinkmane et al., 2024).
The TOR rhythm is influenced by both the central component of the TTFL, the frq gene (as shown by the long-period S6P rhythm in frq7, Figure 3a and Table 1) and by mutations in the TOR pathway itself (as shown by the long periods and damping of the TOR rhythm in vtako and gtr2ko, Figure 3c and 3d and Table 1). The rhythm of conidiation, assayed as the density profile of cultures on race tubes, is closely correlated with the TOR rhythm, with respect to both period and amplitude (Figure 5).
The rhythm of TOR activity reported here in strains with functional frq genes fulfills several criteria for classifying it as a circadian rhythm: (1) the period is about 24 h; (2) the phase of the rhythm is set by the light-to-dark transition; and (3) the period is influenced by the frq gene, a known component of the circadian system. We have previously shown (Li et al., 2011; Eskandari et al., 2021) that components of the TOR pathway, VTA and GTR2, influence circadian rhythmicity: in vta and gtr2 knockout mutants, the rhythm of conidiation bands damps out (Suppl. Fig. S1), and the periods are longer than wild-type (Suppl. Table S1). We have also previously shown that the amplitude of the circadian oscillator is damped in the vta knockout, as assayed by phase-shifting responses to light pulses or heat pulses (Li et al., 2011). In our previous work we have seen that the phenotypes of vtako and gtr2ko are very similar, and we show here that TOR rhythmicity is also similar in these two strains (Figures 3 and 4). This suggests that these two gene products function in the same pathway to influence rhythmicity, with the implication that the TOR pathway is a regulator of circadian rhythmicity in Neurospora.
The TOR pathway is usually described as a nutrient-sensing pathway, stimulating growth and survival in eukaryotic cells by activating ribosome biogenesis and protein synthesis and inhibiting stress-activated pathways such as autophagy (Loewith and Hall, 2011; Saxton and Sabatini, 2017). Indeed, in our work we see an increase in TOR activity in response to high glucose and a decrease in response to short-term starvation for glucose (Figure 1b). Our data allow us to test the hypothesis that TOR activity directly correlates with growth and that changes in TOR activity would cause corresponding changes in growth. The analysis of growth rates compared to the mesor (average value across the timecourse) of S6P (Figure 4b and 4c) reveals unexpected relationships between TOR activity and growth. Surprisingly, Figure 4b presents an inverse relationship between linear growth rates of mutant strains on solid agar in race tubes and the average level of S6P across the circadian cycle. However, linear growth rate is not always correlated with mass increase, and indeed our data show a different relationship between TOR activity and the rate of mass increase (Figure 4c). The vtako and gtr2ko TOR pathway mutants do display increased mass accumulation with increased TOR activity, but this relationship may not hold for frq7 and is inverted for prd-1 which has the highest TOR activity and slowest growth. This suggests that TOR activation is not always driving growth rate under these long-term growth conditions, but conversely an unknown mechanism inhibiting growth in some mutant strains can create positive feedback to activate TOR.
One source of feedback that is well-documented (Eltschinger and Loewith, 2016) is the activation of TOR by protein synthesis inhibitors such as cycloheximide (CHX), which is believed to result from an increase in intracellular amino acid pools due to decreased protein synthesis. Intracellular amino acid levels can be sensed by the vacuolar-associated EGO complex in yeast, subsequently activating TOR through the Gtr1/Gtr2 complex. We have shown that in Neurospora the VTA protein (equivalent to a component of the yeast EGO complex) and the GTR2 protein (equivalent to yeast Gtr2) are required for the growth-promoting response to added amino acids (Ratnayake et al., 2018; Eskandari et al., 2021), suggesting the presence of a vacuole-localized amino acid sensing mechanism similar to yeast. If the prd-1 mutation acts at the level of protein synthesis to inhibit growth, then feedback through increased amino acid pools may increase TOR activity levels under conditions of restricted protein synthesis and restricted growth in this mutant.
Although VTA and GTR2 are required for stimulating growth in response to added amino acids in the presence of glucose (Ratnayake et al., 2018; Eskandari et al., 2021), the rates of mass increase and TOR activity of the knockout mutants on standard growth media are higher than the wild-type (Figure 4c). This indicates that TORC1 activity does not require the vacuolar localization function of VTA or the amino acid activation function of GTR2 in Neurospora on standard growth media. Knockouts of the gtr2 homologs in budding yeast and fission yeast are reported to have opposite effects: In S. cerevisiae, TOR activity decreases in a gtr2 knockout (Péli-Gulli et al., 2015), but in S. pombe, TOR activity is elevated in the knockout and the authors attribute its slow-growth phenotype to hyperactive TOR signaling (Chia et al., 2017). The amino acid sensing pathway that includes VTA and GTR2 in Neurospora may play a more subtle role in regulating TOR activity and providing feedback from downstream catabolic and anabolic processes.
The relationship between TOR activity and growth is also illuminated by the phase relationships between the conidiation density peaks and the TOR activity peaks (Figure 5). These peaks do not coincide, but rather the S6P peaks occur shortly before the conidiation density peaks. It must be remembered that the samples for analysis of S6P are harvested from the recently formed mycelium at the growth front on cellophane-covered agar plates, while the conidiation density is not measured until several days later when the race tubes have finished growth and the development of conidiospores is completed. Gooch et al. (2004) used time-lapse video to quantitate the rate of conidiation, as defined by the increase in density of the image of a band. They reported that the rate of conidiation is highest just before the density peak, which would coincide with the peak of TOR activity reported here. In this case, the rhythmic activation of TOR may be driving the protein synthesis increase needed for conidiospore development.
Our results focus on ribosomal protein S6 as a target for phosphorylation downstream of TOR. Another well-characterized target of TOR in yeast is Tap42 (Loewith and Hall, 2011). When TOR is active, Tap42 is phosphorylated and it binds to and inhibits phosphatases including Sit4 (Di Como and Arndt, 1996). The translation initiation factor eIF2α is inactive when phosphorylated and can be activated through dephosphorylation by several phosphatases including Sit4 (Cherkasova et al., 2010). The Bell-Pedersen lab has studied rhythmic translation in Neurospora and has found rhythmic activation of eIF2α that is dependent on rhythmic activity of the kinase CPC-3 (homologous to GCN2 in yeast) and the phosphatase PPP-1 (Karki et al., 2020; Ding et al., 2021; Preh et al., 2025). As suggested by Karki et al. (2020), it remains a possibility that other phosphatases including Sit4 could also participate in regulation of eIF2α activity. In Neurospora grown in DD without added stress, eIF2α does not control global translation, but rather a subset of specific mRNAs; intriguingly, some mRNAs whose translation is dependent on P-eIF2α have 5’ sequences suggesting translational activation by TOR (Castillo et al., 2022). Rhythmic TOR activity might therefore contribute to rhythmicity of translation initiation (James and O’Neill, 2025). Effects of TOR rhythmicity on translation may be a route through which TOR influences circadian rhythmicity by contributing to regulation of levels of clock-affecting proteins.
We have previously shown (Ratnayake et al., 2018; Eskandari et al., 2021) that the rhythm of FRQ protein amount and phosphorylation damps out in the vtako and gtr2ko mutant strains, indicating that normal TOR signaling is required to sustain FRQ protein rhythmicity. Diernfellner et al. (Diernfellner et al., 2019) reported a connection between TOR and FRQ protein in Neurospora: In response to protein synthesis inhibition by CHX, the checkpoint kinase PRD-4 is phosphorylated by TOR and in turn phosphorylates FRQ. Phosphorylation of FRQ by PRD-4 is also activated by DNA damage (Pregueiro et al., 2006; Diernfellner et al., 2019). A gain-of function mutation of prd-4 decreases the period of the circadian conidiation rhythm (Gardner and Feldman, 1981; Pregueiro et al., 2006; Li and Lakin-Thomas, 2010), but deletion of prd-4 does not affect the circadian period (Pregueiro et al., 2006) and therefore the PRD-4 gene product appears to be inactive in the absence of stress. The pathway through which TOR signaling influences FRQ protein under normal conditions therefore remains to be elucidated.
A recent paper (Kelliher and Dunlap, 2025) has reported the effects of the vtako and gtr2ko mutants on transcriptional control at the frq locus. Although the text and title of the paper suggest otherwise, the data are consistent with our previously published work. These authors assayed rhythmic expression of a fragment of the frq gene promoter region driving a luciferase reporter, and compared wild type with the vtako and gtr2ko mutants. Their data show a significant increase in the level of expression of the reporter in cultures of in vtako and gtr2ko mutants in a low glucose medium, and much higher expression levels (up to 3-fold higher than wild type) in higher glucose medium. As described above, we have reported (Ratnayake et al., 2018; Eskandari et al., 2021) that FRQ protein levels are significantly reduced in these mutants compared to wild type. In the Neurospora TTFL, FRQ protein inhibits transcription from the frq promoter, and therefore a reduction in FRQ protein levels would be predicted to lead to an increase in expression from the frq promoter, which is what these authors reported. These results therefore support our interpretation that TOR signaling influences the functioning of the TTFL in Neurospora. Interestingly, this also serves as another example of the lack of correlation reported between transcriptional activity and protein levels of clock-related genes in Neurospora (Hurley et al., 2018): although transcriptional activity at frq is apparently high in the TOR mutants, FRQ protein amounts are low, indicating regulation of FRQ protein expression at the post-transcriptional level.
The TOR pathway incorporates several feedback mechanisms (Eltschinger and Loewith, 2016) that could potentially contribute to the construction of a self-sustaining oscillator, and we have developed this idea (Lakin-Thomas, 2023) to propose that TOR could be the basis of a TTFL-less oscillator. If TOR is a rhythmic state variable of an oscillator, rather than merely an essential constant parameter, it needs to meet several criteria (Roenneberg and Merrow, 1998; Lakin-Thomas, 2023). One criterion for TOR to play such a fundamental role in circadian timekeeping is for TOR activity to be rhythmic, which we have now demonstrated. We have previously shown that normal TOR signaling is required as an input to sustain FRQ protein rhythmicity (Ratnayake et al., 2018; Eskandari et al., 2021), satisfying the criterion of TOR affecting clock properties; we demonstrate here that a mutation in frq affects the TOR rhythm, satisfying the criterion of TOR responding as an output of the clock. Another criterion is that maintaining the rhythmicity of the circadian system would require rhythmicity of TOR activity, rather than simply a permissive constant level of TOR activity. Our results meet these criteria and implicate TOR activity as a rhythmic state variable of the complete circadian system. There are reports in the literature of rhythmic TOR activity in tissues of complex organisms that could be driven by rhythms of feeding or signals from other tissues, for example in Arabidopsis (Urrea-Castellanos et al., 2022) and the SCN of the mammalian brain (Cao et al., 2011), but few examples of cell-autonomous rhythmicity in TOR activity under constant conditions: in mouse embryonic fibroblasts (Wu et al., 2019), quiescent adult mouse fibroblasts (Stangherlin et al., 2021), a human breast cancer cell line (Zhang et al., 2018), and chicken retina photoceptor cell cultures (Huang et al., 2013). In none of these cells has TOR rhythmicity yet been demonstrated to be essential to the circadian system. Our demonstration of a robust and essential rhythm of TOR activity in Neurospora, a relatively simple organism under constant conditions, coupled with our detailed understanding of the Neurospora TTFL and the cell and molecular tools available, establishes this system as a valuable model for investigating the role of TOR as a potential oscillator and as a component of the eukaryotic circadian system.
Supplemental Material
sj-pdf-1-jbr-10.1177_07487304251393577 – Supplemental material for Rhythmicity of TOR (Target of Rapamycin) Activity Supports Circadian Function in Neurospora crassa
Supplemental material, sj-pdf-1-jbr-10.1177_07487304251393577 for Rhythmicity of TOR (Target of Rapamycin) Activity Supports Circadian Function in Neurospora crassa by Golnoush Akhtari, Milad Falahat Chian, Ethan Myles Sooklal and Patricia Lakin-Thomas in Journal of Biological Rhythms
Footnotes
Acknowledgements
Technical assistance by Shahrzad Rahmani and Arghavan Sammak is gratefully acknowledged. We thank the Fungal Genetics Stock Center, Kansas State University, for plasmids and strains. This work was supported by the Natural Sciences and Engineering Research Council of Canada (grant number RGPIN-2017-05664).
Author Contributions
G.A. (Investigation, Formal Analysis, Writing—Original Draft Preparation, Writing—Review & Editing): carried out timecourse experiments and statistical analyses and wrote the first draft of the manuscript. M.F.C. (Methodology, Writing—Review & Editing): created the S6-FLAG construct and developed the S6 phosphorylation assay. E.M.S. (Investigation, Writing—Review & Editing): contributed to assay validation. P.L.-T. (Conceptualization, Funding Acquisition, Supervision, Writing—Review & Editing): provided funding, designed experiments, and wrote the final draft.
Conflict of Interest Statement
The authors have no potential conflicts of interest with respect to the research, authorship, and/or publication of this article.
Data Availability
Numerical data underlying graphs can be found in Spreadsheet S1.
Ethical Considerations
Ethical approval was not required.
Consent to Participate
Not applicable.
Consent for Publication
Not applicable.
Notes
References
Supplementary Material
Please find the following supplemental material available below.
For Open Access articles published under a Creative Commons License, all supplemental material carries the same license as the article it is associated with.
For non-Open Access articles published, all supplemental material carries a non-exclusive license, and permission requests for re-use of supplemental material or any part of supplemental material shall be sent directly to the copyright owner as specified in the copyright notice associated with the article.