
Abstract
The circadian clock maintains oscillations in gene expression with a 24-hour periodicity in nearly every cell of the body and confers rhythmic patterns to many aspects of behavior and physiology. The presence of circadian rhythms in tumors leads to the question of whether tumors may respond differently to chemotherapy given at different times of day. We addressed this question using a male mouse model of hepatoma by treating mice in the morning (ZT2) or evening (ZT14) with cisplatin, and measuring gross effects on body weight, blood counts and chemistry, gene expression, and cellular proliferation. We found that among cisplatin-treated mice, there was a reduction in expression of the proliferation marker protein Ki-67 in tumors of mice treated at ZT14 as compared to ZT2. Corresponding hepatotoxicity, as measured by elevated serum alanine aminotransferase (ALT), and body weight loss were also reduced at ZT14. Overall gene expression at ZT14 was more similar to healthy liver than expression at ZT2. Mitogen-activated protein kinase (MAPK) and Ras-related protein-1 (Rap-1) signaling pathways were specifically downregulated in tumors following treatment at ZT14, which may be related to the decreased proliferation, at this treatment time. These findings align with the possible use of timed chemotherapy to enhance drug efficacy.
The circadian clock exists in nearly every cell of the body as oscillations of gene expression, metabolism and cellular function. This clock is driven by transcription–translation–degradation feedback loops among core clock genes and proteins which in turn control rhythmic expression of many downstream circadian-controlled genes. In our prior investigation, 1353 circadian-controlled genes were identified in mouse liver (Yang et al., 2023). In the mammalian circadian clock, circadian locomotor output cycles kaput (CLOCK) and aryl hydrocarbon receptor nuclear translocator-like (BMAL1) form a heterodimer that activates the transcription of Cryptochrome (Cry) and Period (Per) genes. The resulting CRY:PER complex inhibits the transcriptional activity of the CLOCK:BMAL1 complex, thereby repressing their own expression. Retinoic acid receptor-related orphan receptors (RORs) and REV-ERBs, encoded by the Nr1d1 and Nr1d2 genes, are nuclear receptors that form a secondary feedback loop. They are regulated by CLOCK:BMAL1 and, in turn, activate (RORs) or repress (REV-ERBs) the transcription of Bmal1. (Cao et al., 2021; Chiou et al., 2016; Doruk et al., 2020; Partch et al., 2014; Reppert and Weaver, 2002; Rosbash, 2021; Rosensweig and Green, 2020; Stratmann et al., 2012; Ye et al., 2011, 2014). Within each tissue, expression of circadian-controlled genes oscillates with rhythms determined by core clock proteins and tissue-specific and other factors, resulting in peak expression of different genes at different times of day in different tissues. Most circadian-controlled genes, in tissues such as the liver, exhibit peak expression at pre-dawn or pre-dusk hours (Yang et al., 2018). Rhythmicity among tissues is influenced by signals from the suprachiasmatic nucleus, the “master clock,” as well as other factors such as feeding (Filipski et al., 2005; Mange et al., 2017; Weger et al., 2021). Photic input from the eyes to the suprachiasmatic nucleus is important in synchronizing the organism’s clocks to the external light-dark cycle.
Interestingly, the clock may influence the status of pathological states. For example, the immune response to endotoxin exposure and the recovery from hepatectomy in rodents were found to vary depending upon the time of day of endotoxin exposure or hepatectomy (Halberg et al., 1960; S. Wei et al., 2022). In cancer, the question of whether tumor cells exhibit circadian rhythmicity has been of interest since rhythmicity could have a role in the disease state. Furthermore, any rhythmicity of tumors and differences in the rhythmic behavior of tumors and the host could provide opportunities for chronotherapy, in which patients are treated at a time of day that favors maximal toxicity to cancer cells with minimal side effects (Lee et al., 2021; Printezi et al., 2022; Tapp et al., 2025). In the various experimental systems that have been employed to date, rhythmicity of circadian genes in tumor cells has been found to range from normal to absent to altered in expression pattern and amplitude compared to healthy tissue (Altman, 2016; Comas et al., 2014; Filipski et al., 2004; Lee et al., 2021; Masri et al., 2016; Yang et al., 2018, 2019, 2021). In a fairly comprehensive investigation, we utilized a mouse model of hepatoma (Aitken et al., 2020; Connor et al., 2018) and measured gene expression genome-wide in tumors and healthy liver at time points throughout the day (Yang et al., 2023). In tumors, components of the core clock, such as BMAL1 and PER2, as well as some downstream circadian-controlled genes, such as Wee1 and Sntg1, were found to retain rhythmic behavior as in healthy liver. However, many circadian-controlled genes also became arrhythmic in tumor cells, or assumed altered rhythmic behavior, and surprisingly, many genes not rhythmic in healthy liver demonstrated rhythmicity in cancerous liver (Yang et al., 2023). Thus, the rhythmicity of tumor cells may be important to the neoplastic state although not critical since mice lacking a functional clock develop cancer (Ozturk et al., 2009; Sancar et al., 2014). The presence of rhythmicity in tumor cells, and differences in rhythmicity between tumor and healthy cells raise the possibility of a time of day when therapeutics could be more efficient against the tumor with less side effects against healthy tissue.
In this study, we have utilized the mouse model of hepatoma noted above to analyze the status of the mouse host and cancer cells following a 2-week treatment regimen with the anticancer drug cisplatin given either at Zeitgeber Time 2 (ZT2) or ZT14, which corresponds to 2 hours after lights on and 2 hours after lights off, respectively, in a 12-hour light/dark cycle. Body weights, blood cell counts and chemistry, proliferation status and gene expression were measured. Mice treated with cisplatin at ZT14 showed profiles in gene expression that were overall more similar to healthy liver than mice treated at ZT2. Also, mice that were treated at ZT14 showed less toxicity in that they did not lose as much weight, and their blood tests showed less hepatotoxicity compared to mice treated at ZT2. Notably, we found that antigen Kiel-67 (Ki-67) expression in tumors was lower when mice were treated at ZT14 as compared to ZT2.
Experimental Procedures
Mouse Model
C3H/HeOuJ mice were purchased from Jackson Laboratory (Bar Harbor, ME) and bred at the University of North Carolina School of Medicine. Mice were maintained on a 12 h:12 h light:dark schedule throughout the experiments. ZT was used to define time points, with ZT0 corresponding to lights on and ZT12 to lights off. Animal studies were approved by the Institutional Animal Care and Use Committee (IACUC) of the University of North Carolina School of Medicine.
To induce hepatocarcinogenesis, 14-day-old (P14) male C3H/HeOuJ mice received a single intraperitoneal (IP) injection of diethylnitrosamine (DEN; Sigma-Aldrich N0258), diluted in 0.85% sterile saline solution, at a dose of 20 mg/kg body weight. This well-established protocol consistently results in hepatic tumor development by 25 weeks postinjection (Aitken et al., 2020; Connor et al., 2018). Male mice were exclusively used in this study due to their higher susceptibility to DEN-induced hepatocarcinogenesis, attributed to more efficient biotransformation of DEN to its ultimate carcinogenic metabolite compared to females (Nakatani et al., 2001).
Cisplatin Treatment
Cisplatin (prepared as 1 mg cisplatin and 9 mg sodium chloride in one ml water for injection, Fresenius Kabi Pharmaceutical company) was administered by IP injection at 2.5 mg cisplatin/kg using the dosing schedule described in Figure 1.
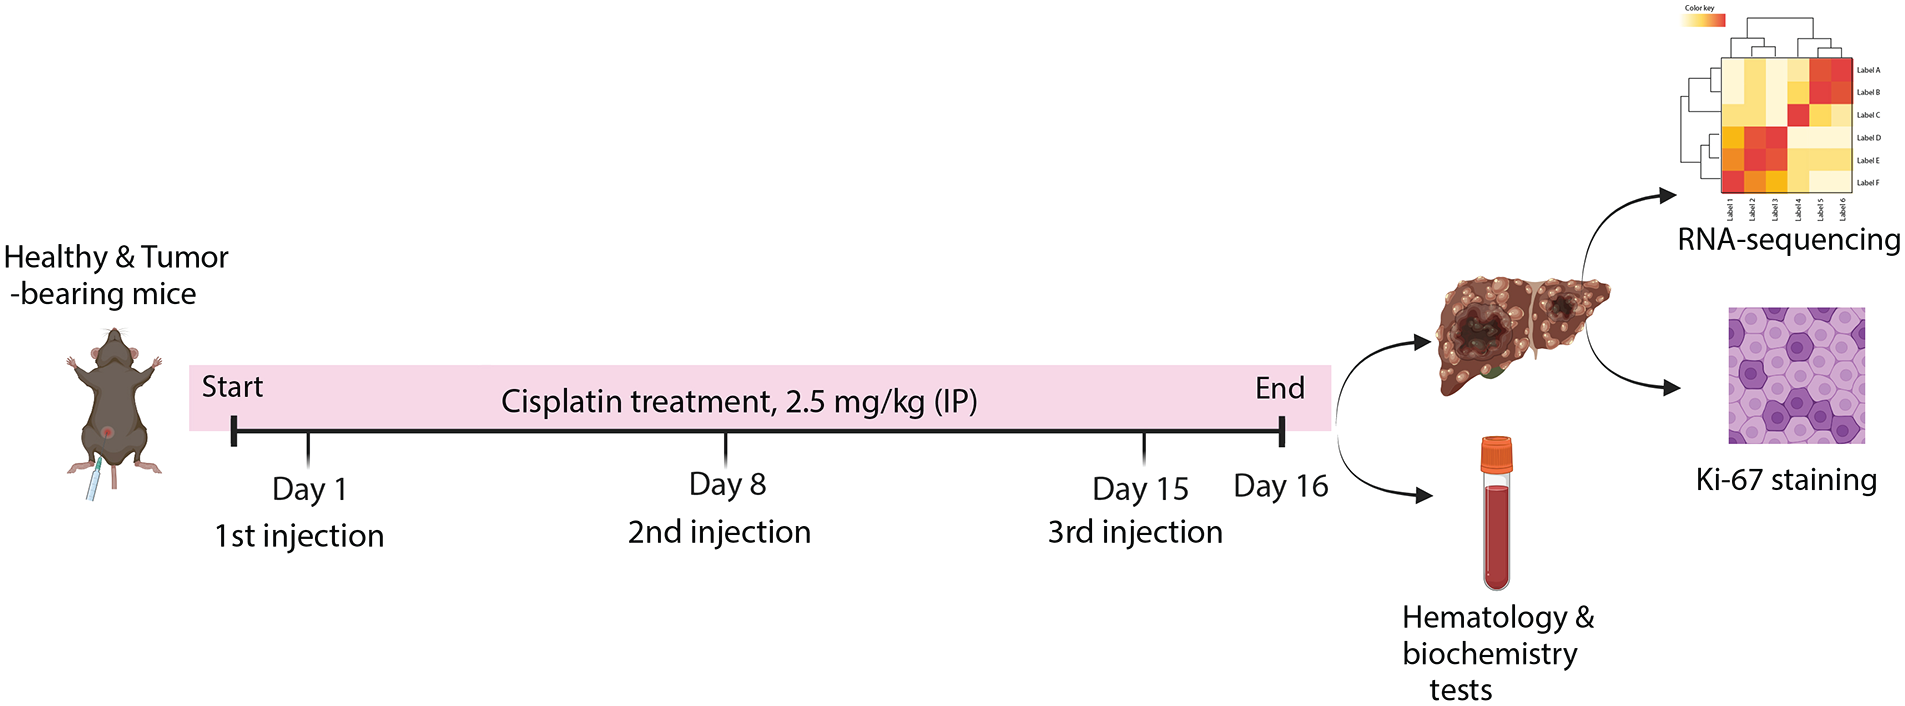
Experimental design for evaluating the chronotherapeutic efficacy of cisplatin in healthy and tumor-bearing mice. Mice were treated with cisplatin (2.5 mg/kg) via intraperitoneal injection either at circadian time point ZT2 or ZT14. The treatment schedule included three injections over 15 days (on days 1, 8, and 15). Mice were weighed throughout the study to monitor for treatment-associated toxicity. On day 16, animals were euthanized at ZT8 to avoid confounding time-of-day effects, and samples were collected for downstream analyses. Whole blood was processed for analysis, and livers were harvested for RNA sequencing (RNAseq) and Ki-67 immunohistochemistry.
Measurements
To evaluate general toxicity in mice, changes in body weight were monitored, and hematological and biochemical parameters were analyzed. For histological analyses, liver samples were collected at terminal necropsy and fixed in 10% formalin solution. For histological analyses, entire liver was used, and for the RNA sequencing (RNAseq), tumors were resected and separated from the healthy tissue. Relative liver weight (%) was calculated by dividing the liver weight (g) by the corresponding body weight (g) and multiplying the resulting ratio by 100.
Complete Blood Counts and Serum Biochemistry
Blood was collected under CO2 anesthesia via cardiac puncture into heparinized tubes for anticoagulation, and a complete blood count (CBC) was conducted using the IDEXX ProCyte Dx™ Hematology Analyzer on whole blood samples. Parameters assessed included white blood cells (WBCs), total lymphocytes (LYM), mid-sized cells (MID), granulocytes (GRAN), red blood cells (RBCs), hemoglobin (HGB), hematocrit (HCT), mean corpuscular volume (MCV), mean corpuscular hemoglobin (MCH), mean corpuscular hemoglobin concentration (MCHC), red cell distribution width (RDW), platelets (PLTs), plateletcrit (PCT), mean platelet volume (MPV), platelet distribution width (PDW), and platelet larger cell ratio (P-LCR).
Biochemical parameters [alkaline phosphatase (ALP), alanine aminotransferase (ALT), aspartate transaminase (AST), blood urea nitrogen (BUN), creatinine (CRET)] were measured in serum using the Alfa Wasserman Vet Axcel® Chemistry System with standard test slides.
Immunohistochemistry
Formalin-fixed paraffin-embedded tissue sections were stained using a Ki-67 antibody (Abcam #ab16667) at a dilution of 1:500 and were also stained with Hematoxylin plus bluing reagent to identify total nuclei. Images were taken at the Pathology Services Core (University of North Carolina at Chapel Hill) at 20× resolution. Ki-67 staining was viewed using ImageJ software. Fields of view were selected to include only tumor tissue. Tumor tissue was readily identified based upon both a higher density of nuclei and the presence of Ki-67 staining nuclei as compared to surrounding tissue. Also, a well-defined margin separated the tumors from healthy tissue. Three slices per mouse liver were stained (with different tumors in each slice), and one random field per slice was counted. Fields of view were selected in a blinded manner. Total nuclei were counted by ImageJ, and Ki-67 positive nuclei were counted manually in a blinded manner. The percentage of Ki-67-positive nuclei was calculated by dividing the number of positively stained cells by the total number of cells and multiplying by 100. Results were averaged across all three fields for each sample to determine the proliferation index for each animal. With three fields per sample, one sample per mouse, nine mice at ZT2 and eight mice at ZT14, there were 51 fields from 17 samples counted. The aforementioned numbers reflect the total of two experiments; in experiment one there were five mice at ZT2 and four mice at ZT14, in the second experiment there were four mice at ZT2 and four mice at ZT14.
RNA Sequencing
Total RNA was isolated using the RNeasy Mini Kit (Qiagen). Isolation was performed according to the manufacturer’s specification. The purification included a DNase treatment using the RNase free DNase Set (Qiagen). The yield and purity of the RNA was measured using Nanodrop.
The quality of the data was checked using FastQC (version 0.12.1) (Wingett and Andrews, 2018), and sequence alignment was accomplished with Bowtie2 (version 2.4.5) (Langmead and Salzberg, 2012) using non-deterministic, met-stderr, sensitive, and the Ensembl mouse genome. Samtools (version 1.19.2) (Li et al., 2009) view and sort was used after alignment to create sorted bam files. Subreads (version 2.0.3) (Liao et al., 2014) feature count function was used to quantify gene expression levels for the paired end reads, making sure that gene symbol, rather than Ensemble ID were used for annotation. Differential gene expression analysis was performed in R (version 4.3.1) using DESeq2 (version 1.40.2) (Love et al., 2014). We used the contrast function within lfcshrink to get the differentially expressed genes for each comparison and used a DE cutoff of an adjusted p value of ≤0.05. For visualization, principal component analysis (PCA) plots and volcano plots were created using ggplot2 (version 3.4.4) (Gómez-Rubio, 2017), heatmap was generated using pheatmap (version 1.0.12), and UpSet plots were created using UpSetR (version 1.4.0) (Conway et al., 2017).
We used AnnotationDBI (version 1.64.1) and Org. Mm.eg.eb (version 3.18.0) to map gene symbols from the DESeq2 results to the Entrez IDs. The DESeq2 results, with the fold changes and Entrez IDs, were used to perform overrepresentation analysis using enrichKEGG function within the R package ClusterProfiler (version 4.8.3) (Yu et al., 2012). Overrepresentation analysis only used genes with an adjusted p value cutoff ≤0.05. EnrichGO looked at biological processes, we used the parameter readable = True so we could map Gene ID to Gene symbol and used Benjamini-Hochberg (BH) p value adjustment method with a q-value cutoff of 0.05. We used the results from the overrepresentation analysis to generate bar plots of significant terms for KEGG pathways.
Statistical Analysis
Statistical analyses were conducted using GraphPad Prism version 10.00 (GraphPad Software, USA). Differences between groups were assessed with one-way analysis of variance (ANOVA) with Tukey’s post-test and Student’s t-test, considering a p value of <0.05 as statistically significant. Results are expressed as means ± standard error of the mean (SEM).
Results
Mouse Model and Experimental Design
We used an established model in which mice injected with DEN at 15 days of age develop multifocal hepatic tumors by 25 weeks of age (Aitken et al., 2020; Connor et al., 2018). Tumors stain positive for the proliferation marker Ki-67, unlike healthy liver which is Ki-67 negative, and tumor-bearing livers display disrupted hepatic architecture in hematoxylin and eosin (H&E) stained sections (Aitken et al., 2020; Yang et al., 2023).
To evaluate the chronotherapeutic efficacy of cisplatin, we implemented a treatment regimen in both healthy and tumor-bearing mice (Figure 1). In this model, genes rhythmic in tumors but not healthy liver were found to exhibit a broad range of peak gene expression times around early day, ZT2 to ZT8, in contrast to genes rhythmic in liver but not tumor, which exhibited peak expression times predominantly at predawn (ZT20-21) and predusk (ZT7-10) hours (Yang et al., 2023). We selected injections times of either ZT2 or ZT14 which correspond roughly to the beginning and end of the peak expression phase in the tumors. Cisplatin was administered intraperitoneally at either ZT2 or ZT14 at 2.5 mg/kg, the highest dose possible that would avoid excessive weight loss considering our preliminary results in which we tested a higher dose. In our dose-selection study, tumor-bearing C3H mice injected with a single dose of 5 mg/kg (i.p.) cisplatin showed a significant body weight decrease (10–18%) within 3 days (unpublished data). To adhere to ethical limits regarding body weight loss, we used a lower dose of cisplatin. The treatment schedule consisted of three injections over a 15-day period (days 1, 8, and 15). Animals were weighed during the treatments, and were euthanized on day 16, with whole blood collected for serum analysis and liver tissue harvested for RNAseq and Ki-67 immunohistochemistry. Samples were collected at the same time of day on day 16 (at ZT8) for all groups, to eliminate time-of-day variations in these parameters so as to focus on the effects related to the timing of treatment.
Body Weight, Hematology, and Blood Chemistry Following Cisplatin Treatment
Body weights measured during the treatment regimen (Figure 2a) and at the end of treatment (Figure 2b) indicate that while the untreated (no cisplatin) tumor-bearing and tumor-free mice demonstrated minimal weight gain (about 2%) during the study, cisplatin treatment was associated with weight loss. The effect was greatest among mice treated at ZT2, which lost up to 10% of body weight as compared to their weight on day 1 of treatment (Figure 2a and 2b). More modest reductions in body weights were observed in tumor-bearing mice treated at ZT14, and healthy mice treated with cisplatin at both ZTs. Liver weights, as percent of total body weight at sacrifice are shown in Figure 2c. Notably, liver weights increased with the presence of tumors. Increased liver weight was most pronounced in untreated mice and mice treated at ZT2; cisplatin treatment at ZT14 was associated with lower liver weight gain (p = 0.05; ZT2 vs ZT14 cisplatin-treated tumor).
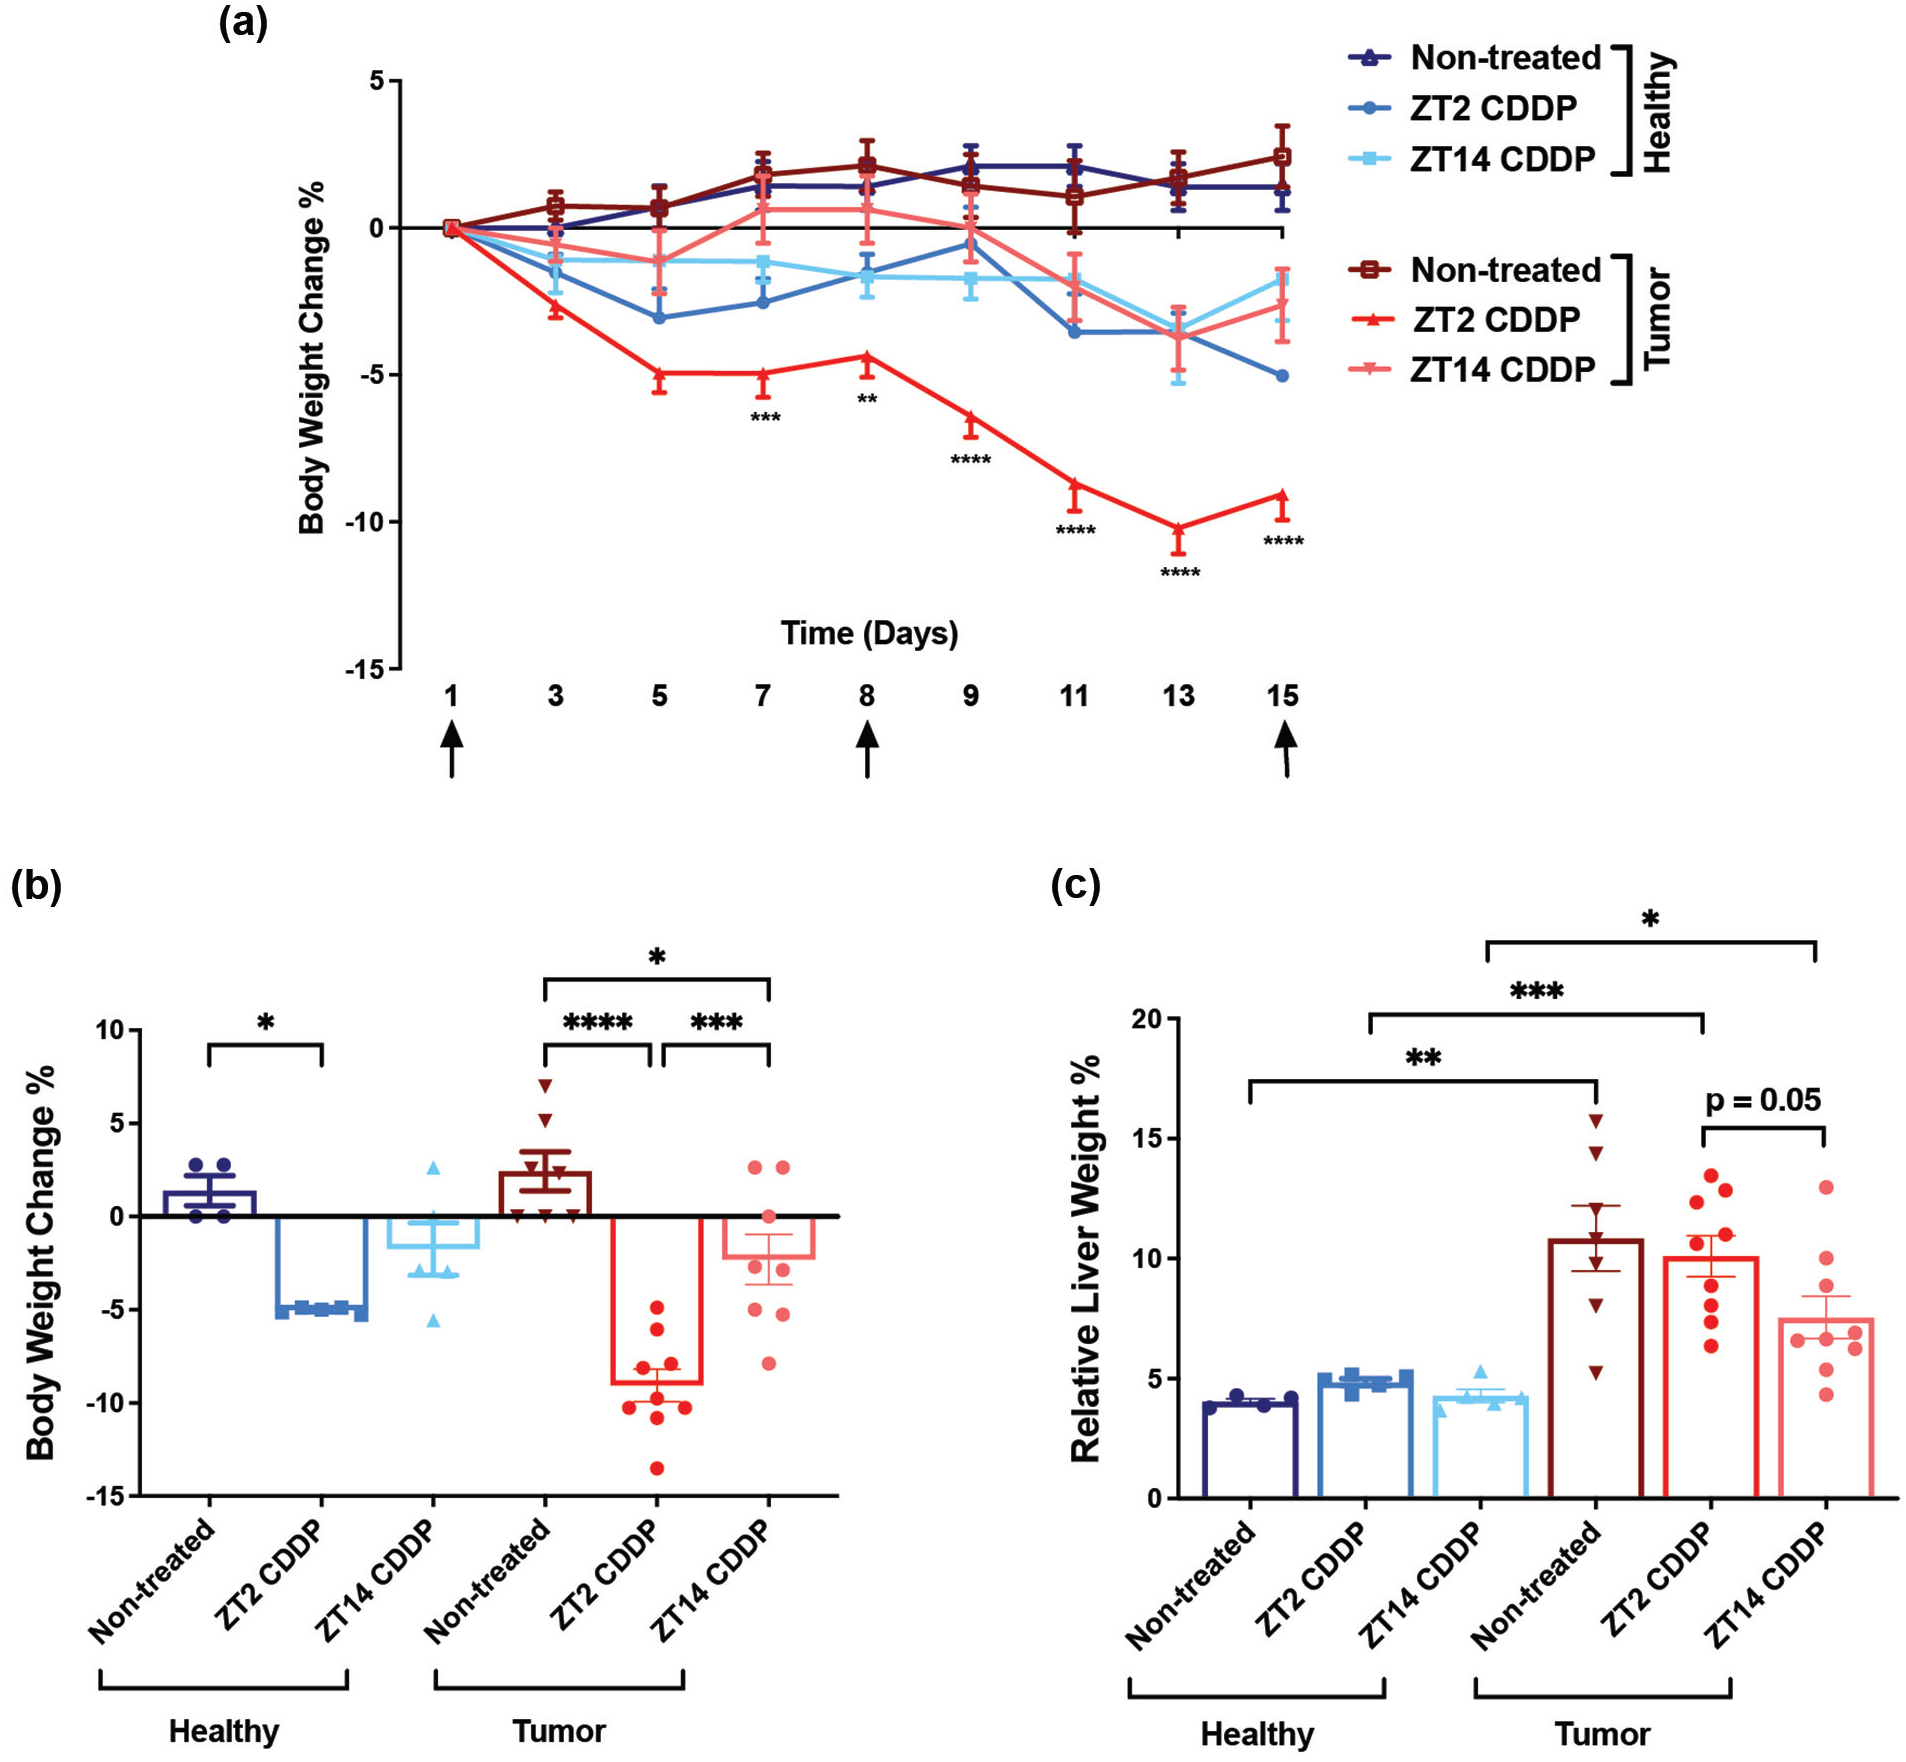
Toxicity of cisplatin in tumor-bearing (+DEN) and healthy (−DEN) C3H mice as a function of circadian dosing time. CDDP, cisplatin. (a) Time-course of body weight changes (%). N = 4 for non-treated healthy mice; n = 5 for CDDP-treated healthy mice at ZT2 and ZT14; n = 7 for non-treated tumor-bearing mice; n = 9 for CDDP-treated tumor-bearing mice at ZT2; and n = 8 for CDDP-treated tumor-bearing mice at ZT14. Data were analyzed by two-way ANOVA with Bonferroni’s multiple comparisons test; **p < 0.005, ***p < 0.001, ****p < 0.0001. “↑” indicates the cisplatin treatment days. (b) Body weight change (%) on the last day of the treatment regimen (day 16) compared to the first day. Data were analyzed by Student’s t-test; *p < 0.05, ***p < 0.001, ****p < 0.0001. (c) Relative liver weight (as % of body weight) measured following euthanasia on day 16. Data were analyzed by Student’s t-test; *p < 0.05, **p < 0.005, ***p < 0.001.
The tumor burden produced no overt effects on blood chemistry (Figure 3a) or hematology (Figure 3b) except in the case of elevated ALT (alanine transaminase) and PLTs in tumor-bearing mice. Elevated ALT, a test specific for liver function, is consistent with the presence of hepatomas. AST is another cytosolic liver enzyme used in blood tests of hepatocellular toxicity (Karimkhanloo et al., 2023; Tang et al., 2020). Our results in Figure 3a showed that AST levels in contrast to ALT levels did not vary as a function of tumor burden or cisplatin treatment. Toxicity detected by ALT but not AST has been observed previously (Karimkhanloo et al., 2023). Isoforms of ALP originate from multiple tissues, and also did not vary as a function of tumor burden or cisplatin treatment, so we focused on the ALT serum biochemistry results as an indicator of hepatotoxicity. Interestingly, cisplatin treatment at ZT14 was associated with a significant reduction of ALT level, while treatment at ZT2 was not. Thus the liver weights and ALT levels show parallel patterns, and the reduced liver weights and ALT levels at ZT14 are consistent with a greater efficacy of cisplatin at ZT14.
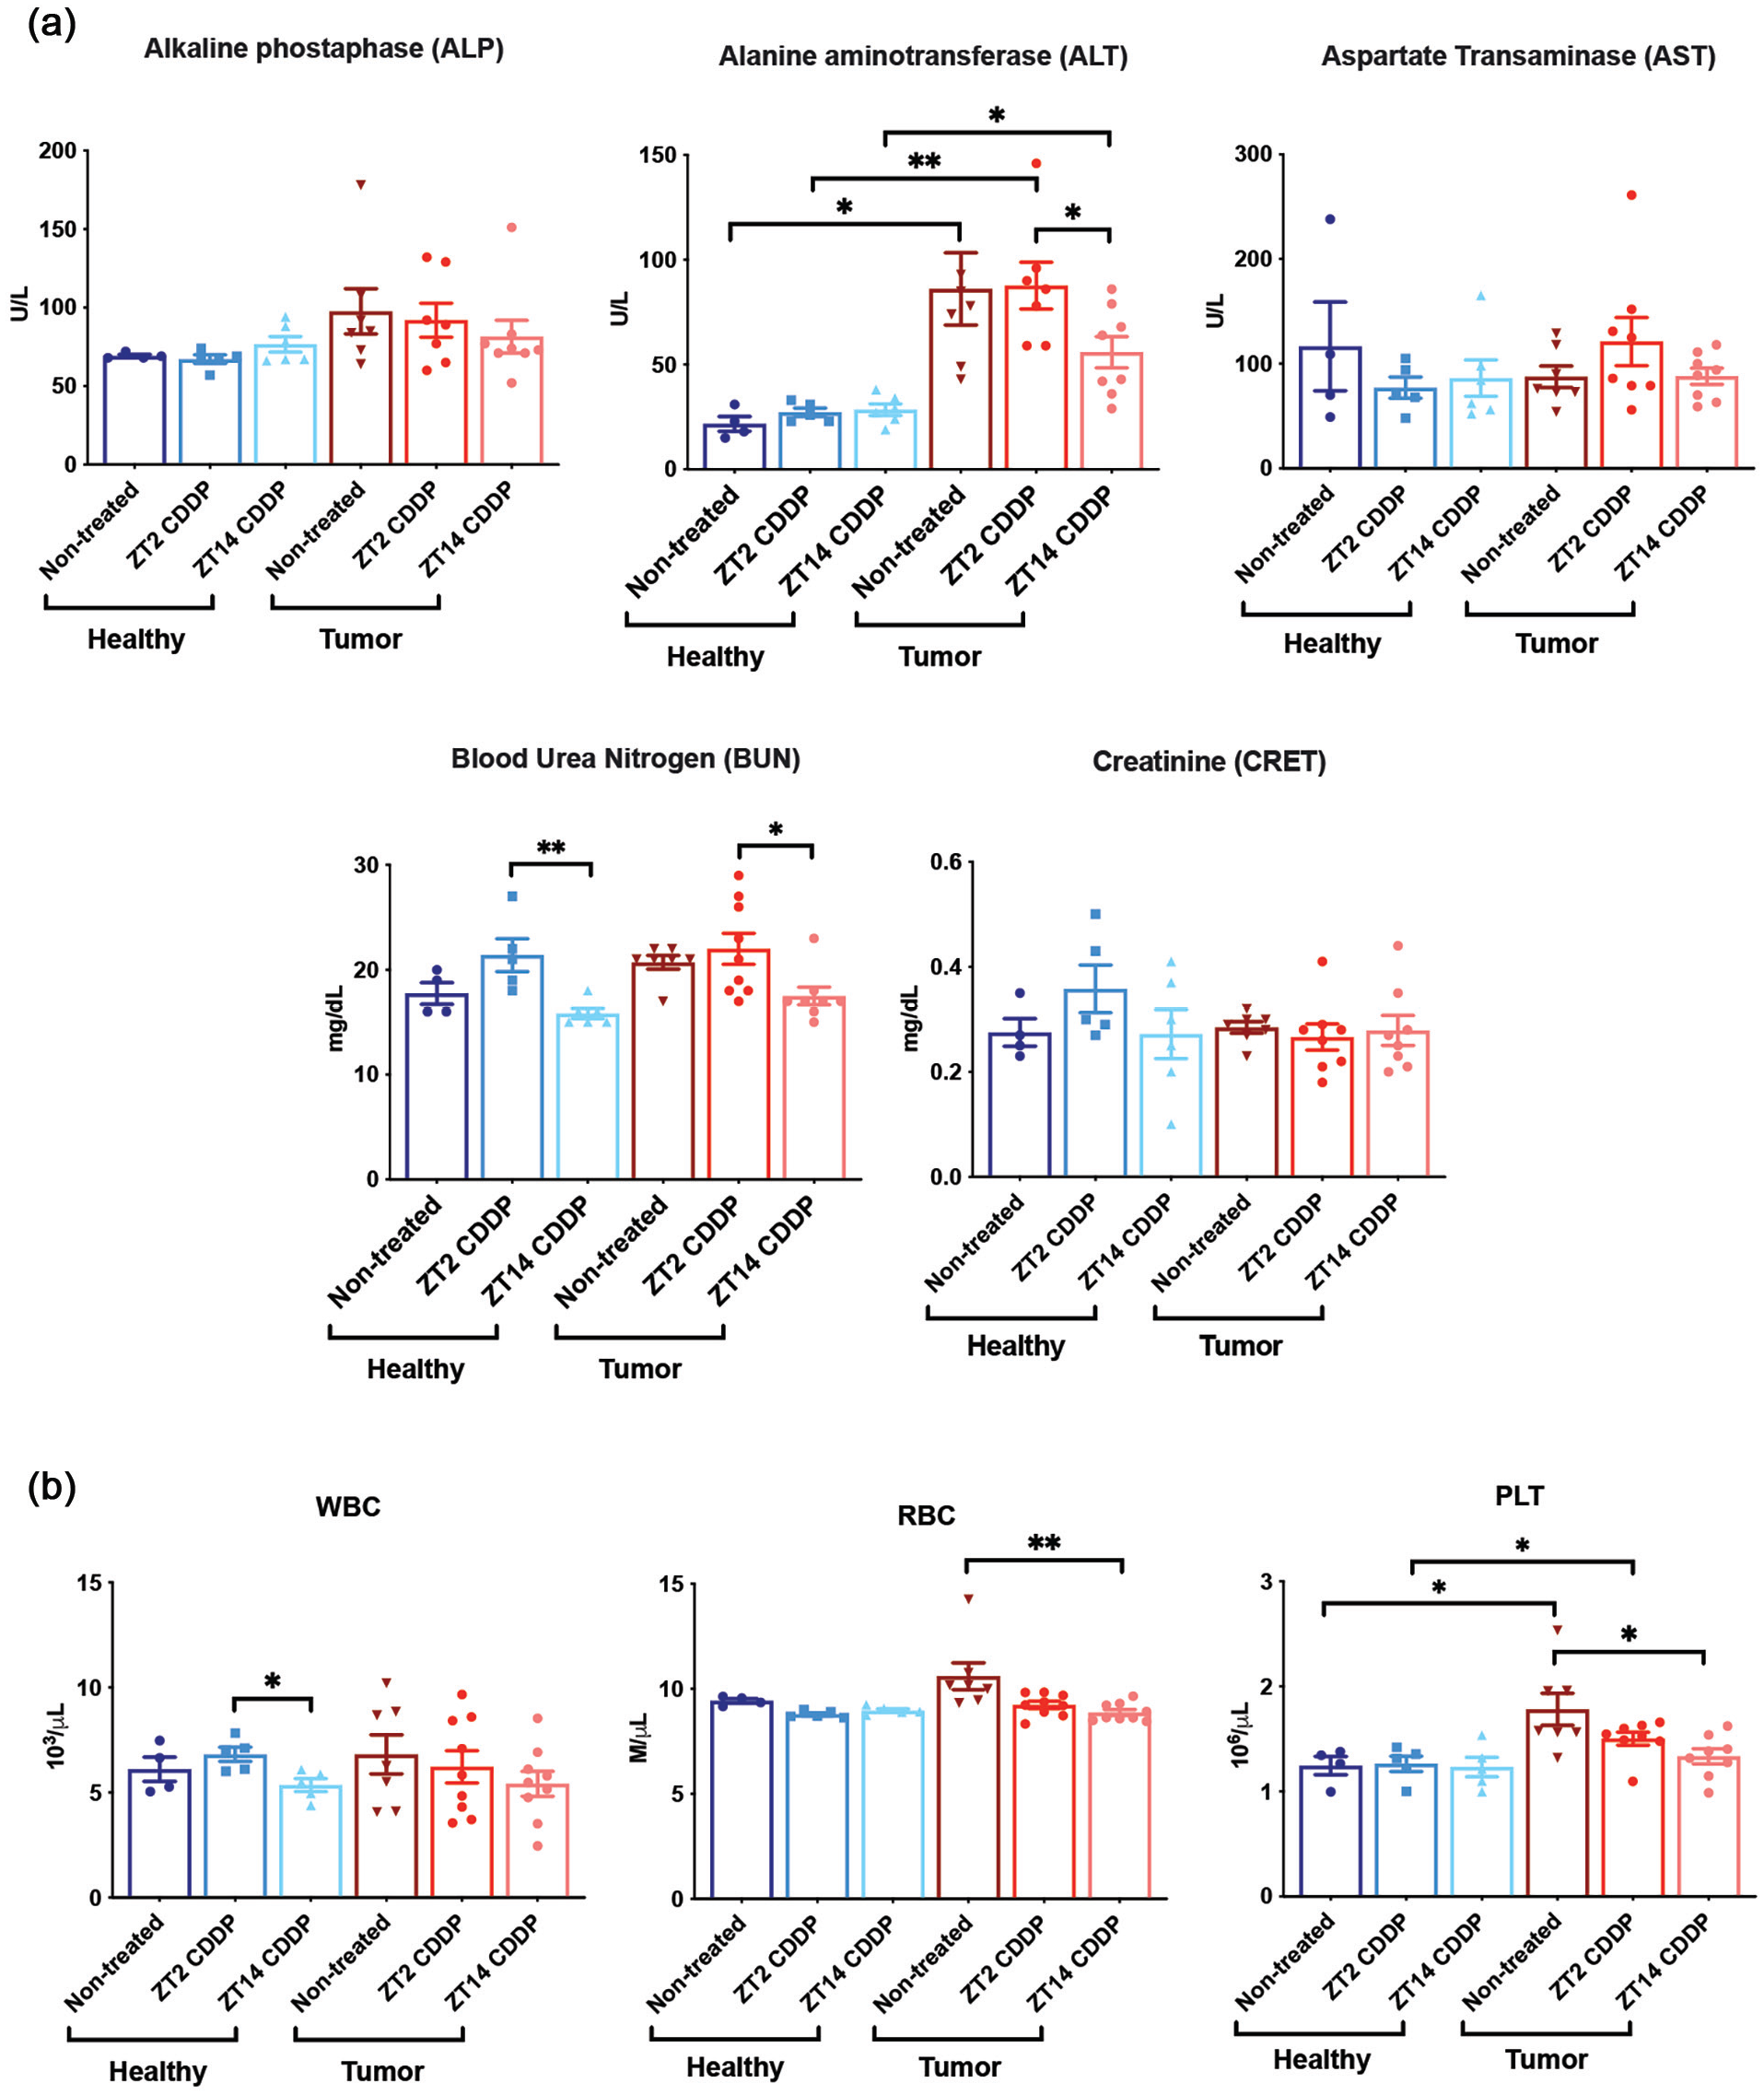
Hematology and blood chemistry in tumor-bearing (+ DEN) and healthy (-DEN) mice as a function of cisplatin treatment time. CDDP, cisplatin. Blood was collected from all mice on day 16, the last day of the treatment regimen. Serum biochemistry parameters shown in
PLT counts, which were elevated in tumor-bearing mice compared to healthy mice, were also reduced by cisplatin treatment, and the reduction was greater and significant following treatment ZT14 (Figure 3b). PLT levels have been associated with liver and other cancers (Pavlovic et al., 2019), and the reduction in PLT levels with cisplatin may also reflect greater therapeutic effect at ZT14. Lower RBC levels and WBC levels were seen at ZT14 (Figure 3b); however, any meaning of these lower levels is unclear since in the case of RBCs, the RBC level in tumor was not significantly greater than the healthy control. In the case of WBCs, a significantly lower level of WBCs was observed only in healthy mice comparing levels at ZT14 versus ZT2.
Cisplatin is known to be nephrotoxic, and a trend for higher BUN levels, indicative of nephrotoxicity (Q. Wei and Dong, 2012), was seen in healthy and tumor-bearing mice at ZT2 compared to ZT14 (Figure 3a). While it is conceivable that these results reflect circadian-dependent toxicity in the kidney, which has been observed before (Boughattas et al., 1989; Hrushesky, 1985; Oda et al., 2014; Zha et al., 2020), the BUN levels at ZT2 were not significantly different from untreated mice, and thus the data do not convincingly demonstrate cisplatin nephrotoxicity likely due to the dose used. Similarly, the creatinine levels (Figure 3b), another indicator of nephrotoxicity (Q. Wei and Dong, 2012), did not vary as a function of cisplatin treatment.
Circadian Time-Dependent Cisplatin Inhibition of Proliferation in Hepatomas
To investigate possible effects of cisplatin treatment time on tumor cell growth, we measured tumor cell proliferation as percentage of Ki-67 staining nuclei. This method was previously used to show reduced proliferation in HepG2 xenografts in mice following cisplatin treatment (Qiao et al., 2018), and thus was considered a reasonable approach. For our experiments, following the cisplatin treatment regimen, three slices per mouse liver were made from separate areas of each liver, and stained with hematoxylin and bluing reagent, and with anti Ki-67 antibody. Tumors are relatively abundant in this model, as shown in Figure 4a, and were readily identified microscopically based upon a higher density of nuclei, greater Ki-67 staining compared to surrounding tissue, and a margin between tumor and surrounding tissue. Fields of view consisting entirely of tumor tissue, as shown in the typical fields in Figure 4b, were counted and the percentages of Ki-67 staining nuclei were determined The results, averaged from 9 mice treated at ZT2 and 8 mice treated at ZT14 (three fields per mouse), shown in Figure 4c, show reduced Ki-67 staining in ZT14-treated mice compared to ZT2-treated mice, and therefore suggest reduced tumor growth in mice treated with cisplatin at ZT14 compared to mice treated at ZT2.
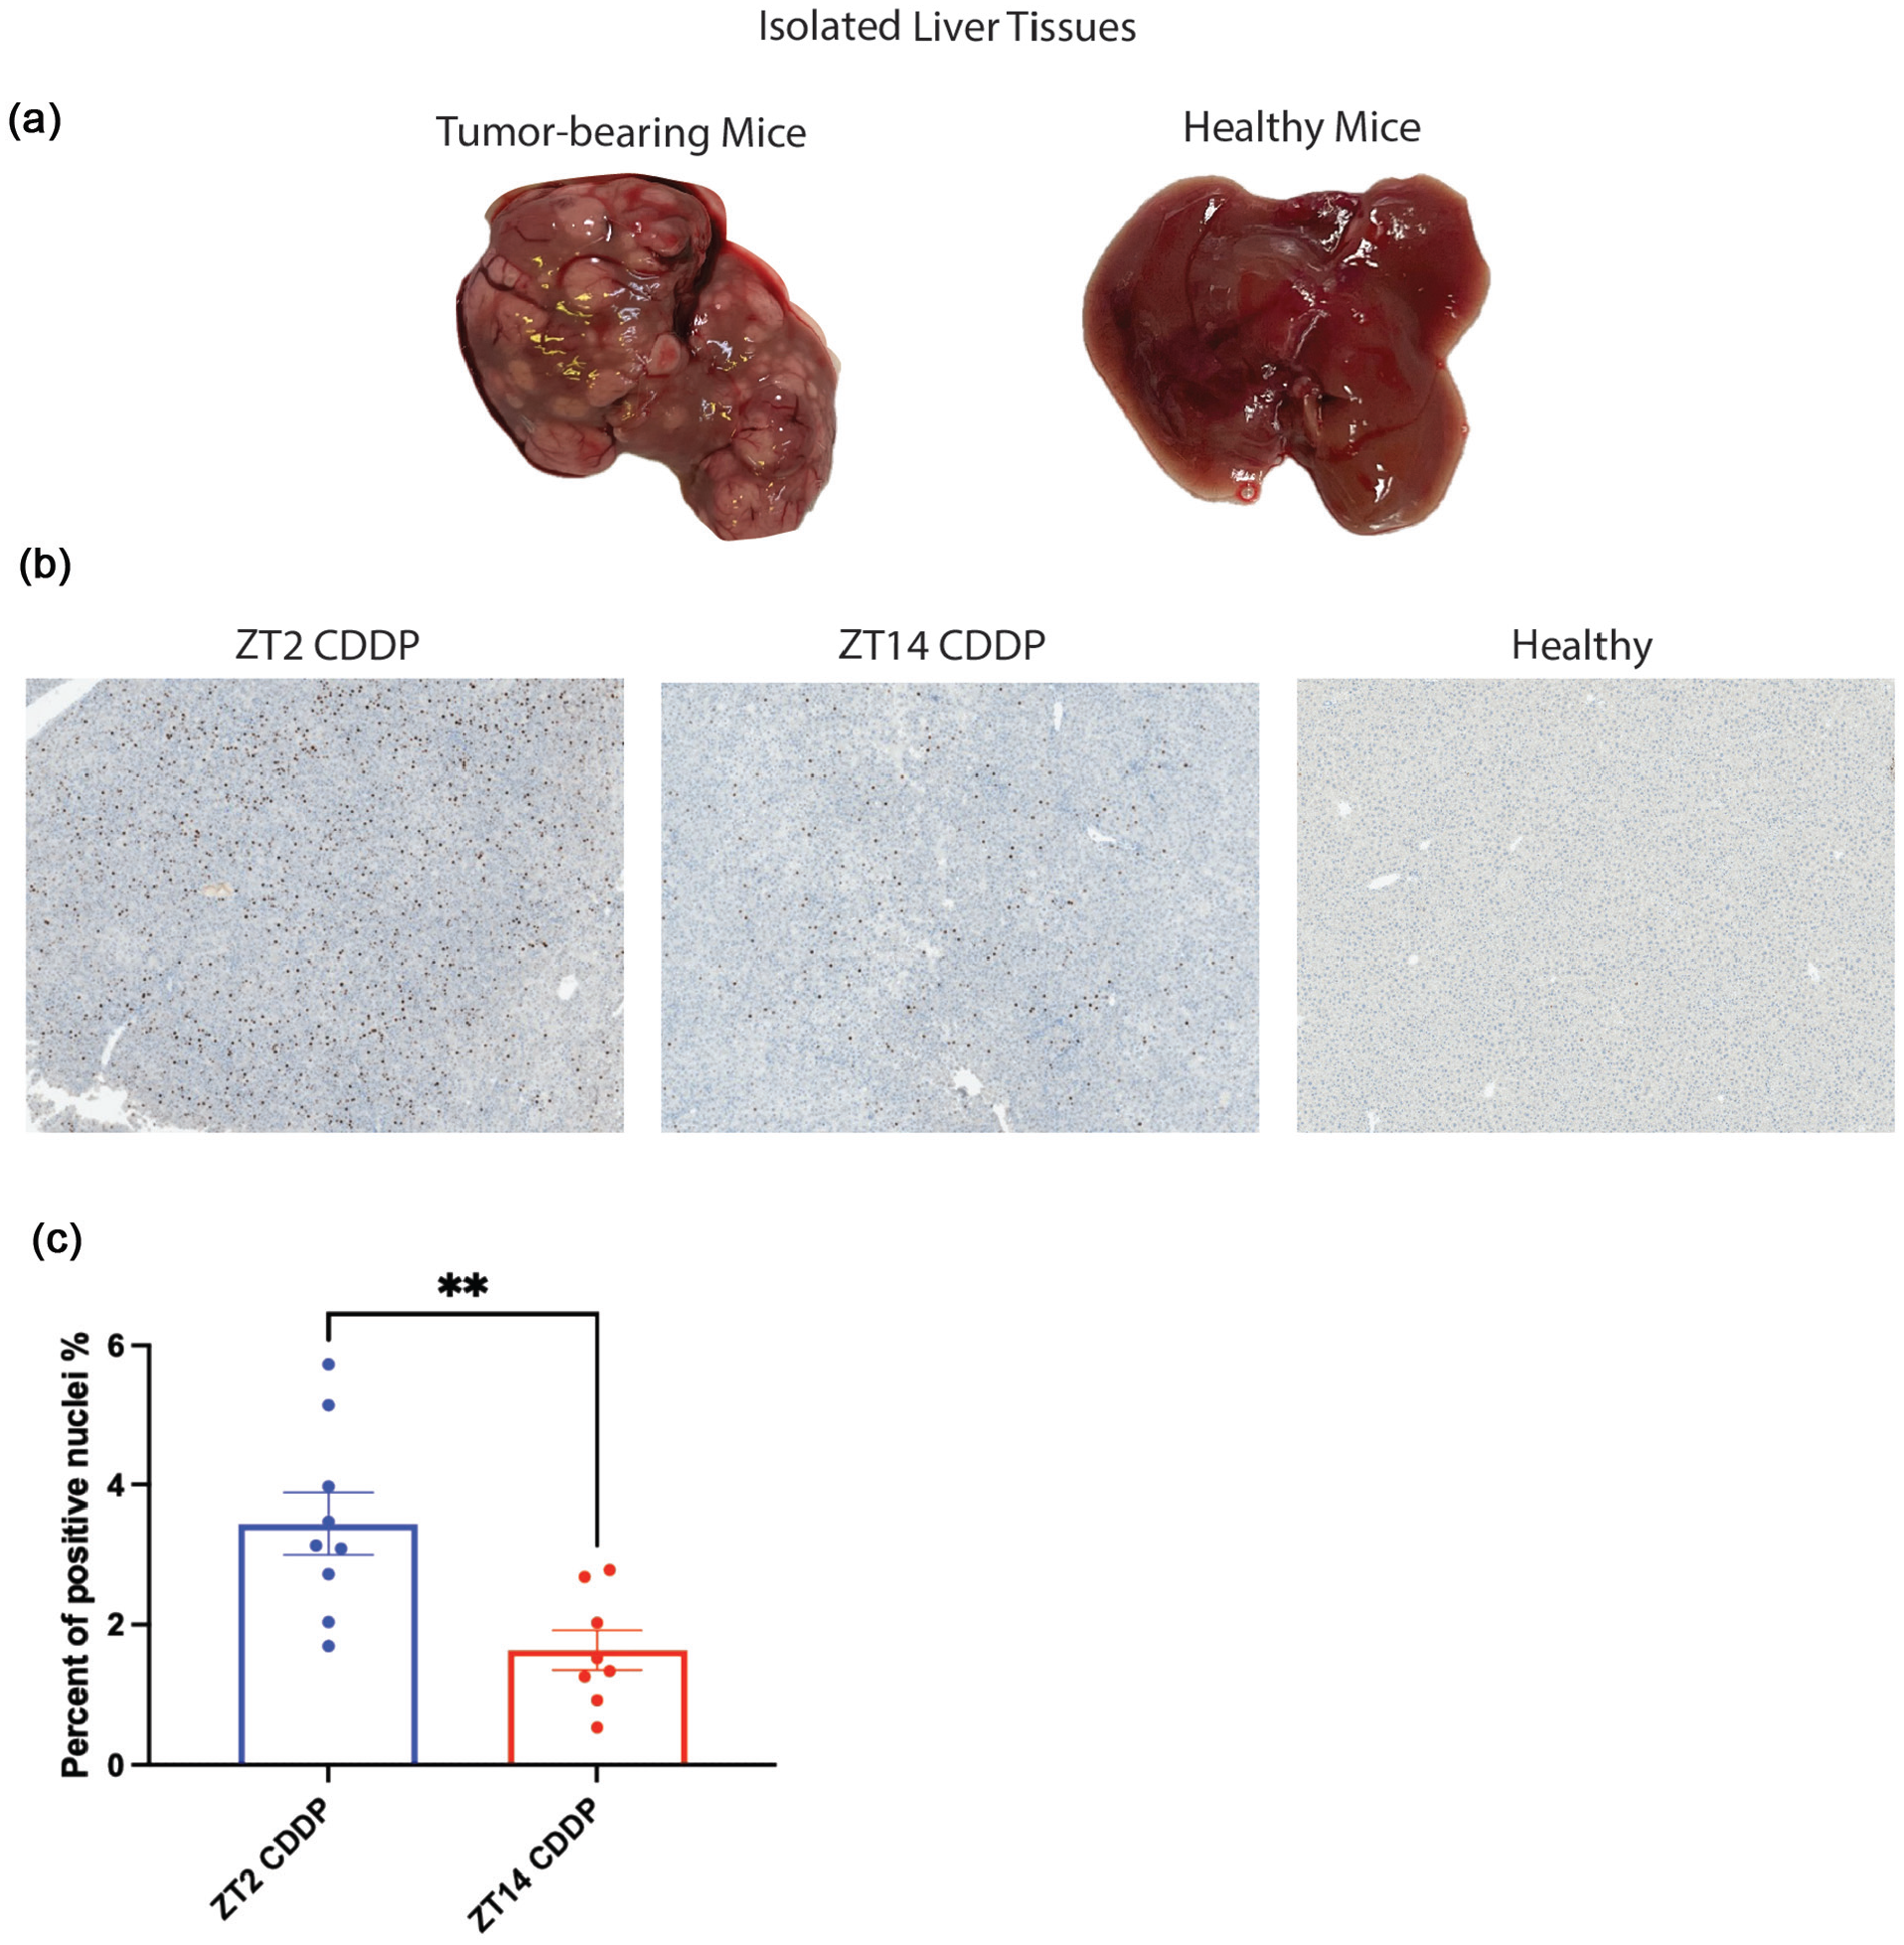
Ki-67 staining as a function of cisplatin dosing time. Livers were harvested on day 16, the last day of the treatment regimen. (a) Typical livers from tumor-bearing and healthy mice. (b) Representative images of stained liver sections showing tumor sections from mice treated with CDDP at either ZT2 or ZT14, and a section from a healthy, untreated tumor-free mouse. Sections were stained with hematoxylin and bluing reagent and with Ki-67 antibody. Ki-67-positive nuclei are indicated by brown staining, and nuclei are in blue. Images were captured at 20X magnification. Fields were selected so that tumor cells filled the field in the case of tumor-bearing mice. Three slices were stained from different regions of each mouse liver, and one random field per slice was imaged and counted. Selection of fields and counting of Ki-67-positive nuclei were done in a blinded manner. Nuclei were counted using ImageJ. The percentage of Ki-67 positive nuclei per field was calculated as (positive/total nuclei × 100) and percentages obtained for all fields at each time point were averaged to determine the proliferation index for each time point. All livers were collected at ZT8 to avoid circadian variability. Panel (c), proliferation index for mice treated with CDDP at ZT2 and ZT14. Data were analyzed by Student’s t-test; **p < 0.005. Results are represented as mean ± SEM (n = 9 for CDDP-treated tumor-bearing mice at ZT2 and n = 8 for CDDP-treated tumor-bearing mice at ZT14).
Cisplatin Treatment-Associated Changes in Gene Expression
To elucidate the underlying transcriptomic alterations induced by circadian-dependent cisplatin treatment, we employed RNA-seq to profile gene expression changes associated with tumors and cisplatin treatments. The unbiased PCA shown in Figure 5a revealed distinct clustering patterns: samples from healthy mouse livers, regardless of treatment status (ZT14-treated, ZT2-treated, or untreated), clustered together. Notably, tumor-bearing mice treated with cisplatin at ZT14 formed a separate cluster that was more proximal to the healthy mouse cluster compared to tumor-bearing mice treated at ZT2. This clustering pattern suggests that, at the transcriptomic level, hepatic gene expression following ZT14 cisplatin administration more closely resembles that of healthy tissue.
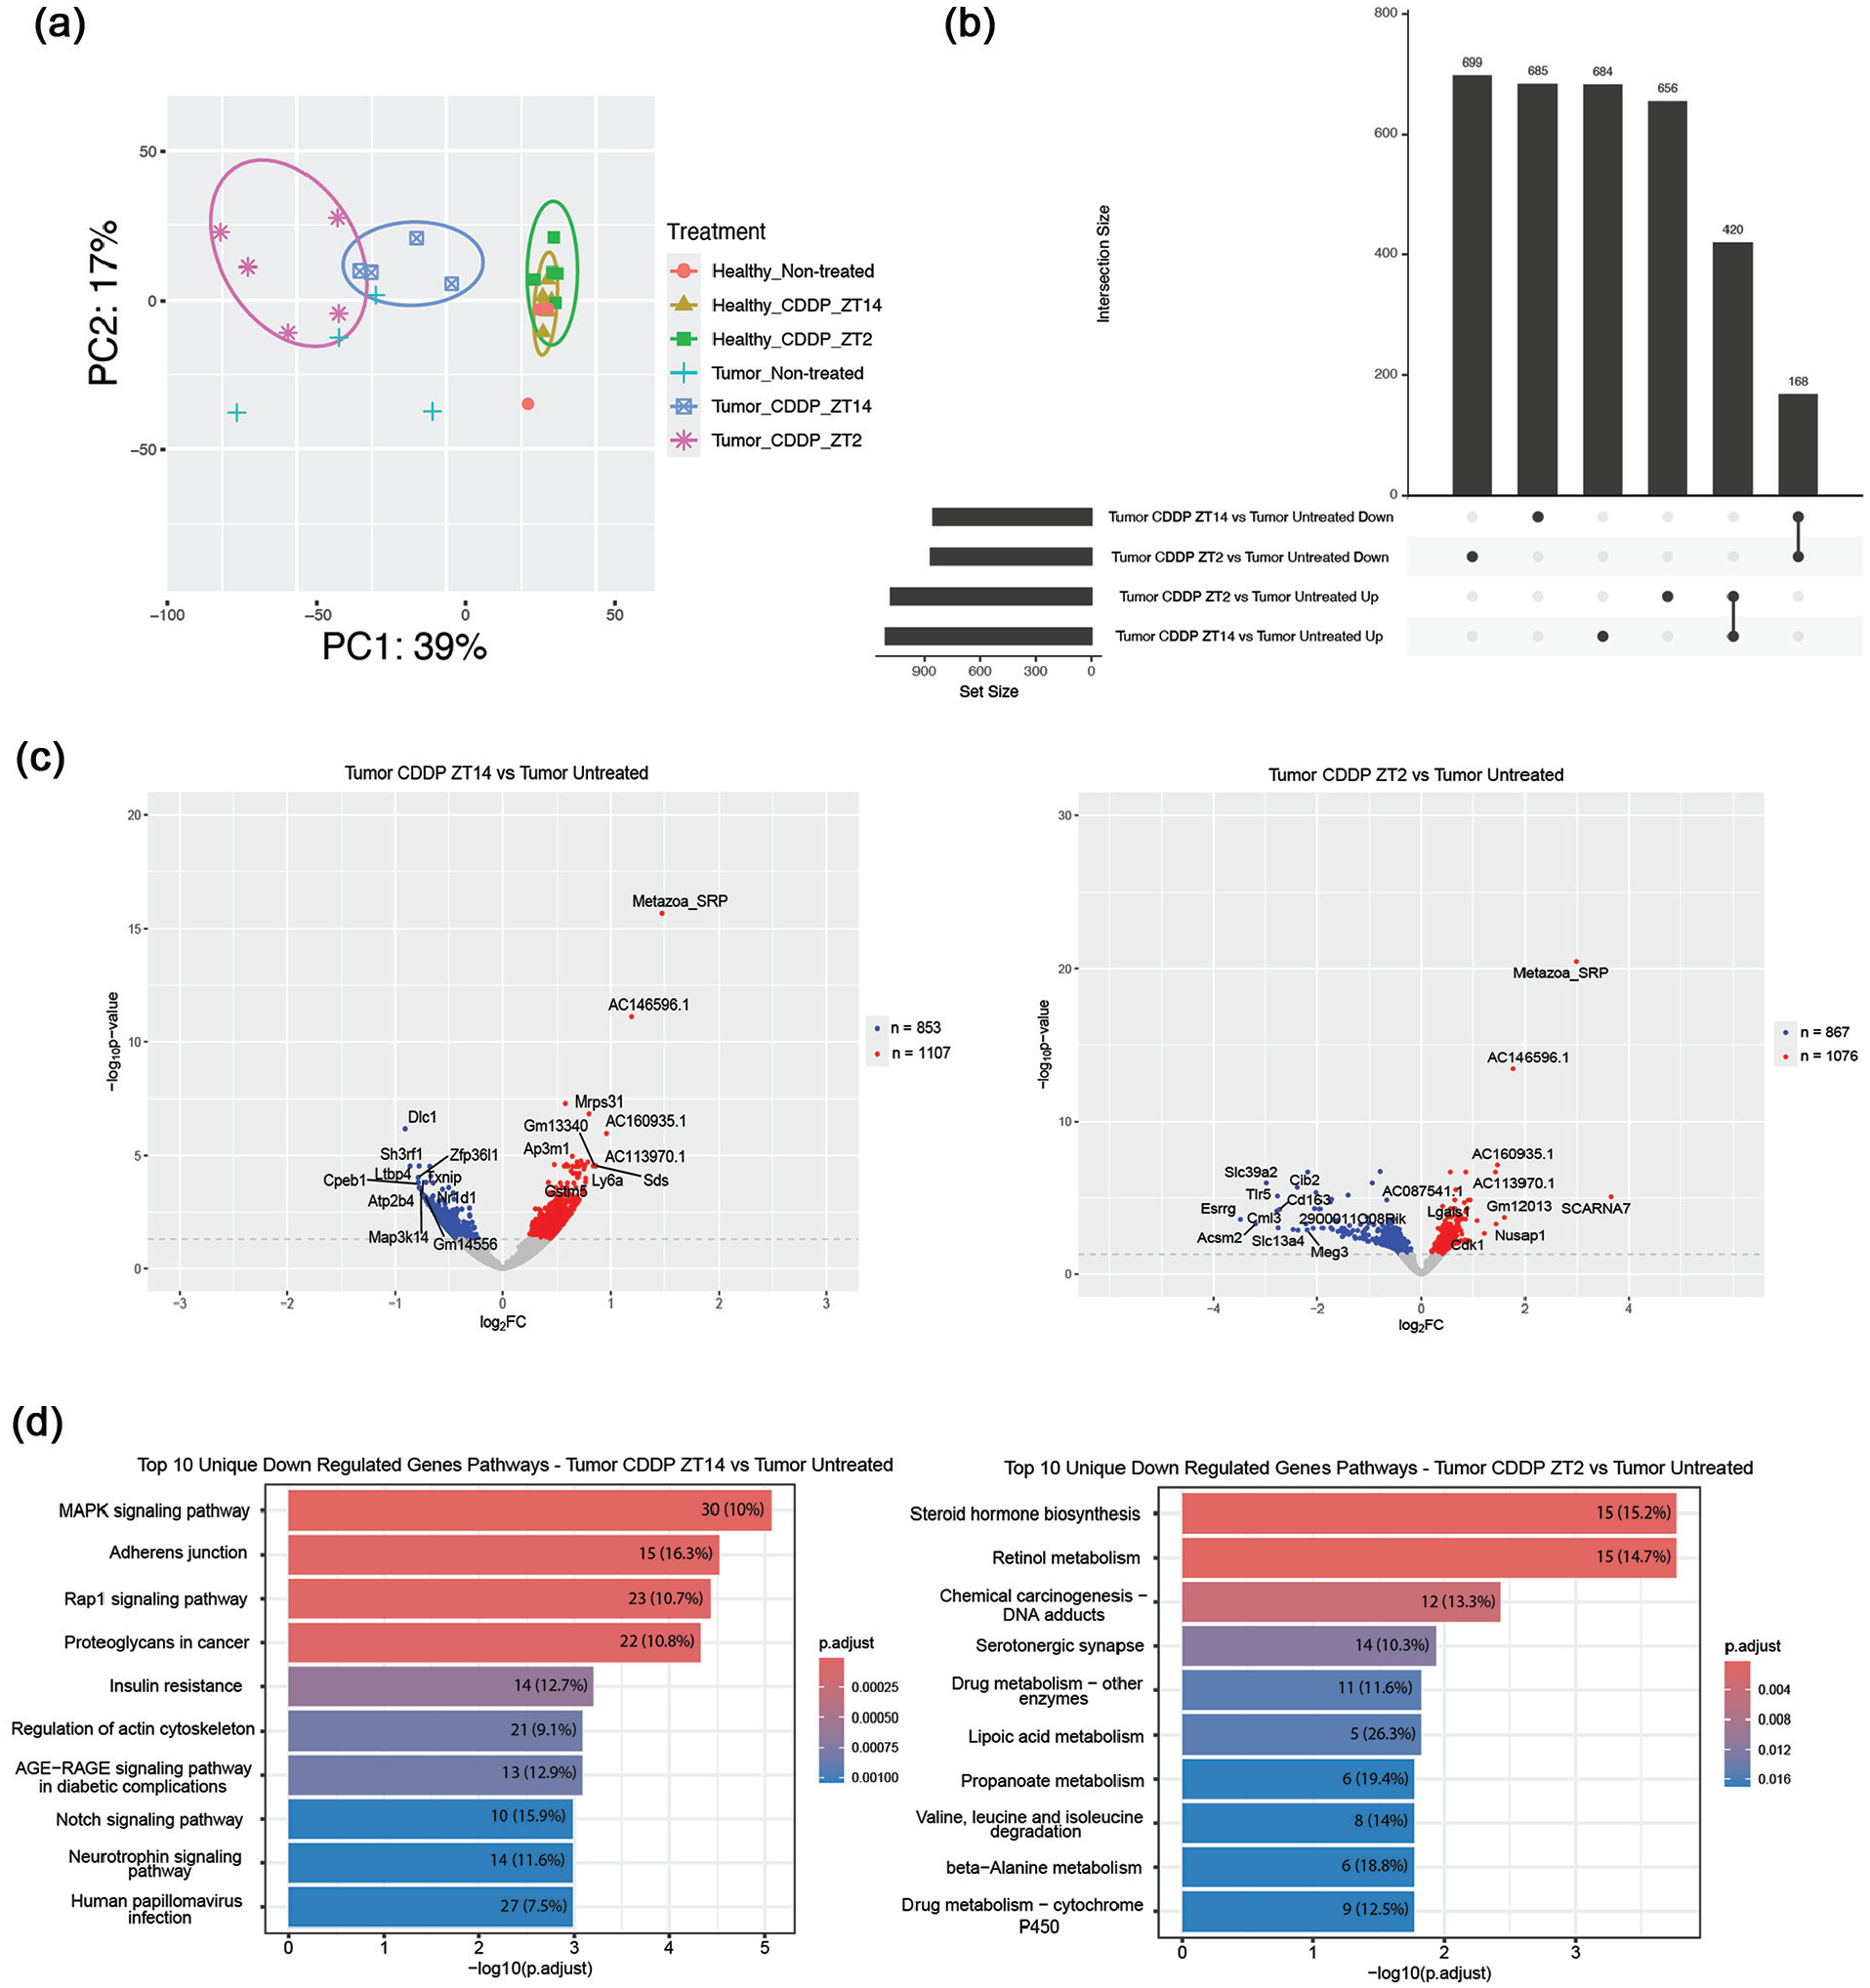
Effect of cisplatin treatments on gene expression. At ZT8 on day 16, the last day of the treatment regimen, livers were harvested and RNA was isolated for RNA-seq analysis. (a) Principal component analysis of gene expression from liver mRNA-seq data. mRNA-seq data are from 28 mice (n = 4-6 for each condition). Data points representing individual mouse values are encircled to group healthy and tumor-bearing mice which were either untreated or treated with cisplatin. CDDP, cisplatin. (b) Upset plot showing either upregulated or downregulated genes in ZT2- or ZT14-treated mice in comparison to tumor-bearing non-treated mice. Log2 fold change (log2 [expression at ZT2/expression in untreated tumor control]) or (log2 [expression at ZT14/expression in untreated tumor control]) was used to determine if genes were up or downregulated using an adjusted p-value less than 0.05 as the cutoff. Log2 fold changes greater than zero were considered upregulated and less than zero were considered downregulated. (c) Volcano plot showing differential gene expression in either tumor-bearing mice treated at ZT2 or tumor-bearing mice treated at ZT14 versus tumor-bearing-non-treated mice (determined as log2 fold change as in panel B). Red denotes genes for which expression is significantly upregulated in either group; blue denotes genes that are significantly downregulated in either group. FC, fold change (expression at ZT/expression in untreated control tumor). (d) KEGG categories of pathways that are downregulated at either ZT14 (left panel) or ZT2 (right panel) in reference to tumor-bearing-non-treated mice. Shown are the top 10 pathways in order of highest to lowest significance from top to bottom. Level of significance for each pathway is shown with color reflecting the p adjust values, and by displacement on the x axis which plots the -log10 (p adjust) values. The numbers given in each pathway indicate the number of genes per pathway that are downregulated. The percentages indicate the fraction of total genes in each pathway that are downregulated.
To quantify the impact of cisplatin treatment time on transcription, we used differential gene expression analysis to compare expression in mice treated with cisplatin at either ZT2 or ZT14 to untreated controls. Among the healthy, tumor-free mice, cisplatin had relatively little effect on gene expression: at ZT2, 87 genes were uniquely upregulated and 121 genes were uniquely downregulated, while at ZT14, 89 genes were uniquely upregulated and 103 genes were downregulated (not shown). Cisplatin treatment had a considerably larger effect on expression in tumors as shown in the upset plot in Figure 5b, the volcano plot in Figure 5c, and the heat map in Supplemental Fig. 1. Figure 5b shows that tumors treated at ZT2 had 656 genes uniquely upregulated and 699 uniquely downregulated compared to untreated tumors, and tumors treated at ZT14 had 684 genes uniquely upregulated and 685 uniquely downregulated. Importantly, there was only partial overlap in the upregulated and downregulated genes at ZT2 and ZT14. Among the upregulated genes 420 were common to the ZT2 and ZT14 groups, and among the downregulated genes, only 168 were common. The levels of significance and levels of change in regulation are shown in the volcano plots in Figure 5c. The heat map showing all differentially expressed genes in Supplemental Fig. 1 shows the degree to which differentially expressed genes are common to both ZTs or are unique to one ZT or another.
Kyoto Encyclopedia of Genes and Genomes (KEGG) pathway analysis (Figure 5d) of the 685 genes uniquely downregulated in ZT14-treated tumors revealed significant overrepresentation notably of MAPK and Rap1 signaling pathways (p < 0.001, false discovery rate [FDR] < 0.05). For the 699 genes uniquely downregulated in ZT2-treated tumors, there was significant enrichment in pathways related to chemical carcinogenesis-DNA adduct formation as well as steroid hormone biosynthesis, and retinol metabolism (p < 0.001, FDR < 0.05). The significantly upregulated pathways at the two ZTs, shown in Supplemental Fig. 2, include none of certain relevance. To visualize the transcriptional changes associated with the four pathways most significantly downregulated by time-of-day–dependent cisplatin treatment at ZT2 and ZT14, heatmaps illustrating the expression profiles of the constituent genes were generated as shown in Supplemental Fig. 3. These heatmaps highlight the temporal specificity of cisplatin’s effects on pathway regulation. These distinct pathway enrichments suggest differential molecular responses to cisplatin treatment based on circadian timing, potentially underlying the observed differences in treatment efficacy.
Discussion
Circadian rhythms cause cells and organisms to respond differently to treatments and stimuli at different times of day. Consequently, we were interested to find in our prior investigation that tumor cells in a mouse model of hepatoma retained circadian rhythmicity, albeit with substantial differences from the rhythmicity of healthy liver (Yang et al., 2023). The presence of this tumor rhythmicity profile raised the possibility that the sensitivity of tumors to anticancer drugs could vary as a function of circadian time, and could be independent of any circadian-dependent toxic side effects to the host. In this context, we treated hepatoma-bearing mice with cisplatin at ZT2 or ZT14 to analyze host and tumor cell responses to anticancer drug treatment as a function of treatment time.
Our results revealed circadian-dependent differences in cisplatin-induced body and liver weight changes, blood chemistry, tumor cell proliferation, and gene expression. Weight loss is a common response to cancer chemotherapy and appears to be a complex response associated with gastrointestinal distress and decreased appetite, factors inherent to the host. The cisplatin-induced weight loss that we observed was maximal in ZT2-treated mice, and greater in tumor bearing mice and thus the tumors may have contributed a cachectic effect. Circadian-dependent weight loss and gross toxicity following cisplatin (and the related agent oxaliplatin) treatment has been observed previously (Boughattas et al., 1989; Dakup et al., 2018; Koritala et al., 2022). Recently, we also reported that after oxaliplatin administration, mice lose less weight when treated during their active phase compared to mice treated during the rest phase, and this pattern is disrupted in Cryptochrome double knockout (Cry DKO) animals (Akyel et al., 2025). A major side effect of cisplatin treatment is nephrotoxicity, and circadian-dependent toxicity to the kidney has been reported (Boughattas et al., 1989; Hrushesky, 1985; Zha et al., 2020). Furthermore, previous work has shown that the pharmacokinetics (PK) of cisplatin exhibits time-dependent variations following injections at ZT2 and ZT14 (Oda et al., 2014). Specifically, the area under the curve (AUC1-4h) of serum platinum concentrations in wild-type mice was significantly lower, and renal clearance was higher at ZT14 compared to ZT2, indicating that reduced nephrotoxicity at ZT14 correlates with enhanced drug clearance (Oda et al., 2014). In our experiment, we did not observe evidence of nephrotoxicity presumably due to the dose used. Nevertheless, it is conceivable that the reduced body weight loss we observed at ZT14 compared to ZT2 could be partly related to enhanced renal clearance at ZT14.
Cisplatin treatment was more effective at ZT14 in reducing tumor cell proliferation, as indicated by reduced Ki-67 staining (Figure 4). Increased efficacy of treatment at ZT14 is also suggested by the reduced liver weight (Figure 2c), decreased ALT level (Figure 3a), and decreased PLTs counts at ZT14 (Figure 3b). The antiphase nature of these indicators of apparently increased antitumor efficacy at ZT14 and increased body weight loss at ZT2 (Figure 2a and 2b) support the notion that therapeutic ratio in cisplatin treatment may vary with circadian time of treatment.
The treatment times ZT2 and ZT14 were selected based upon differences in rhythmicity between the tumors and healthy liver (Yang et al., 2023). Many of the genes rhythmic in the tumors exhibited peak expression times early in the light phase, at around ZT2 to ZT8, in contrast to the predawn and predusk peak expression times of most genes rythmic in healthy liver. Cisplatin treatment times were selected to precede and follow the peak expression of genes rhythmic in tumors. The genes rhythmic in tumors included many involved in nucleic acid metabolism and genes classified as “multicellular organism development” or “cell differentiation” and genes known to be involved in carcinogenesis such as lysine dependent protein kinase2 (Wnk2), wingless-type MMTV integration site family member 11 (Wnt11) and single-minded family bHLH transcription factor 2 (Sim2). Since cisplatin damage reaches peak levels about 2 hours following administration, peak damage to genes rhythmic in tumors was expected following ZT2 treatment, and there was an expectation that cisplatin would be more effective against tumors following ZT2 treatment since maximal damage would then be present during maximal expression of these genes. However, cisplatin was more effective at reducing tumor proliferation when administered at ZT14, preceding the nadir of tumor-specific rhythmic gene expression. A number of mitigating factors may account for the unexpected result including aspects of the DNA damage response including replication as well as transcription-coupled repair, which rapidly removes transcription-blocking damage from the template DNA strand, and aspects of regulation, which is multifactorial for many circadian-controlled genes and includes expression of activators and repressors and binding partners which may or may not themselves be rhythmic.
The gene expression analysis identifies considerable differential expression between tumors treated at the two ZTs. The overrepresentation of MAPK and Rap1 signaling pathways among genes uniquely downregulated at ZT14 suggests a possible involvement in these pathways in the reduced proliferation seen at ZT14. The MAPK signaling pathway is a key regulator of cell proliferation, differentiation, and survival. Its activation has been associated with resistance to cisplatin in various cancers, including hepatocellular carcinoma (McCubrey et al., 2007; Moon and Ro, 2021; Sebolt-Leopold & Herrera, 2004). The therapeutic potential of targeting the MAPK pathway in cancer treatment has been discussed given the pathway’s central role in cell growth and survival, especially in tumors with rat sarcoma virus (Ras) or rapidly accelerated fibrosarcoma (Raf) mutations (as the case in DEN-induced hepatocellular carcinoma) (Sebolt-Leopold & Herrera, 2004). Similarly, the Rap1 signaling pathway plays a role in cell adhesion, migration, and proliferation. Rap1 activity has been linked to the maintenance of tumor growth and angiogenesis in hepatocellular carcinoma and other cancers (Lakshmikanthan et al., 2011). Inhibition of Rap1 signaling has been associated with reduced tumor invasiveness and improved response to chemotherapy (Karimkhanloo et al., 2023; Kooistra et al., 2007). Thus the time of day-dependent downregulation of MAPK and Rap1 signaling may contribute to the apparent circadian-dependent effects of cisplatin seen in this investigation. A more thorough assessment will require further study.
Our investigation utilized a model of neoplastic hepatocellular growth which may be considered analogous to a model of hepatocellular growth induced by partial hepatectomy in rodents. In this regard, it is worth noting similarities in rhythmicity seen genome-wide in these two models (S. Wei et al., 2022; Yang et al., 2023). Both cancerous and hepatectomized livers were found to share relatively few rhythmic genes with healthy liver. Among the rhythmic genes that were shared with healthy liver were genes involved in circadian rhythms. Most genes rhythmic in healthy liver were not rhythmic in cancerous or hepatectomized livers, and surprisingly, many genes rhythmic in tumors and hepatectomized livers were not rhythmic in healthy liver. In addition to these similarities of overall rhythmicity are circadian-dependent effects on proliferation. Our finding that cisplatin reduced proliferation more at ZT14 is concordant with the finding of over two-fold more Ki-67 positive cells in mice hepatectomized in the morning compared to the PM-hepatectomized group. While there are differences in the absolute proliferation responses, inhibition of proliferation by cisplatin and stimulation by hepatectomy, the similarities in the two models overall suggest common response mechanisms in the neoplastic and regenerating livers.
Interestingly, morning-hepatectomized livers were found to regrow faster than evening-hepatectomized livers (Wei et al., 2022). If the effect of hepatectomy time on liver regrowth rate is predictive of an effect of cisplatin treatment time on tumor growth rate, then cisplatin may be expected to inhibit tumor growth to a greater or lesser degree as a function of treatment time. However, while the effect of hepatectomy time on liver regrowth rate was significant, it was modest, thus, any effect of cisplatin treatment time on tumor growth rate may also be modest.
Supplemental Material
sj-docx-1-jbr-10.1177_07487304251349893 – Supplemental material for Time of Day-Dependent Responses to Cisplatin Treatment in a Male Mouse Model of Hepatoma
Supplemental material, sj-docx-1-jbr-10.1177_07487304251349893 for Time of Day-Dependent Responses to Cisplatin Treatment in a Male Mouse Model of Hepatoma by Yasemin Kubra Akyel, Christopher P. Selby, Aziz Sancar and Ashraf N. Abdo in Journal of Biological Rhythms
Supplemental Material
sj-jpg-2-jbr-10.1177_07487304251349893 – Supplemental material for Time of Day-Dependent Responses to Cisplatin Treatment in a Male Mouse Model of Hepatoma
Supplemental material, sj-jpg-2-jbr-10.1177_07487304251349893 for Time of Day-Dependent Responses to Cisplatin Treatment in a Male Mouse Model of Hepatoma by Yasemin Kubra Akyel, Christopher P. Selby, Aziz Sancar and Ashraf N. Abdo in Journal of Biological Rhythms
Supplemental Material
sj-jpg-3-jbr-10.1177_07487304251349893 – Supplemental material for Time of Day-Dependent Responses to Cisplatin Treatment in a Male Mouse Model of Hepatoma
Supplemental material, sj-jpg-3-jbr-10.1177_07487304251349893 for Time of Day-Dependent Responses to Cisplatin Treatment in a Male Mouse Model of Hepatoma by Yasemin Kubra Akyel, Christopher P. Selby, Aziz Sancar and Ashraf N. Abdo in Journal of Biological Rhythms
Supplemental Material
sj-jpg-4-jbr-10.1177_07487304251349893 – Supplemental material for Time of Day-Dependent Responses to Cisplatin Treatment in a Male Mouse Model of Hepatoma
Supplemental material, sj-jpg-4-jbr-10.1177_07487304251349893 for Time of Day-Dependent Responses to Cisplatin Treatment in a Male Mouse Model of Hepatoma by Yasemin Kubra Akyel, Christopher P. Selby, Aziz Sancar and Ashraf N. Abdo in Journal of Biological Rhythms
Footnotes
Acknowledgements
The authors thank the Pathology Services Core at the University of North Carolina at Chapel Hill for providing imaging services and technical support for immunohistochemistry analysis, as well as the Animal Clinical Laboratory Medicine Core for assistance with complete blood counts and serum biochemistry analysis and Bioinformatics and Analytics Research Collaborative (BARC) for their support on RNA-Seq analysis. This study was supported by The National Institutes of Health grants (grant nos. GM118102 and ES0033414) to A.S.
Author Contributions
A.N.A. and Y.K.A. performed experiments; A.N.A. designed experiments, A.N.A., C.P.S and Y.K.A. analyzed data; A.N.A, C.P.S. and Y.K.A. wrote the paper and A.S. and A.N.A oversaw the project.
Conflict of Interest Statement
The author(s) have no potential conflicts of interest with respect to the research, authorship, and/or publication of this article.
Data Availability
The raw data and alignment data are available on sequence read archive (SRA), accession number PRJNA1219544.
Notes
References
Supplementary Material
Please find the following supplemental material available below.
For Open Access articles published under a Creative Commons License, all supplemental material carries the same license as the article it is associated with.
For non-Open Access articles published, all supplemental material carries a non-exclusive license, and permission requests for re-use of supplemental material or any part of supplemental material shall be sent directly to the copyright owner as specified in the copyright notice associated with the article.