
Abstract
Seasonal daylength, or circadian photoperiod, is a pervasive environmental signal that profoundly influences physiology and behavior. In mammals, the central circadian clock resides in the suprachiasmatic nuclei (SCN) of the hypothalamus where it receives retinal input and synchronizes, or entrains, organismal physiology and behavior to the prevailing light cycle. The process of entrainment induces sustained plasticity in the SCN, but the molecular mechanisms underlying SCN plasticity are incompletely understood. Entrainment to different photoperiods persistently alters the timing, waveform, period, and light resetting properties of the SCN clock and its driven rhythms. To elucidate novel candidate genes for molecular mechanisms of photoperiod plasticity, we performed RNA sequencing on whole SCN dissected from mice raised in long (light:dark [LD] 16:8) and short (LD 8:16) photoperiods. Fewer rhythmic genes were detected in mice subjected to long photoperiod, and in general, the timing of gene expression rhythms was advanced 4-6 h. However, a few genes showed significant delays, including Gem. There were significant changes in the expression of the clock-associated gene Timeless and in SCN genes related to light responses, neuropeptides, gamma aminobutyric acid (GABA), ion channels, and serotonin. Particularly striking were differences in the expression of the neuropeptide signaling genes Prokr2 and Cck, as well as convergent regulation of the expression of 3 SCN light response genes, Dusp4, Rasd1, and Gem. Transcriptional modulation of Dusp4 and Rasd1 and phase regulation of Gem are compelling candidate molecular mechanisms for plasticity in the SCN light response through their modulation of the critical NMDAR-MAPK/ERK-CREB/CRE light signaling pathway in SCN neurons. Modulation of Prokr2 and Cck may critically support SCN neural network reconfiguration during photoperiodic entrainment. Our findings identify the SCN light response and neuropeptide signaling gene sets as rich substrates for elucidating novel mechanisms of photoperiod plasticity. Data are also available at http://circadianphotoperiodseq.com/, where users can view the expression and rhythmic properties of genes across these photoperiod conditions.
The mammalian brain’s endogenous 24-h timing mechanism, or circadian clock, is located within the suprachiasmatic nuclei (SCN) of the hypothalamus. SCN circadian clock neurons exhibit self-sustained circadian rhythms in gene expression which are driven by networks of clock genes organized in transcription/translation negative feedback loops (TTFLs; for review, see Hastings et al., 2018). A key function of circadian clocks is to synchronize, or entrain, internal rhythms to local environmental time.
While much is known about the genes, neurons, and synapses that are critical for the generation of circadian rhythms, there are key gaps in knowledge regarding the molecular mechanisms of entrainment and the pacemaker plasticity that entrainment induces. Entrainment to different seasonal day lengths (photoperiods), or even a clock reset by a single light pulse, persistently alters the timing, waveform, period, and resetting properties of the SCN circadian clock and its driven rhythms (Buijink et al., 2016; Ciarleglio et al., 2011; Glickman et al., 2012; Inagaki et al., 2007; Pittendrigh et al., 1984; Pittendrigh and Daan, 1976a; Rohr et al., 2019; Tackenberg et al., 2020; VanderLeest et al., 2007, 2009). The long-term plasticity of circadian clocks in response to entraining light cycles is thought to be critical for stable alignment to changing seasonal photoperiods (Pittendrigh and Daan, 1976b, 1976c). Misalignment of the clock to the external environment may contribute to mood disorders, SCN changes in aging, and to discordance between SCN and peripheral tissue clocks (Baron and Reid, 2014). Here, we describe the SCN transcriptomic response to different photoperiods to elucidate novel molecular mechanisms of SCN plasticity.
The molecular clock within SCN neurons is a nested multi-level oscillator. At its core is a two-loop TTFL in which heterodimers of the transcription factors Clock and Bmal1 positively drive the transcription of negative feedback Period circadian regulator genes (Per1/2) and Cryptochrome circadian regulator genes (Cry1/2) through E-box enhancer elements. PER and CRY proteins heterodimerize, accumulate, and enter the nucleus, inhibiting CLOCK/BMAL1-driven transcription, thus forming the core 24-h feedback oscillator (for review, see Hastings et al., 2018). In addition, the molecular circadian clockworks drive an extensive transcriptional network of clock-controlled genes in a tissue-specific and phase-specific manner, with nearly half the mouse genome thought to be under circadian control (Panda et al., 2002; Zhang et al., 2014).
The timing of the circadian clock molecular oscillator loop and its clock-controlled genes can be reset by light stimuli through synaptic input to SCN neurons from melanopsin-expressing retinal ganglion cells (Berson et al., 2002; Hannibal et al., 2002; Hattar et al., 2002; Provencio et al., 2002). The resetting transduction pathway within SCN neurons involves N-methyl-D-aspartate (NMDA) glutamate receptors and PAC1 PACAP receptors that depolarize the transmembrane potential and increase action potentials, raising intracellular Ca2+ and cyclic adenosine monophosphate (cAMP) levels, and ultimately stimulating mitogen-activated protein kinase/extracellular signal-regulated protein kinase (MAPK/ERK) and cAMP response element-binding protein/cAMP response element (CREB/CRE) transcriptional activation to induce rapid transcription of the Period genes (Obrietan et al.,1998, 1999). Importantly, secondary release of vasoactive intestinal polypeptide (VIP) from light-excited retinorecipient SCN neurons transmits light input broadly throughout the SCN neural network (Hamnett et al., 2019; Kuhlman et al., 2003), also through MAPK/ERK and CREB/CRE activation. SCN plasticity in response to light-induced clock resetting is thought to be critical to stable photoperiodic entrainment (Baron and Reid, 2014; Panda et al., 2002; Pittendrigh and Daan, 1976b; Rohr et al., 2019).
What then are the critical molecular mechanisms of the circadian clock photoperiod entrainment response? GABA A receptor (GABAAR) signaling and its control by the chloride co-transporters, NKCC1 and KCC2, have been shown to be molecular elements in photoperiod plasticity in the SCN network (Farajnia et al., 2014; Myung et al., 2015; Rohr et al., 2019). However, these molecules alone are unlikely to fully account for the molecular bases of SCN plasticity, and the role of these transporters in the SCN has recently been called into question (Patton et al., 2023). To reveal additional candidate molecular mechanisms of SCN photoperiod plasticity, it is important to comprehensively define what changes occur in the circadian transcriptome of the SCN following photoperiod entrainment.
Here, we have used RNA sequencing (RNAseq) to characterize differential gene rhythmicity and differential gene expression in response to short winter-like photoperiods vs long summer-like photoperiods. To best capture the impact of photoperiod, we used a strain of mice (C3Hf+/+, Baba et al., 2009) which possess intact melatonin signaling, and we used perinatal exposure to photoperiods, which we have previously shown to produce robust plasticity in the SCN and robust photoperiodic responses in downstream serotonergic and dopaminergic brain circuits (Ciarleglio et al., 2011; Green et al., 2015; Giannoni-Guzmán et al., 2020; Siemann et al., 2019, 2020; Jameson et al., 2023). Our approach reveals specific gene expression changes in SCN neuropeptide signaling and light response genes as candidate novel molecular mechanisms for SCN light response plasticity and SCN neural network reconfiguration in photoperiodic entrainment.
Methods
Animals and Housing
The C3Hf+/+ mouse strain (a gift of Gianluca Tosini, Morehouse School of Medicine, Atlanta, GA) was used. C3Hf+/+ mice (C3A.BLiA-Pde6b+/J; JAX stock #001912) have intact melatonin signaling and do not carry the rd allele that causes retinal degeneration in the C3 H/HeJ parent strain (Baba et al., 2009). Mice were paired and placed under short (light:dark [LD] 8:16) or long (LD 16:8) photoperiods (ca. 100 lux). Litters were born and maintained under their respective photoperiod conditions until experimental use (postnatal day 50; P50). Both behavioral and RNAseq experimental animals were maintained from embryonic day 0 (E0) to P50 in their respective photoperiods before being used for experiments. As rodent circadian rhythms develop in utero (Carmona-Alcocer et al., 2018; Davis and Gorski, 1988) during which maternal-fetal melatonin signaling can transmit photoperiodic information (Weaver and Reppert, 1986) and retinal melanopsin light transduction begins to function in the developing pups (Rao et al., 2013), the first litters born under the experimental photoperiods were not used in this experiment in order to avoid any potential aftereffects of parental entrainment to the previous photoperiod (standard institutional housing [LD 12:12]). Male mice from the second and subsequent litters were used. Litters were raised with both the dam and the sire and were group housed to mitigate stress. Mice were weaned at P21 per standard practice and remained in the same photoperiod until P50, which is considered late adolescence. At P50, male mice were used in the RNAseq experiment (see SCN Dissection and RNA Extraction) or were singly housed in running-wheel cages for activity monitoring (see Behavioral Activity Monitoring). All animal housing and procedures were approved by the Vanderbilt University Institutional Animal Care and Use Committee.
Behavioral Activity Monitoring
A cohort of 10 male mice (5 born and maintained under short photoperiods and 5 under long photoperiods, age = P50) were singly housed in cages with running wheels. They remained under the same LD cycle for a minimum of 9 days for acclimatization to the running wheel before being released into constant darkness (DD), during which they were allowed to free run for at least 5 days. Wheel-running locomotor activity rhythms were recorded using ClockLab (version 6.1.06, ActiMetrics Software).
The phase angle of entrainment, Ψ (psi), was calculated as the timing of the activity onset in the first cycle in DD (from ClockLab) relative to the projected time of lights-off from the previous light-dark cycle (projected Zeitgeber Time 12 [ZT12]). The daily duration of locomotor activity, α (alpha), was calculated separately for the LD and DD conditions by first marking the onsets and offsets on each day in the actograms of each individual mouse using ClockLab. For each individual mouse, the average onsets and offsets (h) for each day were calculated by averaging the points. Alpha was calculated as average offset − average onset. The free-running period of the locomotor rhythms, τ (tau), was determined using Lomb-Scargle periodogram analysis in Clocklab for the days in DD. Statistical analysis of Ψ, α, and τ values across photoperiods were performed with GraphPad PRISM.
SCN Dissection and RNA Extraction
At postnatal day 50, the lighting regime was switched to DD at the respective time of lights-off (ZT 12) for each photoperiod. Mice spent a minimum of 36 h in DD before sample collection began, such that gene expression in the samples likely represents the state of the endogenous clock rather than acute responses to the previously light cycle (Hughes et al., 2017). After this interval, SCN dissections took place at intervals of 4 h over 2 circadian cycles (Hughes et al., 2017) until a minimum n of 4 was achieved per timepoint per cycle. Short- and long-photoperiod samples were collected at 36, 40, 44, 48, 52, 56, 60, 64, 68, 72, 76, and 80 h after lights-off (Figure 1). To minimize any potential light signaling to the SCN, a dim red headlamp was worn by the experimenter during the first steps of dissection, and the eyes were removed following euthanasia. The subsequent steps took place under light: The optic nerve was cut, and the brain was removed such that it was situated ventral side up in a petri dish. The SCN was dissected from the brain under a microscope using Vannas-Tübingen Spring Scissors (15003-08, Fine Science Tools). Each SCN sample was put in a 1.5-mL sterile DNase- and RNase-free tube, and tubes were immediately placed in powered dry ice. RNA and DNA were extracted from each SCN sample using the AllPrep DNA/RNA Micro Kit (Qiagen) according to the instructions. (DNA was stored for later use).
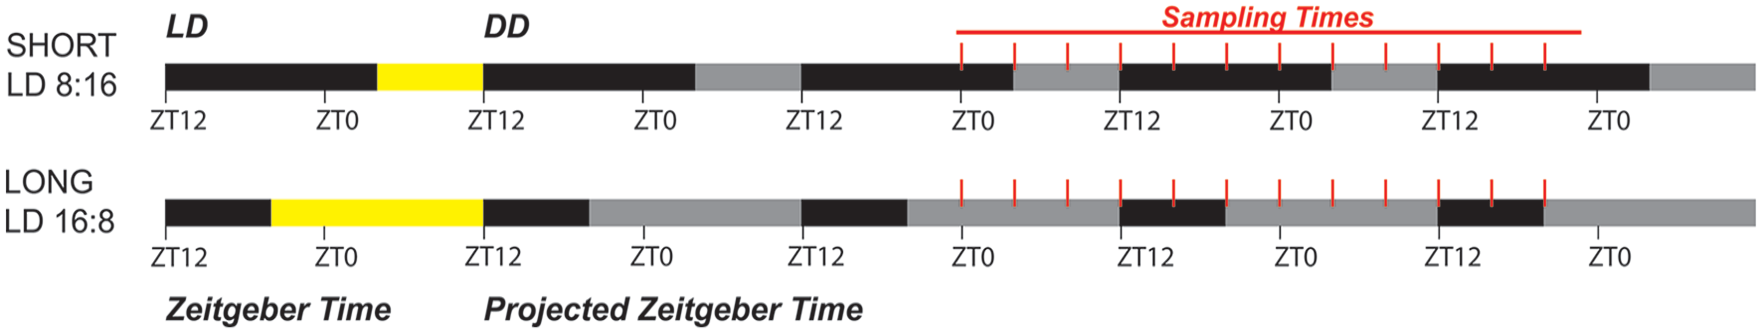
Sampling schematic for RNAseq. Last LD cycle before DD is shown at left in ZT, with yellow representing the light phase and where “lights-off” is ZT12. At postnatal day 50, the lighting regime was switched to constant darkness (DD) at the time of lights-off ZT12 as shown, (gray areas indicate the projected light phase), and mice spent a minimum of 36 h in DD before sample collection, which occurred every 4 h over 2 circadian cycles.
RNA Sequencing
The quality of RNA samples was assessed using an Agilent 2100 Bioanalyzer or a PerkinElmer GX TOUCH 205 Nucleic Acid Analyzer. Only those samples with an RNA integrity number (RIN) of 7.9 or above were used for sequencing. Stranded cDNA libraries were constructed using 200 ng of total RNA per sample, and the NEBNext Ultra II RNA Library Prep (NEB, Cat: E7765 S) per manufacturer’s instructions, with mRNA enriched via poly-A-selection using oligoDT beads. Paired-end sequencing was performed on the Illumina NovaSeq 6000, and RTA (version 2.4.11; Illumina) was used for base calling and demultiplexing. Approximately 54.6 million reads per sample (total of 11.1 billion reads) were obtained, which were processed utilizing Trim Galore 0.6.7 (Krueger et al., 2023) and Cutadapt 1.18 (Martin, 2011) to remove adapter sequences and pairs that were either shorter than 20 bp or that had Phred scores less than 20. The Spliced Transcripts Alignment to a Reference (STAR v2.7.9a) application (Dobin et al., 2013) was used to perform sequence alignments to the mm39 (GRCm39) mouse genome reference and GENCODE comprehensive gene annotations (release M31). STAR’s two-pass mapping approach was used to increase the detection of reads mapping to novel junctions identified during the first mapping pass. Overall, 91% of the raw sequencing reads were uniquely mapped to genomic sites. All data processing was performed at the Advanced Computing Center for Research and Education (ACCRE) at Vanderbilt University. Data are available at GEO accession GSE266472.
Data Analysis
For downstream analysis, data from the two circadian cycles sampled were superimposed as a single 24-h interval resulting in a minimum of n ≥ 7 sampled mice per timepoint. Differential analysis was performed by setting the short photoperiod as the baseline in the differential gene expression pairwise comparisons. Gene peak times (phases) in each photoperiod were calculated relative to the projected time of lights-off from the previous light dark cycle (ZT12). All analyses include and are normalized to protein-coding genes only (as determined by the gene_biotype obtained from BiomaRt and culled manually).
Differential Expression Analysis
To investigate genes that were significantly upregulated or downregulated in long photoperiods as compared to short photoperiods, we used differential expression analysis (DESeq2; Love et al., 2014). Of all 123 samples processed, 2 samples were identified as potential outliers due to their sequencing depth being lower than 5 million reads and −4σ standard deviation from the mean (16.9M). We confirmed these samples as outliers upon a Principal Components Analysis-based variance test, where they exceeded 2σ standard deviation within the samples’ respective condition groups and removed them from downstream analysis. For DESeq2, the design formula for the linear regression is ~batch + photoperiod, which (1) models or regresses out the batch effect and (2) allows us to study expression changes across the combination of photoperiod and zeitgeber times. Only genes that were present in at least 3 samples with normalized counts greater than or equal to 5 were retained. Gene annotations were retrieved from BiomaRt (Durinck et al., 2009) and mapped to Ensembl gene IDs. Genes without gene symbols were retained and labeled with their IDs.
Differential Rhythmic Analysis (DiffCircaPipeline)
To explore differences in rhythmic biomarkers (e.g. differential rhythmicity, phase, amplitude, MESOR) between photoperiod groups, the log2CPM-normalized expression data were analyzed using the DiffCircaPipeline (DCP) v0.99.9 framework (Xue et al., 2023). Briefly, DCP uses a cosinor fit model (Cornelissen, 2014) to estimate from the time sample data amplitude (A), phase (Φ), midline estimating statistic of rhythm (MESOR, M), and the noise level (σ) of gene expression rhythms. First, DCP tests whether each gene is to be considered rhythmic in each condition (photoperiod), categorizing genes into four types of rhythmicity (TOR): arrhythmic in both groups (Arrhy), rhythmic in only group I (RhyI), rhythmic in only group II (RhyII), and rhythmic in both groups (RhyBoth) based on the cosinor fits. Then, DCP performs a differential rhythm fitness test for genes rhythmic in at least one group using the goodness-of-fit coefficient of determination R2. For genes determined rhythmic in both conditions, the framework also calculates differences in phase, amplitude, and MESOR based on the cosinor fit. To account for the cyclical nature of phase (Φ) which DCP does not account for, 24 h were subtracted from Δ peak phase values 12 h or greater (Δ peak-24), while 24 h were added to values less than or equal to −12 h (Δ peak + 24), effectively normalizing phase shifts to within a −12 to 12 range. We have reported in the main text findings by DCP q-value and also in the Supplemental Data the DCP p-value for these parameters, which is comparable to the CircaCompare output (Parsons et al., 2020). Our data were entered into the framework using median of ratios Log2 normalized data, which were corrected for batch effects using Limma (Ritchie et al., 2015), and then analyzed using the default settings.
Gene Set Enrichment Analysis
To test for enrichment of functional gene groups in the DESeq2 differential expression data, DCP differential rhythmic amplitude data, and DCP differential MESOR data, we performed Gene Set Enrichment Analysis (GSEA, Subramanian et al., 2005). For differential expression data (from DESeq2), log2fold change (>±0.10) and false discovery rate (FDR)-adjusted p-value (<0.05) were used to create a ranked list. For differential rhythmic amplitude and differential MESOR (from DCP), p-value (<0.05) was used to create ranked lists. The C5 ontology gene sets collection of the Molecular Signatures Database (MSigDB) was queried (Liberzon et al., 2011, 2015).
Phase Set Enrichment Analysis
To test for enrichment of functional gene groups with coordinated changes in entrained phase, we used Phase Set Enrichment Analysis (PSEA) (Zhang et al., 2016). The input was the peak phases (Φ) of genes that were significantly rhythmic in both photoperiods as determined by DCP (Supplemental Material S1 Data and S7 Data). The default parameters for PSEA were used (Min genes per set = 10; Max sims/test = 1000), and the C5 ontology gene sets collection (C5) of MSigDB was queried (Liberzon et al., 2015; Subramanian et al., 2005). PSEA evaluated each gene set to determine if the peak expression of these genes was coordinated in time using the Kuiper statistic (Kuiper vs Background; Zhang et al., 2016).
Data Availability
Figures were generated using publicly available R-packages (The R foundation for Statistical Computing). The code that was used for the analyses and to generate the figures for this article can be found at https://gitlab.com/giannoma/OHC_RNAseq.git. Data have been deposited to NCBI’s Gene Expression Omnibus (GSE266472). Analysis of differential expression and rhythmicity (phase, amplitude, MESOR) across photoperiods is available for the whole SCN transcriptome online. Users may query genes of interest by visiting http://circadianphotoperiodseq.com/.
Results
To confirm photoperiod entrainment and plasticity in the melatonin-competent C3Hf+/+ strain, a cohort of mice were raised in long (LD 16:8) or short (LD 8:16) photoperiods, and their locomotor activity rhythms were recorded in running-wheel cages (see METHODS). C3Hf+/+ mice released into DD following entrainment to long photoperiods exhibited significantly advanced activity onsets, significantly shortened activity duration, and trends toward shortened free-running period compared to mice entrained to short photoperiods, similar to the original description of photoperiod plasticity effects in rodents (Pittendrigh and Daan, 1976a; Supplemental Figure S1).
To identify candidate genes for SCN photoperiod-induced plasticity, we examined changes in the circadian transcriptome of the SCN from C3Hf+/+ mice raised in long (LD 16:8) vs short (LD 8:16) photoperiods. Mice were paired and placed under short (LD 8:16) or long (LD 16:8) photoperiods, and litters were born and maintained under these conditions. At postnatal day 50, the lighting regime was switched to DD at the respective time of lights-off (ZT12) for each photoperiod. Mice spent a minimum of 36 h in DD before sample collection began, and then SCN dissections took place at intervals of 4 h over 2 circadian cycles (Figure 1). We analyzed differential gene rhythmicity using DCP (Xue et al., 2023), and differential gene expression using DESeq2 (Love et al., 2014). Data are available at http://circadianphotoperiodseq.com/, where users can query genes of interest in the whole SCN transcriptome and view their expression and rhythmic properties across these photoperiod conditions.
Differential Rhythmicity
Analysis of the whole SCN transcriptomic datasets with DCP revealed that of the 16,549 transcripts detected by DCP, 2488 genes, or 15% of the transcriptome, were detected as rhythmic in both photoperiods. A total of 10,501 genes (63.5%) were considered arrhythmic, and 2864 genes (17.3%) were found to be rhythmic in short photoperiod only, while just 697 genes (4.21%) were found to be rhythmic in long photoperiod only (Figure 2a). Figure 2b shows heatmaps of genes detected as rhythmic in both photoperiods by DCP. Analysis of the peak times of rhythmic genes as determined by DCP using cosinor fits showed two distinct groups in gene expression timing present in both photoperiods (Figure 2c), corresponding to the well-described “day” and “night” groupings in SCN gene expression (Panda et al., 2002). The timing of both gene expression peaks was advanced in long photoperiod by ~4-6 h relative to short photoperiod when phase is determined relative to the prior time of lights-off, which is consistent with previous smaller-scale studies of SCN gene expression in different photoperiods (Ciarleglio et al., 2011; Sumová et al., 2003; Tackenberg et al., 2020). Indeed, analysis of specific differential rhythmic parameters including peak phase, rhythmic amplitude, and the MESOR (as illustrated in Supplemental Figure S2) demonstrated that the majority (73.5%) of genes that were rhythmic in both photoperiods had significantly different peak phases by q-value. The vast majority (1825) of these genes were advanced in the long as compared to the short photoperiod, while only 4 genes were delayed: GTP binding protein overexpressed in skeletal muscle (Gem), HAUS augmin-like complex subunit 3 (Haus3), leucine-rich repeats and IQ motif containing 3 (Lrriq3), and Ras association and DIL domains (Radil).
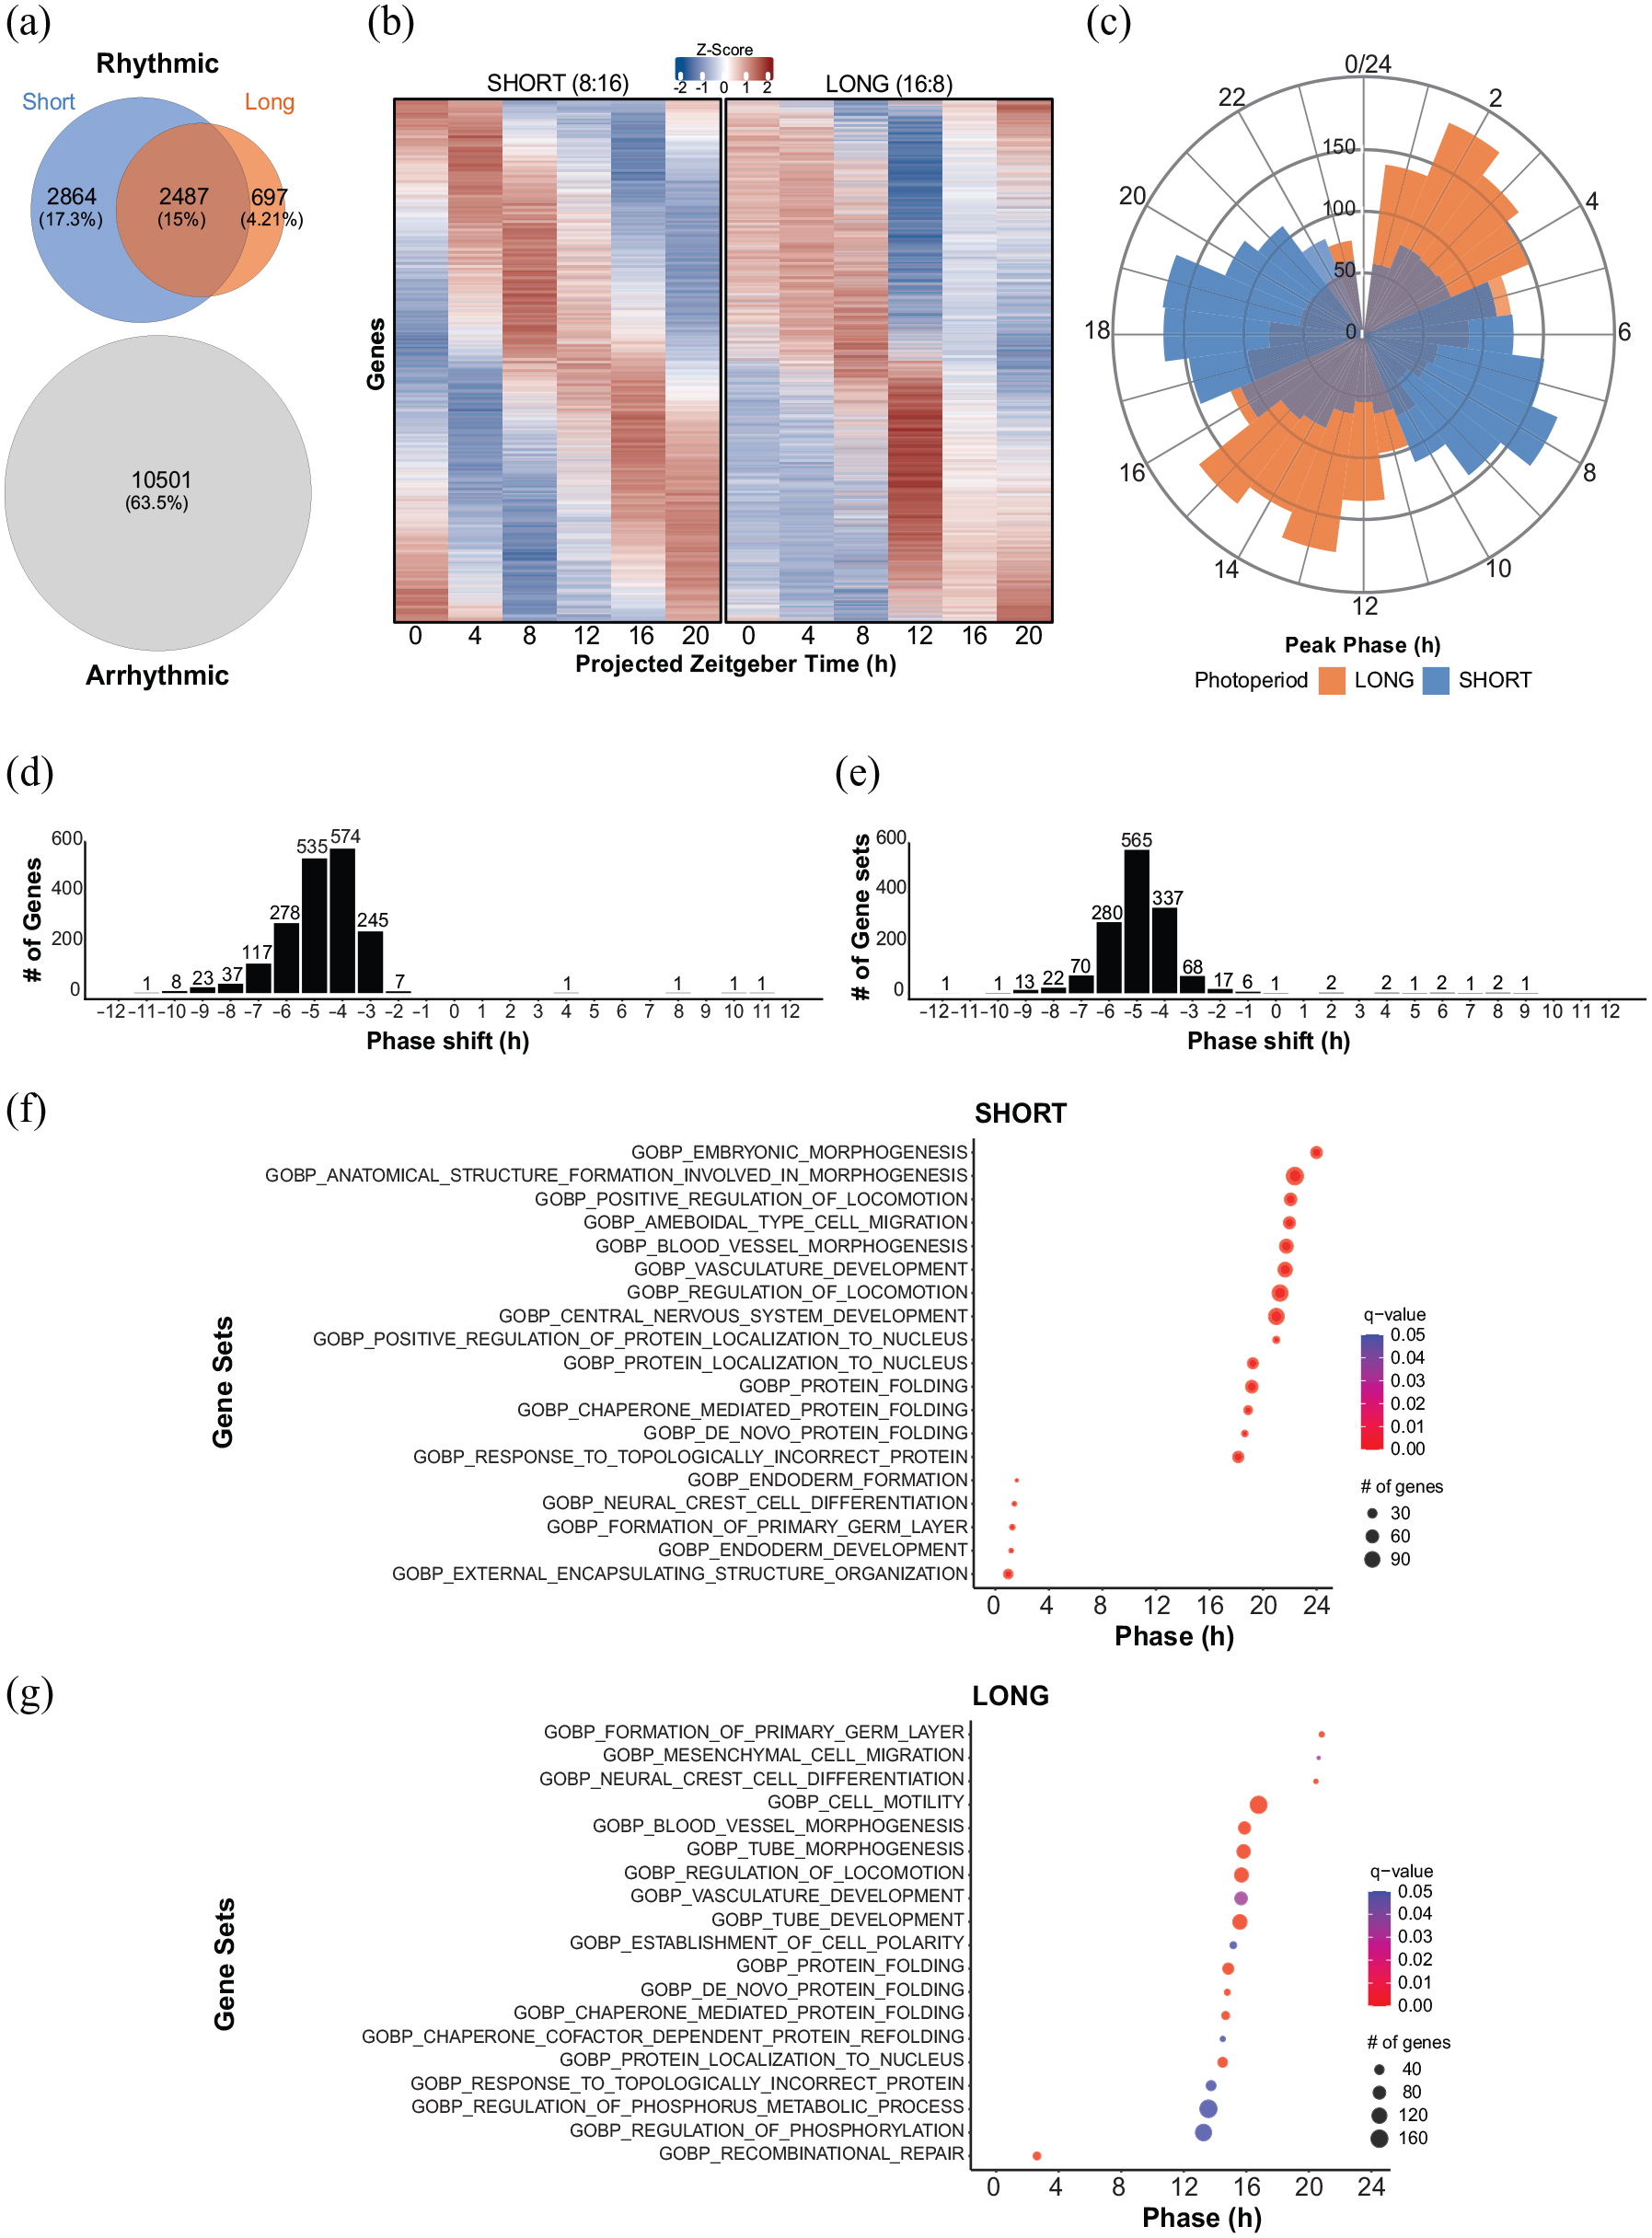
Transcriptome differential gene rhythmicity across photoperiods. (a) Venn diagram showing the number of protein-coding genes detected as rhythmic in short, long, both, and in neither photoperiod. (b) Heatmap showing rhythmic gene expression in short and long photoperiods across time. (c) Radar plot showing the peak phase for short (blue) and long (orange) photoperiods for genes determined to be rhythmic in both conditions. (d) Histogram showing the distribution of genes according to their difference in peak phase (long-short). (e) Frequency histogram delineating gene sets from the Gene Ontology database (PSEA) by their respective phase differences from short to long photoperiod. (f) Column presenting the top 19 gene sets that exhibit significant phase coherence by the Kuiper statistic (q-value < 0.05) in short photoperiod. (g) Column presenting the top 19 gene sets that exhibit significant phase coherence by the Kuiper statistic (q-value < 0.05) in long photoperiod.
In contrast to the peak phase, the rhythmic amplitude and MESOR of genes were rarely found to be significantly different between photoperiods after DCP correction for FDR (q < 0.05). However, it is worth noting here that previous analyses that employ cosinor fits to calculate the aforementioned rhythmic parameters, including the highly-cited “CircaCompare,” do not use FDR correction (Ding et al., 2021; Parsons et al., 2020). Therefore, we also investigated our rhythmic results at a threshold of p < 0.05. One hundred fifty-five genes showed significant changes in rhythmic amplitude (1 increased, 154 decreased), while 447 genes showed significant changes in MESOR (209 increased, 238 decreased) in long vs short photoperiods (Supplemental Material S1a Data). These DCP p-value significant changes are noted for individual rhythmic genes in the Differential Expression section below, and DCP output is also available parsed by the DESeq2 functional gene groups below (Circadian, Neuropeptide, Light Response, GABA, Ionic, Serotonin, and Dopamine) in Supplemental Material S1b-S1g Data.
We also performed pathway analysis on the differential rhythms dataset using PSEA (Zhang et al., 2016) and GSEA (Subramanian et al., 2005). PSEA of the genes, detected as phase shifted in long vs short by DCP (q < 0.05), revealed a broad peak of genes phase-advance centered at 4-6 h (Figure 2d and Supplemental Material S2 Data), in agreement with the absolute phases of gene expression plotted in Figure 2c, as well as a similar broad peak for gene sets with shifted timing, again centered at 4-6 phase advance (Figure 2e and Supplemental Material S2 Data). Pathway enrichment for phase-shifted genes in short and long photoperiods both included regulation of locomotion, which contains circadian-related genes, as well as other overlapping and non-overlapping gene sets (Figure 2f and 2g; Supplemental Material S2 Data). In addition, GSEA of genes that were significant for changes in rhythmic amplitude and MESOR showed pathway enrichment for Rhythmic Process and Positive Regulation of Gene Expression among others (Supplemental Figure S3 and Supplemental Material S3 Data).
Differential Expression
Analysis of differential gene expression using DESeq2 revealed salient differences in gene expression levels in the SCN transcriptomes of mice kept under long versus short photoperiods. Of the 16,856 transcripts analyzed with DESeq2, 1518 were differentially expressed between the short and long photoperiods (p-adj < 0.05; Log2FC > ± 0.1; Supplemental Material S4a Data). Of these, 972 were significantly downregulated, and 546 were significantly upregulated in long photoperiod. A volcano plot of the whole SCN data shows large magnitude changes in expression in known hypothalamic photoperiod response genes downstream of the SCN, such as Lrat in the retinoic acid signaling pathway (Shearer et al., 2010) and Tshβ (Korf and Møller, 2021), Npvf (Dardente and Simonneaux, 2022), Dct (Dardente and Lomet, 2018), Dio2 (Korf and Møller, 2021), Tafa3 (Korf and Møller, 2021), and Slc16a2 (Ross et al., 2011) in the photoperiodic endocrine system (Figure 3), indicating that the photoperiod exposure indeed evoked a downstream photoperiodic response. Furthermore, the direction of change agrees with multiple studies in mammals, with Lrat, Npvf, Tshβ, Dct, and Dio2 all reported to be upregulated in long photoperiod (Dardente and Lomet, 2018; Haugg et al., 2022; Korf and Møller, 2021; Shearer et al., 2010).
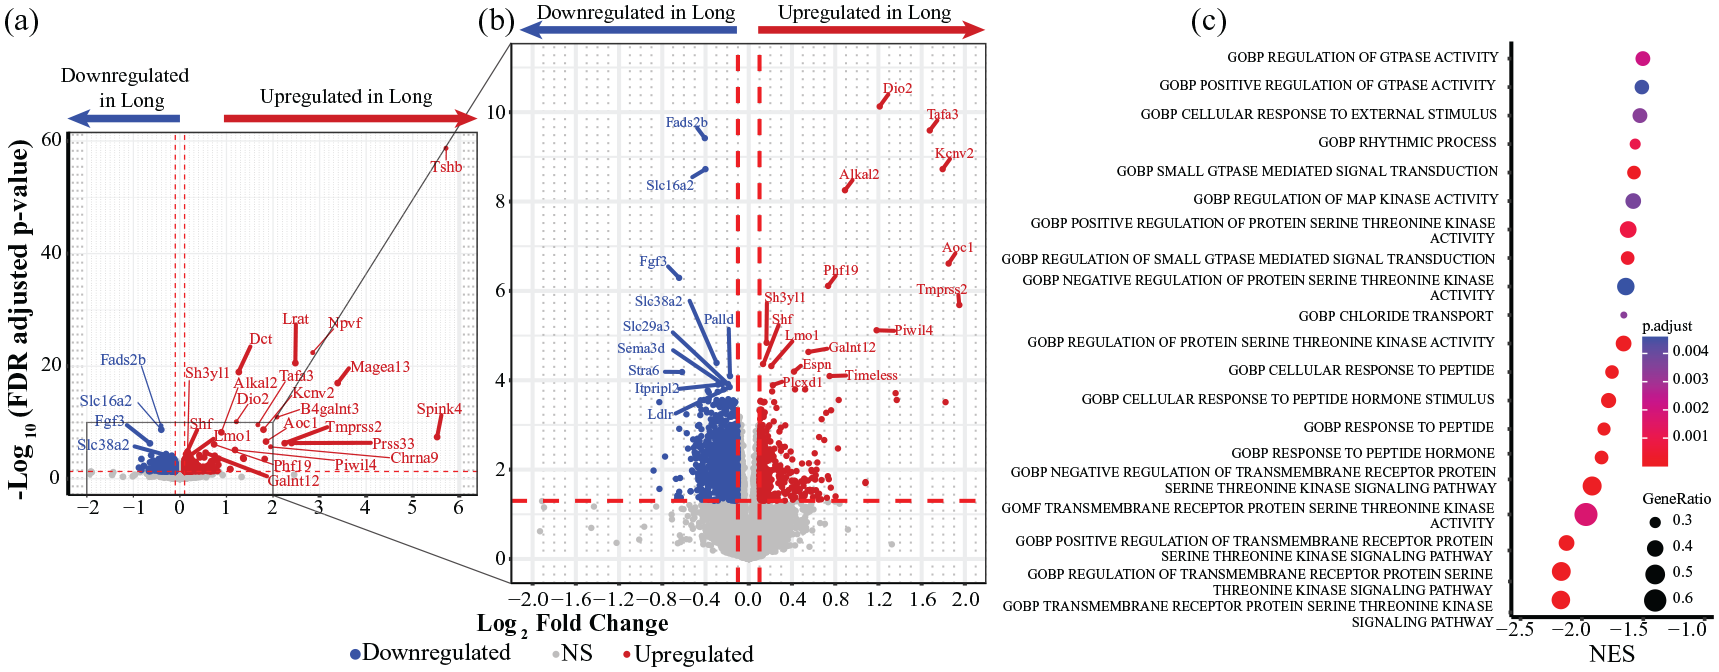
Transcriptome differential gene expression across photoperiods. (a) Volcano plot showing changes in gene expression between short and long photoperiods. Directionality = from short to long (Long − Short). Downregulated genes are shown in blue, and upregulated genes are shown in red. Thresholds for significance were set at log2FC > ± 0.1 (red dashed vertical lines) and p-adj < 0.05 (red dashed horizontal line). The top 25 genes meeting these criteria are labeled. (b) Zoom view of the volcano plot (gray box). Threshold for significance same as panel a. The top 25 differentially expressed genes in the plot are labeled. (c) Pathway analysis showing relevant enriched gene sets, all of which were downregulated in long photoperiod (as shown by negative normalized enrichment score [NES]).
GSEA of differentially expressed genes revealed ca. 2400 enriched gene sets (p-adj < 0.05) including 33 pathways related to locomotor rhythms, SCN light signaling pathways (GTPase, MAPK, S/T kinase), peptide hormone response, as well as GABA, chloride, potassium, and calcium transport (Figure 3c, Supplemental Material S5 Data). To further assess the representation of SCN-expressed genes in our dataset, we queried the transcripts detected by DESeq2 against the SCN-enriched gene set of Pembroke et al. (2015), which was obtained using laser capture microscopy of C3 H mouse SCN. Of the 146 SCN-enriched genes, 134 (92%) were detected in our samples (Supplemental Material S6 Data). In addition, similar high degrees of overlap were found in comparison to gene expression data from recent scRNA studies of SCN neurons (Morris et al., 2021; Wen et al., 2020). The gene sets from these two scRNA studies of SCN neurons have also been used computationally to define SCN neurons as a class within the hypothalamus (Steuernagel et al., 2022). Taken together, these analyses indicate that SCN-expressed genes are well-represented in our dataset. An exploratory analysis revealed that SCN neuron-expressed genes were enriched in SCN light response genes, neuropeptide signaling genes, and synaptic signaling genes, similar to the GSEA pathways found above. We therefore further analyzed differential expression within these SCN functional gene groups as described below (Figures 4-7 and Supplemental Figures S4 and S5).
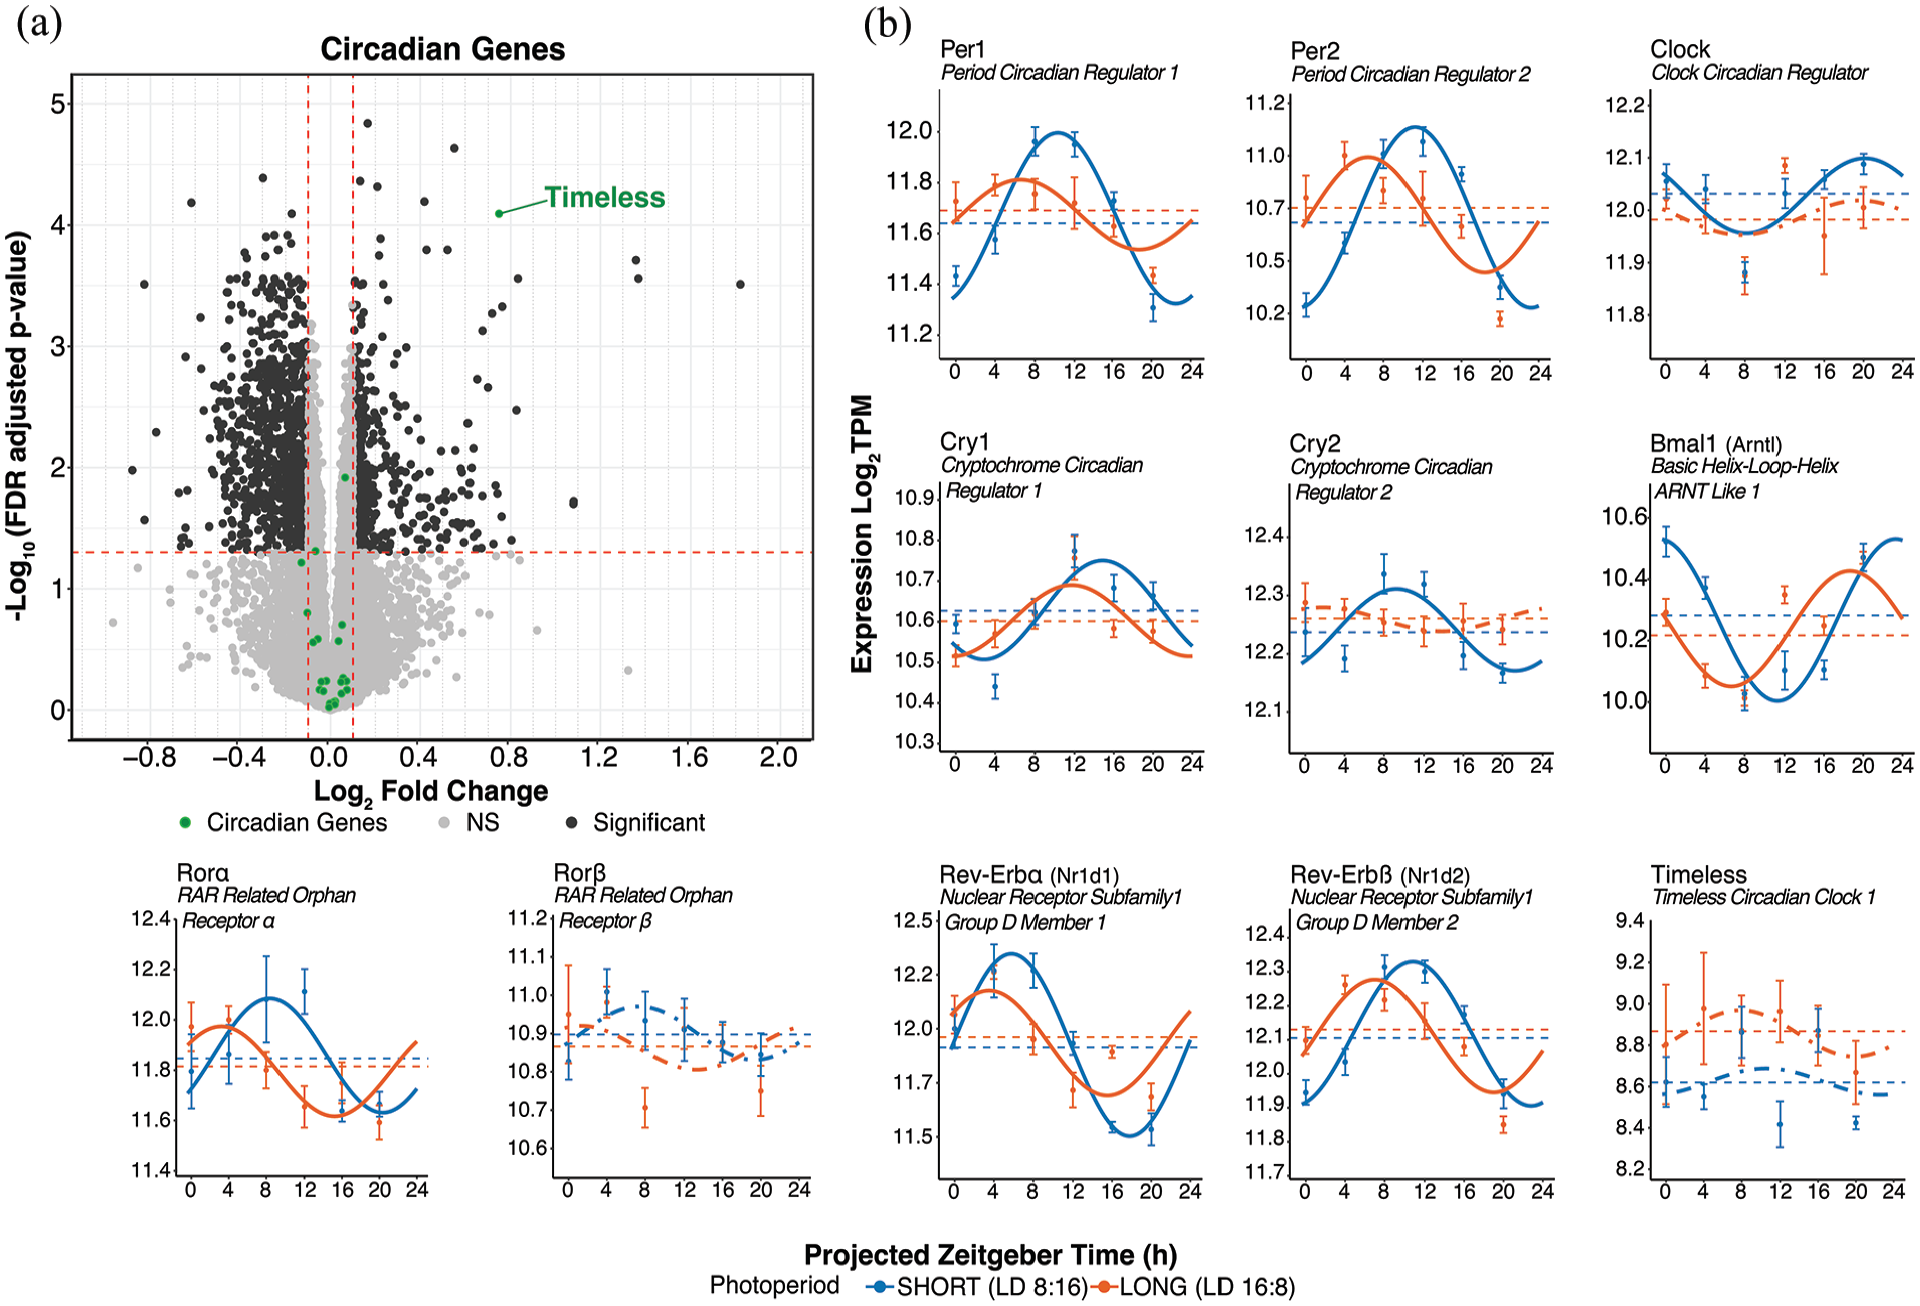
Circadian clock gene differential expression and rhythmicity in response to photoperiod. (a) DESeq2 volcano plot of gene expression highlighting clock genes in green. Genes meeting the log2FC > ±0.1 and p-adj < 0.05 are labeled. (b) Cosinor plots illustrating the rhythmicity of selected clock genes. Solid lines depict significantly rhythmic cosinor fits, whereas dot-dashed traces indicate non-rhythmic fits. Points indicate mean ± SEM for samples collected at each timepoint (n ≥ 7). Dashed lines represent the overall mean across timepoints. Short (8:16) and long (16:8) photoperiods are represented in blue and orange, respectively.
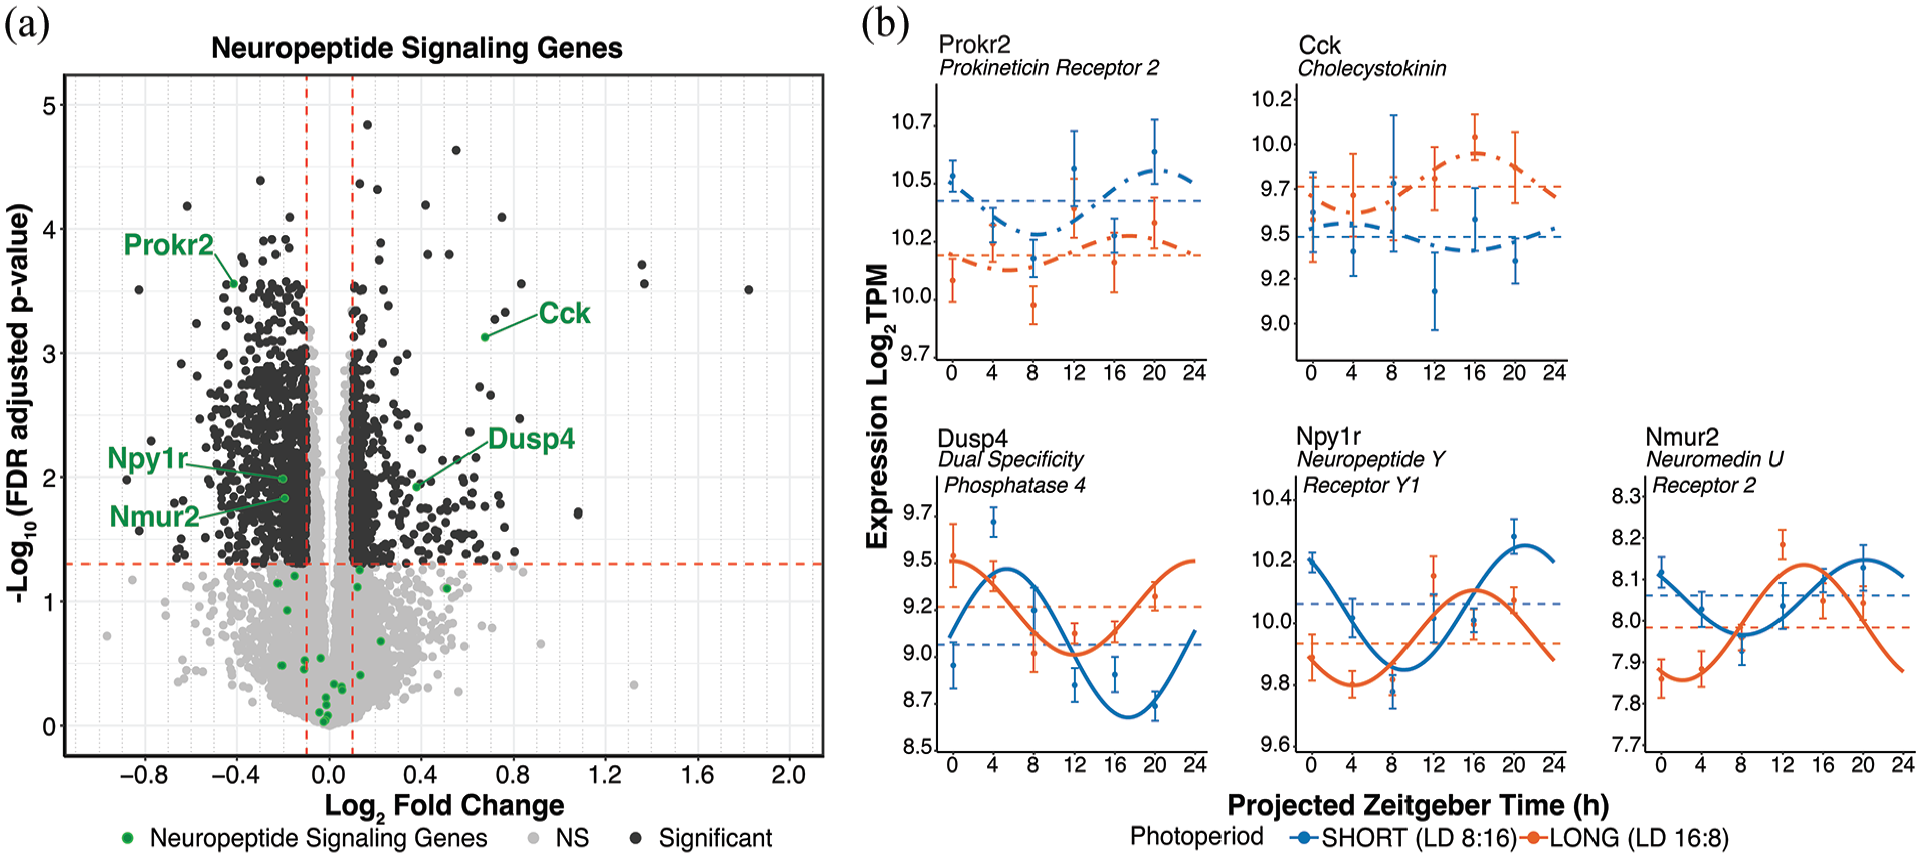
Neuropeptidergic signaling gene differential expression and rhythmicity in response to photoperiod. (a) DESeq2 volcano plot of gene expression highlighting neuropeptide signaling genes in green. Genes meeting the log2FC > ± 0.1 and p-adj < 0.05 are labeled. (b) Cosinor plots of differentially expressed genes. Solid lines depict significantly rhythmic cosinor fits, whereas dot-dashed traces indicate non-rhythmic fits. Points indicate mean ± SEM for samples collected at each timepoint (n ≥ 7). Dashed lines represent the overall mean across timepoints. Short (8:16) and long (16:8) photoperiods are represented in blue and orange, respectively.
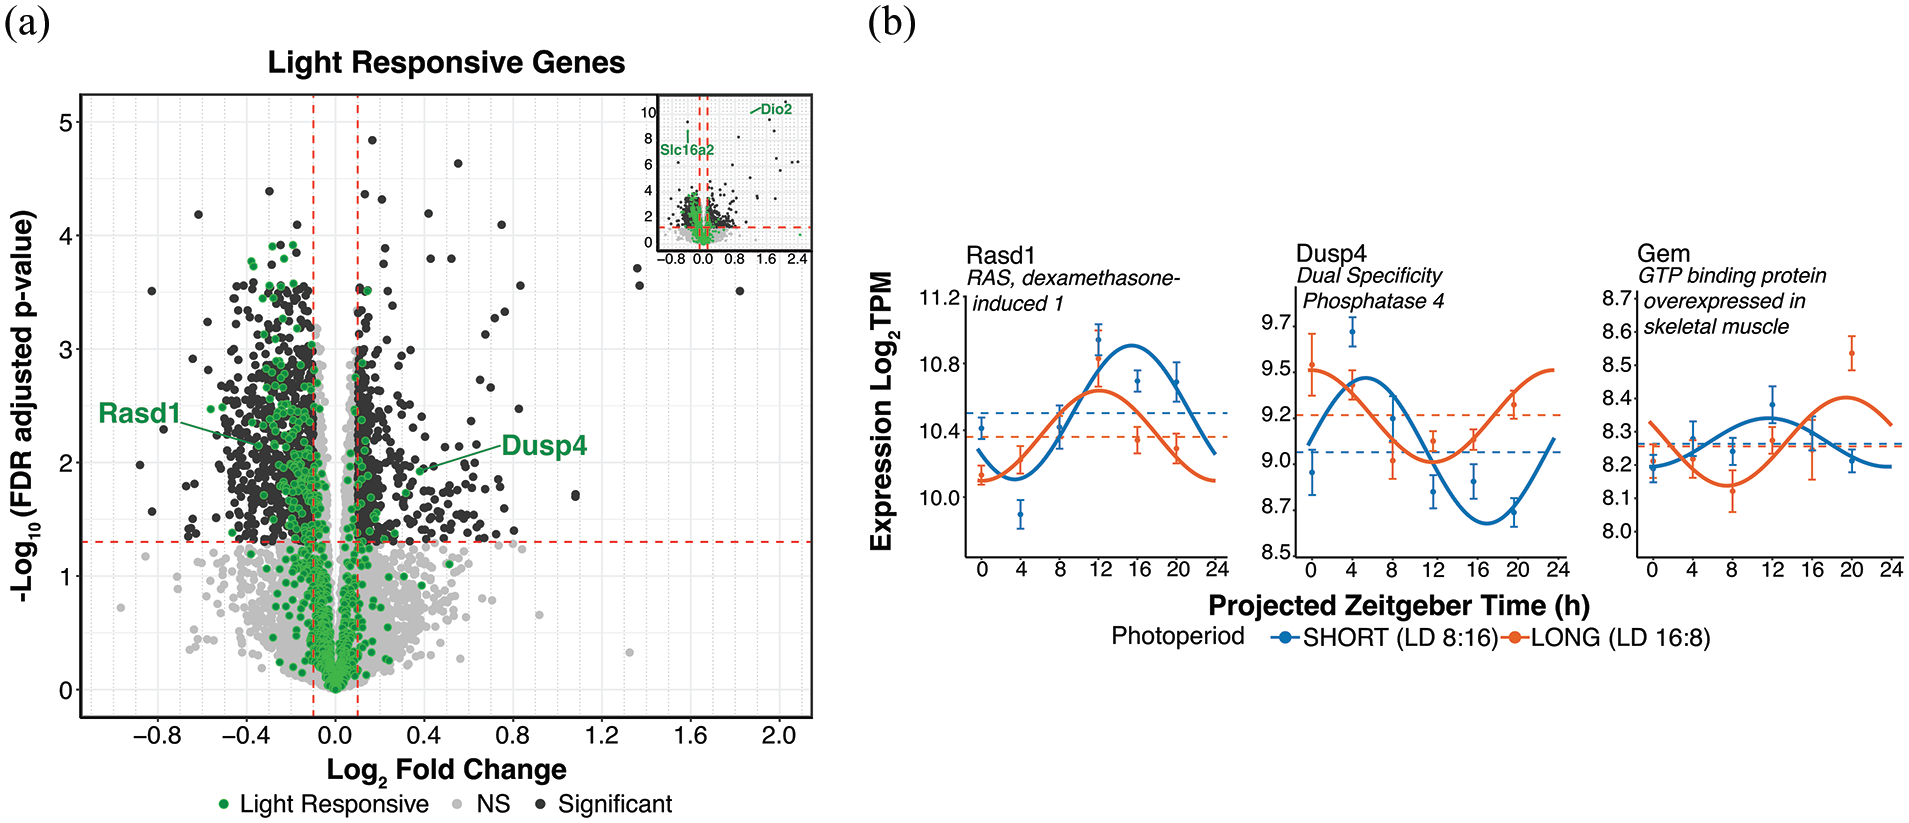
Light responsive gene differential expression and rhythmicity in response to photoperiod. (a) DESeq2 volcano plot of gene expression highlighting light responsive SCN genes (Xu et al., 2021) in green at log2FC > ± 0.1 and p-adj < 0.05. (b) Cosinor plots of selected genes (described in panel a). Solid lines depict significantly rhythmic cosinor fits, whereas dot-dashed traces indicate non-rhythmic fits. Points indicate mean ± SEM for samples collected at each timepoint (n ≥ 7). Dashed lines represent the overall mean across timepoints. Short (8:16) and long (16:8) photoperiods are represented in blue and orange, respectively.
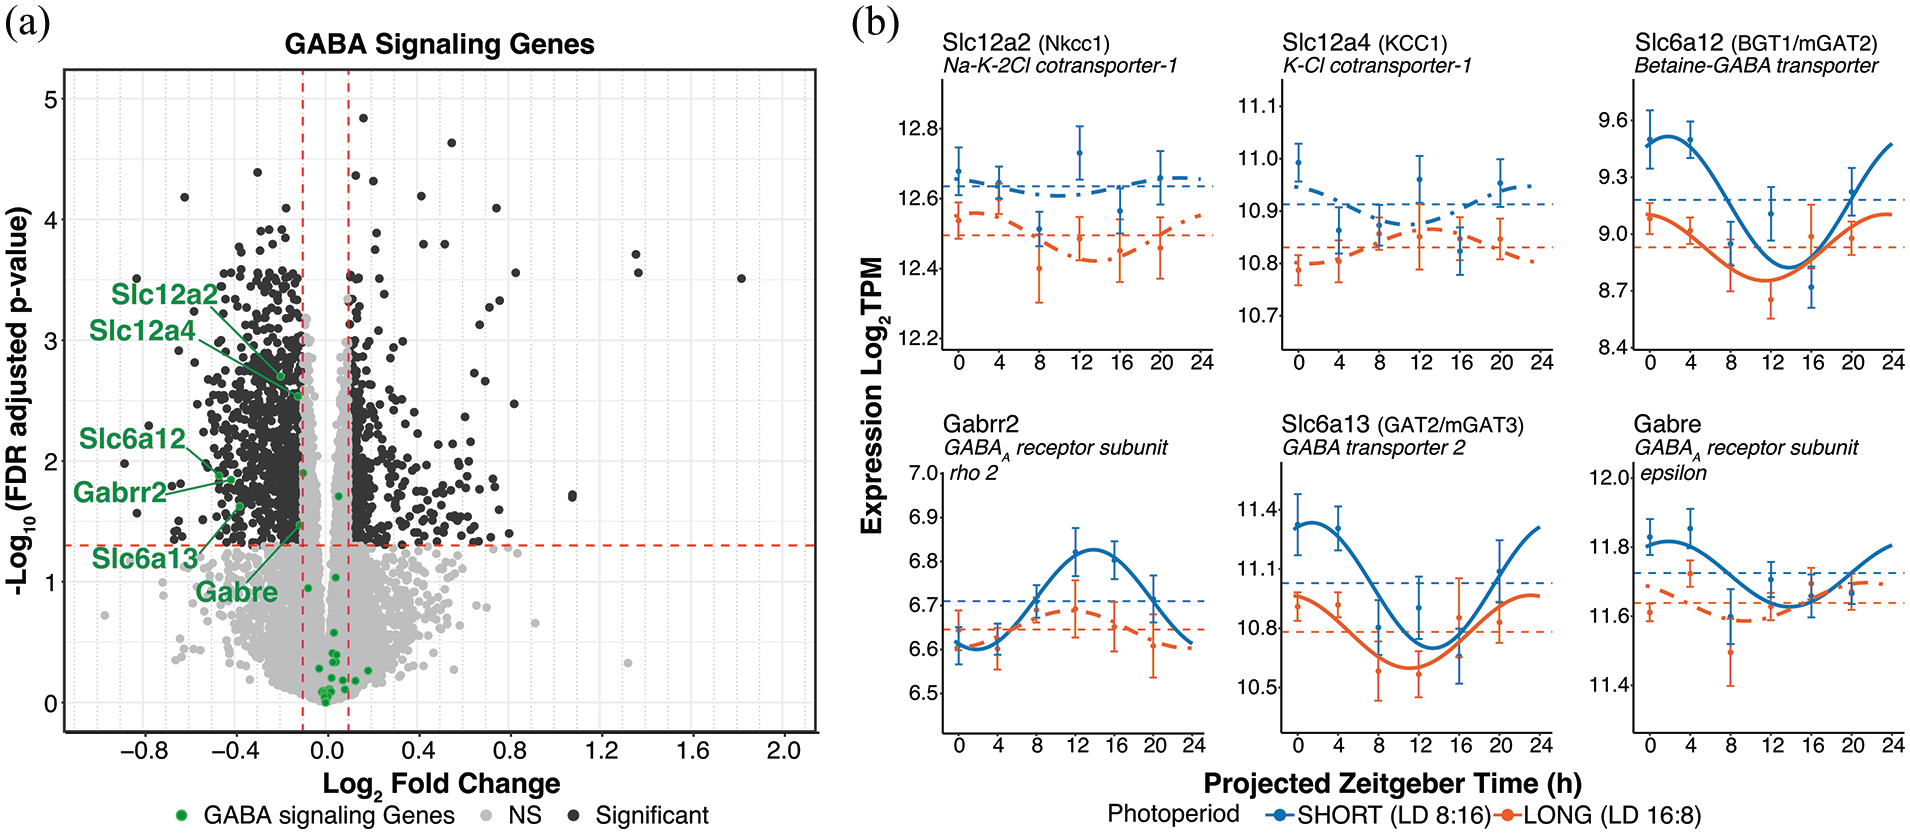
GABA signaling gene differential expression and rhythmicity in response to photoperiod. (a) DESeq2 volcano plot of gene expression highlighting GABA signaling genes in green. Genes meeting the log2FC > ± 0.1 and p-adj < 0.05 are labeled. (b) Cosinor plots of differentially expressed genes. Solid lines depict significantly rhythmic cosinor fits, whereas dot-dashed traces indicate non-rhythmic fits. Points indicate mean ± SEM for samples collected at each timepoint (n ≥ 7). Dashed lines represent the overall mean across timepoints. Short (8:16) and long (16:8) photoperiods are represented in blue and orange, respectively.
Circadian Clock Genes
To determine whether photoperiod substantially impacted the core molecular clockworks, we analyzed differential expression and rhythmicity of 23 circadian clock genes and clock-associated genes detected by DESeq2. Overall, the expression and rhythmicity of these genes were consistent with expectations from previous studies (Panda et al., 2002; Zhang et al., 2014; Figure 4). Surprisingly, we found no significant differences by DESeq2 in the expression level of core clock genes between short and long photoperiods. However, there was a significant increase in expression level of the circadian-associated gene Timeless in long photoperiod (Figure 4a and Supplemental Material S4b Data).
In terms of differential rhythmicity of clock genes shown in Fig. 4b, the peak phases were advanced 2-5 h in long photoperiod (DCP, q < 0.05). The core clock gene Per1 showed a significant loss of rhythmic power in long photoperiod (DR fitness (DR2), DCP, q<0.05, Supplemental Material S7 Data). Three additional clock genes, Per2, Ciart, and Clock showed trend-level decreases in rhythmic power in long photoperiod as well (DR fitness [ΔR2], DCP, p < 0.05, Supplemental Material S7 Data). In addition, Per1, Per2, Arntl, Nr1d1, and Ciart showed significant reductions in rhythmic amplitude by DCP p-value (<0.05); however, none showed significant changes in MESOR (Supplemental Material S1b Data). Per1 and Ciart also showed decreased rhythmic amplitude in long photoperiod at DCP q < 0.10 (Supplemental Material S1b Data). Cry2 and Clock were detected by DCP as rhythmic only in short photoperiod (Supplemental Material S7 Data), whereas Rorβ and Timeless were not detected as rhythmic in either photoperiod. Cosinor fits of clock gene expression across the 48-h sampling period are shown in Supplemental Figure S6. Differential rhythmicity data on additional clock genes are available in Supplemental Material S1b Data.
Neuropeptide Signaling Genes
Several neuropeptide signaling axes exist within the SCN neural network, including arginine vasopressin (AVP), cholecystokinin (CCK), gastrin-releasing peptide (GRP), neuromedin S (NMS), neuropeptide Y (NPY), prokineticin 2 (PROK2), and VIP (Hastings et al., 2018). A number of these peptides play important roles in SCN light responses, light resetting, and entrainment. In particular, VIP released from light-excited retinorecipient SCN neurons transmits light input broadly in the SCN neural network for light-induced resetting and neuronal synchrony (Hamnett et al., 2019; Kuhlman et al., 2003), and neurons expressing CCK are critical for responses to long photoperiods and may activate VIP neurons specifically under long photoperiod (Xie et al., 2023). We investigated 26 genes detected by DESeq2 that either make up the signaling axes themselves (peptides, receptors) or are involved in their modulation. Of these, we found that prokineticin receptor 2 (Prokr2), neuropeptide Y receptor Y1 (Npy1r), and neuromedin U receptor 2 (Nmur2) were significantly downregulated in long photoperiod, while cholecystokinin (Cck) and dual-specificity phosphatase 4 (Dusp4), a modulator of VIP responses (Hamnett et al., 2019), were significantly upregulated (Figure 5a; Supplemental Material S4c Data). Rhythms in Npy1r, Nmur2, and Dusp4 expression showed significant differences in peak phase between photoperiods (DCP, q < 0.05). Npy1r and Nmur2 also showed significant decreases in MESOR, while Dusp4 showed a significant increase in MESOR (DCP p < 0.05); however, none of these genes showed significant changes in rhythmic amplitude by DCP p-value (Figure 5b, Supplemental Material S1c Data).
Light Responsive Genes
Persistent alterations in SCN clock period are evoked by single clock-resetting light pulses, as well as by entrainment to different photoperiods (Kim and McMahon, 2021; Pittendrigh and Daan, 1976a), and entrainment to different photoperiods alters the acute response of the SCN to light pulses (Glickman et al., 2012; Pittendrigh et al., 1984; VanderLeest et al., 2009), suggesting the possibility of mechanistic overlap between these responses to circadian light input. Therefore, we sought to examine whether the expression of acutely light responsive SCN genes might also be altered in our photoperiod treatments. A recent RNAseq study by Xu et al. (2021) examined which SCN genes responded acutely to light by exposing mice to pulses of light lasting 0.5, 1, 3, and 6 h. We compiled a global list of light-responsive SCN genes in that study by combining the genes both upregulated and downregulated across all the pulse durations and removing those genes found in both groups. Of the 959 genes acutely regulated by light in the Xu et al. data (Xu et al., 2021), 99% of these genes were detected in our dataset, and 166 of these genes showed significant differential expression across photoperiods (Supplemental Material S4d Data). Interestingly, among the genes differentially expressed are Dusp4 and Rasd1, both of which are key modulators of the SCN light response through their actions on the critical NMDAR, MAPK/ERK, and CREB/CRE light transduction pathway (Cheng et al., 2004; Hamnett et al., 2019; Figure 6a). Rasd1 was also detected as rhythmic in both photoperiods and showed the typical advanced peak phase in long (DCP, q < 0.05), as well as a decrease in MESOR and no change in rhythmic amplitude by DCP p-value (Figure 6b, p-value < 0.05, Supplemental Material S1d Data). DCP results for Dusp4 are described in the neuropeptide signaling gene results. In addition, Gem, which also modulates SCN phase resetting to light through negative feedback onto the MAPK/ERK pathway (Matsuo et al., 2022), was one of the very few genes that showed a significant phase delay in long compared to short photoperiod (Figure 6b).
GABA Signaling Genes
Virtually all neurons in the SCN communicate via the neurotransmitter GABA, and photoperiodic regulation of inhibitory vs excitatory GABA transmission in the SCN is thought to be a key mechanism underlying photoperiodic plasticity (Farajnia et al., 2014; Myung et al., 2015; Rohr et al., 2019). Of 36 genes involved in SCN GABA signaling detected by DESeq2, 6 were found to be differentially expressed, all downregulated in long photoperiod (Figure 7a, Supplemental Material S4e Data). These included Na-K-2Cl cotransporter-1 (Nkcc1/Slc12a2), K-Cl cotransporter-1 (KCC1/Slc12a4), betaine-GABA transporter (BGT1/Slc6a12/mGAT2), GABA transporter 2 (GAT2/Slc6a13/mGAT3), GABAA receptor subunit rho 2 (Gabrr2), and GABAA receptor subunit epsilon (Gabre; Figure 7a). Slc6a12 and Slc6a13 were detected by DCP as rhythmic in both photoperiods while Gabrr2 and Gabre were detected as rhythmic only in short photoperiod (Supplemental Material S7 Data). Slc12a2 and Slc12a4 were not detected as rhythmic in either photoperiod. In addition, Slc6a12 and Slc6a13 showed significant reductions in MESOR in long photoperiod by DCP p-value (<0.05, Supplemental Material S1e Data).
Ionic Signaling Genes
Previous work on SCN plasticity in response to entrainment to different light cycle periods has suggested the regulation of ionic and synaptic signaling genes as a potential mechanism for mediating that form of SCN plasticity (Azzi et al., 2017); therefore, we also examined calcium, potassium, sodium, and chloride voltage-gated channels genes, and related genes, in our dataset (166 genes total). Of these, 16 genes were differentially expressed between photoperiod conditions. Eleven genes including Kctd14, Kcnk5, Slc13a4, Kcnj13, Slc13a3, Kcna1, Ano1, Cacna2d4, Kcnk13, Kctd11, Kctd12 were downregulated in long photoperiod, while five genes including Kcnv2, Scn4a, Clcn1, Sclt1, and Cacng7 were upregulated in long photoperiod (Supplemental Figure S4a and Supplemental Material S4f Data). Kctd12 and Ano1 were detected as rhythmic in both photoperiods. Kctd12 exhibited phase advanced expression in long photoperiod (DCP, q<0.05). Both Kctd12 and Ano1 showed significant decreases in MESOR in long photoperiod by DCP p-value (<0.05) (Supplemental Figure S4b and Supplemental Material S1f Data).
Serotonin and Dopamine Signaling Genes
Serotonin and dopamine inputs to the SCN modulate SCN light responses and entrainment (Grippo et al., 2017; Quintero and McMahon, 1999), and therefore, we surveyed transcripts involved in serotonin and dopamine signaling in our dataset (24 genes total: 7 genes involved in dopamine signaling and 17 genes involved in serotonin signaling). The serotonin receptor 7 (Htr7) and the serotonin transporter (Slc6a4/Sert) were upregulated, while the serotonin receptor 3B (Htr3b/5-HT3B) was downregulated in long photoperiod, while no dopamine signaling genes examined were found to have significant changes in expression (Supplemental Figure S5a and Supplementary Material S4g Data). None of these genes were detected as rhythmic by DCP (Supplemental Figure S5b and Supplementary Material S1g Data).
Discussion
Seasonal photoperiods entrain circadian rhythms and induce enduring plasticity in the SCN clock. To elucidate novel potential molecular mechanisms of photoperiod plasticity, we performed RNAseq on whole SCN dissected from mice raised in long (LD 16:8) and short (LD 8:16) photoperiods. Overall, in terms of differential rhythmicity, fewer rhythmic genes were detected, and there was an overall phase advance of gene expression rhythms of a few hours in long photoperiod. DESeq2 showed no significant changes in the expression levels of the core clock genes; however, there were prominent differences across photoperiods in genes involved in SCN neuropeptide signaling and light response.
The advanced phase and decreased rhythmic power of core clock genes in long photoperiod are consistent with previously demonstrated outcomes of entrainment to long photoperiods, including altered rhythmic waveforms and decreased rhythmic amplitude, as well as increased phase dispersal of single-cell SCN rhythms (Buijink et al., 2016; Ciarleglio et al., 2011; Inagaki et al., 2007; Pittendrigh and Daan, 1976a; Sumová et al., 2003; Tackenberg et al., 2020; VanderLeest et al., 2007). In contrast, the clock-associated gene Timeless showed a significant increase in expression level in long photoperiod. Timeless is a core clock gene in Drosophila; however, its precise function in the mammalian SCN is unclear. Knockdown of Timeless abrogates SCN electrophysiological rhythms, while homozygous germ-line knockout is embryonic lethal, and heterozygotes show normal circadian rhythms (Barnes et al., 2003; Gotter et al., 2000). A human mutation in Timeless is associated with altered sleep phase and modifies clock period and stability of PER/CRY complexes in mice (Kurien et al., 2019). Thus, the photoperiod-driven changes in Timeless expression we describe here have the potential to affect SCN rhythmic properties.
While photoperiod-induced changes in the expression of clock genes were relatively few, there were abundant changes in expression levels of SCN neural signaling genes related to neuropeptides, GABA, ion channels, serotonin, and dopamine. All 29 genes from these categories were found to exhibit photoperiod-dependent changes in expression level using DESeq2. Previous results have established regulation of inhibitory vs excitatory GABA signaling in the SCN through the expression of Nkcc1 and Kcc2 chloride transporter genes as a likely mechanism of photoperiodic plasticity (Farajnia et al., 2014; Myung et al., 2015; Rohr et al., 2019). Indeed, we found expression changes in six GABA signaling genes—Nkcc1/Slc12a2, KCC1/Slc12a4, GAT2/Slc6a13/mGAT3, BGT1/Slc6a12/mGAT2, Gabrr2, and Gabre, all of which were reduced in expression in long photoperiod. The expression of Nkcc1 compared to Kcc2 was previously found to increase in the dorsal SCN in long days (Myung et al., 2015); however, Nkcc1 expression was reduced overall in our data, and Kcc2 was not significantly changed. These differences may be due to the fact that photoperiod regulation of Nkcc1/Kcc2 in the SCN is highly region-specific (Myung et al., 2015; Rohr et al., 2019), and our data are taken from whole SCN, perhaps obscuring regional changes. In addition, while we found expression changes in the GABA transporters GAT2 (Slc6a13/mGAT3) and BGT1 (Slc6a12/mGAT2), we did not detect significant changes in the principal SCN-expressed GABA transporters of GAT1 (Slc6a1, mGAT1), which is expressed in neurons and astrocytes, and GAT3 (Slc6a11, mGAT4), which is expressed in astrocytes and is critical for regulation of extracellular GABA levels and rhythms (Patton et al., 2023). Thus, the changes in expression of GABA signaling genes we observed present the possibility of contributing to SCN plasticity, but in themselves, they do not establish a very coherent picture.
A recent report by Porcu et al. (2022) described changes in the number of SCN VIP-expressing and NMS-expressing neurons in response to photoperiod. We did not observe differential expression of these peptide genes, but we did observe a significant change in the expression of Nmur2, the principal receptor for NMS in the SCN. There are substantial differences in both the mouse strains and photoperiod stimuli used in these studies that likely account for these apparent differences in results. Here, we have used melatonin-competent C3Hf+/+ mice and long-term entrainment to photoperiods including development (E0-P50), while Porcu et al. used melatonin synthesis–deficient C57BL6 mice and 15 days of photoperiod entrainment in adult mice aged 9-16 weeks (Porcu et al., 2022).
A category of SCN genes that showed a particularly robust response to photoperiod were SCN light-responsive genes – genes that change expression rapidly (within 6 h) in response to a phase-resetting light pulse (Xu et al., 2021). Remarkably, 166 acutely light-responsive genes were found to exhibit significant changes in expression after weeks-long entrainment to long vs short photoperiods. It is important to note that these are sustained changes in expression in our experiments, rather than acute induction by light, because photoperiod-entrained mice were maintained in DD for at least 36 h prior to sampling. Intriguingly, we found significant differential expression or rhythmicity across photoperiods of 3 acutely light responsive genes that are all modulators of the critical NMDAR, MAPK/ERK, and CREB/CRE pathways for light response transduction in SCN neurons, Dusp4, Rasd1, and Gem. Thus, this light-responsive gene set appears to be a particularly rich substrate for elucidating novel genes and mechanisms involved in photoperiod plasticity in the future.
What are the specific changes in SCN function following photoperiodic entrainment that beg molecular explanation? Entrainment of rodents to long photoperiods (>12 h light/day) has been shown to have 4 distinct and enduring aftereffects: (1) to advance the phase of behavioral, electrophysiological, and molecular rhythms (Pittendrigh and Daan, 1976a; Tackenberg et al., 2020; VanderLeest et al., 2009); (2) to alter the waveform of behavioral, electrophysiological, and molecular rhythms by compressing the duration of activity (α) and correspondingly expanding the duration of electrophysiological and Period gene expression (Pittendrigh and Daan, 1976a; Tackenberg et al., 2020; VanderLeest et al., 2009); (3) to shorten the free-running period of behavioral and molecular rhythms (Pittendrigh and Daan, 1976a; Tackenberg et al., 2020); and (4) to decrease the responsiveness of circadian behavior and the SCN to light input and its principal synaptic mediator NMDA glutamate receptors (Glickman et al., 2012; Pittendrigh et al., 1984; VanderLeest et al., 2009).
How might the changes in gene expression we have observed underlie these specific functional aspects of SCN photoperiod plasticity? Focusing on genes with robust changes in expression or rhythmic parameters (DESeq2 p-adj < 0.05, Log2FC > ± 0.3, Xu et al., 2021; DCP q < 0.05) and for which there is evidence in the literature of SCN expression and function, there are several genes in our dataset that are of potential mechanistic importance. These include Dusp4, Rasd1, and Gem which are each key modulators of the SCN light response (Cheng et al., 2004; Hamnett et al., 2019; Matsuo et al., 2022). In addition, there were changes in the expression of Prokr2, the widely expressed receptor for the critical PROK2 signaling network hub in the SCN (Morris et al., 2021), and in the expression of (Cck), which is expressed in neurons critical for light-induced phase advances and entrainment to long photoperiods (Xie et al., 2023). Transcriptional modulation of Prokr2 and Cck may critically support SCN neural network reconfiguration in photoperiodic entrainment (Buijink et al., 2016; VanderLeest et al., 2007) that may underlie changes in phase angle of entrainment, activity duration, or period.
Particularly intriguing is the convergent differential expression of Dusp4 and Rasd1, as well as differential rhythmic phase of Gem to potentially impact the SCN light response mediated by NMDAR, MAPK/ERK, and CREB/CRE induction of light-responsive genes. Dusp4 is a phosphatase that targets phospho-ERK and is a negative modulator of the MAPK/ERK pathway and the SCN phase-shifting response to light (Hamnett et al., 2019). Here, we found that Dusp4 expression is increased in long photoperiod, which would be predicted to decrease ERK phosophorylation and its stimulation of CREB/CRE to induce the Period genes. Rasd1 is a GTPase-positive mediator of NMDAR coupling to MAPK/ERK stimulation in the SCN and is a positive mediator of the SCN phase-shifting response to light (Cheng et al., 2004). Here, we found that Rasd1 expression is decreased in long photoperiod, which also would be predicted to decrease ERK activation and stimulation of CREB/CRE. In addition, Gem, a small G-protein-negative modulator of voltage-dependent Ca2+ channels, mediates negative feedback to MAPK/ERK transduction of light responses within SCN neurons through rapid light induction and then inhibition of Ca2+ channels to limit MAPK/ERK activation. Gem is robustly induced by light at phases when its rhythmic expression in low but is weakly induced when its expression is elevated near its peak (Matsuo et al., 2022). Based on this temporal pattern, the alignment of Gem peak phase we observe in short photoperiod (Figure 6b) would be predicted to decrease Gem light induction in the early night and thus enhance the amplitude of response to phase-delaying light pulses, compared to Gem’s more delayed peak phase in long photoperiod.
Therefore, Dusp4, Rasd1, and Gem are all coordinately regulated in long photoperiod in a manner expected to decrease MAPK/ERK activation, CREB/CRE-driven Period gene induction, and the SCN phase-shifting light response compared with short photoperiod. Indeed, reductions in the SCN response to NMDAR stimulation, in ERK phosphorylation, in Per1 induction by CREB/CRE, and in behavioral phase resetting to acute light pulses have all been demonstrated in rodents following entrainment to long photoperiods (Glickman et al., 2012; Pittendrigh et al., 1984; VanderLeest et al., 2009). Transcriptional modulation of Dusp4 and Rasd1 and phase modulation of Gem rhythms are therefore a compelling candidate molecular mechanisms for SCN light response plasticity. Interestingly, light sensitivity of the human circadian system, measured using acute melatonin suppression by light, is also decreased following exposure to long photoperiods vs short (Higuchi et al., 2007; Owen and Arendt, 1992), suggesting that similar mechanisms may impact the human circadian system. Notably, Dusp4, Rasd1, and Gem have demonstrated roles in hippocampal learning and memory and in cortical neuron plasticity (Abdul Rahman et al., 2016; Carlson et al., 2016; Takahashi et al., 2021), indicating potential mechanistic overlap between circadian clock plasticity and core mechanisms of neural plasticity in the mammalian brain (Buijink et al., 2016; VanderLeest et al., 2007).
An important feature of our study is the use of melatonin-competent C3Hf++ mice. Melatonin is a key output of and input to the SCN circadian clock and is especially important for season biology, yet there are many fewer circadian transcriptomic studies in melatonin-competent mouse strains vs the C57BL/6 J strain, which lacks melatonin synthesis and is commonly used in circadian rhythms research. In addition to our study, Pembroke et al. (2015) reported SCN-enriched genes and bimodal rhythmic genes in a related C3 H strain, and a recent study by Rosmalen et al. (2024) examined melatonin-competent CBA/CaJ mice circadian transcriptomics in the SCN and 20 additional tissues related to nocturnality vs diurnality. Together, these studies provide an enhanced basis for meta-analyses of circadian transcriptomics across melatonin-competent vs B6 strains to further define the role of melatonin signaling in the circadian system.
One limitation of this study is that it was conducted on male mice only. The study was designed in this way because the previous work defining the aspects of behavioral and molecular clock plasticity in rodent that we seek to explain here mechanistically have also used only males (Buijink et al., 2016; Ciarleglio et al., 2011; Glickman et al., 2012; Inagaki et al., 2007; Pittendrigh and Daan, 1976a; Rohr et al., 2019; VanderLeest et al., 2007, 2009). It would be of significant interest to investigate whether there are sex differences in SCN photoperiod encoding, plasticity, and transcriptomic responses, especially since there are striking sex differences in the photoperiodic response of mid-brain reward nuclei downstream of photoperiodic induction (Jameson et al., 2023, 2024).
In summary, using RNAseq on whole SCN dissected from melatonin-competent mice raised in long (LD 16:8) and short (LD 8:16) photoperiods, we found salient differences across photoperiods in the expression of SCN light-responsive genes and neural signaling genes. We describe a remarkable convergent regulation of 3 SCN light response and MAPK/ERK modulating genes—Rasd1, Dusp4, and Gem—which potentially underlie plasticity of the SCN light response, and in addition, our dataset reveals several potentially novel SCN photoperiod plasticity genes including Prokr2, Cck neuropeptide signaling genes, and the clock-associated gene Timeless. Future experiments can test the potential novel mechanistic roles of specific genes from this dataset in SCN photoperiod entrainment and plasticity using ex vivo optogenetic entrainment (Kim and McMahon, 2021) and SCN-specific gene manipulation.
Supplemental Material
sj-zip-1-jbr-10.1177_07487304241265439 – Supplemental material for Transcriptomic Plasticity of the Circadian Clock in Response to Photoperiod: A Study in Male Melatonin-Competent Mice
Supplemental material, sj-zip-1-jbr-10.1177_07487304241265439 for Transcriptomic Plasticity of the Circadian Clock in Response to Photoperiod: A Study in Male Melatonin-Competent Mice by Olivia H. Cox, Manuel A. Giannoni-Guzmán, Jean-Philippe Cartailler, Matthew A. Cottam and Douglas G. McMahon, in Journal of Biological Rhythms
Footnotes
Acknowledgements
This work is supported by NIH R01 GM117650 to DGM.
Correction (October 2024):
Conflict of interest statement
The authors have no potential conflicts of interest with respect to the research, authorship, and/or publication of this article
Notes
References
Supplementary Material
Please find the following supplemental material available below.
For Open Access articles published under a Creative Commons License, all supplemental material carries the same license as the article it is associated with.
For non-Open Access articles published, all supplemental material carries a non-exclusive license, and permission requests for re-use of supplemental material or any part of supplemental material shall be sent directly to the copyright owner as specified in the copyright notice associated with the article.