
Abstract
Obstructive sleep apnea is a common sleep disorder that increases risk for cardiovascular disease and mortality. The severity of sleep-disordered breathing in obstructive sleep apnea patients fluctuates with the seasons, opening the possibility that seasonal changes in light duration, or photoperiod, can influence mechanisms of breathing. Photoperiod can have profound effects on internal timekeeping and can reshape metabolic rhythms in mammals. While the daily rhythm in ventilation is largely shaped by the metabolic rate, less is known about whether ventilatory rhythms are altered in accordance with metabolism under different photoperiods. Here, we investigate the relationship between ventilation and metabolism under different photoperiods using whole-body plethysmography and indirect calorimetry. We find that the daily timing of ventilation is chiefly synchronized to dark onset and that light cues are important for maintaining daily ventilatory rhythms. Moreover, changes in ventilatory patterns are not paralleled by changes in oxygen consumption, energy expenditure, or respiratory exchange rate under different photoperiods. We conclude that ventilatory patterns are not only shaped by the metabolic rate and circadian timing but are also influenced by other light-driven factors. Collectively, these findings have clinical implications for the seasonal variations in sleep-disordered breathing found in individuals with obstructive sleep apnea.
Keywords
Introduction
Obstructive sleep apnea (OSA) is a prevalent sleep disorder commonly characterized by a reduction or cessation of breathing during sleep (Framnes and Arble, 2018). OSA negatively impacts cardiovascular health and leads to a 4-fold increase in all-cause mortality rate (Young et al., 2008), highlighting the importance of understanding the pathophysiology of sleep apnea. Interestingly, the sleep-disordered breathing associated with OSA exhibits a circannual pattern with an acrophase in the winter and a nadir in the summer (Cassol et al., 2012). This observation implies that mechanisms that govern breathing are influenced by seasonal factors, one of which may be changes in photoperiod length. Since the circadian network is thought to contribute to the modulation of sleep apnea symptoms (Butler et al., 2015; Fink et al., 2014), it is plausible that seasonal changes in sleep apnea severity are driven by photoperiodic changes in daily ventilatory rhythms. However, the specific effects of photoperiodic manipulation on ventilatory patterns are not well understood.
Ventilation exhibits a daily rhythm that is heavily regulated by the metabolic rate (Peever and Stephenson, 1997; Stephenson et al., 2001; Seifert and Mortola, 2002; Mortola, 2007; Purnell and Buchanan, 2020), and modified by other factors such as activity, arousal, and core body temperature (CBT; Mortola and Maskrey, 2011). The metabolic rate is commonly represented by the rates of oxygen consumption and carbon dioxide production, which are circadian-controlled and entrained by both light-dark (LD) cycles and feeding time (Adamovich et al., 2019). In this way, light cues and the circadian network work together to maintain rhythmic metabolism which goes on to influence ventilation.
Oxygen and carbon dioxide rhythms persist in the absence of light cues. Without a cellular circadian clock, oxygen and carbon dioxide rhythms fail to persist in constant darkness (DD) yet remain intact under an LD cycle (Adamovich et al., 2019). Thus, factors associated with the LD cycle appear sufficient to entrain metabolic rhythms. Similarly, altered oxygen rhythms have been documented in C57Bl/6J mice under non-24-h LD cycles (West et al., 2017), and in spiny and multimammate mice upon 16L:8D or 8L:16D photoperiodic manipulation (Haim and Zisapel, 1995; Haim et al., 2008). Collectively, these observations highlight an important interplay between the circadian network and the external light environment in modifying metabolic patterns. While ventilatory rhythms are heavily influenced by the metabolic rate, extreme photoperiods and abnormal light exposure may overpower metabolism’s influence on ventilation and lead to a disordered breathing phenotype.
Photoperiodic manipulation mimics seasonal changes in daylight by altering the amount of light exposure within a 24-h period. This manipulation alters the daily patterns in activity and metabolic rate without changing the endogenous circadian period. As such, experimental manipulation of photoperiod provides a unique opportunity to study the relationship between ventilation and metabolic rate as well as uncover potential influencers of breathing that are independent of circadian or metabolic control. Moreover, the use of the C57Bl/6J mouse model may lay the foundation for future genetic studies of ventilatory patterns and circadian rhythmicity.
Here, we investigate how photoperiod reshapes daily patterns of ventilation with a focus on the relationship between ventilation and metabolic rhythms. We hypothesize that photoperiod will differentially alter ventilatory and metabolic rhythms in mice. We find that ventilatory rhythms are strongly linked to timing of dark onset and disrupted in the absence of light cues. Meanwhile, metabolic rhythms are more robustly shifted by photoperiod, demonstrating a dissociation between ventilation and metabolism.
Materials and Methods
All methods were reviewed, approved by, and performed according to the guidelines of the Institutional Animal Care and Use Committee of Marquette University (Milwaukee, WI).
Mice and Photoperiodic Manipulations
Male C57Bl/6J mice were purchased at 8-9 weeks of age from the Jackson Laboratory. All mice were singly housed and provided water and standard 18% kcal/fat chow diet (Teklad, T2018) ad libitum. Mice were housed in light-tight behavioral chambers on one of the three photoperiods: 5-h light/19-h dark (L5), 12-h light/12-h dark (L12), or 19-h light/5-h dark (L19). L5 and L19 photoperiods were selected to provide extreme differences in lighting conditions without compromising photo-entrainment. Light intensity was adjusted to approximately 750 lux for each chamber. All mice were entrained to their respective photoperiod for 5 weeks prior to ventilatory and metabolic assessments. Body weight and food intake were measured weekly during photoperiodic entrainment.
Ventilatory Measurements
Ventilation was measured in freely moving, awake, conscious mice using a whole-body plethysmograph (EMKA Technologies, Paris, France). After a 20-min acclimation phase inside the plethysmograph chambers, respiratory signals were collected during a 4-min recording period while mice were exposed to a room air gas equivalent (e.g., 21% O2, 79% N2, 0% CO2). Temperature and humidity readings were recorded concurrent to respiratory signal collection, and the Drorbaugh and Fenn (1955) equation was applied to calculate an appropriate volume correction factor. This correction factor was applied to pressure signal data on a breath-by-breath basis, using software IOX 2.10.XX to generate real-time ventilatory measures including tidal volume, respiratory frequency, and minute ventilation (frequency*tidal volume). Acceptance of putative breath waveforms required that signals from the pneumotach transducer passed user-determined thresholds before acceptance as true breathing events. Threshold requirement settings included a minimum breathing flow rate of 0.5 mL/s, deviation of 80% or less between the inspiratory and expiratory volumes of a putative breath as well as adherence to mouse-specific breathing parameters. Specifically, these parameter ranges included inspiratory time (Ti, 50-2000 ms), expiratory time (Te, 50-1000 ms), tidal volume (TV, 0.04-0.63 mL), and breathing frequency (f, 10-650 bpm). Only putative breath events that met all threshold requirements were included in downstream analysis. Mice were continuously monitored and kept awake by gently tapping on the chambers during measurement to prevent sleep-associated changes in breathing. Ventilation was measured at six different time points (4-h increments) along the circadian cycle with acclimation beginning 20 min before the indicated zeitgeber time (ZT). Ventilatory time points were collected in a randomized sequence to help control for possible acclimation effects to collecting the ventilatory data. ZT12 was defined as lights off for all photoperiod groups. Plethysmograph analysis was conducted in a room equipped with red light lamps for measurements conducted during the dark phase. Mice were given 12 h or longer between sequential runs. For ventilatory measurements in the absence of light cues, L12 mice were released into DD for 3 weeks prior to any ventilatory assessment.
Activity Monitoring
Beam-break sensors were used to record 24-h locomotor activity. Ventilatory measurements were conducted at six time points along the circadian cycle similar to measurements under LD. Circadian time (CT) was determined by tracking the endogenous circadian period of mice via locomotor activity using ClockLab software (Actimetrics). The onset of locomotor activity was defined as CT12.
Metabolic Assessment
Daily patterns in metabolic gas exchange were measured following ventilatory assessment. Mice were transferred to Promethion indirect calorimetry cages (Sable Systems, North Las Vegas, NV) located in a standard vivarium room set to the light cycle of each respective photoperiod group (500-750 lux). All mice were acclimated to the metabolic cages for three continuous LD cycles, and metabolic data were collected on the fourth cycle. Oxygen consumption rate, carbon dioxide production rate, energy expenditure (EE), and respiratory exchange rate (RER; VCO2/VO2) were continuously recorded and averaged into 15-min bins to create a daily profile for each parameter. EE was calculated using the Weir (1949) equation: Kcal/h = 60*(0.003941*VO2 + 0.001106*VCO2). For calculation of the ventilatory equivalent, we used the average oxygen consumption rate measured over the course of an hour, starting 30 min before, and ending 30 min after the indicated ZT.
Statistical Analyses
All data are presented as the mean ± SEM. Group differences were tested as appropriate using t test, one-way or two-way analysis of variance (ANOVA) with post hoc tests and repeated measures as indicated using GraphPad Prism 8.0. Rhythmicity of ventilatory measures (Figures 1 and 2) and metabolic measures (Figure 3) was determined by cosinor fit analysis using CircWave V1.4 software (Oster et al., 2006). The peak time of all rhythms was determined as the ZT corresponding to center of gravity in CircWave.
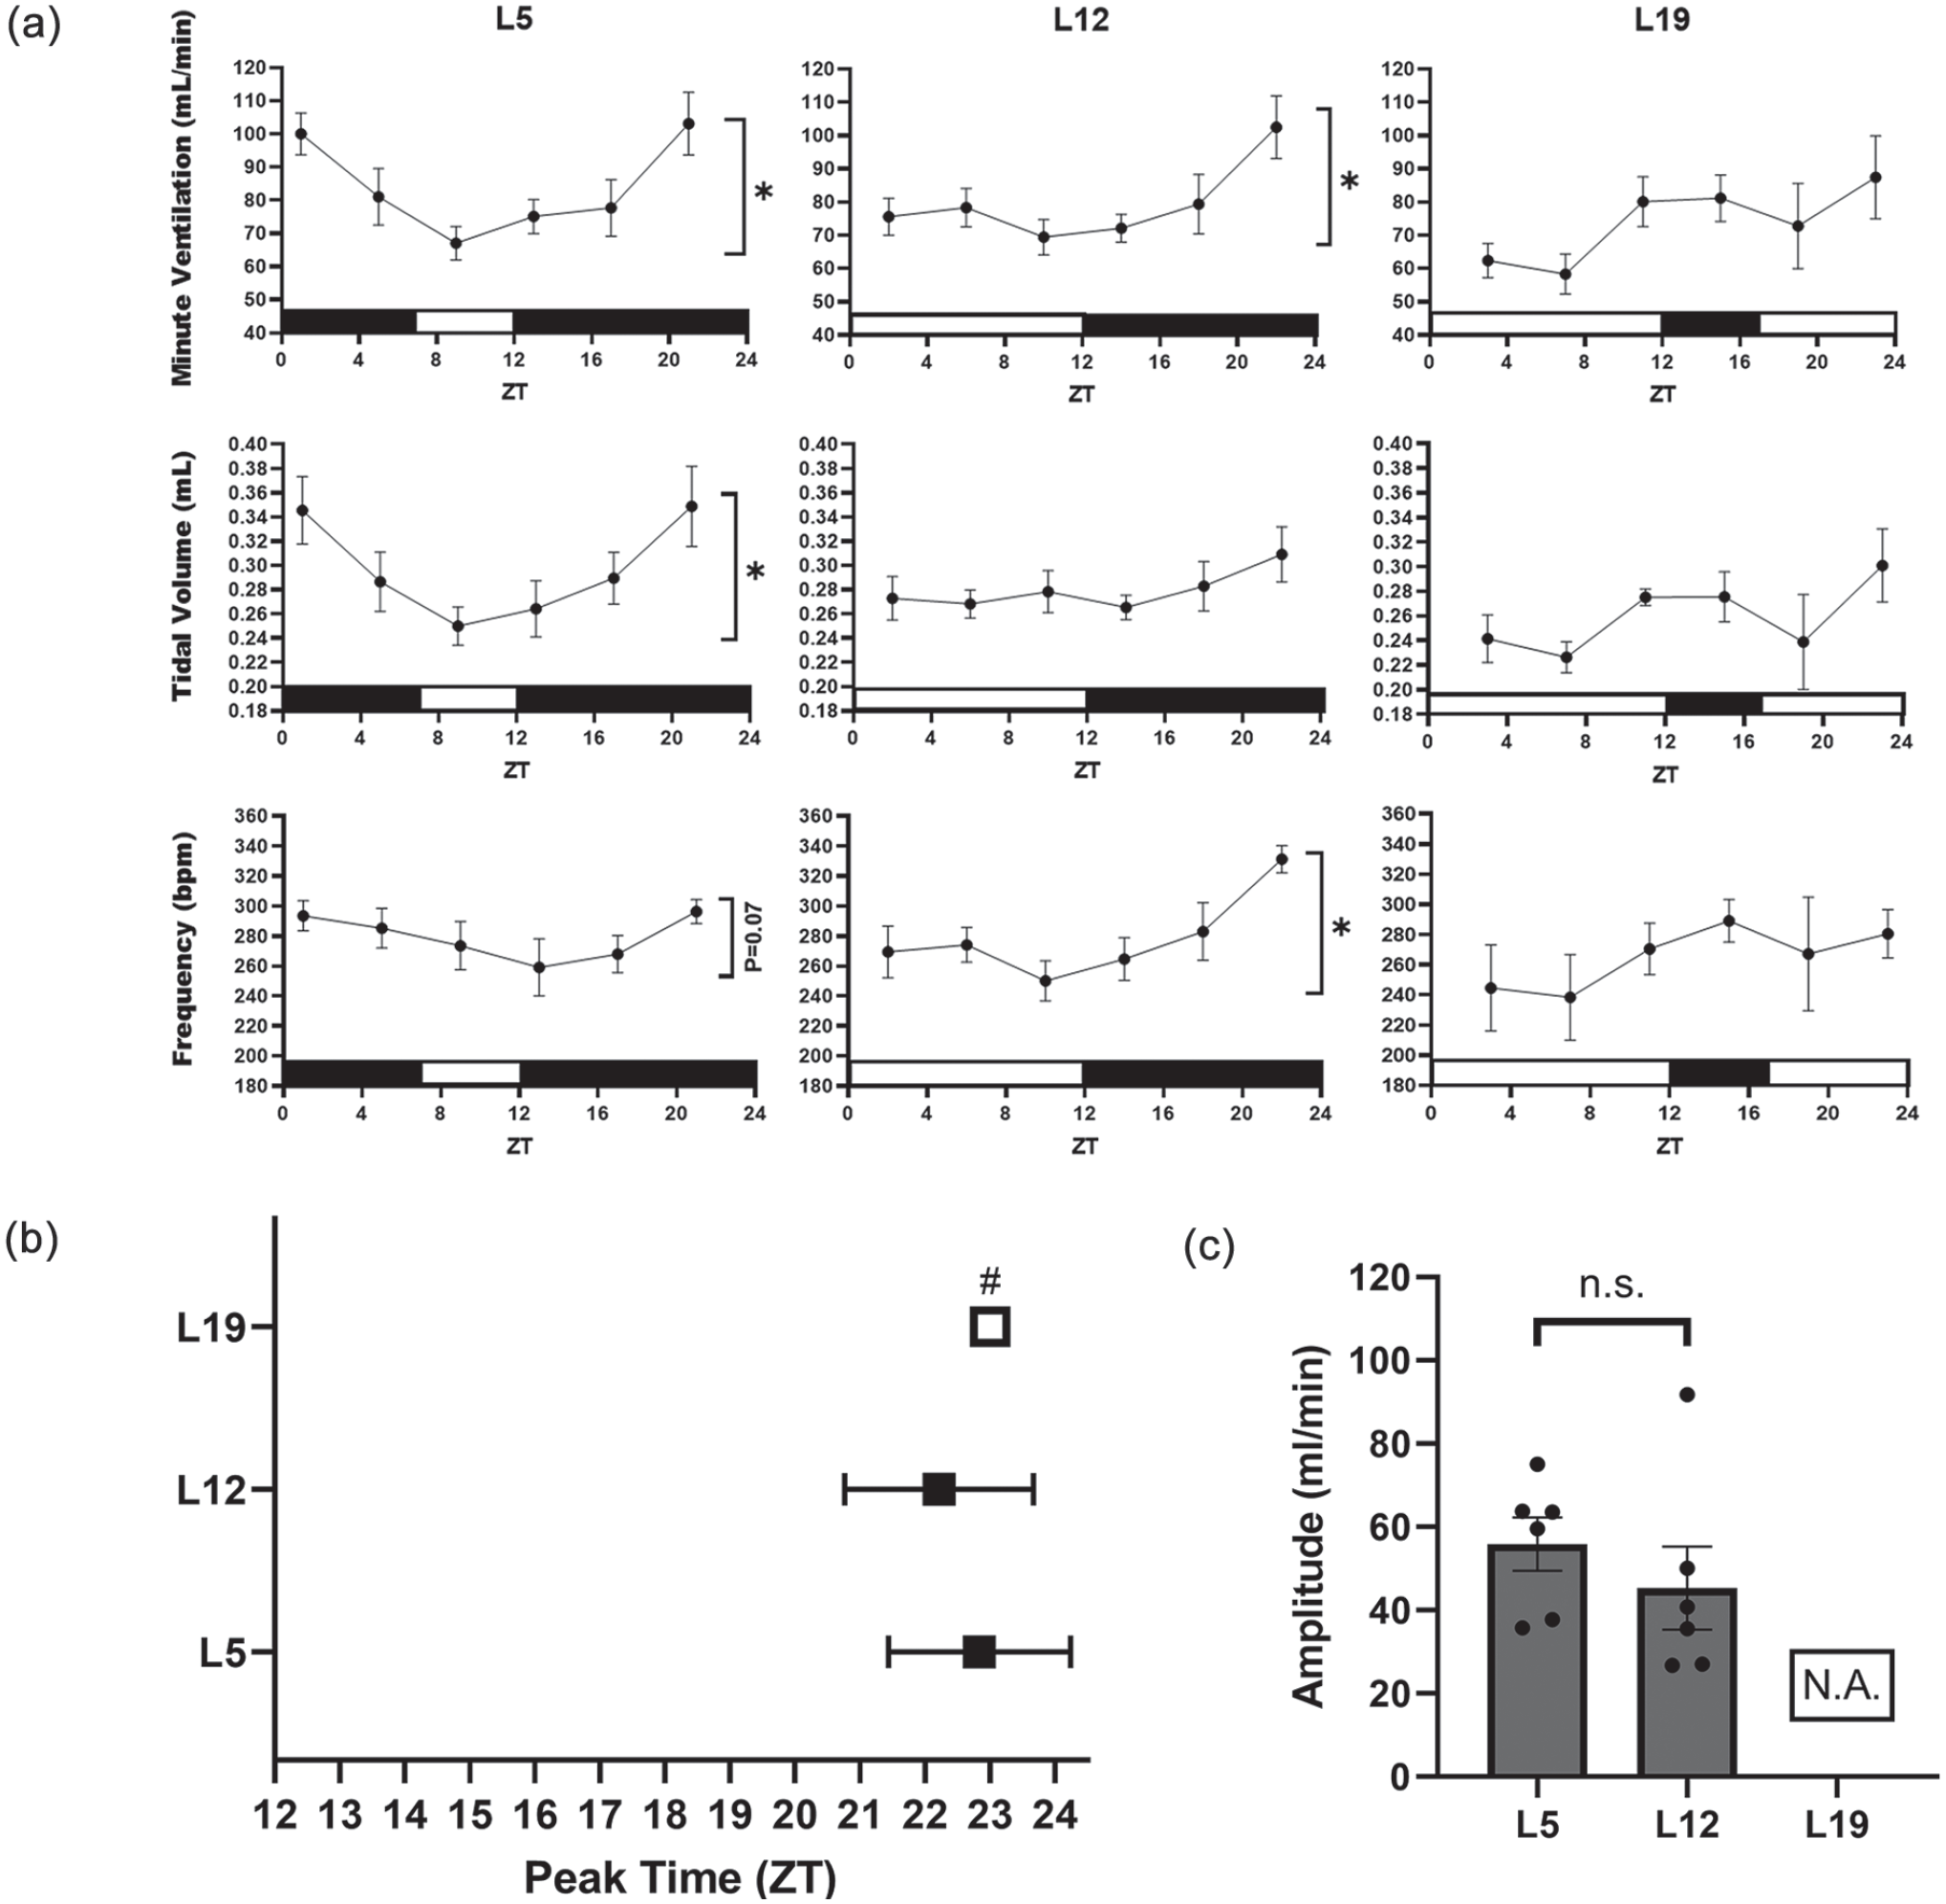
Photoperiodic manipulation alters daily patterns of breathing. Dark onset is ZT12 for all groups. (a) Ventilatory rhythms under different photoperiods. Mice under L5 exhibit a daily rhythm in minute ventilation by way of rhythmic tidal volume. Mice under L12 exhibit a daily rhythm in minute ventilation by way of rhythmic respiratory frequency. Rhythmic ventilation was undetectable under L19. Asterisks denote rhythmicity determined by 24-h cosinor fit analysis, *p < 0.05, n = 6/time point per photoperiod. (b) Peak time of minute ventilation according to cosinor analysis. Mice exhibited similar peak times relative to dark onset under L5 and L12. Unpaired t test with Welch’s correction, p > 0.05. Peak time could not be measured by cosinor analysis for mice under L19; therefore, # marks the ZT at which the highest minute ventilation values were recorded. (c) Amplitude of minute ventilation rhythms. The amplitude of the daily rhythm in minute ventilation was not significantly different between mice under L5 and L12. Unpaired t test with Welch’s correction, p > 0.05. Abbreviations: L5 = 5-h light/19-h dark; L12 = 12-h light/12-h dark; L19 = 19-h light/5-h dark; ZT = zeitgeber time; ns = not significant; N.A. = not available.
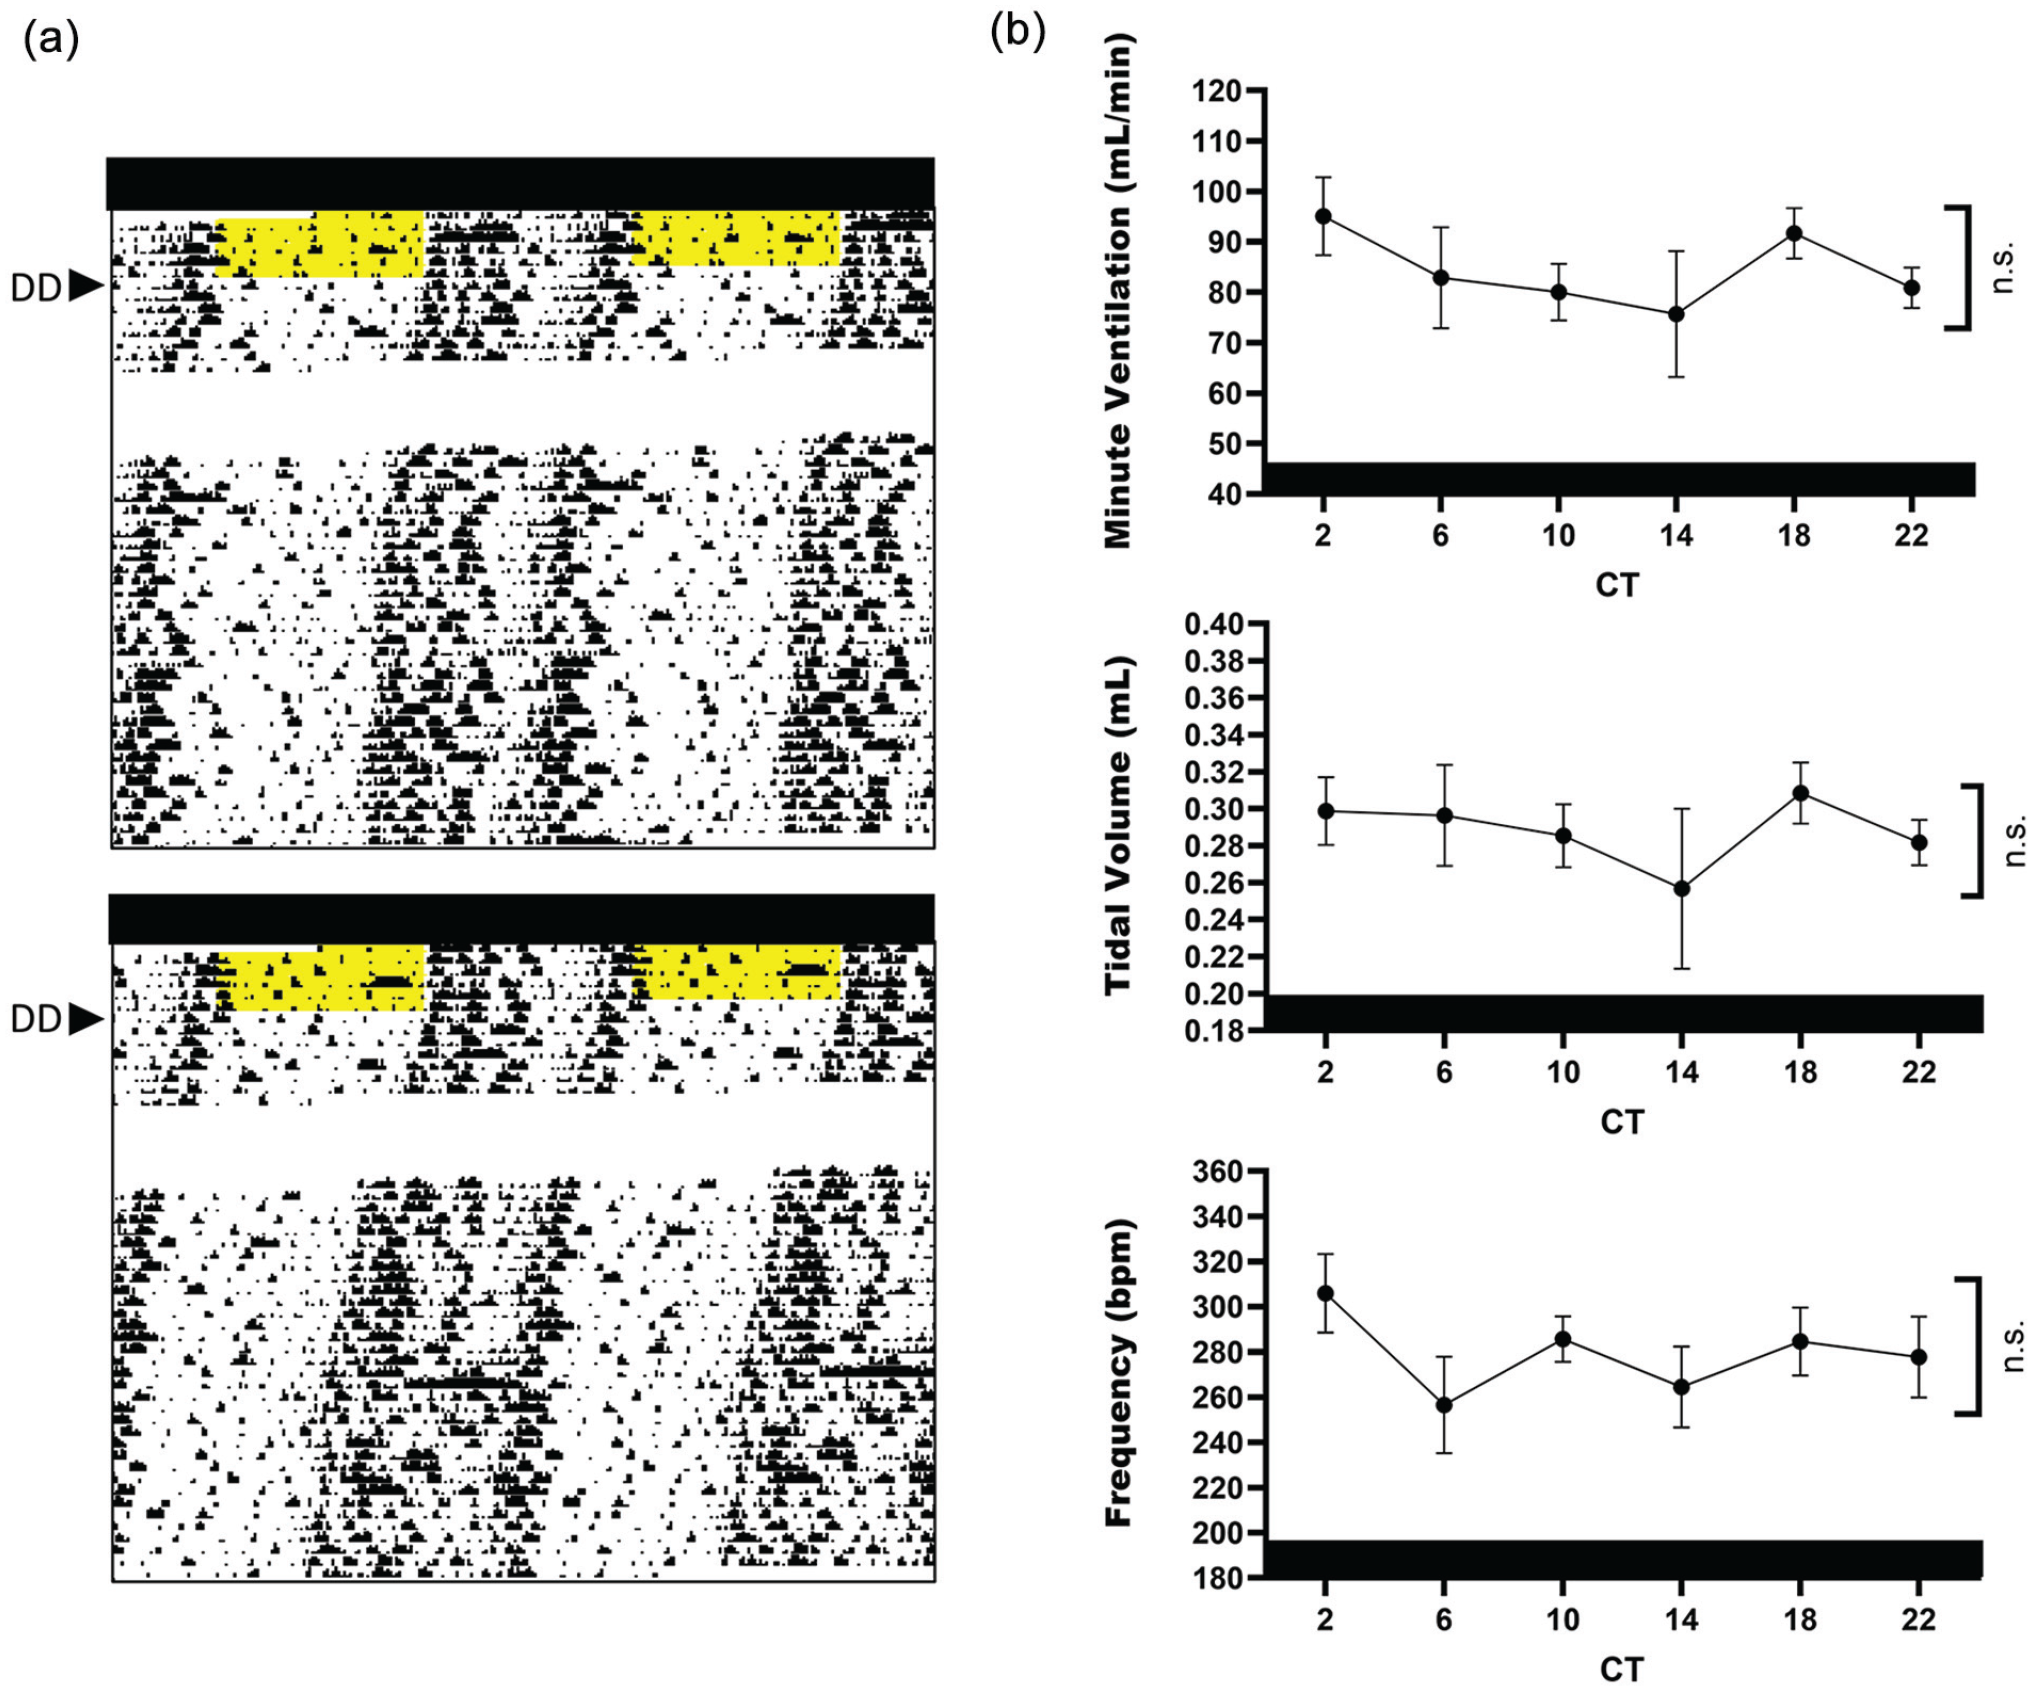
Daily rhythms in ventilation are absent under DD. (a) Two representative actograms of mice being transitioned from L12 to DD. Yellow areas denote lights on preceding DD, and white areas indicate loss in locomotor activity due to technical error. (b) Minute ventilation, tidal volume, and respiratory frequency parameters measured in DD. CT12 defines locomotor activity onset. Cosinor fit analysis of 24 h, p > 0.05, n = 6/time point for all breathing parameters. Abbreviations: DD = constant darkness; CT = circadian time; ns = not significant.
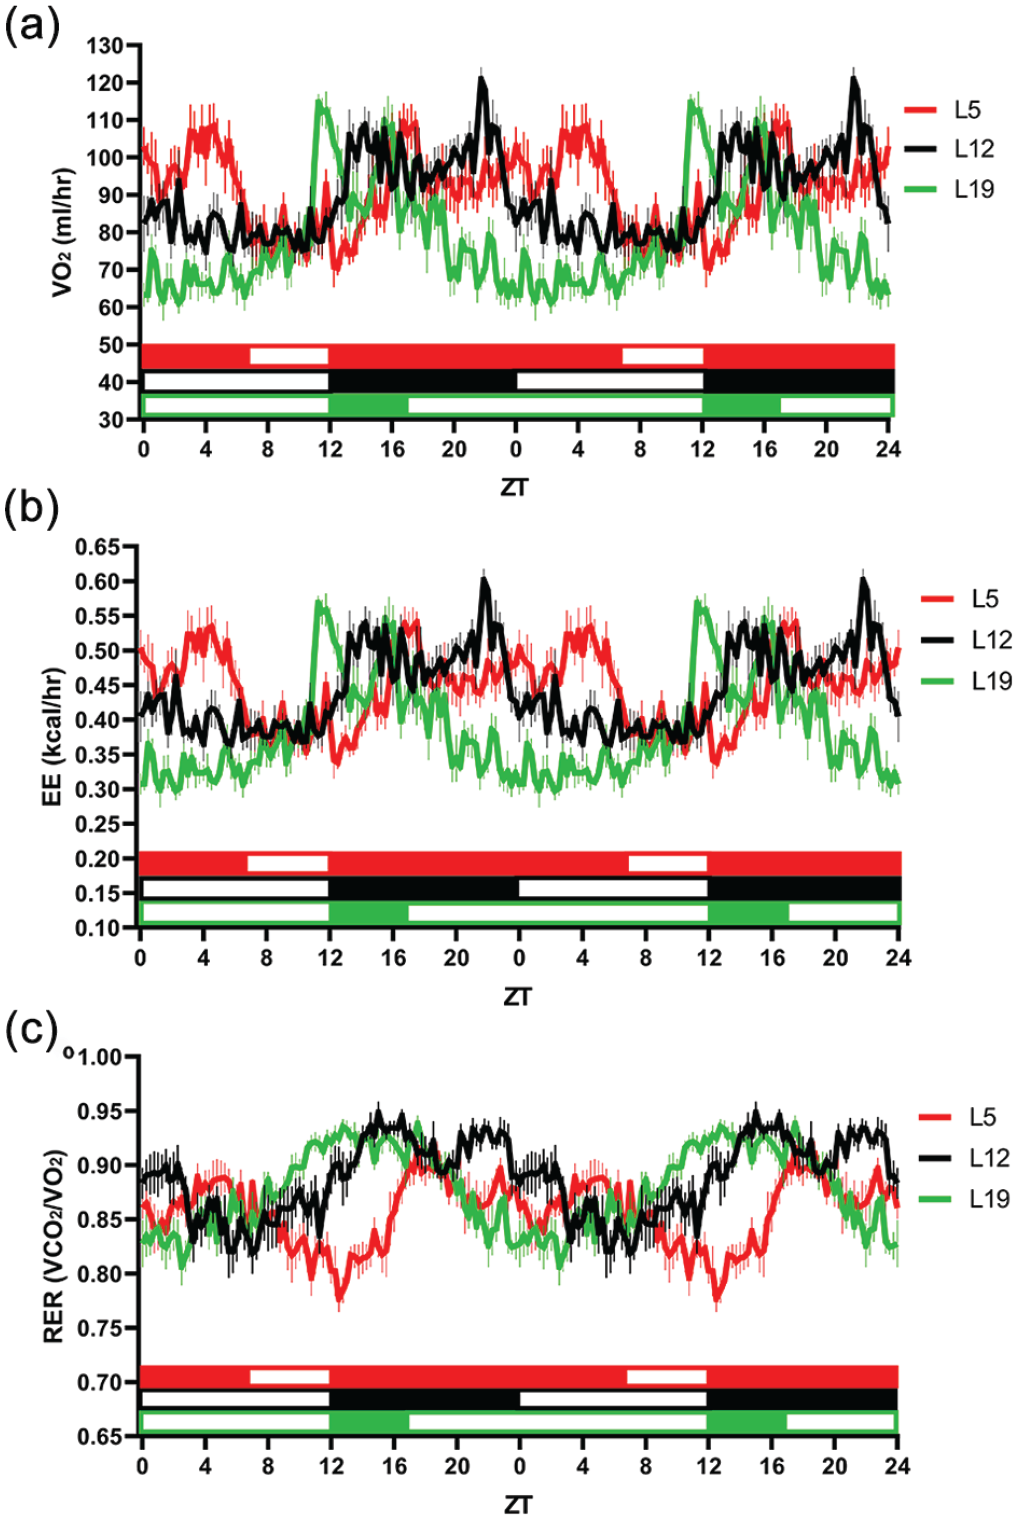
Photoperiod alters daily patterns in (a) oxygen consumption, (b) EE, and (c) RER. Dark onset is ZT12 for all groups. Data are double plotted for visualization of rhythmicity. All metabolic parameters demonstrated significant daily rhythms under all photoperiods. Cosinor fit analysis of 24 h, p < 0.0001, n = 6/time point for all parameters and photoperiods. Rhythms were reshaped by photoperiod, underscoring an important role of light in modifying metabolic behavior. Abbreviations: VO2 = oxygen consumption rate; L5 = 5-h light/19-h dark; L12 = 12-h light/12-h dark; L19 = 19-h light/5-h dark; ZT = zeitgeber time; EE = energy expenditure; RER = respiratory exchange rate.
Results
Photoperiod Differentially Alters Daily Patterns in Ventilation
Extending or shortening the number of light hours in a 24-h period did not alter overall body weight gain or food intake during entrainment (Supplemental Fig. S1), nor did it affect the daily mean of any of the recorded ventilatory measures (Supplemental Fig. S2). Nevertheless, photoperiodic manipulation reshaped daily ventilatory rhythms (Figure 1). Consistent with previous reports in mice (Purnell and Buchanan, 2020) and rats (Stephenson et al., 2001; Seifert and Mortola, 2002; Mortola, 2007), we found that mice under a standard L12 light cycle demonstrate a daily rhythm in minute ventilation (Figure 1a; F = 4.08, p < 0.05). The daily rhythm in minute ventilation was primarily dictated by a rhythmic respiratory frequency (F = 5.57, p < 0.01). The tidal volume of mice under L12 did not exhibit a detectable rhythm. Like the L12 condition, a daily oscillation in minute ventilation was detected under L5 (F = 8.81, p < 0.001). However, in contrast to L12, mice maintained under L5 exhibited a rhythmic tidal volume (F = 7.10, p < 0.01), but not a significant frequency rhythm (p = 0.07). Mice entrained to an L19 photoperiod did not demonstrate a detectable rhythm in minute ventilation, tidal volume, or respiratory frequency, suggesting possible light-mediated disruptions in ventilatory patterns. The peak time of minute ventilation was approximately 10-11 h after dark onset for both L5 and L12 groups (Figure 1b). Although no detectable minute ventilation rhythm was found for mice housed under L19, the highest recorded value occurred at ZT23, 11 h after dark onset. Therefore, for visualization purposes, we plotted ZT23 as a proxy for peak minute ventilation under L19 (open square marked by #). These data indicate that dark onset is important for timing of ventilatory rhythms since minute ventilation peaked at a similar time for mice under L5 and L12, and possibly L19. The amplitudes of minute ventilation rhythms under L5 and L12 were not significantly different from one another (Figure 1c). We did not plot the amplitude of minute ventilation under L19 due to a lack of a significant rhythm (marked as N.A. for not available). Overall, these data suggest that light cues play a more dominant role than the number of light hours in shaping the rhythm of minute ventilation.
Light Cues Are Necessary for Daily Rhythms in Breathing
To determine whether light cues drive daily rhythms in breathing, we released mice housed under L12 into DD and measured ventilatory parameters at 4-h intervals (Figure 2). Locomotor activity was used to track the endogenous circadian period of mice in DD and verify a free-running state (Figure 2a). In the absence of light cues, mice did not exhibit detectable rhythms in minute ventilation, tidal volume, or respiratory frequency (Figure 2b), indicating that light or light-driven mechanisms play an important role in regulating temporal changes in breathing independent of endogenous circadian timing.
Photoperiod Alters Patterns of Oxygen Consumption, EE, and Metabolic Substrate Utilization
Since previous studies have found that animals’ metabolic rate plays a critical role in regulating ventilation (Seifert and Mortola, 2002; Mortola, 2007), we sought to determine whether photoperiod’s effects on ventilatory patterns were paralleled by changes in metabolism. Indirect calorimetry cages were used to measure 24-h profiles of oxygen consumption rate, EE, and RER (Figure 3). As expected, oxygen consumption rate (VO2) exhibited a daily rhythm under the L12 condition (Figure 3a; F = 129.55, p < 0.0001). Rhythmic oxygen consumption rate patterns were also detected in mice housed under L5 and L19 (F = 60.62, p < 0.0001; F = 41.57, p < 0.0001, respectively). EE followed a similar daily pattern as oxygen consumption under all photoperiod conditions and exhibited robust daily rhythms (Figure 3b; F = 146.07, p < 0.0001; F = 65.39, p < 0.0001; F = 45.27, p < 0.0001, respectively). Carbon dioxide production differs depending on the metabolic substrate being oxidized, which will subsequently influence patterns in ventilation (Frayn, 1983). Therefore, we also assessed daily patterns in RER, a common indirect measure for metabolic substrate utilization (Figure 3c). Mice under L12 exhibited a daily rhythm in RER (F = 57.32, p < 0.0001). Mice under both L5 and L19 exhibited daily rhythms in RER as well (F = 82.42, p < 0.0001; F = 360.37, p < 0.0001, respectively).
We found that L19 caused a decrease in mean oxygen consumption rate across the 24-h period compared to L12 and L5 (Figure 4a). However, the decrease in mean oxygen consumption rate could not be detected separately in the light or dark phase. Mean oxygen consumption rate was highest in the dark phase irrespective of photoperiod (Figure 4a). Mean carbon dioxide production rate was also lower under L19 (Supplemental Fig. S4). Similar to the oxygen consumption rate, mice housed under L19 displayed a decrease in 24-h mean EE relative to L12 and L5 (Figure 4b). This finding is interesting, given that we did not detect photoperiodic changes in body weight or food intake during entrainment (Supplemental Fig. S1), or daily food intake during metabolic assessment (Supplemental Fig. S3). The decrease in EE could not be detected separately in the light or dark phase. Mean EE was highest in the dark phase irrespective of photoperiod (Figure 4b). Housing mice under the L5 photoperiod decreased the animals’ 24-h mean RER compared to those under L12 (Figure 4c). The decrease in RER under the L5 photoperiod was evident in both the light and dark phases (Figure 4c). Collectively, mice maintained higher metabolic activity and RER in the dark phase under all photoperiod conditions yet demonstrated differential effects of photoperiodic manipulation on overall metabolism. Mice under L19 demonstrated a decreased metabolic activity overall, and mice under L5 demonstrated a reduced RER indicative of changes in metabolic substrate utilization.
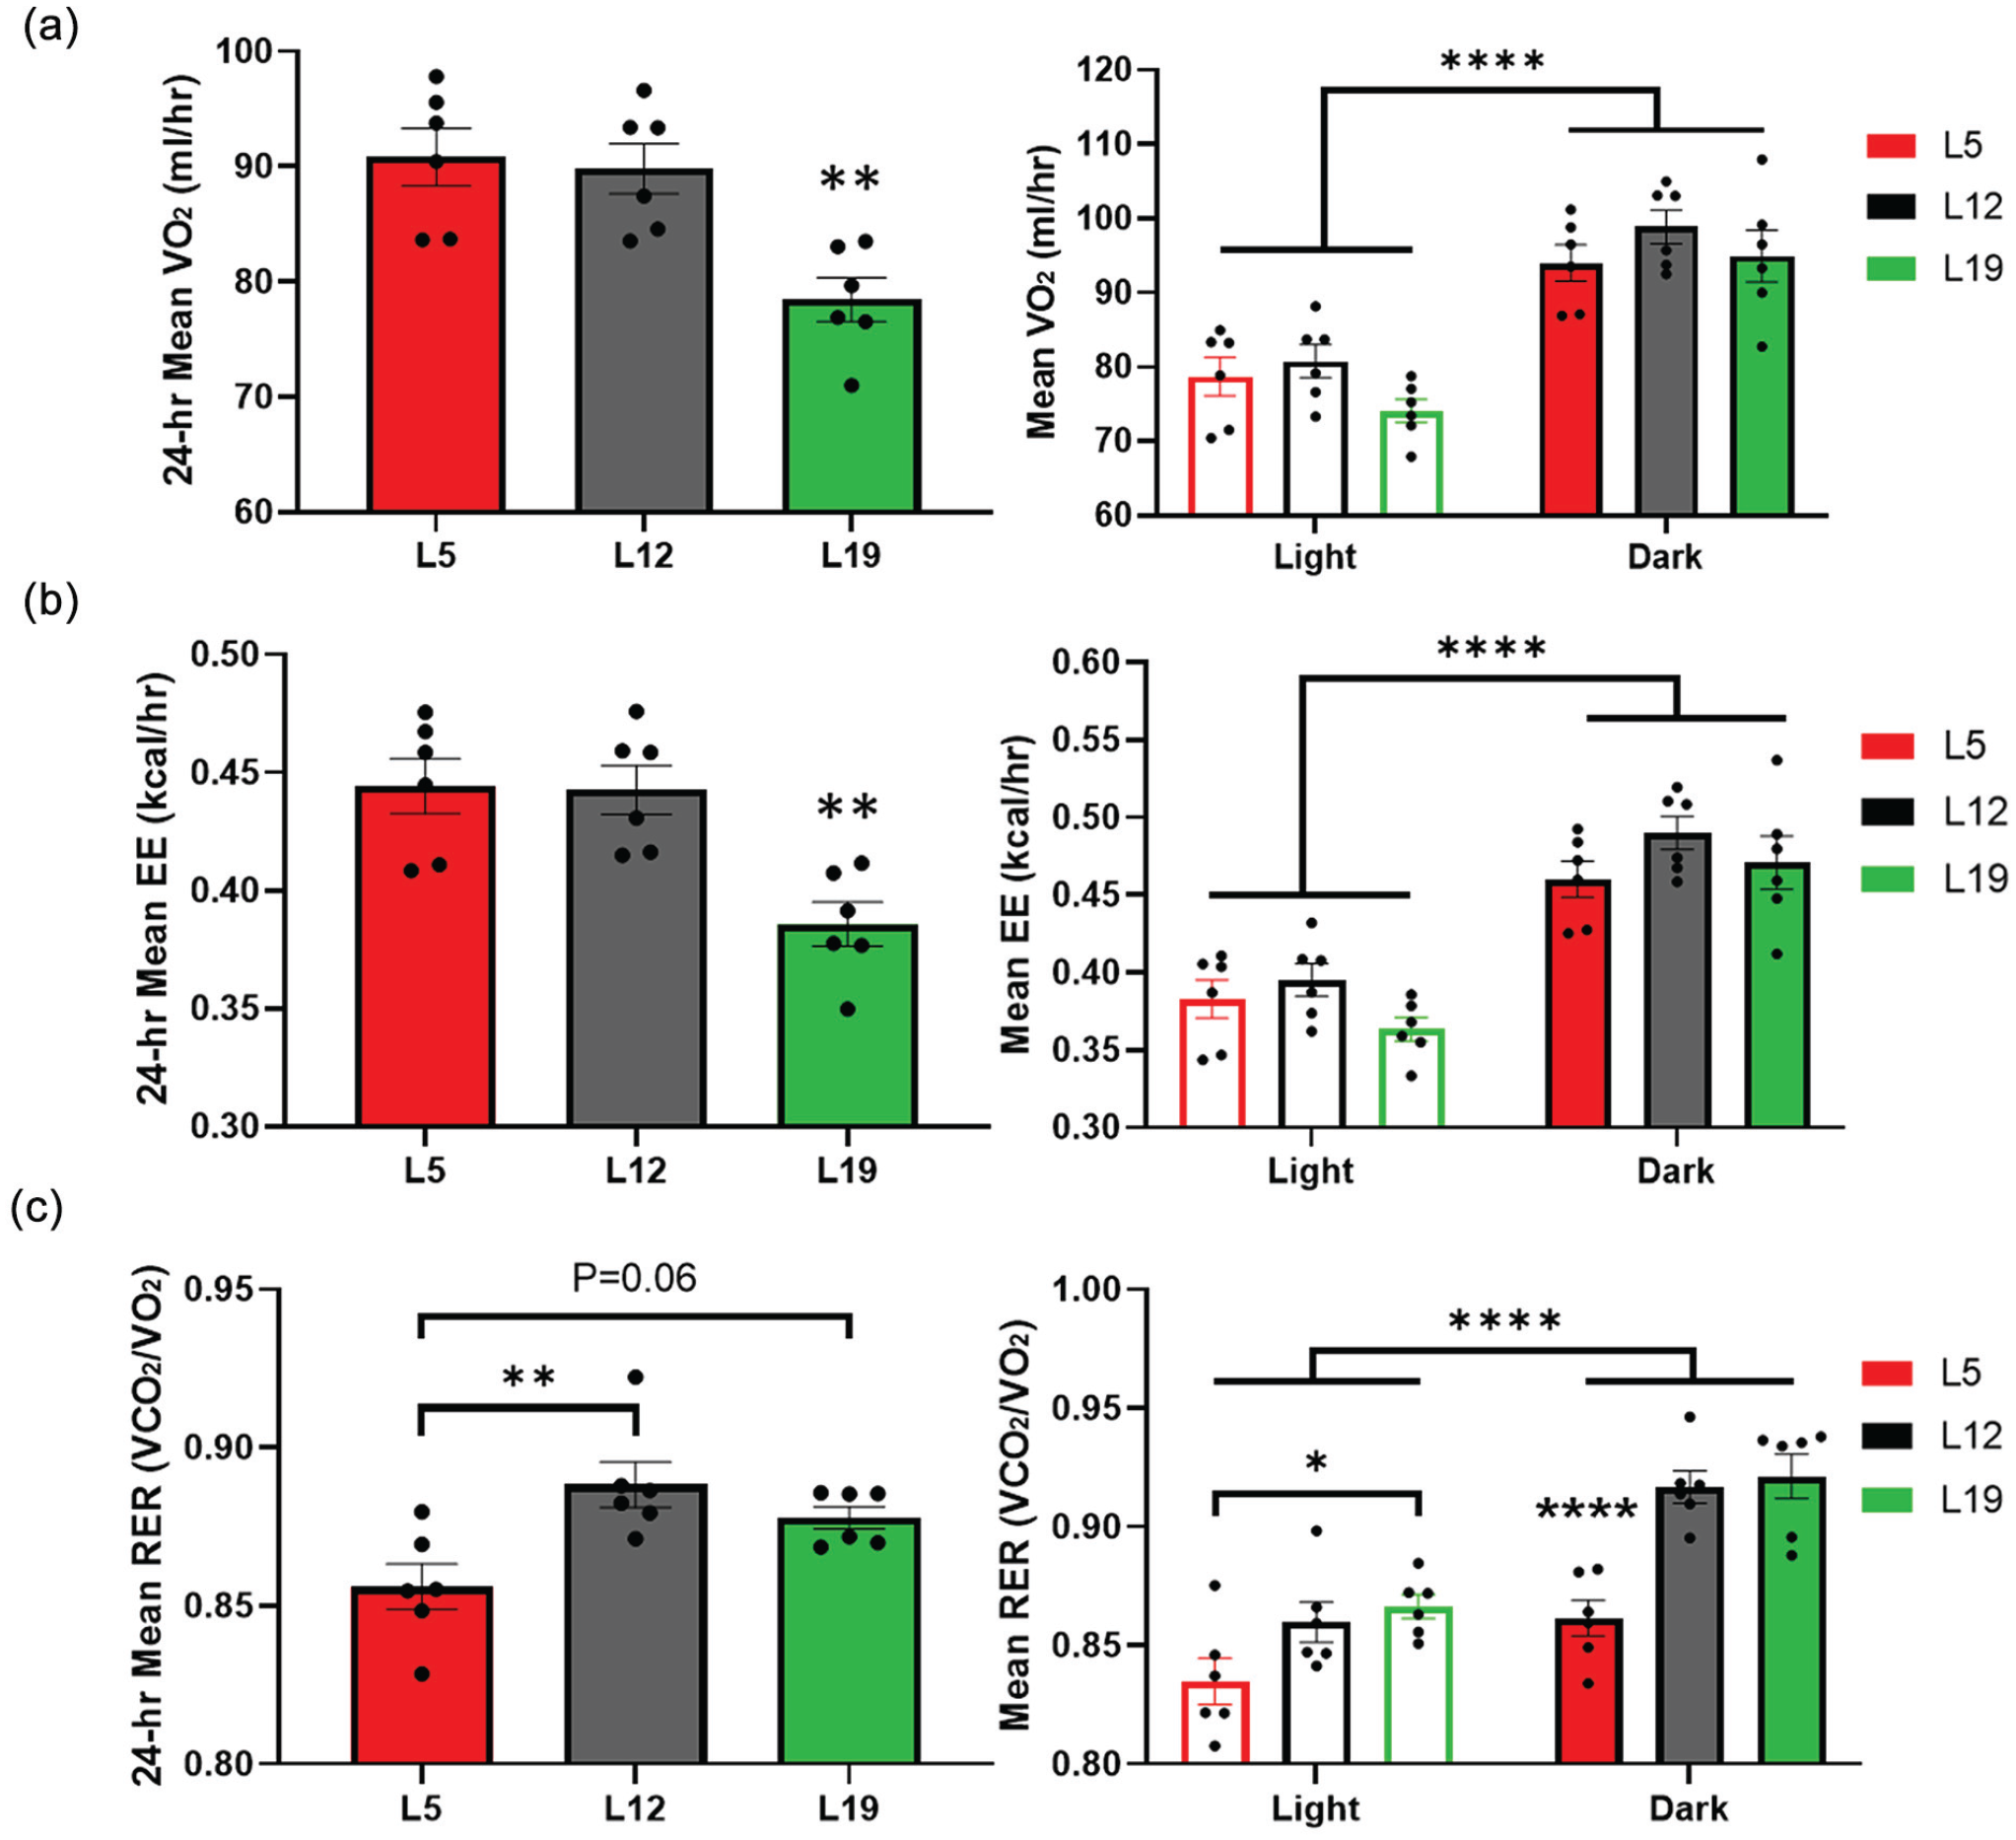
Photoperiod differentially alters mean oxygen consumption, EE, and RER. (a) Mean oxygen consumption. Mice under L19 exhibit decreased 24-h mean oxygen consumption. One-way ANOVA with Tukey’s multiple comparisons test, **p < 0.01 versus L12 and L5. Dark phase mean oxygen consumption is increased relative to light phase regardless of photoperiod. Two-way ANOVA with Tukey’s multiple comparisons test, ****p < 0.0001. (b) Mean EE. Mice under L19 exhibit decreased 24-h mean EE. One-way ANOVA with Tukey’s multiple comparisons test, **p < 0.01 versus L12 and L5. Dark phase mean EE is increased relative to light phase regardless of photoperiod. Two-way ANOVA with Tukey’s multiple comparisons test, ****p < 0.0001. (c) Mean RER. Mice under L5 exhibit a decreased 24-h mean RER relative to L12. One-way ANOVA with Tukey’s multiple comparisons test, **p < 0.01. RER was increased overall in the dark phase. Two-way ANOVA with Tukey’s multiple comparisons test, ****p < 0.0001. A decrease in L5 RER was evident during both light and dark phases. Light phase, *p < 0.05. Dark phase, ****p < 0.0001 versus L12 and L19. N = 6/time point for all parameters and photoperiods. Abbreviations: ANOVA = analysis of variance; RER = respiratory exchange rate; VO2 = oxygen consumption rate; L5 = 5-h light/19-h dark; L12 = 12-h light/12-h dark; L19 = 19-h light/5-h dark; EE = energy expenditure.
Photoperiodic Manipulation Differentially Alters Ventilatory and Metabolic Patterns
To determine the extent to which photoperiodic manipulation contributes to minute ventilation and metabolic patterns, we compared the peak times and amplitudes of minute ventilation (Ve) rhythms to VO2, EE, and RER rhythms across photoperiods (Figure 5). The peak times and amplitudes of minute ventilation were replotted from Figure 1. The amplitude of minute ventilation under L19 was not plotted due to a lack of significant rhythmicity. There was a main effect of photoperiod on the peak time of Ve, VO2, EE, and RER rhythms (Figure 5a; F = 28.78, p < 0.0001, two-way ANOVA with Tukey’s post hoc). Since a significant Ve rhythm was not detected under L19, we plotted ZT23 as a proxy for peak Ve under L19 for visualization of the estimated peak. We found that the peak times of the metabolic rhythms were robustly shifted by photoperiod (p < 0.001, L5 vs L19 for VO2, EE, and RER). However, the peak time of minute ventilation appeared unshifted, as ZT23 was the approximate peak time for both the L5 and L12 groups, and the time at which the highest Ve was recorded for L19. Thus, while metabolic rhythms shift to align with the circadian clock, ventilation stays aligned with light cues, specifically light offset. Moreover, we found that the amplitudes of the VO2 and EE rhythms were decreased in mice under L5 relative to L19 (Figure 5b). The amplitude of VCO2 was similarly reduced under L5 relative to both L12 and L19 (Supplemental Fig. S4). However, no photoperiodic changes in amplitude were observed for RER, nor did amplitude for Ve differ between L5 and L12. Taken together, these data indicate that photoperiod differentially alters patterns in ventilation and metabolism. Ventilatory patterns appear to be dictated primarily by dark onset while photoperiod elicits circadian effects on metabolic rhythms as observed by changes in peak time and amplitude.
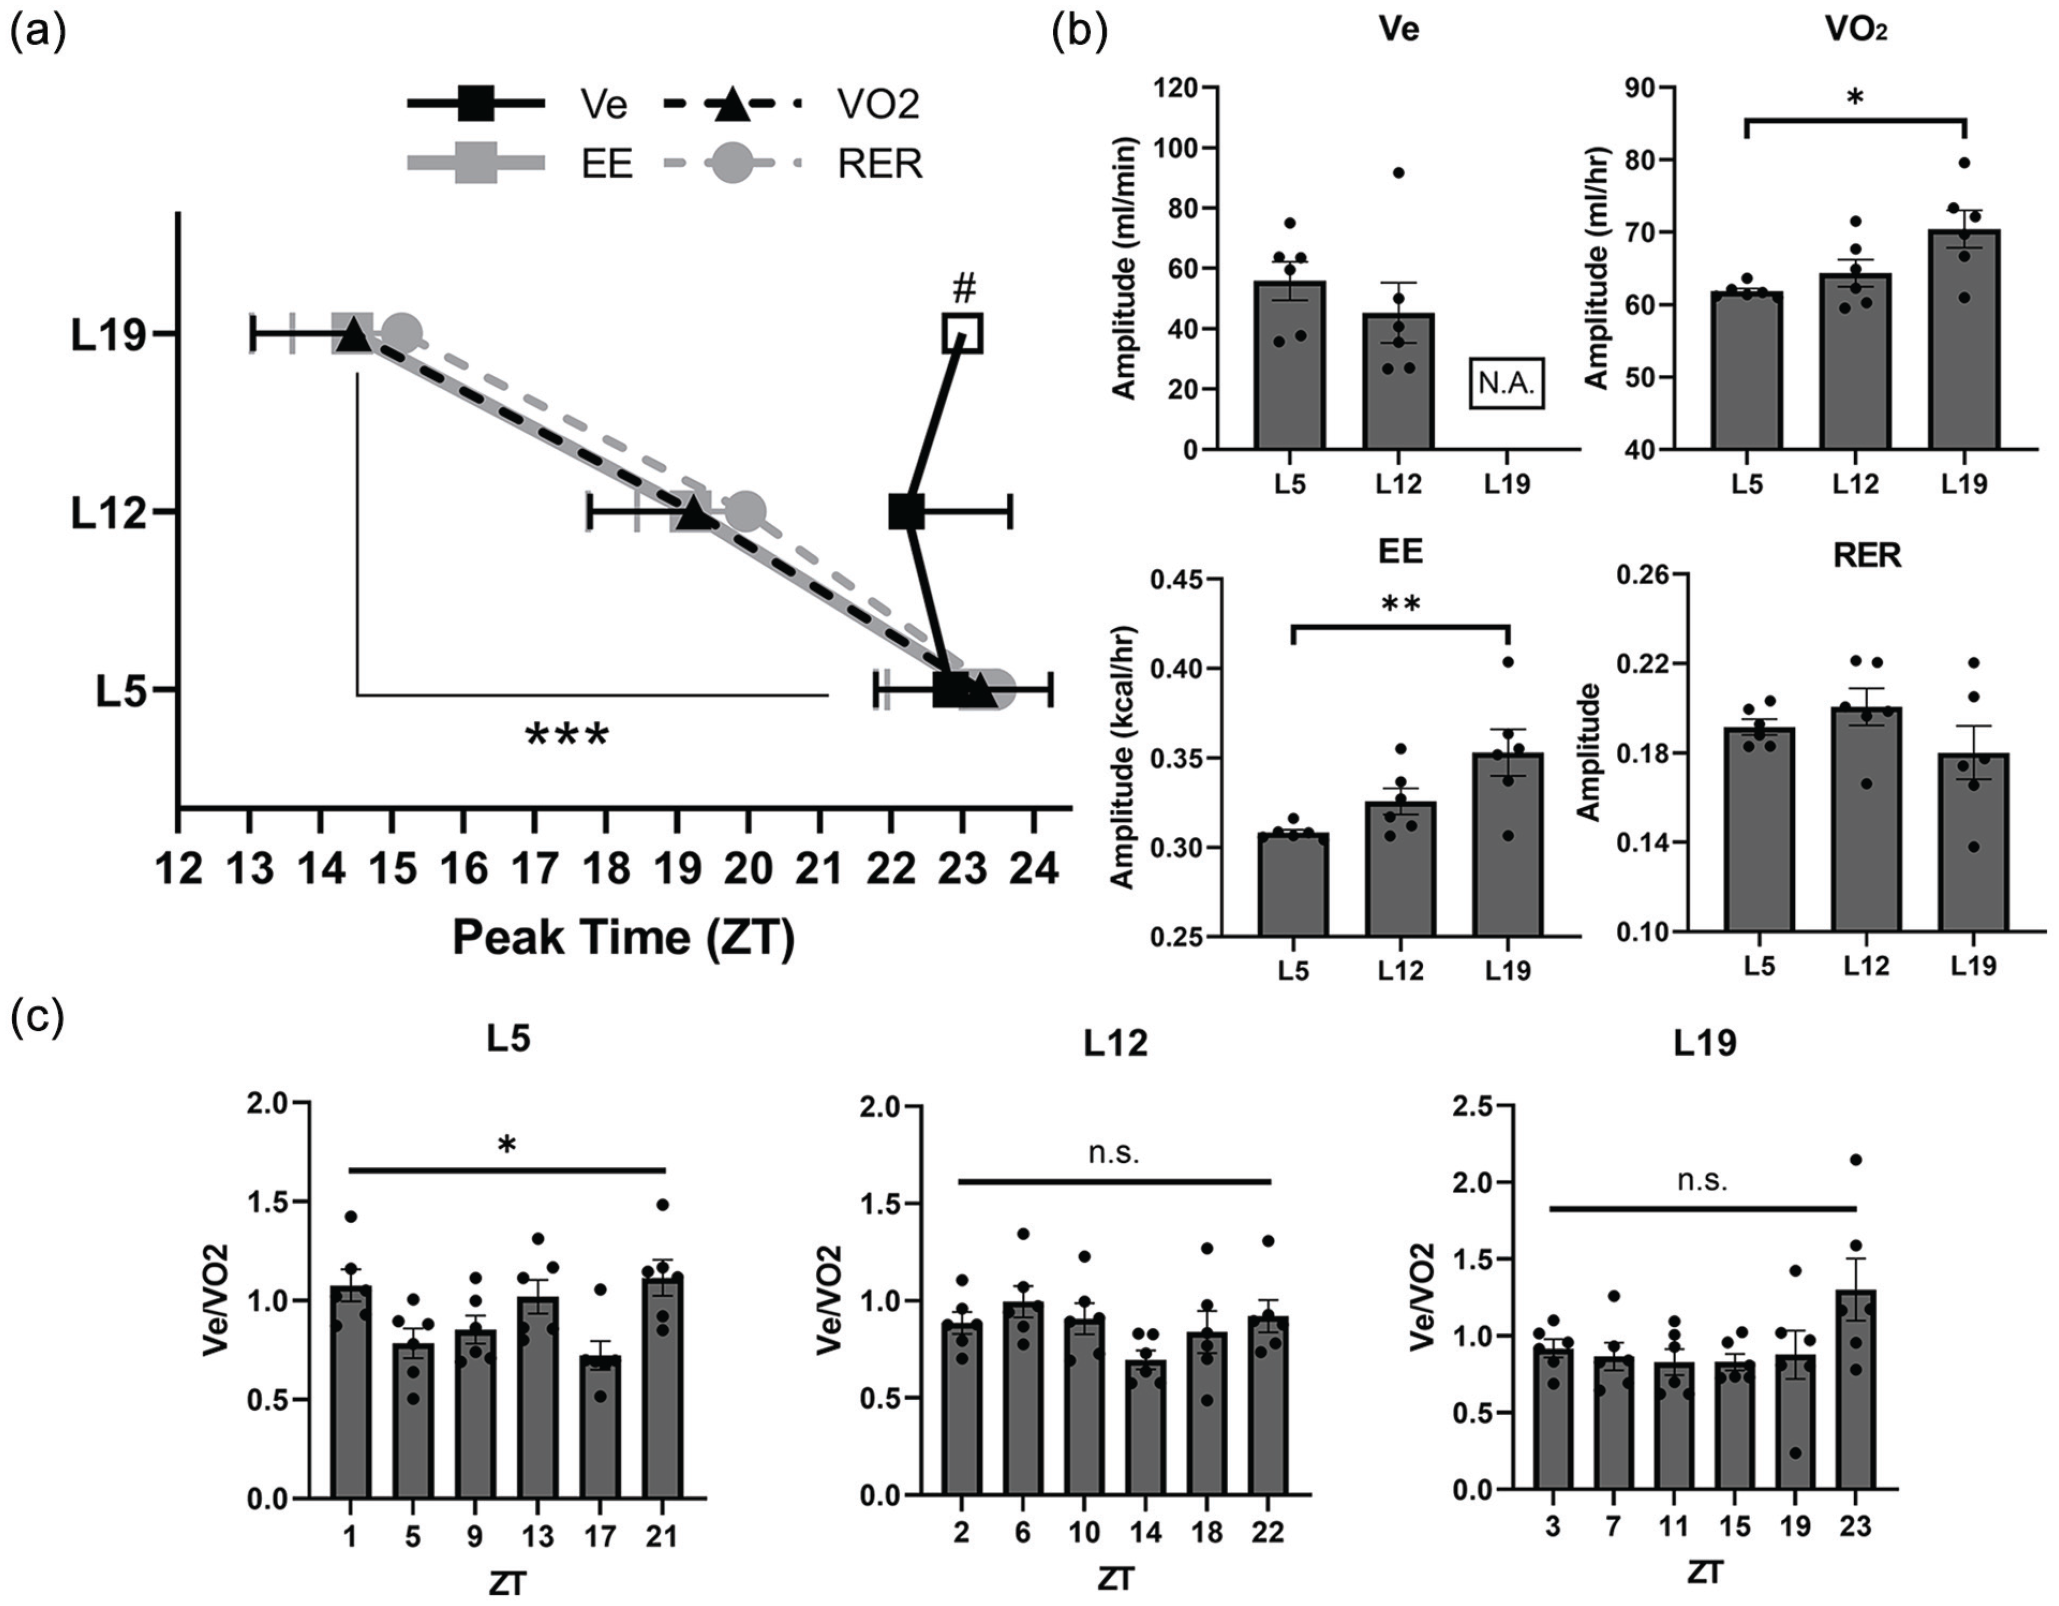
Ventilatory and metabolic patterns are differentially altered by photoperiod. (a) Peak time among variables under different photoperiods. Photoperiodic manipulation robustly shifts metabolic rhythms but not minute ventilation. Ve data are replotted from Figure 1. Two-way ANOVA with Tukey’s multiple comparisons test, ***p < 0.001 indicates photoperiodic differences for VO2, EE, and RER. # denotes the ZT at which the highest Ve values were recorded for mice under L19. (b) Effects of photoperiod on amplitude of daily rhythms. Mice in L5 display a decreased amplitude in VO2 and EE rhythms compared to L19. One-way ANOVA with Tukey’s multiple comparisons test, *p < 0.05, **p < 0.01. (c) Photoperiodic influence on ventilatory equivalent. Mice maintained in L5 exhibit a main effect of time on the ventilatory equivalent, while ventilation and metabolism remain relatively coupled under L12 and L19. Repeated measures one-way ANOVA with Tukey’s multiple comparisons test, *p < 0.05. N = 6/time point for all parameters and photoperiods. Abbreviations: ANOVA = analysis of variance; Ve = minute ventilation; VO2 = oxygen consumption rate; EE = energy expenditure; RER = respiratory exchange rate; L19 = 19-h light/5-h dark; L12 = 12-h light/12-h dark; L5 = 5-h light/19-h dark; ZT = zeitgeber time; N.A. = not available; Ve/VO2 = ventilatory equivalent; ns = not significant.
To further investigate the relationship between ventilation and metabolism under different photoperiods, we normalized minute ventilation to oxygen consumption rate to produce the ventilatory equivalent (Ve/VO2). The ventilatory equivalent is generally constant over the 24-h period because ventilation is largely driven by the metabolic rate (Seifert and Mortola, 2002; Stephenson et al., 2001). Deviations from the ventilatory equivalent suggest metabolism-independent changes in ventilation. We found a significant interaction effect of photoperiod and time on Ve/VO2 (p < 0.05, repeated measures two-way ANOVA with Tukey’s post hoc). Mice under L12 and L19 both exhibited constant Ve/VO2 across the circadian period (Figure 5c). Strikingly, the L5 photoperiod demonstrated a main effect of time on Ve/VO2 (p < 0.05, repeated measures one-way ANOVA with Tukey’s post hoc). However, post hoc analysis could not reveal individual differences between time points under L5. These results indicate that under the L5 condition, daily changes in minute ventilation cannot be explained by the metabolic rate alone, while in the L12 and L19 conditions, metabolic rate and minute ventilation remain relatively coupled.
Discussion
Sleep apnea symptoms worsen in winter (Cassol et al., 2012), which may reflect a photoperiodic uncoupling of ventilation and metabolism. Ventilation oscillates in a 24-h fashion to accommodate daily changes in metabolic demand (Peever and Stephenson, 1997; Stephenson et al., 2001; Seifert and Mortola, 2002; Mortola, 2007; Purnell and Buchanan, 2020). Metabolic rate is principally controlled by the circadian network in mice as rhythms in oxygen consumption and carbon dioxide production persist in the absence of light cues (Adamovich et al., 2019). While photoperiodic changes in the metabolic rate have been documented in spiny and multimammate mice (Haim and Zisapel, 1995; Haim et al., 2008), it is not well understood how ventilatory patterns are affected under different photoperiods. Here, we use a male C57Bl/6J mouse model to determine that changes in photoperiod have differential effects on ventilatory and metabolic patterns.
As expected, we found that mice housed under the L12 photoperiod exhibited a daily rhythm in minute ventilation (Figure 1a). Extending the dark phase (i.e., L5) did not alter the peak time of minute ventilation (Figures 1b and 5a). Minute ventilation for both L5 and L12 peaked 10-11 h after dark onset. We did not detect a significant Ve rhythm under L19 and therefore could not identify a peak time based on cosinor analysis. However, the highest recorded Ve values for L19 occurred at ZT23, 11 h after dark onset (Figure 1a). The lack of a detectable Ve rhythm under L19 hinders our ability to conclude that photoperiod does not alter phase or amplitude of ventilatory rhythms. We can only conclude that L5 and L12 do not differ in terms of phase and amplitude of Ve. It may be that the dark phase is too short to maintain daily oscillations in ventilation under L19, despite maintaining a robust daily pattern in the metabolic rate (Figure 3). The lack of a significant Ve rhythm under L19 may be because mice under L19 re-enter the light phase before Ve peaks. The presence of light can have direct masking effects on behavior such as acute suppression of locomotor activity (Redlin, 2001). Since locomotor activity can influence ventilation (Seifert and Mortola, 2002), light may also mask ventilation which could explain why we observed the greatest amount of variability in Ve early in the light phase for L19, and consequently did not detect a significant rhythm. It remains to be determined what the true peak time of Ve is under L19; however, our observations indicate that minute ventilation peaks approximately 10-11 h after dark onset in mice housed under L5 and L12, but daily ventilatory rhythms may be suppressed via indirect light effects on behavior if mice have a dark phase of less than 10 h (e.g., L19).
Consistent with others’ data (Stephenson et al., 2001; Purnell and Buchanan, 2020), we demonstrated that the daily rhythm in minute ventilation was primarily dictated by respiratory frequency under L12, as evidenced by a significant frequency rhythm but no tidal volume rhythm (Figure 1a). Interestingly, shortening the photoperiod to L5 caused a reversal in the rhythmicity of ventilatory measures. Under L5, mice exhibited a significant minute ventilation rhythm by way of a rhythmic tidal volume. The daily rhythm in respiratory frequency, in turn, appeared suppressed under L5 as we did not detect a significant rhythm (p = 0.07). In humans, tidal volume automatically adjusts to maintain CO2 homeostasis when behavior-induced changes in respiratory frequency occur (Ohashi et al., 2013). Therefore, it is possible that tidal volume becomes rhythmic in mice under situations where the respiratory frequency rhythm is suppressed, thereby maintaining the minute ventilation rhythm. Based on this hypothesis, photoperiod may pathologically alter daily breathing patterns which, in the case of sleep apnea, may translate to changes in symptom severity. Respiratory frequency is predominantly driven by pontomedullary oscillators in the brainstem, namely the PreBötzinger complex, the parafacial respiratory group, and the pontine respiratory group (Ghali, 2019). Tidal volume, on the other hand, is known to correlate strongly with phrenic motor output and vagal feedback (Folgering et al., 1976). Differential effects of altered LD cycle on these neural mechanisms may directly contribute to changes in respiratory pathology, warranting further investigation.
Changes in photoperiod can reorganize the master clock by altering the phase relationship between neuronal networks within the suprachiasmatic nucleus (SCN; Rohling et al., 2006; VanderLeest et al., 2007). For example, long-day photoperiods (20-h light:4-h dark) can dissociate the SCN core from the shell, and differentially phase shift peripheral tissues to align primarily with shell activity (Evans et al., 2015). However, the specific physiological processes that become dissociated by photoperiodic manipulation remain poorly understood opening the possibility that ventilation and metabolic rate may be differentially affected under different light cycles. Recently, it has been documented that transcripts of core clock genes and genes involved in phrenic motor plasticity oscillate in a 24-h fashion in the brainstem of mice, suggesting that local clock networks may act to control ventilatory patterns at the neuronal level (Kelly et al., 2020). Therefore, photoperiod-induced dissociation within the circadian network could desynchronize local clocks regulating ventilation at the neuronal level with those that control metabolism in the periphery which may help explain our finding that daily ventilatory and metabolic patterns are differentially altered in response to photoperiodic manipulation.
Ventilatory rhythms were not detected under DD (Figure 2) suggesting that ventilatory patterns are not solely driven by the endogenous clock, but instead partially shaped by other behavioral influences regulated by light cues. Notably, we suspect that the suppression of ventilatory rhythms under DD and L19 occur through separate mechanisms. Light transitions may serve as necessary time cues to maintain ventilatory rhythms, which are absent under DD. For L19, a longer dark phase (of at least 10 h) may be necessary to sustain ventilatory rhythms since rhythms are maintained in mice under L5 and L12. Recently, it has been demonstrated that mice maintain daily rhythms in respiratory frequency and minute ventilation under DD, but not upon SCN lesion (Purnell and Buchanan, 2020). Our data suggest that these rhythms are at least partially disrupted under DD. The mice used in the present study were kept in DD for 3 weeks or longer prior to ventilatory assessment, whereas in the former study (Purnell and Buchanan, 2020), ventilation was assessed after 2 weeks of DD. Therefore, it may be that ventilatory rhythms become disrupted the longer mice are kept under free-running conditions. One influence that may directly impact breathing independent of the endogenous clock is arousal state (Shea, 1996). Direct projections from retinal ganglion cells (RGCs) to the dorsal raphe nucleus can modulate state of arousal independent of the SCN (Li et al., 2015; Smith et al., 2018; Cho et al., 2017). In addition, melanopsin-expressing RGCs directly project to numerous hypothalamic and limbic regions of the brain (Hattar et al., 2006), which may serve as potential routes for photic input to modulate breathing independent of circadian timing or metabolic rate.
Another variable suspected of influencing ventilatory patterns is the CBT rhythm which is tightly regulated by the endogenous clock (Mortola, 2007; Kräuchi, 2002). Shifts from long to short photoperiods alter the CBT rhythm in a similar manner as the metabolic rate (Haim and Zisapel, 1995; Haim et al., 2008). However, under a constant routine in humans, it has been demonstrated that CBT can oscillate out of phase with ventilation and metabolic rate (Spengler et al., 2000). Similarly, brief light perturbations can differentially affect the CBT rhythm as it relates to ventilation and metabolic rate patterns (Mortola, 2007). These observations indicate that the metabolic rate is the stronger determinant of ventilatory patterns compared to CBT. Taken with the fact that CBT and metabolic rate are similarly shifted by photoperiod, it is unlikely that CBT is the underlying factor driving photoperiodic differences in ventilatory and metabolic patterns.
In the present study, we demonstrated that the daily means for oxygen consumption rate and EE are reduced under the L19 photoperiod (Figure 4a and 4b). This result agrees with the finding that long photoperiods decrease locomotor activity in Wistar rats (Xie et al., 2017). However, the daily mean minute ventilation of mice under L19 was not decreased (Supplemental Fig. S2), supporting the notion that photoperiod differentially alters ventilation and metabolic rate. Currently, it is unclear why we observed reduced EE in mice under L19 yet no change in body weight or food intake (Supplemental Figs. S1 and S3), since this would suggest an imbalance in energy flux. Therefore, further investigation of photoperiodic effects on energy balance in common mice strains is worthwhile. While these animals did not develop obesity, the association between the reduced metabolic rate, changes in the LD cycle, and altered breathing may point to an association between reduced metabolism and breathing impairments. Since OSA is more common in obese individuals (Framnes and Arble, 2018), seasonal light-mediated changes in energy balance may also contribute to disordered breathing.
Interestingly, we demonstrated that mice under L5 exhibit a robust decrease in mean RER compared to L12 and L19 (Figure 4c), indicating that mice under short photoperiods exhibit changes in energy substrate utilization. Curiously, although the L5 photoperiod reduced mean RER, we did not detect differences in mean VO2 (Figure 4a) or mean VCO2 (Supplemental Fig. S4) under L5. Therefore, we could not attribute altered RER to either of these parameters alone. However, it is worth mentioning that some mice displayed slightly higher VO2 and slightly lower VCO2 under L5 compared to L12 (see individual data variability). While not significant separately, these small variances may play an additive role and contribute to the difference in RER when combined. The decrease in RER under L5 may reflect a shift toward lipid oxidation as a fuel source. Indeed, in rats, a shortened photoperiod leads to increased serum triglycerides and an upregulation in lipid metabolism-related genes (Xie et al., 2017). Intermittent hypoxia, a hallmark of OSA, is associated with increased peripheral lipolysis and, consequently, dyslipidemia (Drager et al., 2010). Therefore, shortened photoperiods may promote a switch toward an OSA phenotype, and potentially explain why OSA symptoms are more severe in the winter (Cassol et al., 2012). One explanation for the decrease in RER under L5 may be that altering photoperiod drives changes in peripheral expression patterns of clock genes, which can have direct effects on glucose and lipid metabolism (Sosniyenko et al., 2010; Sen et al., 2018; Yin et al., 2020). However, further studies are needed to understand the contributions of photoperiodic changes in clock gene expression to metabolic and ventilatory patterns.
We observed a decrease in the amplitudes of oxygen consumption rate and EE rhythms under L5 relative to L19 (Figure 5b), akin to prior reports in other mouse species (Haim and Zisapel, 1995; Haim et al., 2008). In addition, the amplitude of VCO2 was reduced under L5 relative to both L12 and L19 (Supplemental Fig. S4). However, we did not observe differences in the amplitude of the minute ventilation rhythm between mice under L5 and L12. Oxygen consumption rate, EE, and RER all exhibited similar shifts in peak time under different photoperiods (Figure 5a). Meanwhile, minute ventilation did not shift and instead appears controlled by the timing of dark onset. We therefore conclude that metabolic rhythms are vulnerable to changes in amplitude and phase under different photoperiods, most likely via reprogramming of the circadian clock, while ventilatory rhythms may be programmed largely by light cues. Photoperiodic effects on the circadian network would explain why we observed a spike in metabolic activity under L19 approximately 2 h before dark onset (Figure 3a and 3b). The photoperiodic mismatch between ventilatory and metabolic rhythms was further evident upon normalization of minute ventilation to oxygen consumption rate. Mice under L5 exhibited a main effect of time on the ventilatory equivalent (Figure 5c). This finding is indicative of metabolism-independent changes in ventilation because Ve/VO2 is generally constant throughout the day (Seifert and Mortola, 2002; Stephenson et al., 2001). A limitation of this study is that ventilatory and metabolic outputs were not measured concurrently to one another due to technical limitations. This means that the animals may not have been in the exact same behavioral state at the time of both ventilatory and metabolic assessment, which may introduce confounds. Additionally, this study is limited in that we cannot rule out sex differences in the photoperiodic modulation of breathing. To minimize the number of variables in this study, only male mice were selected since OSA is much more prevalent in males compared to pre-menopausal women (Framnes and Arble, 2018).
Collectively, these data demonstrate that ventilatory rhythms may not be attributed to metabolic rate or circadian timing alone. Instead, photoperiodic manipulation differentially alters ventilatory and metabolic rhythms. The present findings have therapeutic considerations for disordered breathing, particularly in the context of sleep apnea which demonstrates seasonal variation in symptom severity (Cassol et al., 2012). Indeed, altered photoperiod may lead to changes in respiratory pathology or a desynchrony between ventilatory and metabolic rhythms which could promote sleep apnea symptoms. While the advantages of mouse models are robust, mice and humans differ in their nocturnal versus diurnal preference. Therefore, a question remains as to which photoperiod model best translates to humans on a shortened photoperiod. If ventilatory patterns are driven by direct light effects, the L5 group may be the most relevant clinical model. However, if ventilation is more strongly driven by activity onset, then the L19 condition may be a more representative clinical model. Therefore, future studies investigating light-driven mechanisms of ventilation are needed to better understand photoperiodic modulation of sleep-disordered breathing in humans.
Supplemental Material
sj-pdf-1-jbr-10.1177_0748730421992581 – Supplemental material for Photoperiod Manipulation Reveals a Light-Driven Component to Daily Patterns of Ventilation in Male C57Bl/6J Mice
Supplemental material, sj-pdf-1-jbr-10.1177_0748730421992581 for Photoperiod Manipulation Reveals a Light-Driven Component to Daily Patterns of Ventilation in Male C57Bl/6J Mice by Aaron A. Jones, Lauren R. Nelson, Gabriella M. Marino, Nakia A. Chappelle, Deborah A. M. Joye and Deanna M. Arble in Journal of Biological Rhythms
Footnotes
Acknowledgements
The authors would like to thank Dr. Jennifer Evans for sharing her equipment and providing helpful feedback regarding the manuscript, Dr. Matthew Hodges and Dr. Justin Grobe for helpful feedback regarding the manuscript, and Cassidy Colby for experimental assistance and animal care. Dr. Arble receives funding from the American Heart Association (PI Arble, 17SDG33660108) and Marquette Biological Sciences Department.
Conflict of Interest Statement
The author(s) have no potential conflicts of interest with respect to the research, authorship, and/or publication of this article.
Notes
Supplemental material is available for this article online.
References
Supplementary Material
Please find the following supplemental material available below.
For Open Access articles published under a Creative Commons License, all supplemental material carries the same license as the article it is associated with.
For non-Open Access articles published, all supplemental material carries a non-exclusive license, and permission requests for re-use of supplemental material or any part of supplemental material shall be sent directly to the copyright owner as specified in the copyright notice associated with the article.