
Abstract
False negative tests for SARS-CoV-2 are common and have important public health and medical implications. We tested the hypothesis of diurnal variation in viral shedding by assessing the proportion of positive versus negative SARS-CoV-2 reverse transcription polymerase chain reaction (RT-PCR) tests and cycle time (Ct) values among positive samples by the time of day. Among 86,342 clinical tests performed among symptomatic and asymptomatic patients in a regional health care network in the southeastern United States from March to August 2020, we found evidence for diurnal variation in the proportion of positive SARS-CoV-2 tests, with a peak around 1400 h and 1.7-fold variation over the day after adjustment for age, sex, race, testing location, month, and day of week and lower Ct values during the day for positive samples. These findings have important implications for public health testing and vaccination strategies.
Keywords
The COVID-19 pandemic, caused by the SARS-CoV-2 coronavirus, is an evolving public health disaster unlike anything in a century. As of July 2021, more than 187 million people have been infected and more than 4 million have died worldwide. The burden extends far beyond mortality, with long-term sequelae following both symptomatic and asymptomatic infection (Varatharaj et al., 2020), and 35% of infected patients who never required hospitalization unable to work for ≥ 2 weeks (Tenforde et al., 2020).
Because viral spread occurs among patients without or before symptoms develop (He et al., 2020; Johansson et al., 2021; Lee et al., 2020), optimal diagnostic testing strategies will continue to be vital to identify and halt further viral spread as slow and uneven vaccine distribution and uptake continue across the world. False negative tests to identify SARS-CoV-2 can occur due to sample collection techniques, test sensitivity, and the time point in the clinical course (Huang et al., 2020; Kucirka et al., 2020; Wang et al., 2020; Zhou et al., 2020). The potential impact of time of day on diagnostic test accuracy, however, has not been examined previously. There is considerable evidence for circadian regulation of the immune system that could lead to daily patterns of viral shedding and therefore to a diurnal variation in the viral titer in biological tissues (Cermakian et al., 2013; Edgar et al., 2016; Scheiermann et al., 2018; Zhuang et al., 2021a). Anecdotal reports suggest that symptoms of COVID-19 vary by time of day, and recent preliminary in vitro data identified circadian effects on viral infection and replication (Zhuang et al., 2021b). If SARS-CoV-2 is shed rhythmically, then we predict that the probability of a positive test is highest when viral titer is greatest. This is important because optimal care and management of COVID-19 patients depend in part upon the accuracy of the test (Ray and Reddy, 2020). Given the considerable logistical challenges entailed in prospective collection of serial samples among patients with confirmed infection, we explored existing clinical data for evidence supporting this prediction to test the hypothesis that the proportion of positive SARS-CoV-2 reverse transcription polymerase chain reaction (RT-PCR) tests varies by time of day.
Materials and Methods
We extracted results of all SARS-CoV-2 RT-PCR tests from the electronic medical record of a regional health care system in the southeastern United States with a catchment area of 65,000 square miles serving >300,000 patients. Nasopharyngeal swab samples were collected by clinical staff in outpatient, inpatient, and emergency department locations beginning in early March through August 2020 (exact dates are unavailable due to data de-identification). In accordance with clinical guidelines at the time, approximately the first 18,000 tests (approximately 21%) were restricted to symptomatic patients; in late April 2020, screening of all hospitalized patients was initiated and testing was available at the discretion of treating clinicians. Test results, time stamp, clinical location, patient age, and patient sex were obtained from the electronic medical record. There were 323 indeterminate RT-PCR results, 0.4% of tests, which were excluded. The institutional Human Subjects Research Protection Program approved this study as non-human subjects research.
RT-PCR was conducted according to the Food and Drug Administration (FDA) Emergency Use Authorized (EUA) Centers for Disease Control and Prevention (CDC) 2019-nCoV Real-Time RT-PCR Diagnostic Panel in a Clinical Laboratory Improvement Amendments (CLIA)-accredited laboratory. Primer and probe sets for N1 and N2 (targeting two regions of SARS-CoV-2 nucleocapsid gene) and RP (a human RNase P, RP, reference gene used as an internal collection and process control) obtained from Integrated DNA Technologies and TaqPath 1-Step qRT-PCR enzyme mixture purchased from Life Technologies were used to perform RT-PCR. Initially, all four primer and probe targets were used. After 16 March 2020, the N3 target was removed from the assay in accordance with an update to the CDC EUA testing protocol. Thermocycling was performed with FAM-signal normalized against ROX according to the following cycling conditions: 25 ºC for 2 min, 50 ºC for 15 min, 95 ºC for 2 min, then 45 cycles of 95 ºC for 3 s and 55 ºC for 30 s. A positive test result was reported for specimens that yielded positive signal for all N-gene targets (Cq < 40). If more than one positive test result was identified per patient, the first was used. Because of extremely high test volumes in late March 2020, a single batch of approximately 1400 samples were sent to an external lab; similar RT-PCR methods were used, so these tests were included in analyses.
Statistical Analyses
For baseline analysis, the fraction of positive tests was examined by time of day using kernel density estimation with a 1-h kernel bandwidth, with 95% confidence intervals computed using 10,000× bootstrap resampling, and a sinewave was fit by nonlinear least squares to the median curve (pandas v1.0.3 scikit-learn, scipy.optimize). Testing sites (inpatient, outpatient, and emergency department) were also examined separately. To adjust for potential confounders, the potentially nonlinear relationship between time of day and the binary test result was modeled with a generalized additive model (pygam) (Hastie et al., 2009) adjusting for age, sex, race, and testing site, as well as month and day of week of sample collection (Mackey et al., 2021). Confidence intervals were computed parametrically. Smoothing penalties were determined by combined random and human-guided search.
To further support the primary analysis, we also analyzed all available cycle time (Ct) values for positive tests in our date range. Ct values are continuous values that display a strong inverse relationship with viral nucleic acid concentration (Jaafar et al., 2021). The probability density of Ct values for N1, N2, and RP probes was computed using kernel density estimation for “day” and “night” time intervals, where “day” was defined as the 12 h centered on the peak of the sinewave fitted in the baseline analysis. To remove small variations due to changes in the clinical sample collection, transportation, and analysis pipeline, densities for the Ct value ratios N1/RP and N2/RP were computed for sequential 4-h intervals starting at midnight.
Results
We assessed 86,342 RT-PCR test results for SARS-CoV-2 collected by nasopharyngeal swabs from 68,555 patients ≥ 18 years old across approximately 130 total outpatient, emergency department, and inpatient testing sites between March and August 2019 within a regional health care system in the United States. Of these, 7503 (8.7%) detected SARS-CoV-2, ranging from 5.4% among hospitalized patients to 9.5% and 11.0% among outpatient and emergency department patients, respectively (Table 1). The majority of tests were collected in outpatient clinics (75.5%), with 17.9% from hospitalized patients and 4.2% from emergency department patients. Nearly 59% of outpatients were female, compared with 49% of hospitalized patients, and emergency department patients were youngest. Race differed by location, with 18% of hospitalized patients and more than 26% of emergency department patients self-identified as Black, while 9% of outpatients self-identified as Black.
Characteristics of SARS-CoV-2 RT-PCR nasopharyngeal tests.
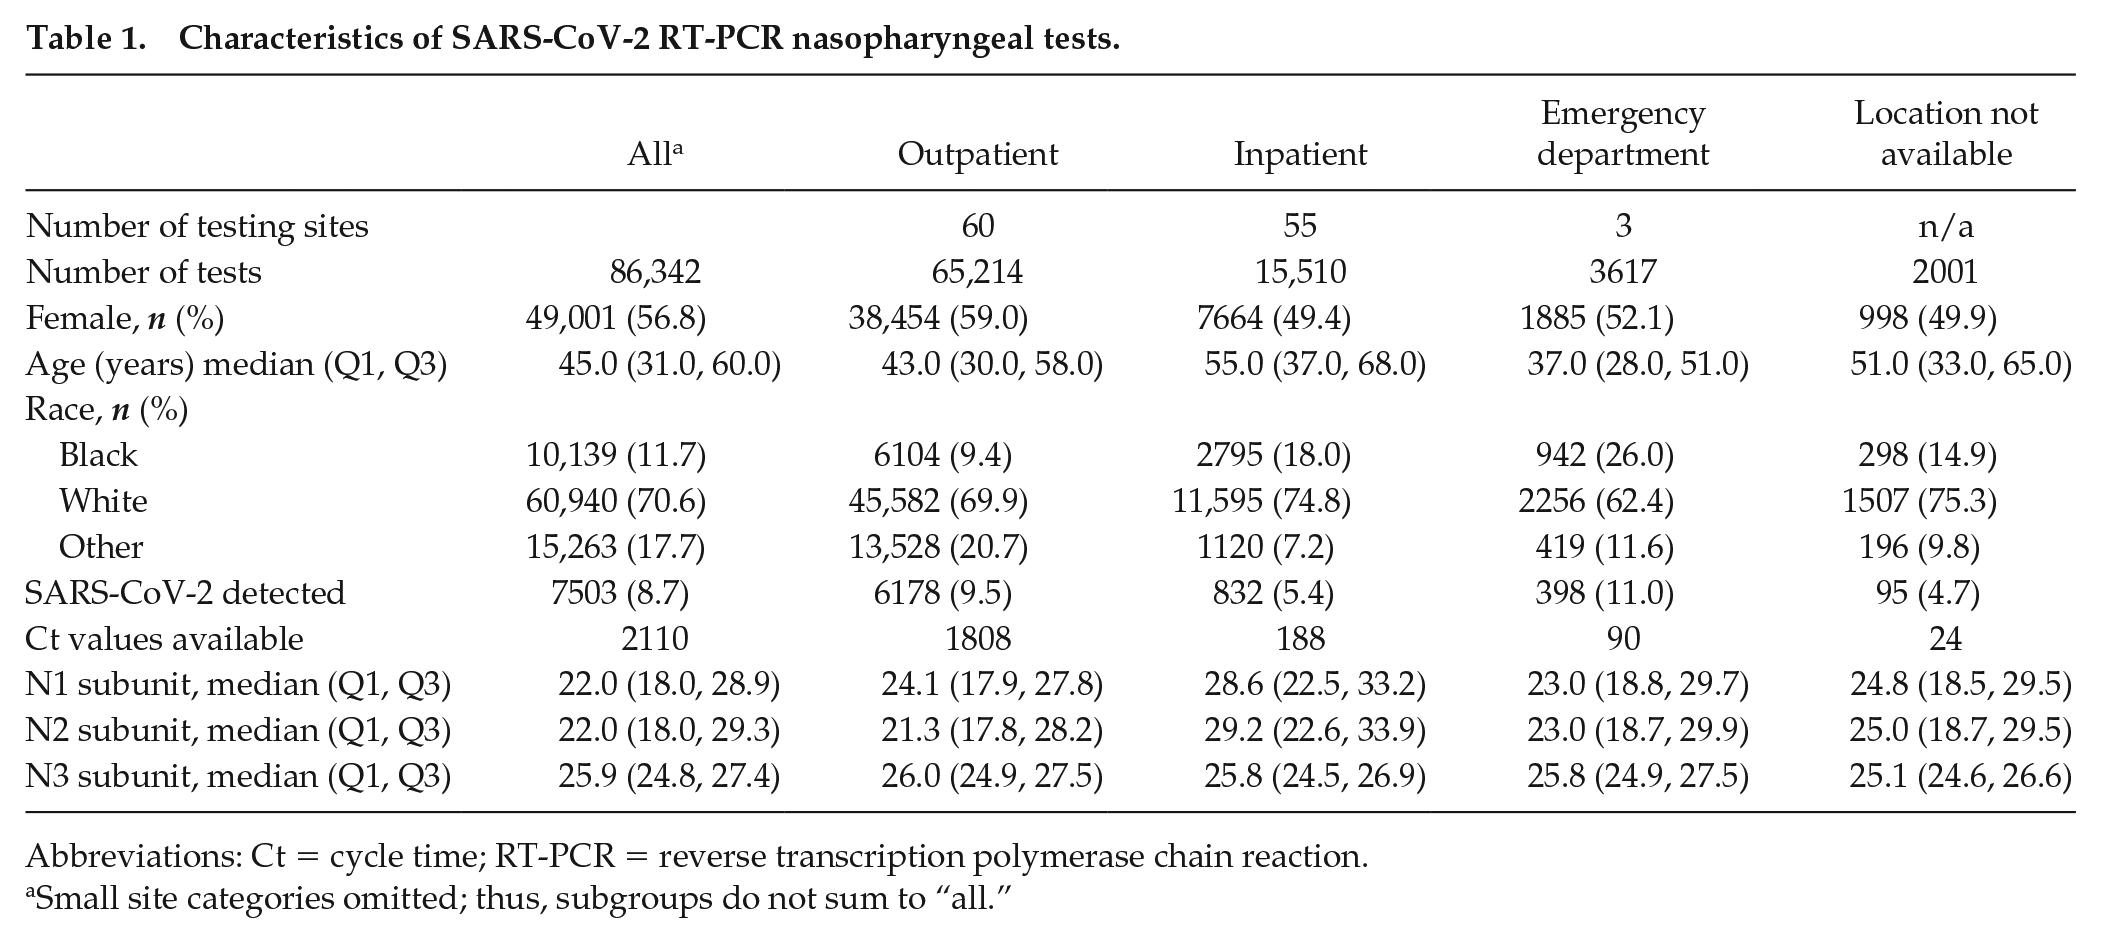
Abbreviations: Ct = cycle time; RT-PCR = reverse transcription polymerase chain reaction.
Small site categories omitted; thus, subgroups do not sum to “all.”
Number of tests performed per day ranged between 18 per day early on when testing capacity was being built and as a peak of 1360 tests per day. The proportion of positive tests varied between 0% and 18%, and 78,113 (90.5%) tests were performed between 0800 and 2000 h. The number of tests performed and proportion of positive tests by time of day are shown for all samples (Figure 1) and by collection site (Figure 2) using bootstrapped median curve and 95% confidence intervals shaded (blue line and blue shading). In Figure 1a, the best fit sinewave in (red line) suggests 24-h sinusoidal variation in the proportion of positive tests, with a peak in the fitted sinusoid at 1406 h and 2.0-fold difference between the fitted peak and trough. After adjusting for potentially nonlinear effects of age, sex, race, collection site, month, and day of week, the sinusoidal pattern in overall positivity in early afternoon persisted, with a slight reduction in magnitude to 1.7-fold difference between the fitted peak and trough (Figure 1b). Adjusted partial dependencies for each covariate are shown separately in the Supplemental Figure.
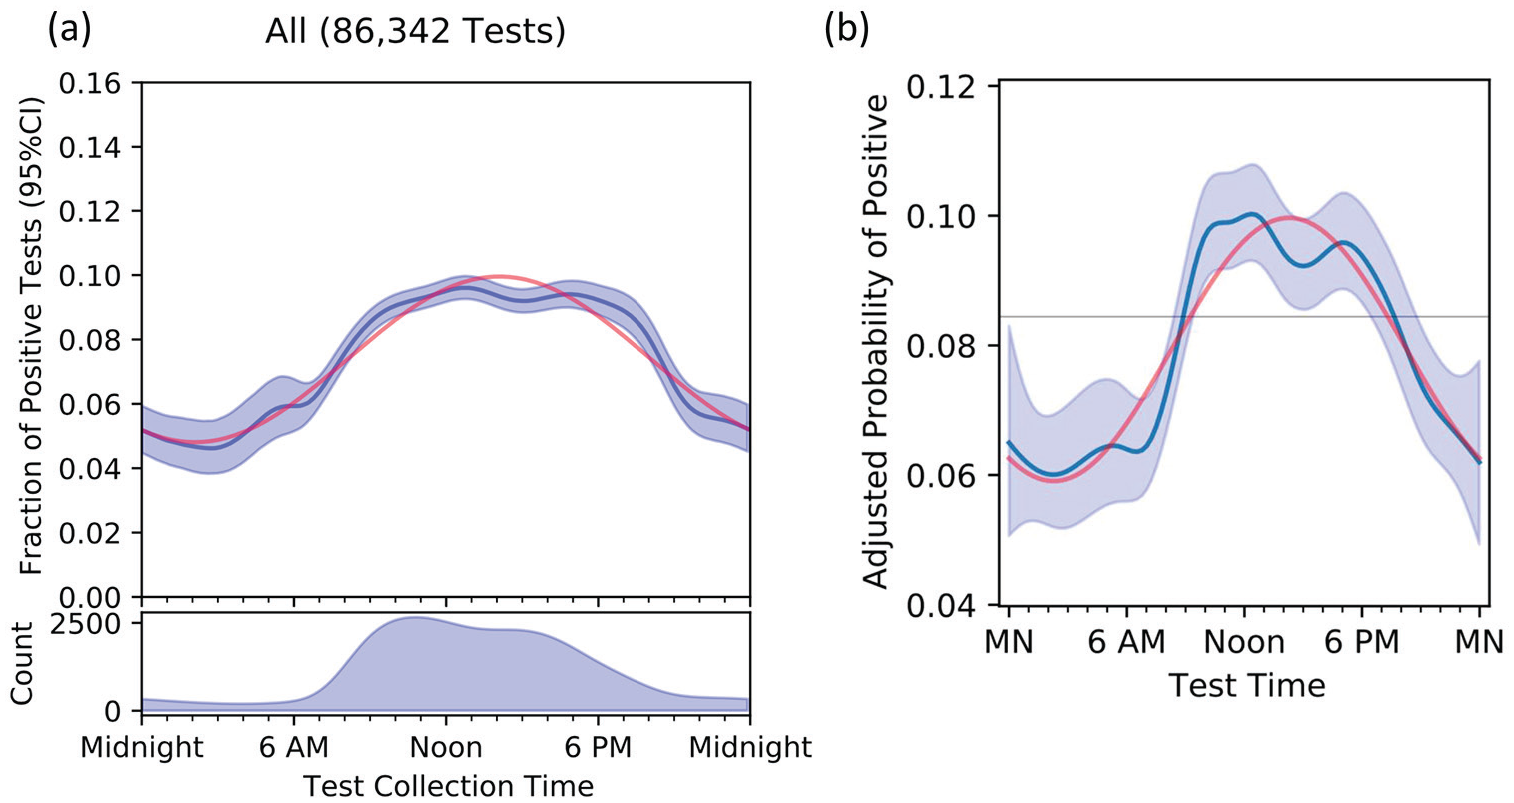
Unadjusted fraction of positive tests (panel a) and probability of a positive test after adjusting (panel b) for patient age, sex, race, testing site, month, and day, by time of day. The dark blue line is the median curve after bootstrap resampling, with 95% confidence intervals shaded. The red curve is the best fit sinewave, which in panel b peaks at 1406 h, with an amplitude of 1.7. Abbreviation: CI = confidence interval.
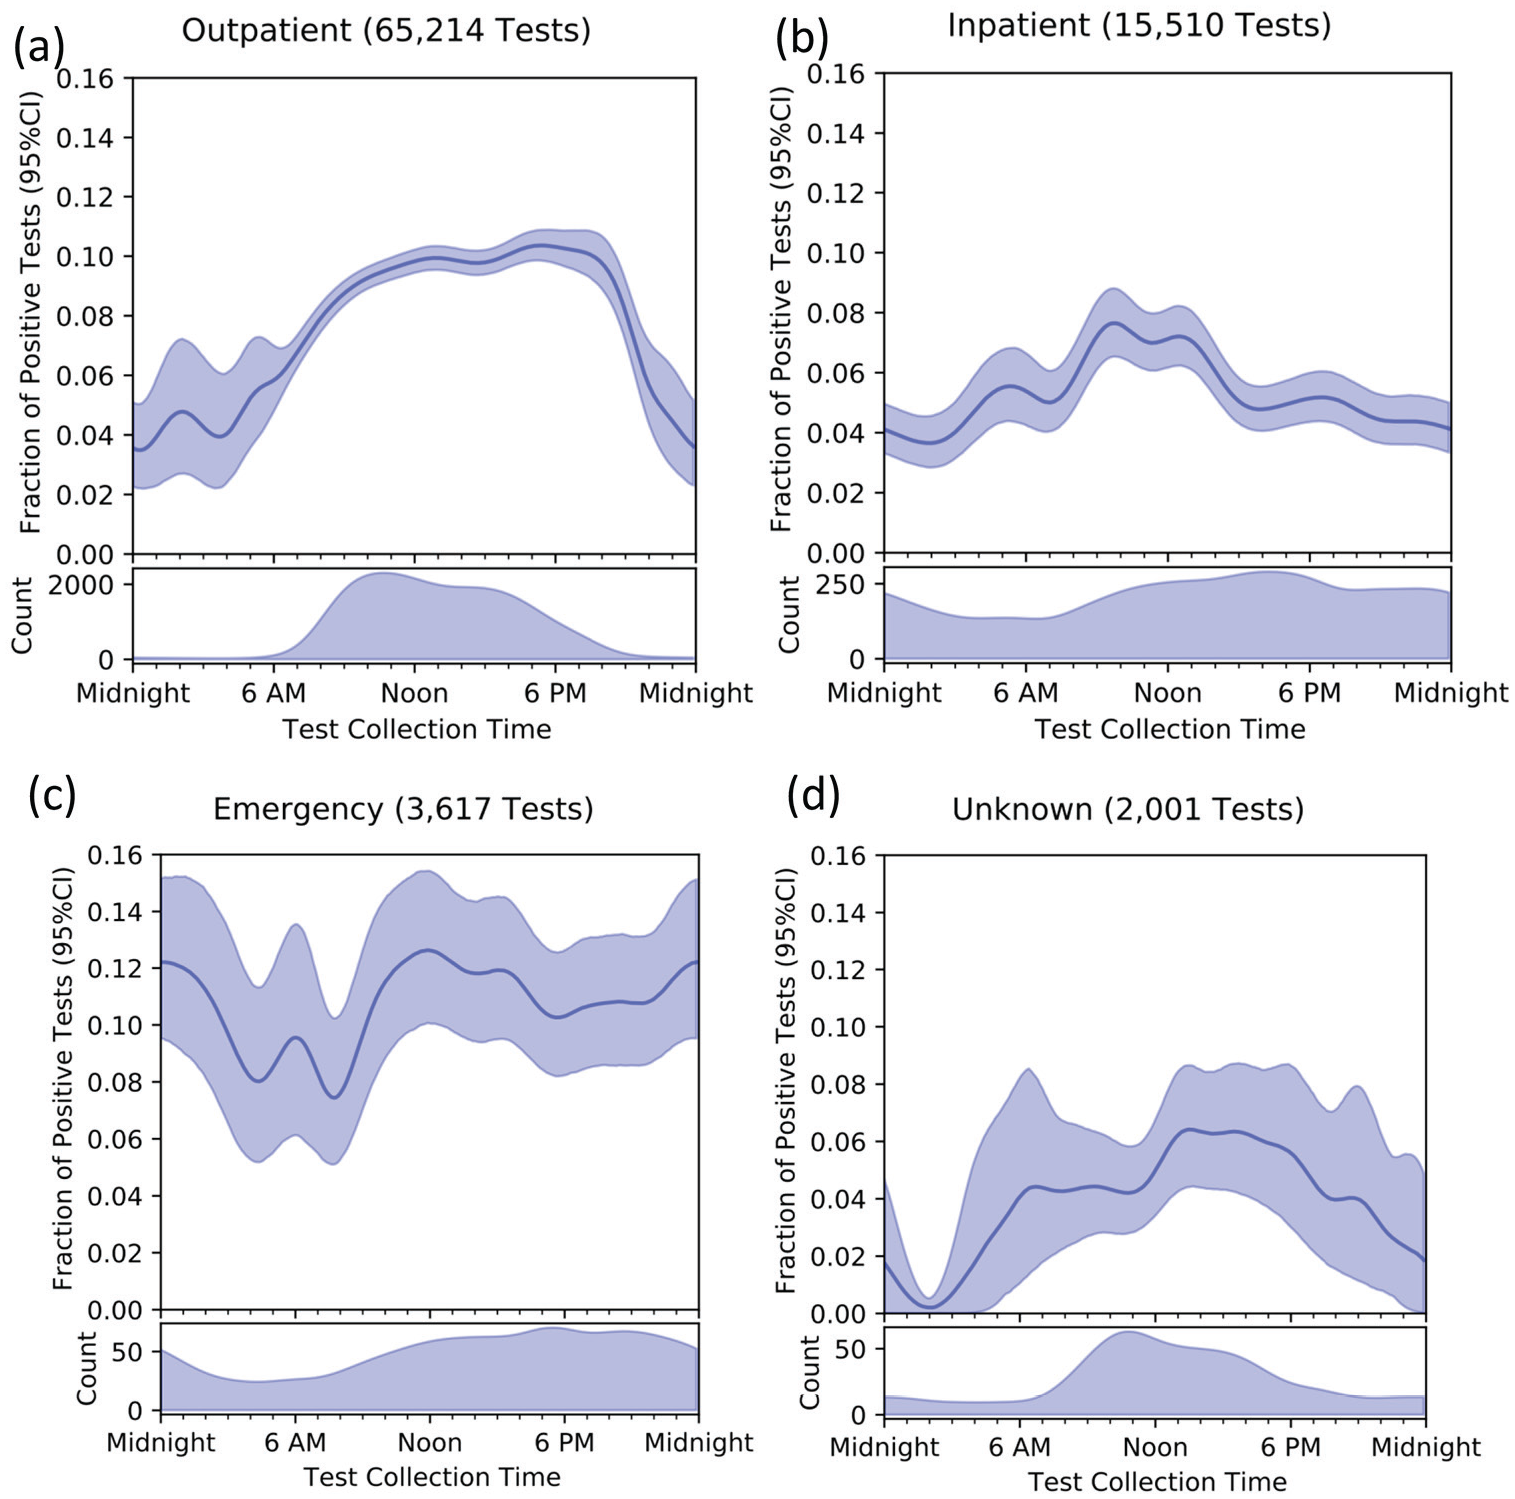
Fraction of positive tests by time of day across testing sites. Note that scale for number of tests performed differs by panel. Panel (a) Outpatient, Panel (b) Inpatient, Panel (c) Emergency Department, Panel (d) Unknown test location. Abbreviation: CI = confidence interval.
While most tests were performed in outpatient clinics (Figure 2a), tests were performed more evenly over day and night among hospitalized (Figure 2b) and emergency department (Figure 2c) patients. The temporal variation among tests collected in the emergency department is consistent with a small-amplitude diurnal cycle, but the confidence intervals are too wide to draw firm conclusions. Among the 2001 samples for which collection site was missing (Figure 2d, 2.3% of total samples), the patterns in timing of sample collection and positive results were similar to outpatients.
Ct values were available for 2110 positive tests. They display a bimodal distribution, with a second peak of low N1 nucleic acid concentration being much more prominent at night (Figure 3a); results were nearly identical for the N2 subunit (not shown). The distribution of RP values did not vary between day and night blocks (Figure 3b). Examination of distribution of N1/RP ratios across 4-h blocks of time also illustrates lower Ct values during day time-blocks (Figure 3c).
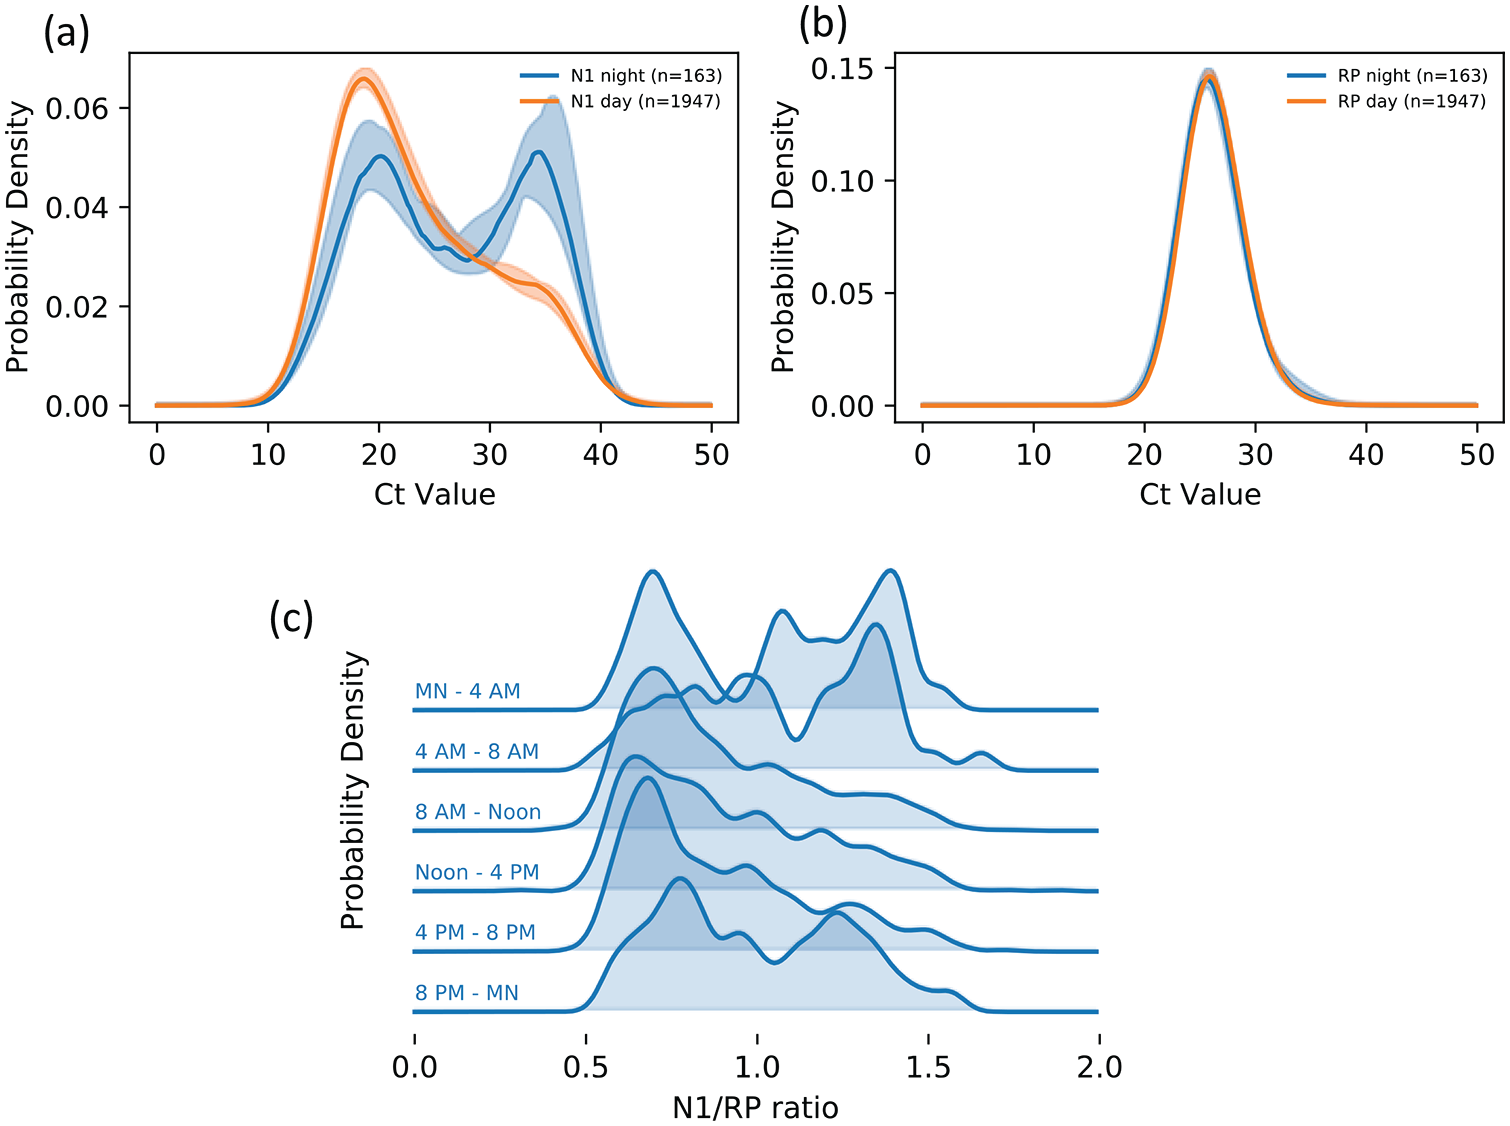
Ct values from positive tests, by time of day, where lower Ct values correspond to higher viral nucleic acid concentration. About half of all values for the N1 viral probe sequence shift into a low-concentration peak during night-time hours (panels a, b). The distribution for the process-control probe RP remains unchanged from day to night, ruling out sampling quality (collection, packaging, transportation, and processing) as major sources for the variation (panel c). N1 values in panel b are normalized by RP values to remove the small amount of processing noise that is consistent from day to night. Abbreviation: Ct = cycle time; RP = human RNase P.
Discussion
Among more than 86,000 RT-PCR tests for SARS-CoV-2 collected from adult patients at approximately 130 clinical locations over about 20 weeks in a regional health care system in the southeastern United States, 8.7% of tests detected SARS-CoV-2. The unadjusted fraction of positive SARS-CoV-2 tests (Figure 1) followed a diurnal variation that persisted, with a 1.7-fold difference between the peak and trough after adjusting for age, sex, race, collection site (which is a strong marker of disease severity), month, and day of week. Furthermore, the bimodal distribution of Ct values for positive tests differed between day and night, with roughly half of the night samples shifted into a peak of lower concentration of viral genetic material using raw data (Figure 3a), and Ct values adjusted for potential differences in sample collection techniques (Figure 3c). Together, these findings suggest that the optimal time of day for testing for SARS-CoV-2 is early afternoon. Furthermore, the indistinguishability of the process-control RP distribution in day versus night samples (Figure 3b) rules out sample-quality differences (swab collection, packaging, transportation, and processing) as a source of this observed variation.
These findings drawn from clinical samples are consistent with the hypothesis of a cyclic pattern in SARS-CoV-2 viral shedding, with a peak in the early afternoon, among viral variants circulating through August 2020. Definitively establishing such a cycle will require collection of samples, ideally at randomized times over the entire course of infection, including prior to development of symptoms, which may be impractical to conduct.
There are many potential biological or environmental mechanisms that could contribute to a diurnal cycle of SARS-CoV-2 viral activity, viral shedding, host response, and/or disease severity (Haspel et al., 2021), and our findings add to a growing set of evidence for such cyclic effects. Viral replication and spread depend on host mechanisms and can therefore be directly and indirectly influenced by host factors such as autonomic nervous system, body temperature, fasting/feeding cycles, cytokines, and/or hormones, which are well known to vary by time of day. There is evidence in other viruses that these host factors influence risk of infection, clinical disease severity, vaccine effectiveness, and treatment response (Borrmann et al., 2021; Cevic et al., 2021; Sengupta et al., 2021). Interactions of the immune system with viruses such as influenza, herpes, hepatitis B, and dengue has been shown to lead to diurnal variation in viral shedding and symptoms (Cermakian et al., 2013; Edgar et al., 2016; Scheiermann et al., 2018), and they influence vaccine effectiveness (Long et al., 2016; de Bree et al., 2020). For SARS-CoV-2, recent research suggests that levels of angiotensin-converting enzyme 2 (ACE2) receptors in the lung, which bind to the spike protein, are cyclical and that their disregulation is closely tied to cyclical viral entry and infection severity (Mehrabadi et al., 2021; Menezes et al., 2021; Zhuang et al., 2021b). Other work suggests that SARS-CoV-2 replication may be blocked by a circadian clock-modulating molecule (Sultan et al., 2021).
We cannot exclude the possibility of potential confounding by indication because information about test indication or presenting symptoms was not available. However, if asymptomatic patients were preferentially tested during daytime hours, we would expect this to dilute the fraction of positive tests during those times and bias our findings toward the null. Depending on the mechanism behind the variation we found, the disruption of patient’s circadian clocks to which hospitalized patients, especially critically ill patients, are susceptible (Haspel et al., 2021) may diminish the strength of the cycle (Figure 1b). Emergency department patients were more likely to have positive test results, and their night-time positivity was much higher than in other settings, suggesting a qualitatively different cohort or different indications for testing; however, the relatively small sample size makes it difficult to draw firm conclusions. If emergency department patients were more symptomatic or presented later in the course of clinical illness, they may have been more likely to have continuously detectable viral RNA in the nasopharynx (Kucirka et al., 2020), which would lead to attenuated cycle amplitude and a higher trough (Figure 1c).
Diurnal variation in the fraction of positive SARS-CoV-2 tests and in the amount of detected viral genetic material warrants further investigation because, if confirmed, it has important implications for public health and diagnostic strategies. A 1.7-fold variation in test sensitivity could be leveraged to optimize test collection time, result interpretation, and patient counseling. In addition, a shedding cycle that peaks in the afternoon may play a role in community and hospital spread if it occurs when patients are more likely to interact with others or seek medical care (Ahsan et al., 2019; Chaou et al., 2020). Such temporal variation should also be accounted for to maximize the effectiveness of non-pharmaceutical interventions to contain further viral spread and in vaccination strategies.
Supplemental Material
sj-pdf-1-jbr-10.1177_07487304211051841 – Supplemental material for Diurnal Variation in SARS-CoV-2 PCR Test Results: Test Accuracy May Vary by Time of Day
Supplemental material, sj-pdf-1-jbr-10.1177_07487304211051841 for Diurnal Variation in SARS-CoV-2 PCR Test Results: Test Accuracy May Vary by Time of Day by Candace D. McNaughton, Nicholas M. Adams, Carl Hirschie Johnson, Michael J. Ward, Jonathan E. Schmitz and Thomas A. Lasko in Journal of Biological Rhythms
Footnotes
Acknowledgements
Dr. McNaughton received support from the VA Geriatric Research Education Clinical Center, Tennessee Valley Healthcare System, VA Office of Rural Health (ORH-10808), NIH (R21HL140381), VA (IIR-19-134), and Pfizer. Dr. Adams received support from NIH/NIAID (R01AI157827). Dr. Johnson received support from the NIH/NIGMS (GM067152 and GM107434).
Conflict of Interest Statement
The author(s) have no potential conflicts of interest with respect to the research, authorship, and/or publication of this article.
Note
Supplementary material is available for this article online.
References
Supplementary Material
Please find the following supplemental material available below.
For Open Access articles published under a Creative Commons License, all supplemental material carries the same license as the article it is associated with.
For non-Open Access articles published, all supplemental material carries a non-exclusive license, and permission requests for re-use of supplemental material or any part of supplemental material shall be sent directly to the copyright owner as specified in the copyright notice associated with the article.