
Abstract
A crucial property of circadian clocks is the ability to regulate the shape of an oscillation over its cycle length (waveform) appropriately, thus enhancing Darwinian fitness. Many studies over the past decade have revealed interesting ways in which the waveform of rodent behavior could be manipulated, one of which is that the activity bout bifurcates under environments that have 2 light/dark cycles within one 24-h day (LDLD). It has been observed that such unique, although unnatural, environments reveal acute changes in the circadian clock network. However, although adaptation of waveforms to different photoperiods is well studied, modulation of waveforms under LDLD has received relatively less attention in research on insect rhythms. Therefore, we undertook this study to ask the following questions: what is the extent of waveform plasticity that Drosophila melanogaster exhibits, and what are the neuronal underpinnings of such plasticity under LDLD? We found that the activity/rest rhythms of wild-type flies do not bifurcate under LDLD. Instead, they show similar but significantly different behavior from that under a long-day LD cycle. This behavior is accompanied by differences in the organization of the circadian neuronal network, which include changes in waveforms of a core clock component and an output molecule. In addition, to understand the functional significance of such variations in the waveform, we examined laboratory selected populations that exhibit divergent eclosion chronotypes (and therefore, waveforms). We found that populations selected for predominant eclosion in an evening window (late chronotypes) showed reduced amplitude plasticity and increased phase plasticity of activity/rest rhythms. This, we argue, is reflective of divergent evolution of circadian neuronal network organization in our laboratory selected flies.
Introduction
Circadian clocks are time-keeping mechanisms that drive near 24-h rhythms in behavior and physiology, under constant conditions, across the living world. They synchronize to the environmental day and night and restrict activity to specific times of the day via a process referred to as entrainment (Dunlap et al., 2004). Such temporal restriction is believed to be adaptive to organisms (Vaze and Sharma, 2013). Over and above timing, clocks are also known to alter the rhythm waveform (also referred to as waveform plasticity, henceforth) in response to various environmental pressures, in ways that have ecological relevance (De et al., 2013; Menegazzi et al., 2012; Vanin et al., 2012; Vaze et al., 2012).
Plasticity in response to varying light conditions has been studied extensively in rodents over the past several decades (Gorman et al., 2017; Gorman and Elliott, 2003, 2004; Harrison et al., 2016; Pittendrigh and Daan, 1976). Few such studies have revealed that 2 light/dark (LD) cycles of short periodicity (e.g., 12 h) within one 24-h day (LDLD) are perceived by nocturnal rodents as an opportunity to bifurcate their activity patterns into 2 bouts, 1 in each of the dark phases. Moreover, studies show that such behavioral bifurcation is accompanied by antiphasic oscillations of Per1 in the core and shell of the suprachiasmatic nucleus (the site of the circadian pacemaker for sleep/wake behavior in mammals) in hamsters (Yan et al., 2010), and antiphasic oscillations of Per1 and Bmal1 in the core and shell of the suprachiasmatic nucleus in mice (Watanabe et al., 2007). In addition, the ability of organisms to show such bifurcation is thought to be dependent on the rigidity or lability of the circadian clock network (Gorman et al., 2017), thereby illustrating the utility of such unique, albeit unnatural environments in understanding the physiological regulation of plasticity. However, such studies have been restricted only to rodents, and we concur with the idea that understanding the functional significance of the clock’s ability to show such patterns of plasticity can be comprehensive only if we examine such behaviors in organisms from diverse taxa (as also discussed in Gorman et al., 2017).
Therefore, as a first step to understanding the effects of such environmental regimes on entrained activity/rest behavior of Drosophila melanogaster, we examined the behavior of our lab-reared wild-type flies (control stocks) under LDLD 5:7:5:7. We also examined the molecular clocks in the circadian pacemaker circuit along with the most well studied output molecule, Pigment Dispersing Factor (PDF) to further understand how this entrainment behavior is physiologically regulated.
We found that the LDLD regime does not induce bifurcation in control flies. Instead, flies display a behavior similar to but significantly different from that under a long photoperiod, suggesting that flies interpret LDLD as a “skeleton” to a long day. To the best of our knowledge, this is the first report that describes the neuronal circuit level phenotype reflective of such behavior in flies, and the circuit response is distinct from what is known under regular entrainment to LD 12:12 or to long photoperiods. Previous experiments have suggested that the evening oscillators (part of the dual oscillator framework known to regulate activity/rest rhythms) in Drosophila are dominant under long photoperiods (Stoleru et al., 2007). Results from our control flies indicated that comparing behaviors between LDLD and long photoperiod is a useful approach to probe into inherent differences in the organization of the dual oscillator network in flies.
We were therefore also interested in addressing 3 major questions:
Is there any utility of such a unique regime in behaviorally assessing the differences between strains that have inherently divergent networks?
To what extent is the hypothesis generalizable that waveform plasticity is dependent on the rigidity or flexibility of the clock network?
Can aspects of waveform plasticity evolve? If they do, we gain insights into the adaptive significance of such plasticity.
To answer these questions, we used previously described fly populations that have been artificially selected in our laboratory for predominant eclosion in the morning (early chronotypes) or evening (late chronotypes; Kumar et al., 2007; Vaze et al., 2012). Earlier experiments from our laboratory have hinted at the correlated evolution of dominant evening oscillators and flexible clock network in the late chronotypes (Nikhil, Vaze, et al., 2016). Therefore, these lines are ideal to address the aforementioned questions and additionally understand evolutionary constraints under which different aspects of plasticity can evolve.
We found that our early and late stocks showed differing degrees of waveform plasticity contingent upon the parameter examined, thereby providing further evidence for the utility of such regimes in probing the neuronal network organization underlying entrained behavior.
Materials and Methods
Fly Stocks and Husbandry
An ongoing long-term laboratory selection experiment in our laboratory has yielded 4 sets of early, control, and late D. melanogaster flies that have been used in all behavioral experiments reported in this article. Briefly, from each of 4 genetically independent and outbred ancestral populations, morning and evening emerging flies were derived, in addition to another set of control flies wherein no selection pressure was imposed (Kumar et al., 2007). Each of the 4 sets is treated as independent statistical blocks in our analyses. In case of the early populations, only the flies that eclose from their pupal cases between ZT21 to ZT01 (ZT00 is the time of lights-on) are collected to form the breeding population for the next generation. Similarly, in case of the late populations, only flies that eclose between ZT09 to ZT13 form the breeding pool for the next generation. Flies are collected in the aforementioned windows for at least 3 consecutive cycles to avoid inadvertent selection for altered development time. All 12 populations are maintained on a 21-day discrete-generation cycle and are cultured on banana-jaggery medium. All populations have an adult density of ~1500 to 1800 flies with roughly equal sex ratio that are housed in Plexiglas cages. These flies are provided with food supplemented with live yeast paste on day 18 after the previous egg collection, and eggs for the next generation are collected on day 21. At all life stages, flies are maintained in temperature-controlled cubicles with LD 12:12 such that light intensity during the photophase is ~70 lux. The cubicles are kept at 25 ± 0.5 °C and 65% ± 10% humidity. The populations had experienced ~250 generations of selection when this study was performed. One generation of common rearing was performed for all stocks before they were used in the experiments, to ensure that observed effects are due to selection alone. The generation from which individuals were chosen for the study was standardized under the control maintenance protocol to avoid phenotypes due to maternal and/or other nongenetic factors.
Activity/Rest Recording
Two sets of 32 virgin male flies aged 3 to 5 days each were sampled from each of the 12 populations and were used in the behavior experiments. These flies were loaded into 5-mm activity tubes with corn-sucrose-yeast medium for the recording of locomotor activity using the Drosophila Activity Monitoring system (Trikinetics, Waltham, MA) at 25 ± 0.5 °C. For both sets, recording of activity was performed under LDLD 5:7:5:7. For the first 9 days, the light intensity was maintained at ~70 lux during the photophase, following which on the 10th day, the flies were transferred to fresh tubes and light intensity was set at ~0.1 lux. Flies were recorded under ~0.1 lux for 7 to 8 days. Subsequently, each of the 2 sets of flies was transferred into constant darkness after the end of each photophase. Thus, 1 set of flies experienced DD 7-h later. Flies from both sets were used in analysis of behavior under entrainment. Recording was carried out for 4 to 5 days in constant darkness for each set to assess phase control. Activity/rest data for the long-day conditions of LD 18:06 with ~70 lux light intensity during the photophase were used from an experiment performed by Lakshman Abhilash, the preliminary results of which have been reported elsewhere (Nikhil, Abhilash, et al., 2016).
Rationale for LDLD Experimental Regime
Recent experiments on mice revealed that bifurcation of activity occurs only in the presence of LDLD cycles only when the dark phase has dim illumination (Harrison et al., 2016). This has been attributed to the effect of constant light on the inter-neuronal coupling of the circadian network (Gorman et al., 2017). However, in our experiments, we used LDLD to induce bifurcation in flies with complete darkness during the dark phase. This was because earlier studies in flies with dim nighttime illumination revealed that the effects of dim scotophase illumination are predominantly clock independent (Kempinger et al., 2009). In addition, we used an LDLD 5:7:5:7 regime such that the duration of the LD regime that allows for activity for a diurnal animal (i.e., 5 h for each photophase) is the same as that provided to nocturnal rodents in Harrison et al. (2016; i.e., 5-h for each scotophase), only to maintain consistency.
Immunohistochemistry
Adult flies of the 4 control populations alone were pooled and subjected to LDLD 5:7:5:7 for ~10 days (~70 lux). These flies were then sampled at 6 different phases (i.e., ZT03, ZT07, ZT11, ZT15, ZT19, and ZT23) while they were entrained to LDLD 5:7:5:7 for immunohistochemistry. The protocol we used is a slight modification of the method that has been published in a previous study (Prakash et al., 2017). We used control flies only to first gain insights into the behavior of the network under this novel short T-cycle regime. Briefly, their brains were dissected in ice-cold Phosphate-buffered saline (PBS) and immediately fixed with 4% Paraformaldehyde solution for 30 min at room temperature. The brain samples were then blocked with 10% horse serum for 1 h at room temperature and for 6 h at 4 °C followed by incubation with a primary antibody cocktail for 48 h at 4 °C. The primary antibodies used were anti-PER (rabbit 1:20,000; a gift from Jeffrey C. Hall, Brandeis University, Waltham, MA) and anti-PDF (mouse 1:5000; DSHB, PDF C7). Subsequently, 6 to 7 washes of 10 min each were given with 0.5% PBT. Incubation with appropriate secondary antibodies was performed for 24 h at 4 °C. The secondary antibodies used were Alexa Fluor conjugated goat anti-rabbit 488 (1:3000; Invitrogen, Carlsbad, CA) and goat anti-mouse 647 (1:3000; Invitrogen). The brains were further cleaned after the immunostaining and were mounted on a glass slide in 7:3 glycerol:PBS mounting medium.
Data Acquisition and Analysis
Behavioral Analysis
The first part of our analysis was to test if our flies underwent waveform bifurcation under an LDLD regime or frequency demultiplication. Frequency demultiplication is the phenomenon wherein a circadian rhythm entrains to zeitgebers with periodicities that are multiples of 24-h with an exactly 24-h period (see Saunders, 2002). In other words, under such circumstances, the circadian component dominates over the LD cycle’s periodicity. We examined the actograms and the amplitude of periodograms at 12- and 24-h periodicities under both light intensities. For each fly, we quantified the amplitude of the χ2 periodogram. The estimates of power were obtained using the open-source rhythm analysis software, RhythmicAlly (Abhilash and Sheeba, 2019). Owing to the fact that measurements for the periodogram power at different periodicities for each fly come from the same time-series data, they are likely to be dependent on each other. Therefore, paired t-tests were performed using block means to compare if power at 12 h was significantly different from that at 24 h, individually for all comparisons. These comparisons were made only for data obtained from flies exposed to LDLD 5:7:5:7 and not for those that experienced LD 18:06. Importantly, we assess and comment on the presence or absence of behavioral bifurcation based on visual inspection of the activity profiles and phases under constant conditions immediately after entrainment, in addition to the periodogram power.
Second, we quantified phase and amplitude of the activity waveform under different regimes. For both of these estimates, we defined a 5-h window coinciding with each of the photophases under LDLD. To estimate phase, we used phase of center of mass (ψCoM) for the morning and evening activity separately (Batschelet, 1981). For amplitude, we calculated the activity maxima in the evening window and divided it by the maximum activity in the morning window and referred to it as the relative height of evening peak (RHEP). Phase and amplitude values in the same windows were computed for the LD 18:06 regime as well.
We compared the RHEP in control flies under LDLD 5:7:5:7 (70 lux) and LD 18:06 using a 2-way mixed model, randomized block design analysis of variance (ANOVA) using block means, wherein regime was a fixed factor and block was treated as a random factor. Similarly, we analyzed LDLD 5:7:5:7 (0.1 lux) versus LD 18:06. Post hoc tests were done using the Tukey’s honestly significant difference (HSD) test, and all results were considered significant at α = 0.05. We used similar 2-way mixed-model designs to analyze morning and evening phases as well. While comparing amplitude and phase of early and late flies, we used a separate 3-way mixed-model randomized block design ANOVA, wherein genotype and regime were treated as fixed factors and block was treated as a random factor. Multiple comparisons following these ANOVAs were done using the Tukey’s HSD test. All results were considered statistically significant at α = 0.05. We point out that the LD 18:06 experiment was done once, and the same data have been used in different figures for facilitating appropriate visualization and statistical comparisons.
In addition, to comment on circadian entrainment of flies to LDLD regimes, phases under constant conditions, during and after entrainment to LDLD 5:7:5:7 and LD 18:06 were analyzed. Daily phases of offset (ψOFFSET) of activity for the entire duration of the experiment were subjectively marked for individual flies using RhythmicAlly. These values were averaged over all cycles under the presence of the zeitgeber as an estimate of ψOFFSET. Under constant conditions, the eye-fit ψOFFSET was used to fit a least-squares regression line to estimate the free-running period. Using this extrapolated regression line, ψOFFSET on the first day in DD was estimated and used for analyses. D. melanogaster activity/rest offset typically occurs around the time of dusk; therefore, we used the V test at α = 0.05 to ask if ψOFFSET is significantly unimodal around the local time of dusk (Zar, 1999) under and after entrainment to gain insights into phase control. All of these analyses were performed using custom-written R-codes and the CircStats package for R (Lund and Agostinelli, 2018).
Image Acquisition and Analysis of Intensities
All of the slides prepared during the immunohistochemistry experiment were imaged using confocal microscopy on a Zeiss LSM 880 microscope with a 40× (oil immersion) objective as described elsewhere (Prakash et al., 2017). We used a multiple component COSINOR-based method (Cornelissen, 2014) to analyze aspects of rhythmicity in our intensity data, for both PER and PDF. We used a 2-component model, with 12-h as one component and 24-h as the other. All of these COSINOR analyses were implemented using custom scripts and the CATCosinor function from the CATkit package written for R (Lee Gierke and Cornelissen, 2016). All statistically significant contributions are based on a type 1 error rate of 5%.
Results
Drosophila Populations Show Frequency Demultiplication under LDLD 5:7:5:7
Visual inspection of the actograms under LDLD 5:7:5:7 suggests that our control stocks show frequency demultiplication (Fig. 1a, top and middle) and not a bifurcated activity pattern. To quantitatively verify if this pattern of activity/rest in our flies was indeed frequency demultiplication, we measured the power of the χ2 periodogram at 12-h and 24-h periods, with the expectation that higher power at 24 h would imply frequency demultiplication and higher power at 12 h would imply activity bifurcation (Harrison et al., 2016). We found that power at 24 h was statistically significantly higher than that at 12 h (Fig. 1b; Table 1) under both high and low light intensities during the photophase (Fig. 1b, left and right panels, respectively), thereby clearly indicating that our flies entrained with a periodicity of 24-h by treating 2 consecutive LD cycles as 1 day (high light intensity: paired t3 = −14.36, p < 0.05; low light intensity: t3 = −34.92, p < 0.05). We are confident that this behavior is a bona fide entrainment state due to (1) stable timing of activity bouts across days, (2) major activity bouts not coinciding with any LD transition, and (3) the phase at which activity starts under constant darkness (Fig. 1a, top and middle; Fig. 2). It is critical to note here that periodogram power using the χ2 periodogram is typically higher for longer periods, and this happens to be a limitation of using the method. Therefore, we use the following additional criteria to comment on the presence or absence of behavioral bifurcation. In addition to periodogram power, we consider rhythms to be bifurcated only if (1) visual inspection of actograms and activity profiles show 2 distinctly separate activity bouts and (2) each of these different bouts of activity start free running from phases dictated by the respective photophases they are restricted to, before transfer to DD (see Figs. 1 and 2 and subsequent paragraphs).
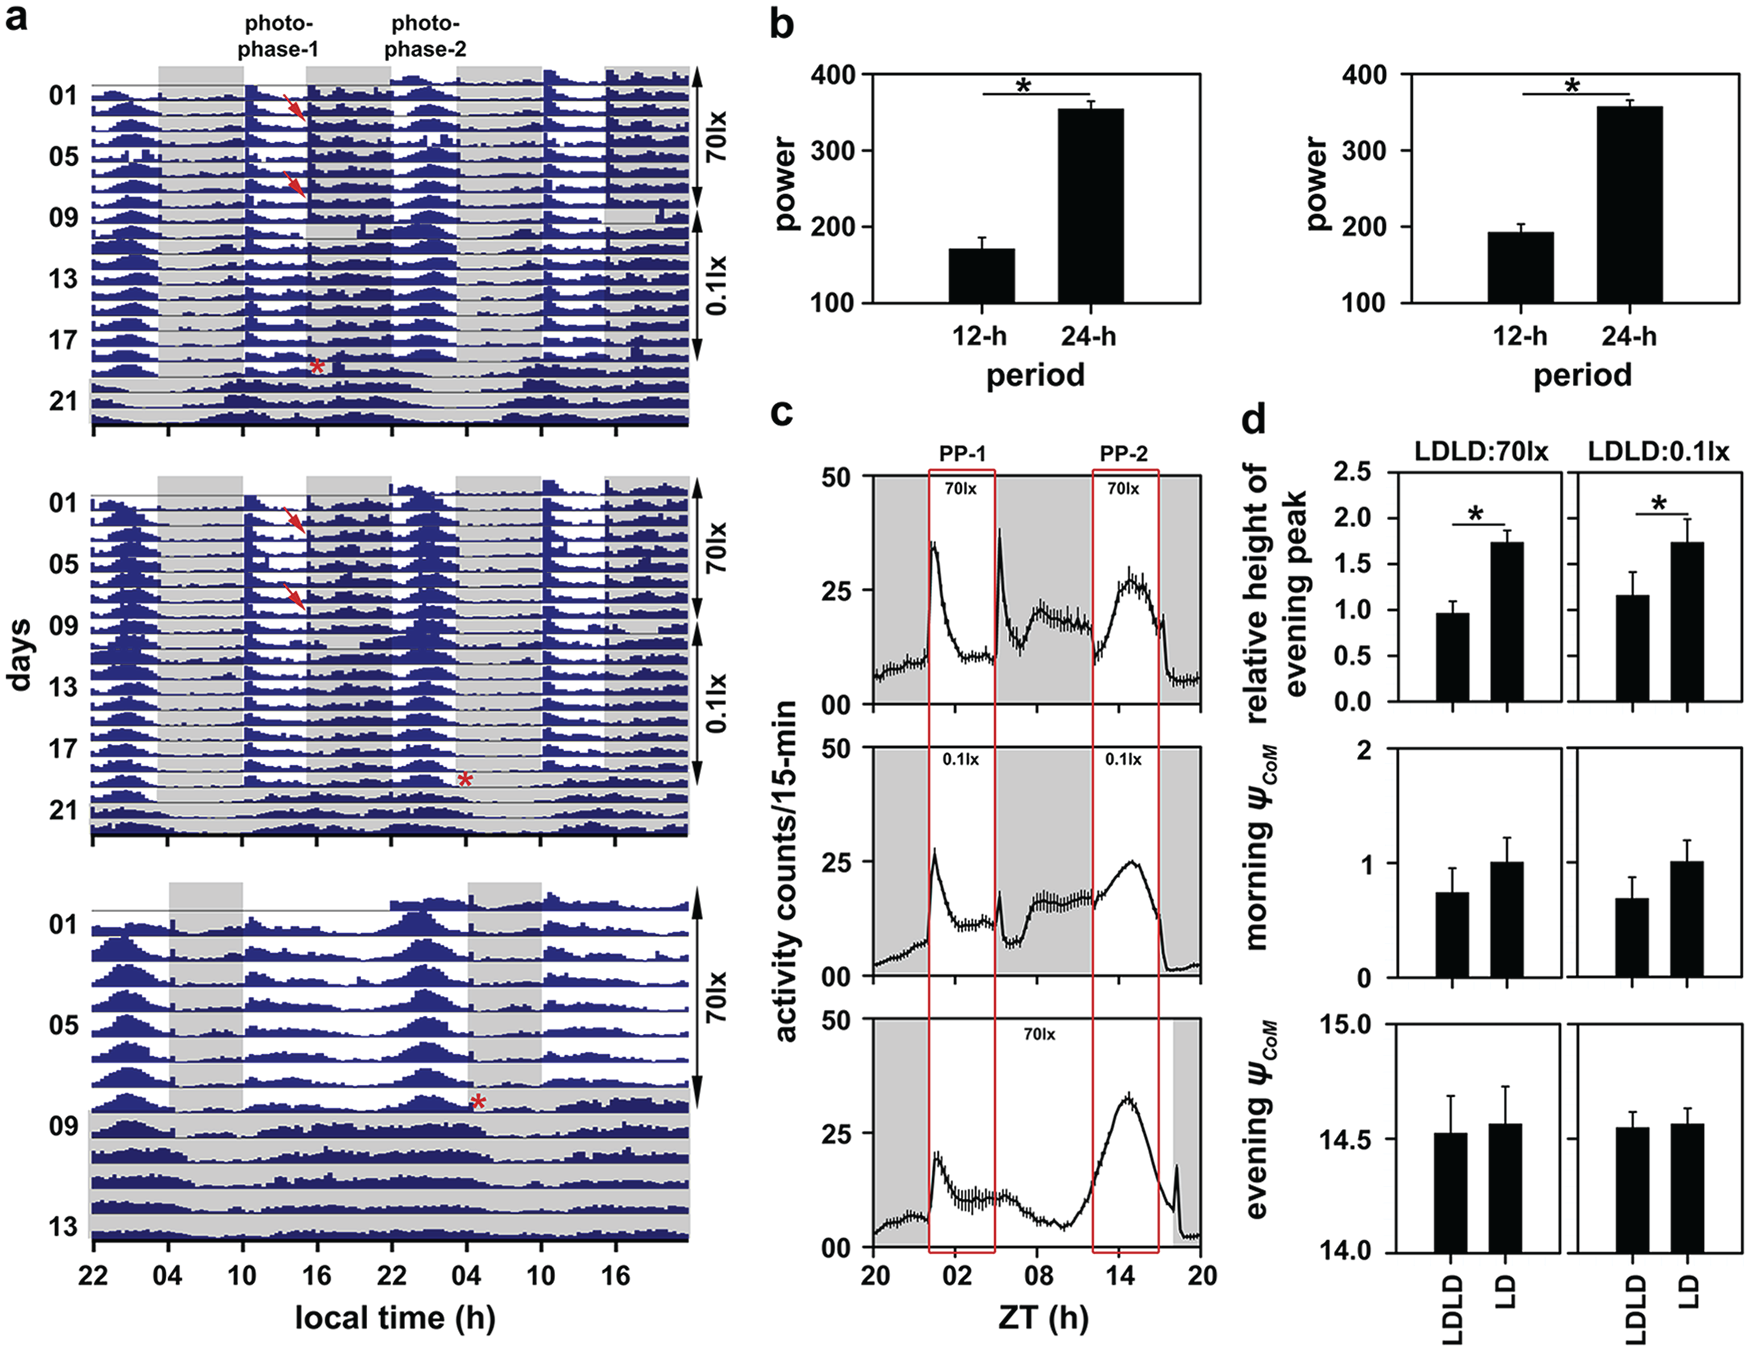
(a) Batch actograms displaying activity patterns of control flies under LDLD 5:7:5:7 (top and middle) and LD 18:06 (bottom). In case of the LDLD regime, flies were first exposed to 70 lux light intensity during the photophase and then to 0.1 lux light intensity during the photophase. One batch of flies was then transferred into constant darkness (DD) after photophase-1 (top), and the other batch was transferred to DD after photophase-2 (middle). Flies were recorded under LD 18:06 for 8 days with 70 lux light intensity during the photophase, after which they were transferred to DD (bottom). The gray-shaded region on the actograms represents the scotophase of the light/dark cycle. Arrowheads represent the masking response to light transitions when 70 lux was provided during the LDLD regime. Asterisks on the actograms indicate the phases at which individuals were transferred to DD. The short interval during which data are not seen in the top and middle actograms indicates the duration when monitors were disconnected to transfer flies into tubes with fresh food. Shown also are power values extracted from the χ2 periodogram at period values of 12- and 24-h (b) under LDLD with 70 lux during the photophase (left) and 0.1 lux during the photophase (right). Error bars in this panel are standard error of mean (SEM), and the asterisks indicate statistically significant differences. Depicted are activity profiles averaged over cycles and individuals under LDLD with 70 lux during the photophase (c, top), 0.1 lux during the photophase (c, middle) and long photoperiod (c, bottom). Gray-shaded regions indicate the scotophase. The rectangular box spanning panel (c) on the left is the morning window and on the right is the evening window that we defined to calculate ψCoM of morning and evening activity, respectively. The error bars represent SEM. PP-1 and PP-2 refer to photophases 1 and 2, respectively, for the top and middle figures. (d) Relative height of the evening peak of activity under 70 lux during the photophase compared with its value under the long photoperiod (top left) and the same under 0.1 lux light intensity during the photophase of LDLD (top right). Also shown are ψCoM of morning (middle left and middle right) and evening activity (bottom left and bottom right) under both light intensities. All error bars in panel (d) are 95% confidence intervals estimated using the Tukey’s honestly significant difference test to facilitate visual hypothesis testing. All means with nonoverlapping error bars are statistically significantly different from each other (also indicated by asterisks). The LD 18:06 data in both the left and right sides of panel (d) are the same data that have been replotted to facilitate appropriate statistical comparisons.
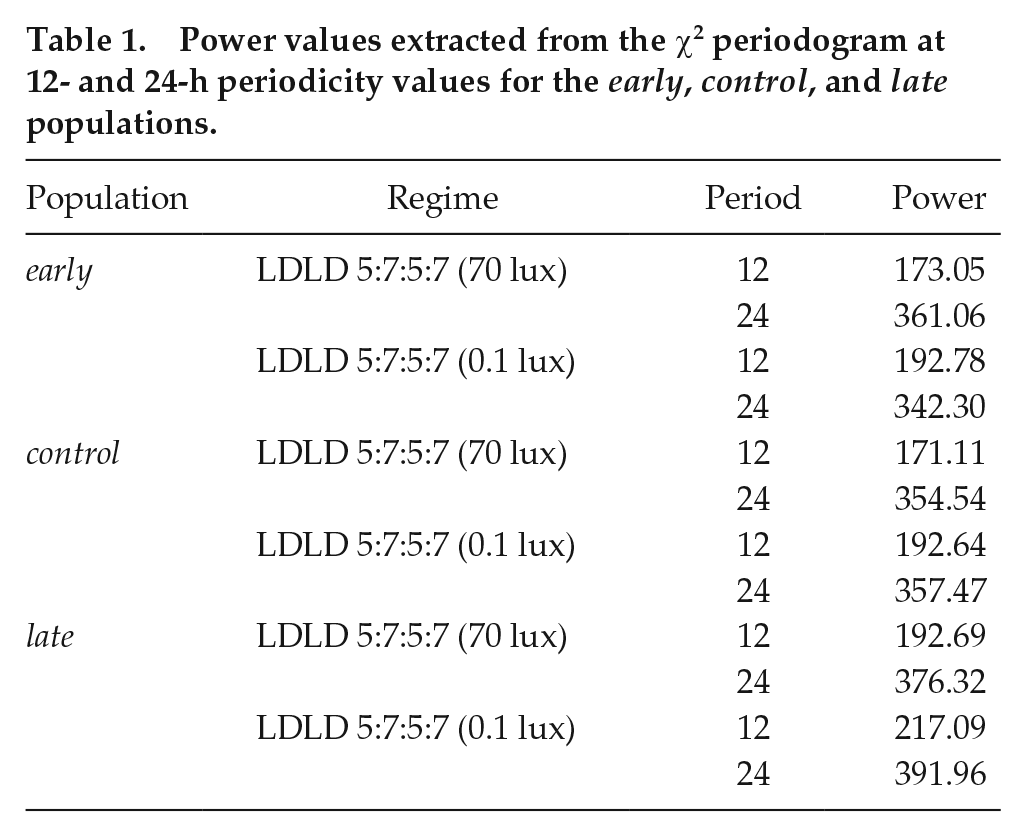
Power values extracted from the χ2 periodogram at 12- and 24-h periodicity values for the early, control, and late populations.
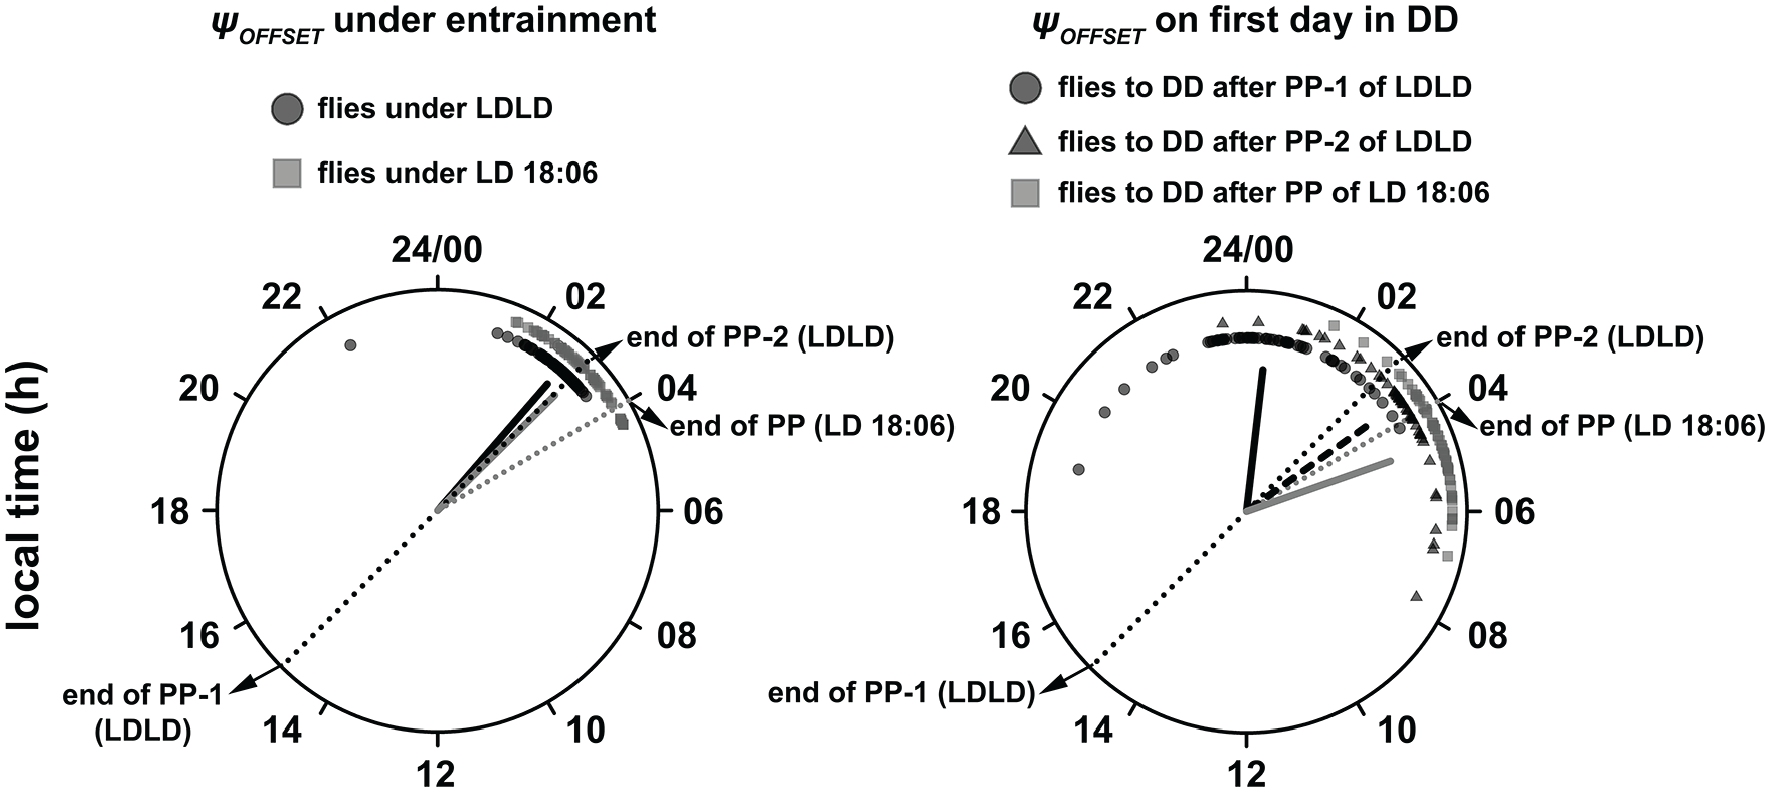
(Left) ψOFFSET of flies under their respective zeitgeber regimes. The solid black and gray lines represent the mean angle and length of the resultant vector (measure of angular dispersion) of flies under LDLD and LD 18:06 regimes, respectively. Also depicted here are the ψOFFSET of flies on the first day of DD after entrainment (right). The solid and dashed black lines indicate the mean phase and angular dispersion of flies that were transferred to DD after the first and second photophases, respectively. The gray line indicates the mean phase and angular dispersion of flies that were transferred to DD after a long-day regime.
In addition, the behavior of our flies under LDLD 5:7:5:7 was similar to the behavior of flies under a long photoperiod (LD 18:06; Fig. 1a, bottom), thereby suggesting that the control flies may have perceived the provided LDLD regime as a “skeleton” for a long day (Fig. 1a). However, there were subtle differences in the activity waveform between LDLD 5:7:5:7 and LD 18:06 (Fig. 1c). Under the long-day regime, we found that the RHEP was close to 2, implying that maximum evening activity was almost twice as much as that of morning activity (F1,3 = 88.86, p < 0.05; Figs. 1c, bottom and 1d, top). However, under LDLD 5:7:5:7, the 2 activity peaks were comparable (Figs. 1c, top and 1d, top). This, we argue, is not because of the masking response of morning activity to lights-on, as the same feature was also present when flies were subjected to 0.1 lux light intensity LDLD 5:7:5:7 (F1,3 = 13.08, p < 0.05; Figs. 1c, middle and 1d, top). Such changes in the RHEP were predominantly brought about by increased amplitude of morning activity (Fig. 1c).
Furthermore, there was no significant difference in the phase of center of mass (ψCoM) of morning (Fig. 1d, middle; high light intensity: F1,3 = 3.95, p > 0.05; low light intensity: F1,3 = 7.75, p > 0.05) or evening (Fig. 1d, bottom; high light intensity: F1,3 = 0.20, p > 0.05; low light intensity: F1,3 = 0.10, p > 0.05) bouts of activity under either light intensity (see the Materials and Methods section). This suggests that LDLD induces amplitude plasticity in wild-type flies.
Our claims that this behavior of flies under LDLD is an entrained phenomenon and similar to that under long-day regimes are validated by analyses of ψOFFSET on the first day in DD. Owing to the fact that Drosophila activity offset typically occurs around dusk, we wanted to ask whether offset under entrainment clustered around dusk in our flies for LDLD (i.e., end of the second photophase) and for LD 18:06. Moreover, we wanted to know if similar clustering is observed on the first day in DD, which would then indicate entrainment. We found that under LDLD, the mean ψOFFSET was ~2.73-h, and this phase value was significantly clustered around 3-h, which is when the second photophase ended (i.e., onset of perceived night-time; Fig. 2, left;
Levels of Nuclear PER (PERIOD) in the Circadian Clock Circuit
To examine the cellular underpinnings of frequency demultiplication in Drosophila, we analyzed the oscillations in levels of nuclear PER protein in different cell types of the circadian neuronal network. Using a multiple component COSINOR-based method, we detected a significantly bimodal oscillation in the small lateral ventral neurons (s-LNvs). There was a significant 24-h component that explained 29.14% of the variation in PER levels, whereas the 12-h component, although significant, explained only 15.98% of the variation (Figs. 3 and 4; Suppl. Fig. 1; Table 2). The dominant 24-h peak coincided with the onset of photophase-1 (Fig. 3). The lower 12-h peak of PER oscillation occurred just before the onset of photophase-2 (Fig. 3). We found that only ~11.2% of variation in PER in the large lateral ventral neurons (l-LNvs) is explained by the multiple component COSINOR, of which neither the 24-h nor the 12-h components were statistically significant (24-h: 4.69%, p > 0.05; 12-h: 6.64%, p > 0.05; Figs. 3 and 4; Suppl. Fig. 1; Table 2).
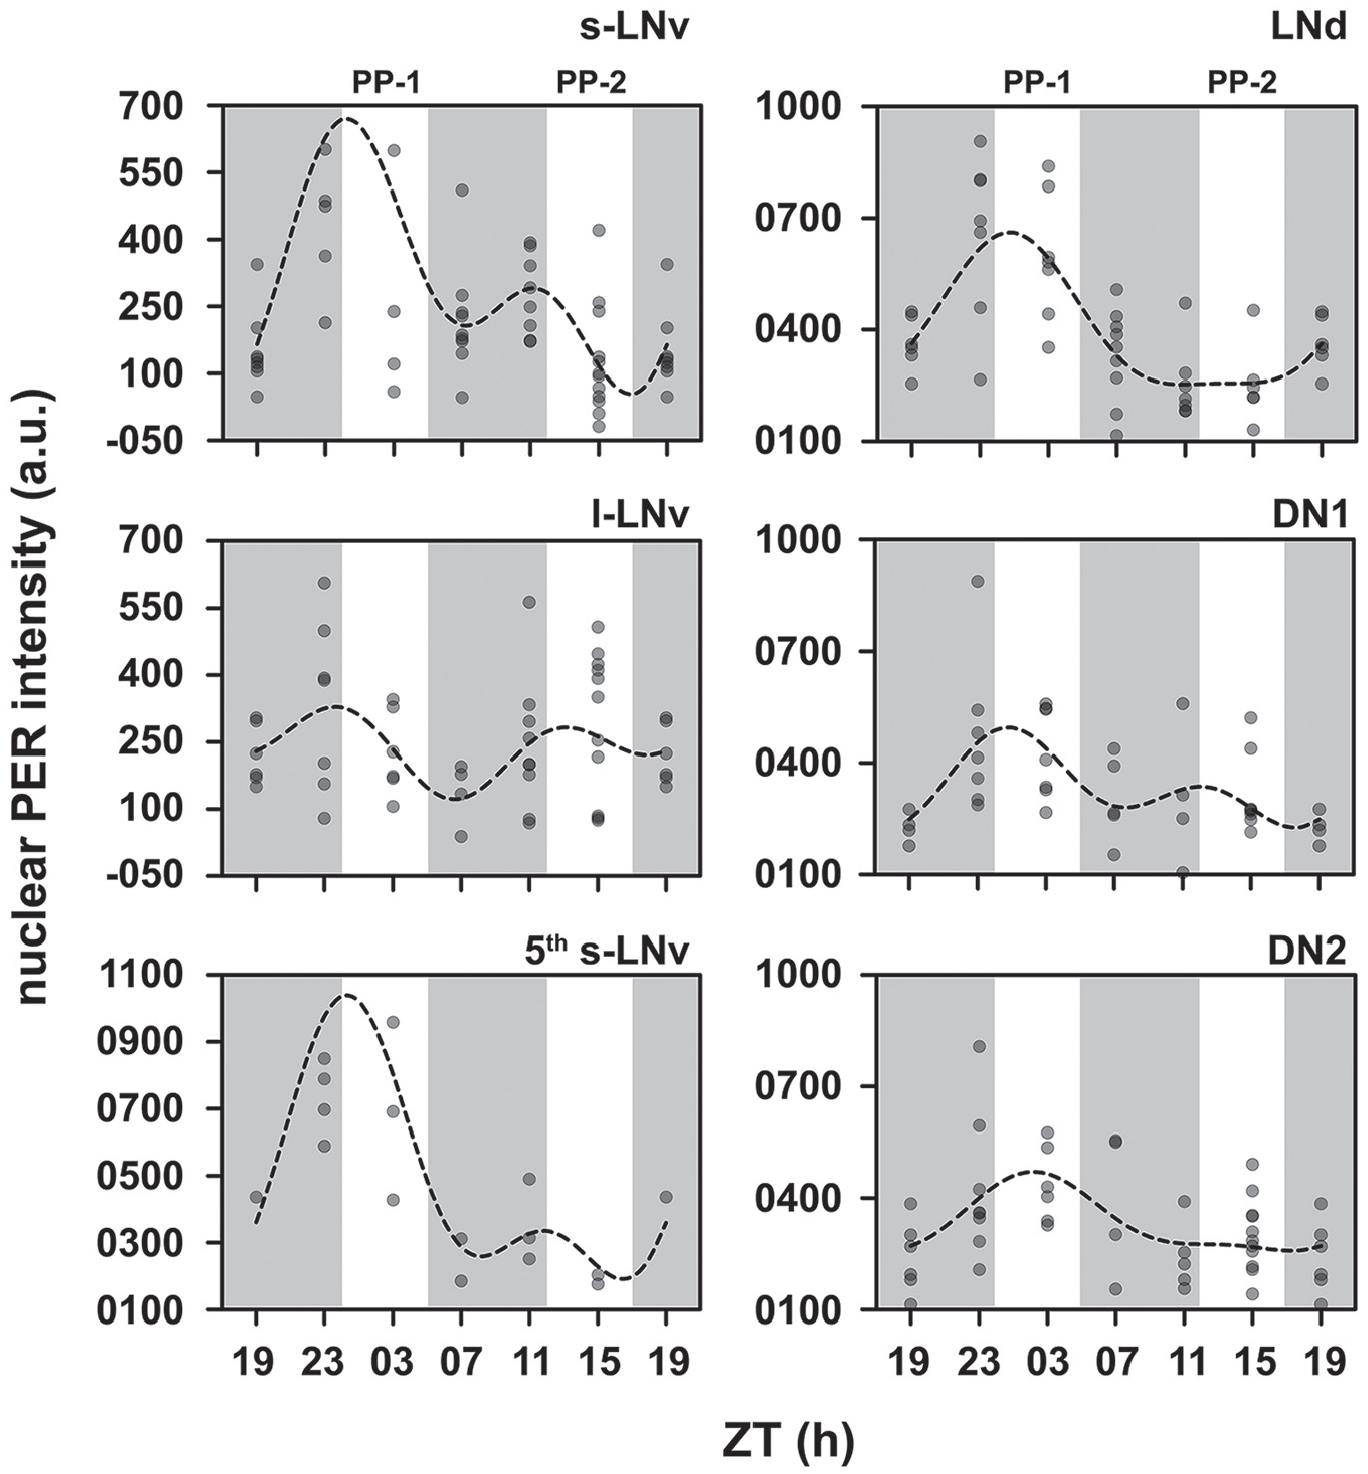
Scatter plots of PER intensities in different cells of the circadian network. Each dot represents the mean PER value averaged over hemispheres of 1 brain. The dots are set at reduced opacity; therefore, darker shades of dots imply multiple values overlapping. The dashed line is the best-fit COSINE curve from the parameters that were extracted from the multiple-component COSINOR analysis. PP-1 and PP-2 refer to photophases 1 and 2, respectively.
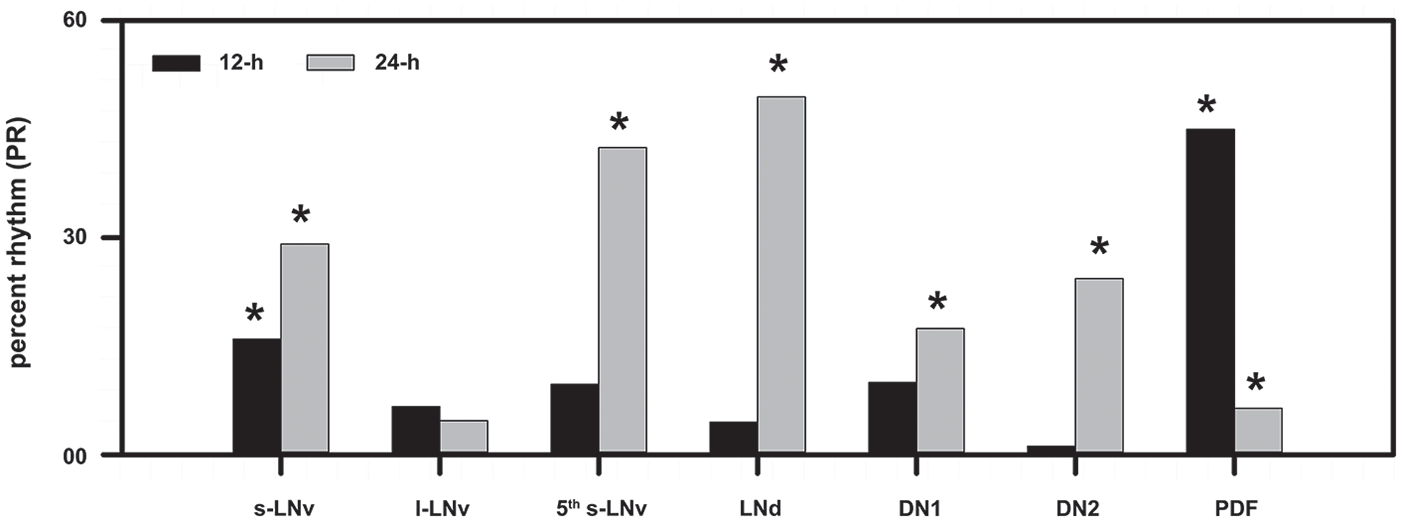
The percentage rhythm (PR) for each periodic component that was tested in the multiple-component COSINOR for nuclear PER in each cell type and Pigment Dispersing Factor in the dorsal projections. PR is analogous to R2 (coefficient of determination) and describes what percentage of variation in the data set is described by each periodicity. The asterisks above each bar indicate whether or not that periodic component had a statistically significant contribution toward explaining variation in the data set.
Contribution of the 12-h and 24-h components to the multiple-component COSINOR and their statistical significance for nuclear PER in all cell types and Pigment Dispersing Factor in the dorsal projections.
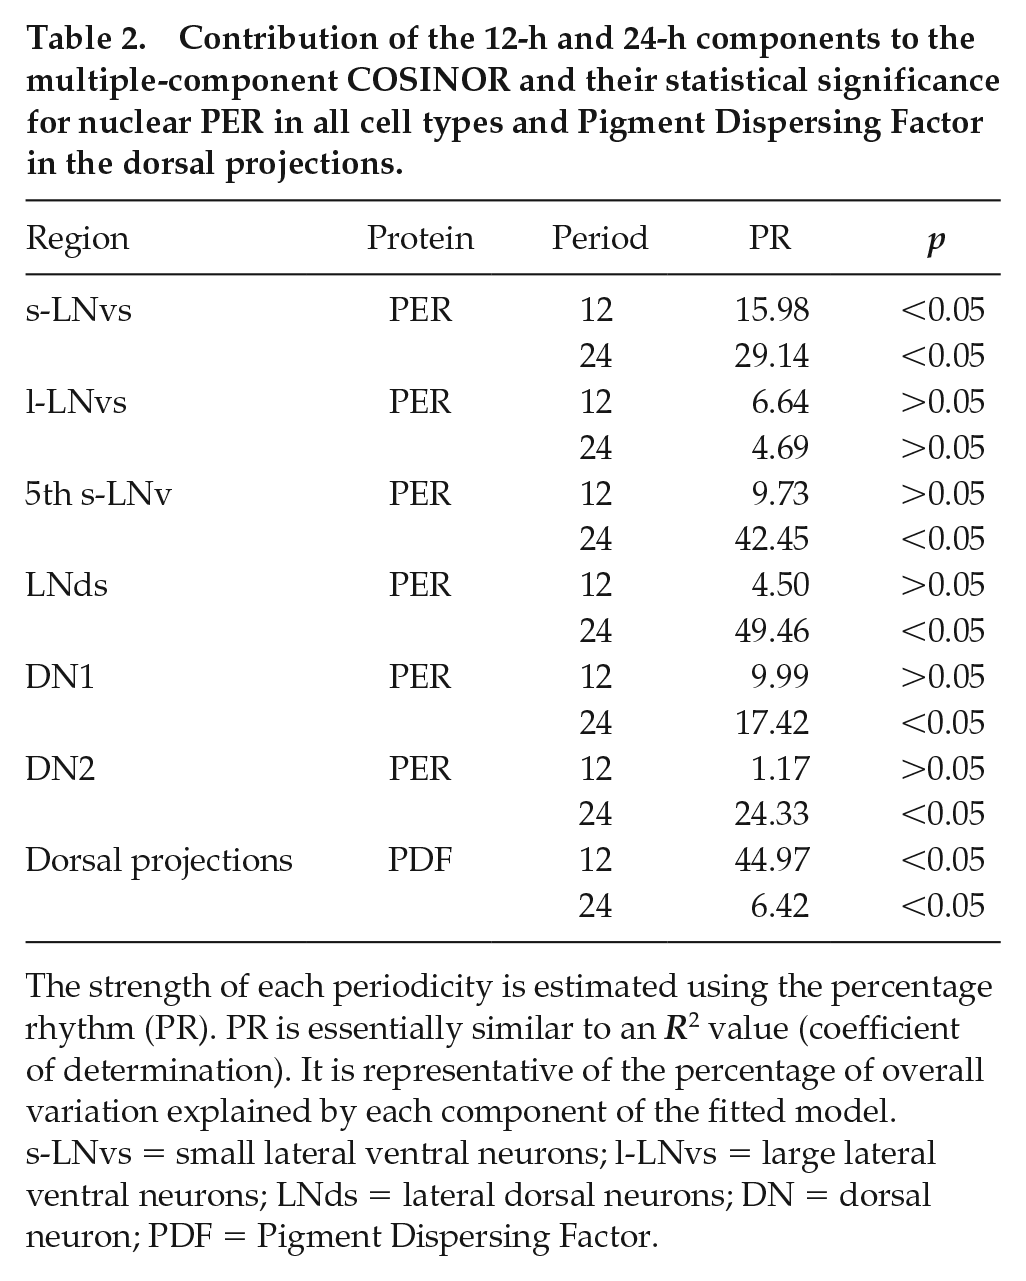
The strength of each periodicity is estimated using the percentage rhythm (PR). PR is essentially similar to an R2 value (coefficient of determination). It is representative of the percentage of overall variation explained by each component of the fitted model. s-LNvs = small lateral ventral neurons; l-LNvs = large lateral ventral neurons; LNds = lateral dorsal neurons; DN = dorsal neuron; PDF = Pigment Dispersing Factor.
In case of the 5th s-LNv, the model explained ~52% of the variation in PER, but most of this was due to a statistically significant effect of the 24-h component (42.45%, p < 0.05; Fig. 4; Table 2). The 12-h component was not significant and explained 9.73% of the variation (Fig. 4; Table 2). The dominant peak of PER occurred at the same phase as that of the other s-LNvs (Fig. 3; Suppl. Fig. S1). In the case of the lateral dorsal neurons (LNds), we found a statistically significant contribution of only the 24-h component, which explained 49.46% of the variation in PER levels (Fig. 4; Table 2). The 12-h component, on the other hand, explained only 4.50% of the variation and was not statistically significant (Fig. 4; Table 2). Furthermore, largely, the phase of PER oscillations in the LNds is in-phase with those in the s-LNvs (Fig. 3; Suppl. Fig. S1).
We also quantified the level of nuclear PER in 2 sets of dorsal neurons (i.e., DN1s and DN2s). In both of these subsets, PER oscillation appeared to be highly damped, relative to PER oscillations in the s-LNvs (Fig. 3; Suppl. Fig. S1). In the case of the DN1s, the 24-h and 12-h components together explained ~27% of the variation in PER levels (Fig. 4). Although the 12-h component was not statistically significant, the 24-h component was marginally statistically significant (p = 0.044) and contributed to 17.42% of the variation in PER (Fig. 4; Table 2). Moreover, the PER oscillation in DN1s was in-phase with that in the s-LNvs (Fig. 3; Suppl. Fig. S1). The DN2s showed similar unimodal oscillation with a statistically significant 24-h component that explained 24.33% of the variation in PER levels. The 12-h component explained only 1.18% of the variation and was not statistically significant (Fig. 4; Table 2). However, the phase of PER oscillation in DN2s appeared to be slightly delayed relative to PER oscillations in other neuronal clusters, such that the peak occurred during the odd photophase and not the transition (Fig. 3; Suppl. Fig. S1).
PDF Oscillation in the Dorsal Projections Shows Bifurcation under LDLD 5:7:5:7
Owing to the fact that PDF is a core neuropeptide thought to have a role in regulating network synchrony and in mediating rhythmic output (Helfrich-Förster, 2017), we quantified its levels in the dorsal projections from the LNvs. Our analysis revealed that a total of ~51% of variation in PDF levels in the dorsal projection can together be explained by the 24-h and 12-h components. The 12-h component was statistically significant and explained ~45% of this variation (Fig. 4; Table 2). Although the 24-h component was also statistically significant, it was not the dominant component in the model and explained only 6.42% of the total variation in PDF levels (Fig. 4; Table 2). Therefore, we concluded that PDF in the dorsal projections showed “bifurcation” instead of frequency demultiplication (Fig. 5a, b). There were 2 peaks of PDF levels, 1 in each photophase, of comparable height that appeared to coincide with the 2 major bouts of activity under the LDLD regime. Thus, we found that while the core clock in the circadian pacemaker circuit appears entrained with a significant 24-h period, the output molecule (i.e., PDF) seems to be bifurcated, implying a breakdown of synchrony between the core clock and the PDF oscillation.
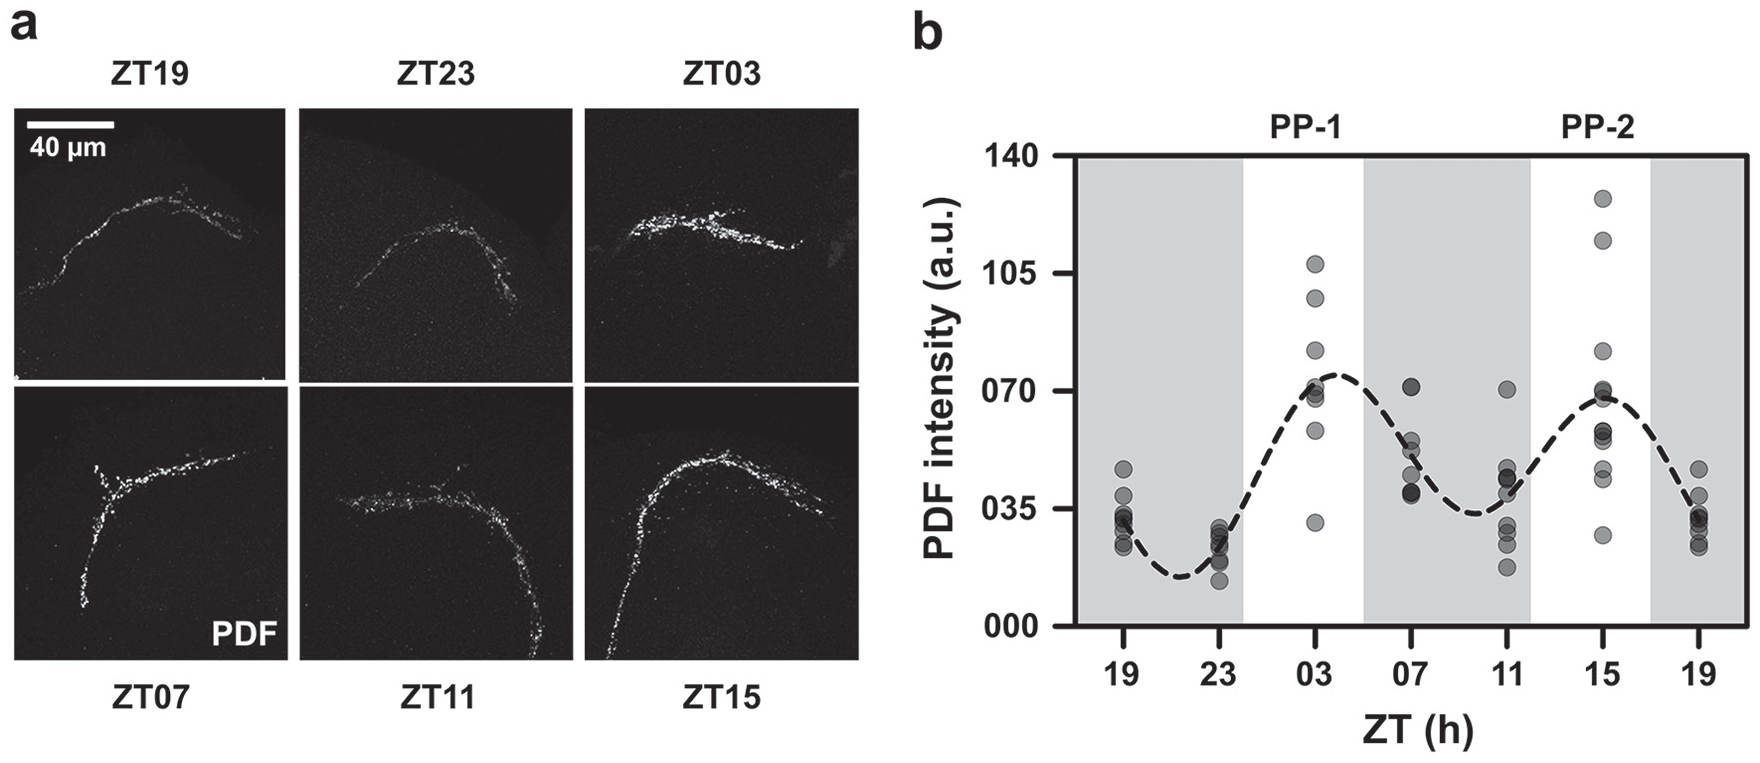
(a) Representative images showing parts of the dorsal projection for each time point (see Suppl. Fig. S2 for an estimate of location on the dorsal projection from where Pigment Dispersing Factor [PDF] was quantified). (b) Scatter plot of PDF intensity in the dorsal projections. Each dot represents the mean PDF value averaged over hemispheres of 1 brain. The dots are set at reduced opacity; therefore, darker shades of dots imply multiple values overlapping. The dashed line is the best-fit COSINE curve from the parameters that were extracted from the multiple-component COSINOR analysis. PP-1 and PP-2 refer to photophases 1 and 2, respectively.
Early and Late Chronotypes Show Higher Amplitude and Phase Plasticity, Respectively
First, we found that both early and late chronotypes showed frequency demultiplication like that of control stocks under both 70 and 0.1 lux light intensities during the photophase of the LDLD regime (Fig. 6a, top and middle; Fig. 6b). Although significant, power of the periodogram at 12 h was significantly lower than the power at 24 h, confirming the notion that these flies treated 2 T-cycles as 1 day (Fig. 6b; Table 1; for early chronotypes: high light intensity, paired t3 = −72.80, p < 0.05, and low light intensity, t3 = −17.12, p < 0.05; for late chronotypes: high light intensity, paired t3 = −45.70, p < 0.05, and low light intensity, t3 = −12.42, p < 0.05).
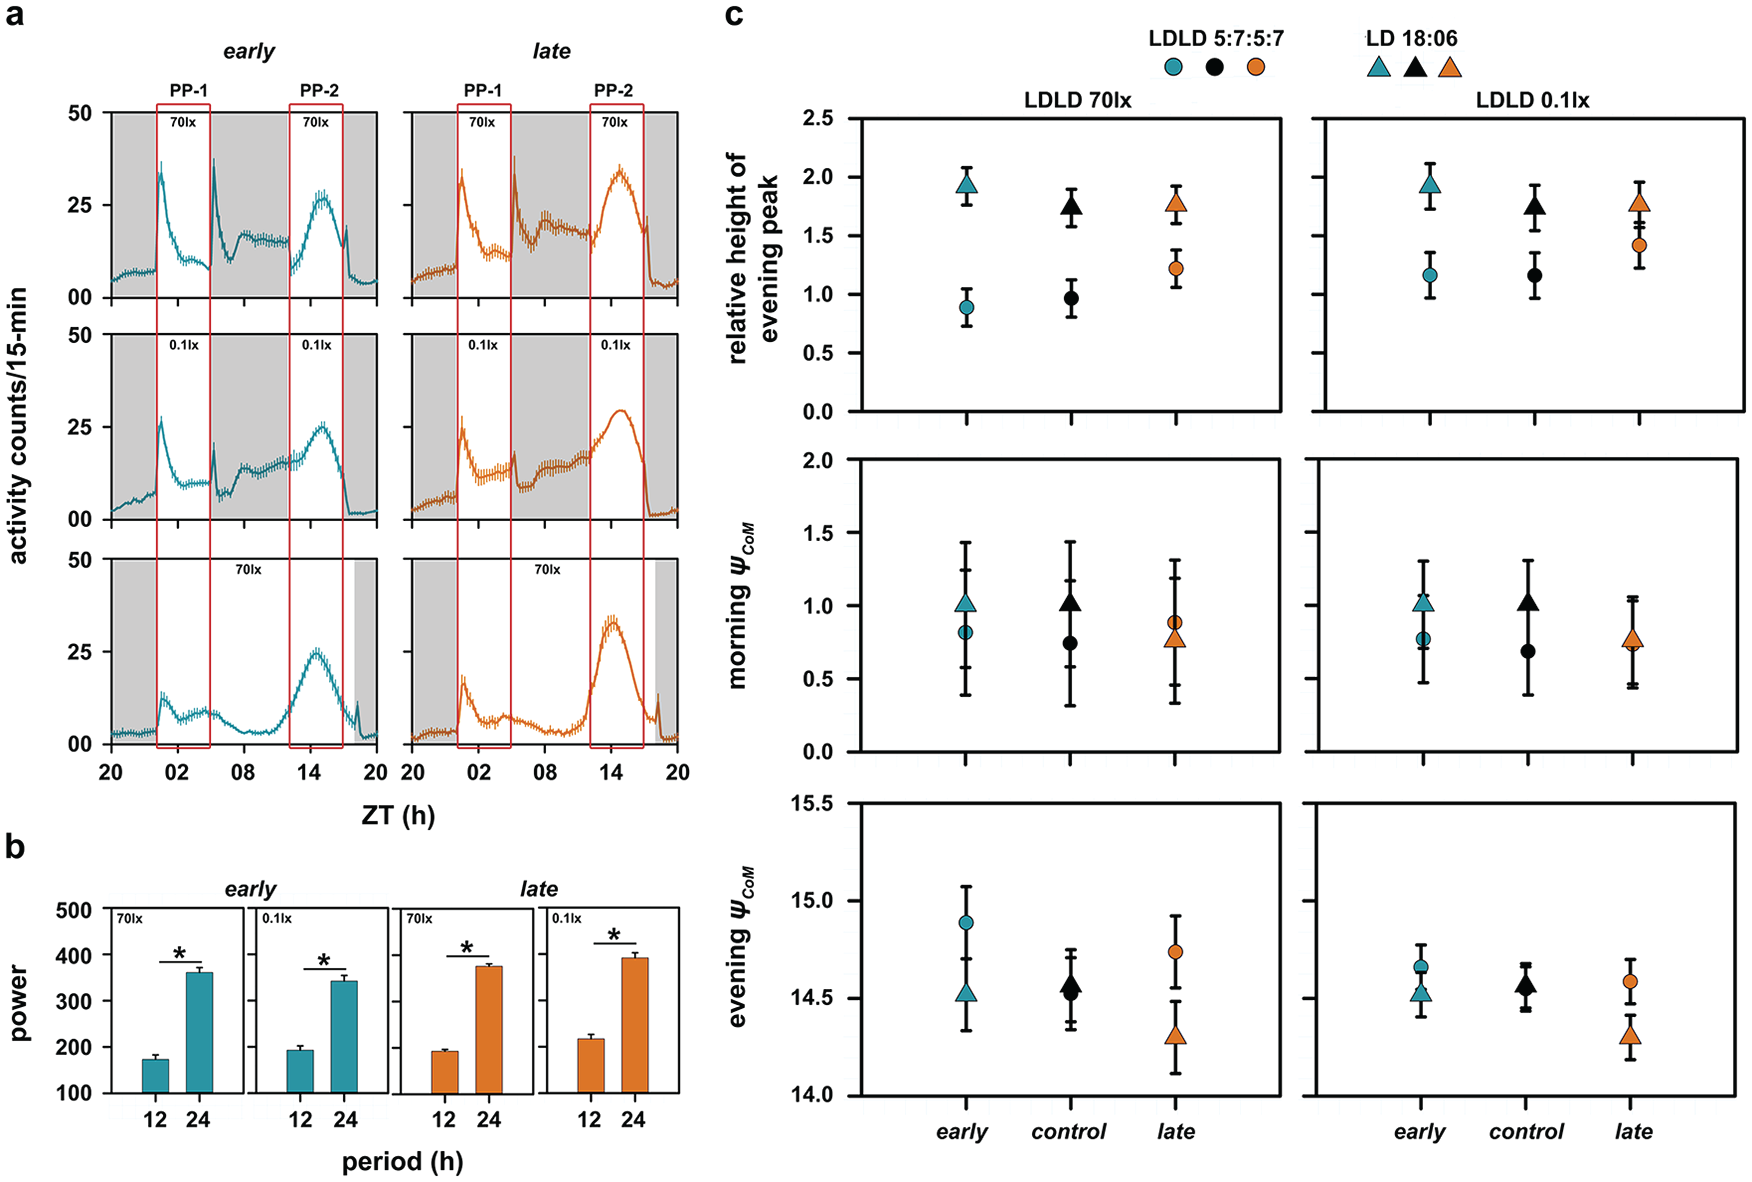
(a) The average activity profiles of early (left) and late (right) populations are shown for LDLD with 70 lux during the photophase (top), 0.1 lux during the photophase (middle), and under LD 18:06 (bottom). Gray-shaded regions indicate the scotophase. The rectangular box spanning the left and right side of panel (a) depicts the morning and evening windows as described in Figure 1. The error bars represent the standard error of the mean (SEM). PP-1 and PP-2 refer to photophases 1 and 2, respectively, for the top and middle figures. (b) Shown also are power values extracted from the χ2 periodogram at period values of 12 and 24-h for early and late populations under LDLD with both light intensities. The error bars represent SEM and asterisks indicate a statistically significant difference. (c) Relative height of the evening peak of activity under 70 lux during the photophase compared with its value under a long photoperiod for early, control, and late populations (top left) and the same under 0.1 lux light intensity during the photophase of LDLD (top right). Also shown are ψCoM of morning (middle left and middle right) and evening activity (bottom left and bottom right) under both light intensities for all 3 populations. All of the error bars in panel (c) are 95% confidence intervals estimated using the Tukey’s honestly significant difference test to facilitate visual hypothesis testing. All means with nonoverlapping error bars are statistically significantly different from each other. The LD 18:06 data in both the left and right sides of panel (c) are the same data that have been replotted to facilitate appropriate statistical comparisons.
Subsequently, we analyzed the RHEP in our stocks under the LDLD regime and long-day condition. The ANOVA revealed a significant effect of selection × regime interaction on RHEP under high light intensity during the LDLD regime (F2,6 = 9.37, p < 0.05). While the RHEP of late chronotypes under LDLD was closer to its value under the long-day regime (Fig. 6c, top left), in the case of the early chronotypes, the evening peak height was either comparable with the morning peak height or lower (RHEP value close to 1; Fig. 6c, top left). Although there was no statistically significant effect of the selection × regime interaction on the RHEP under low light intensity (F2,6 = 4.52, p > 0.05), there was a clear trend showing that the RHEP of late stocks under LDLD was closer to its value under long days (Fig. 6c, top right).
We then analyzed the ψCoM of the morning activity in our populations and found that all 3 stocks had similar ψCoM under both high (F2,6 = 0.93, p > 0.05) and low (F2,6 = 1.03, p > 0.05) light intensity LDLD (Fig. 6c, middle). However, the ANOVA revealed that there was a significant effect of the selection × regime interaction on ψCoM of the evening activity under both light intensities (high light intensity: F2,6 = 7.80, p < 0.05; low light intensity: F2,6 = 7.00, p < 0.05). We found that the early chronotypes and control stocks had the same ψCoM under LDLD and long-day conditions (Fig. 6c, bottom). Importantly, the late chronotypes in both high and low light intensity LDLD showed a delayed ψCoM relative to its value under LD 18:06 (Fig. 6c, bottom). These results imply that late chronotypes show reduced amplitude plasticity and increased phase lability across the 2 environmental regimes tested.
Discussion
Although Drosophila has been a very useful model to understand the design principles of circadian behavior, their neuronal circuits, and molecular regulation (Helfrich-Förster, 2017), there have not been many studies that have systematically analyzed the extent of waveform plasticity under varying environmental conditions. Therefore, we undertook, to the best of our knowledge, the first set of experiments to understand the behaviour and the underlying neuronal basis of entrainment to T-cycles as short as 12-h.
Our control flies showed frequency demultiplication, very similar to what was seen in mice under an LDLD regime when the scotophase was in complete darkness (Fig. 1a; Harrison et al., 2016). This implied that the behavior is similar to how flies behave under long photoperiod conditions. Therefore, we analyzed and found that although similar, there were significant differences between the behavior under LDLD and long-day LD. In an earlier study (Stoleru et al., 2007), the authors discussed that the relative dominance of the morning and evening oscillators depends on the light regime, such that the evening oscillators are dominant under long days. Under long-day conditions in which the photoperiod duration was 18-h, we found that the control stocks show an evening peak more than 1.5× higher than the morning peak of activity (Fig. 1c and 1d, top). However, the evening peak of activity became more comparable with the morning peak under LDLD of both high and low light intensity (Fig. 1d, top). We interpret this to be a consequence of the reduction in dominance of the evening oscillator under the provided LDLD condition.
To examine the neuronal circuit underlying this behavior, we quantified PER in different cell types and found that the non–s-LNv neurons showed highly damped PER oscillations (Fig. 3). The peak-to-trough ratio in s-LNvs was 12.49, whereas it was only 2.62, 2.17, and 1.82 in the LNds, DN1s, and DN2s, respectively (Fig. 3), thereby supporting the idea of reduced evening oscillator dominance under LDLD. Furthermore, few earlier studies have implicated that the clock in l-LNvs is important for the regulation of evening activity, especially under long days (Menegazzi et al., 2017; Potdar and Sheeba, 2012; Schlichting et al., 2016). However, given that in our study the l-LNvs have no significant oscillation of PER, and we found no effect of the environmental regime on phase of evening activity, we conclude that similar phasing of behavior can be brought about by distinct remodeling of the neuronal network.
Under long-day conditions, nuclear PER in the s-LNvs is bimodal, with both peaks having comparable heights and a phase difference of ~8-h between the peaks (Shafer et al., 2004). More recently, studies have revealed that PDF in the dorsal projections is also bimodal under long-day conditions with a phase difference of ~9 h (Charlotte Helfrich-Förster, personal communication; 1st August, 2019 to Vasu Sheeba). In our experiment, PDF oscillates with a 12-h phase difference between the 2 peaks, thereby leading us to conclude that bifurcation indeed occurs under LDLD, and this is distinct from mere bimodality. While it is possible that the second PDF peak in our experiment (Figs. 4 and 5b) is driven by the shorter peak of PER oscillation in the s-LNvs, it is also possible that the provided LDLD regime desynchronized the nuclear PER oscillation and PDF oscillation in the dorsal projections, a phenomenon that appears to have occurred in at least 2 previous manipulations (Kula et al., 2006; Prakash et al., 2017). Yet another possibility is that light directly affects properties of the LNvs such that PDF levels increase during the second photophase (similar to hyperexcitability-induced constitutive PDF expression in Nitabach et al., 2006), but in our case, PER oscillations are not acutely affected. However, we must acknowledge here that a previous study has shown that increased neuronal firing reduces the expression of PDF in the soma (Mezan et al., 2016), which may imply that in our experiment, light in the second photophase has an inhibitory effect on the membrane potential, thereby increasing PDF levels. In addition, this desynchrony could also explain the highly damped PER oscillation in the LNds and DNs. Zhang et al. (2010) showed that altered speed of clock in the s-LNvs acutely affects PER oscillations in the DN1s and suggested that perhaps conflicting signals to the DN1 cluster from the s-LNvs and LNds may contribute to the loss of rhythmicity. A recent study by Schlichting et al. (2019) demonstrated a circuit that is involved in the direct communication of light information via l-LNvs through PDF to the evening oscillators and regulates the phasing of evening activity. Given this circuit, we speculate that, in our case, damped oscillation in the LNds can be explained via an apparent decoupling of the molecular clocks in the l-LNvs and PDF in the dorsal projections. In addition, desynchrony between PDF and PER in the s-LNvs and LNds may contribute to damped oscillations in the dorsal set of neurons. Furthermore, since PDF is bimodal in the same way as that of the activity/rest behavior, it suggests that the role of PDF may be more than just synchronizing the phase of molecular oscillations in the neuronal circuit. This suggests that PDF may have a more proximal role in directly regulating output, an idea that has received some evidence previously (Pírez et al., 2013).
Reduced difference in the RHEP between long-day and LDLD in the late chronotypes (Fig. 6c, top) suggests that these flies have retained the evening oscillator’s dominance to a larger extent relative to the early chronotypes. In addition, given the proposed role of evening oscillators in tracking dusk (Pittendrigh and Daan, 1976), the late chronotypes having a delayed phase of evening activity relative to its values under long photoperiod (Fig. 6c, bottom) also indicate a robust evening oscillator in these flies. This, we hypothesize, will be reflected in reduced damping of PER oscillations in the evening cells of the late chronotypes as opposed to the highly damped oscillations that were observed in the control stocks and provides leads for further studies. Therefore, we show that waveform plasticity can be brought about by different direction of changes in phase and amplitude. Previous speculations of the late chronotypes having weak oscillators (Nikhil, Vaze, et al., 2016) and our study demonstrating high plasticity in these stocks, at least with respect to phase, provide evidence partially in favor of the tradeoff hypothesized by Gorman et al. (2017) between rigidity and plasticity, highlighting the complex nature of such relationships.
In summary, we show that activity/rest rhythms of fruit flies display frequency demultiplication under LDLD. This is associated with weakly bimodal oscillation of PER in the morning cells (s-LNvs), highly damped unimodal PER oscillations in a subset of the evening cells (LNds and DNs), and strongly bimodal oscillations of PDF in the dorsal projections, which perhaps directly act on the output, yielding the observed activity pattern. In addition, our experiments reveal that behavior experiments under short T-cycles can be useful to infer inherent differences in the network hierarchy of the circadian neuronal network. Finally, we confirm that waveform plasticity is heritable and can evolve, thereby suggesting an adaptive value for the ability to show such plasticity.
However, certain questions still remain. For instance, how plastic can fly waveforms be? What kind of manipulation of the environmental regime can induce plasticity in flies? Can dim light at night induce bifurcation as it did in rodents? Can temperature zeitgebers also induce bifurcation? Would these shed light on how the network is structured in flies? How is the molecular oscillation in the network affected under such regimes? These are questions that warrant further research, some of which are being pursued currently.
Supplemental Material
Abhilashetal_bifurcation_SOM_revision2_03122019 – Supplemental material for Waveform Plasticity under Entrainment to 12-h T-cycles in Drosophila melanogaster: Behavior, Neuronal Network, and Evolution
Supplemental material, Abhilashetal_bifurcation_SOM_revision2_03122019 for Waveform Plasticity under Entrainment to 12-h T-cycles in Drosophila melanogaster: Behavior, Neuronal Network, and Evolution by Lakshman Abhilash, Aishwarya Ramakrishnan, Srishti Priya and Vasu Sheeba in Journal of Biological Rhythms
Footnotes
Acknowledgements
We are very grateful to the late Professor Vijay Kumar Sharma (V.K.S.) for providing us with the tools that enabled us to carry out this research and for a wonderful work environment that enabled us to undertake this study. We thank Jeffrey Hall for sharing the anti-PER (rabbit) antibody, Sushma Rao for help with immunohistochemistry, Sunil Kumar for help with imaging, and Charlotte Helfrich-Förster, 2 anonymous reviewers, and the editor for carefully reading a previous version of our manuscript and providing valuable feedback. We would also like to acknowledge financial support from Science and Engineering Research Board (SERB), New Delhi, to V.K.S. (EMR/2014/001188), intramural funding from Jawaharlal Nehru Centre for Advanced Scientific Research (JNCASR), DST-INSPIRE fellowship to A.R., and a consumable grant from the Department of Biotechnology, Government of India, to V.S. (BT/INF/22/SP27679/2018).
Conflict of Interest Statement
The authors have no potential conflicts of interest with respect to the research, authorship, and/or publication of this article.
Notes
References
Supplementary Material
Please find the following supplemental material available below.
For Open Access articles published under a Creative Commons License, all supplemental material carries the same license as the article it is associated with.
For non-Open Access articles published, all supplemental material carries a non-exclusive license, and permission requests for re-use of supplemental material or any part of supplemental material shall be sent directly to the copyright owner as specified in the copyright notice associated with the article.