
Abstract
A hallmark of biology is the cyclical nature of organismal physiology driven by networks of biological, including circadian, rhythms. Unsurprisingly, disruptions of the circadian rhythms through sleep curtailment or shift work have been connected through numerous studies to positive associations with obesity, insulin resistance, and diabetes. Quantitative reverse transcriptase polymerase chain reaction (qRT-PCR) measures oscillation in messenger RNA expression, an essential foundation for the study of the physiological circadian regulatory network. Primarily, measured oscillations have involved the use of reference gene normalization. However, the validation and identification of suitable reference genes is a significant challenge across different biological systems. This study focuses on adipose tissue of premenopausal, otherwise healthy, morbidly obese women voluntarily enrolled after being scheduled for laparoscopic sleeve gastrectomy surgery. Acquisition of tissue was accomplished by aspiratory needle biopsies of subcutaneous adipose tissue 1 to 2 weeks prior to surgery and 12 to 13 weeks following surgery and an in-surgery scalpel-assisted excision of mesenteric adipose tissue. Each biopsy was sterile cultured ex vivo and serially collected every 4 h over approximately 36 h. The candidate reference genes that were tested were 18S rRNA, GAPDH, HPRT1, RPII, RPL13α, and YWHAZ. Three analytic tools were used to test suitability, and the candidate reference genes were used to measure oscillation in expression of a known circadian clock element (Dbp). No gene was deemed suitable as an individual reference gene control, which indicated that the optimal reference gene set was the geometrically averaged 3-gene panel composed of YWHAZ, RPL13α, and GAPDH. These methods can be employed to identify optimal reference genes in other systems.
A hallmark of biology is the cyclical nature of organismal physiology, which is driven by networks of biological rhythms. These rhythms are remarkable for their breadth throughout biology as showcased by their observation across the phylogenetic tree from bacteria, fungi, plants, and animals that include fruit flies and mammals (Pittendrigh, 1954; Cui et al., 2013; Kaczmarek et al., 2017; Lam et al., 2018). Evolutionary theory would suggest that organisms must benefit from the ability to align physiological function to external and internal cues across highly variable environments (Ouyang et al., 1998; Panda et al., 2002; Dvornyk et al., 2003; Dodd et al., 2005; Spoelstra et al., 2016). Further supporting the significance, the molecular apparatus that drives biological rhythms in mammals including humans has been shown to directly or indirectly lead to the rhythmic oscillation of up to ≈43% of protein-coding genes (Zhang et al., 2014; Patel et al., 2015).
Further investigation into these oscillations has revealed that (1) the molecular apparatus is a hierarchical set of transcription factors whose expression changes in reciprocal fashion across the 24-h period and has thus been termed the circadian clock and 2) the regulation of individual elements of the molecular apparatus enables fine-tuning of physiological function to meet the multitude of constantly changing conditions and demands (Czeisler et al., 1999). A central circadian clock is located in the suprachiasmatic nucleus (SCN), which is primarily entrained by light cues across the 24-h period. These cues are received by specialized retinal cells (Berson et al., 2002; Radziuk, 2013). Yet, peripheral tissues also have intrinsic molecular machinery that has collectively been denoted as peripheral clocks. Entrainment of the peripheral clocks occurs both top-down from the central clock via neuronal regulation and laterally by more localized cues such as endocrine hormones and nutrients across the day and night. Communally, internal and external stimuli that have been shown to have a significant ability to alter biological rhythms have been termed zeitgebers. In the context of physiology, special awareness has been paid to disruptions in sleep duration, light/dark cycles, and meal timing (Knutson et al., 2007; Van Cauter et al., 2008; Hatori et al., 2012; Garaulet et al., 2013; Longo and Panda, 2016).
Studies have been conducted investigating the extent and conditions under which zeitgebers exert influence on circadian clock function in physiology and what changes occur in pathophysiological disorders. The latter aspect has been bolstered by the increasingly clear connections between misalignment of biological rhythms and development of high-impact human diseases. For example, societal pressures such as sleep curtailment or shift work, in which sleep and eating occur at misaligned circadian times of day, have been associated with the development of obesity, insulin resistance, and type 2 diabetes mellitus (Bass and Takahashi, 2010; Arble et al., 2015). Further, genetic alternations observed in C57BL/6J mice have shown similar phenotypes through 2 integral circadian clock genes: (1) an adipocyte-specific Bmal1 knockout was shown to induce increased adiposity and disordered eating while ultimately affecting systemic appetite control, and (2) homozygous Clock mutant mice displayed hyperphagia, developed obesity, and developed metabolic syndrome characteristics as compared with wild-type mice (Turek et al., 2005; Paschos et al., 2012). Adipose tissue, in particular, is integral to the onset of pathophysiology through 2 closely related roles: (1) modulation of systemic energy balance and (2) indirect modulation of the systemic inflammatory state. Adipokine and cytokine production from adipose tissue plays a major role in feeding behavior (e.g., leptin), insulin sensitivity (e.g., adiponectin, resistin, and tumor necrosis factor alpha), and energy balance during fasting through lipolysis (Kershaw and Flier, 2004; Ouchi et al., 2011; McGown et al., 2014; Ryden et al., 2014). Lastly, adipose tissue insulin sensitivity plays an indirect role in systemic inflammation via free fatty acid–mediated lipotoxicity (Grill and Zhou, 1995; Shulman, 2000; Drosatos and Schulze, 2013). Predictably, the peripheral clock in adipose tissue from humans has been reported to exhibit robust patterns of circadian gene expression; also, these endogenous circadian rhythms persist following removal and short-term culture in vitro (Fain et al., 2003; Phillips et al., 2008; Rogers et al., 2008; Gómez-Santos et al., 2009; Garaulet et al., 2011; Gómez-Abellán et al., 2012; Aubin et al., 2015; Wang et al., 2015). Thus, circadian patterns of gene expression in adipose tissue are highly relevant in physiological and pathophysiological states.
A large portion of the molecular basis of central and peripheral circadian rhythms has been examined via quantitative reverse transcriptase polymerase chain reaction (qRT-PCR). Since its introduction roughly 30 years ago, qRT-PCR remains the gold standard method of measuring individual mRNA species. In this period, reproducibility and comparability of qRT-PCR experiments has been bolstered by establishment of the Minimum Information for Publication of Quantitative Real-Time PCR Experiments (MIQE) guidelines (Bustin et al., 2009). The raw quantification cycle (Cq) of a qRT-PCR run remains reflective of linear modeling of background-corrected fluorescent units, which informs the relative amount of the target sequence in the reaction well (Tichopad et al., 2003). To make the amount comparable, it must be adjusted to a corrected cycle called ΔCq, which is gene expression on a logarithmic scale. This adjustment step is called normalization and is most commonly performed using a reference gene. Although a straightforward correction of the data, normalization has remained a difficult experimental condition to solve. The reference gene is operationally defined as having consistent expression relative to total cDNA concentration, and the adjustment is simply conducted as a linear subtraction of the reference gene raw Cq (Vandesompele et al., 2002; Tichopad et al., 2003). However, the difficulty has been that potential reference genes deviate significantly from the operational definition across experimental conditions, especially those generated by patterns of oscillating gene expression. The consequence of the deviation is that the adjustment step may either accentuate, or attenuate, circadian gene expression differences across a 24-h period, thus skewing the actual results.
There is growing understanding of the need for a library of genes that under precise experimental conditions have been determined to be adequately consistent as a single normalization reference (Bustin et al., 2013). In addition, for more heterogeneous data sets, reports are needed for sets of reference genes that can create a composite reference that more closely resembles invariant gene expression. The primary goal of this study was to characterize the consistency of candidate reference genes for repeated measurements of circadian clock–related gene expression across a 36-h period with primary human subcutaneous adipose tissue obtained by needle biopsy or surgical excision and maintained by sterile culture (Carswell et al., 2012). The outcome of the study was the optimal set of candidate reference genes to best fulfill invariant gene expression for these samples. The methods described that were used to identify candidate reference genes and to minimize variability across samples have broad applicability to other studies by (1) describing the framework by which the suitability of reference genes can be determined and (2) for experimental design, by addressing the potential significance of time of day on reference gene variation.
Materials and Methods
Subject Characteristics
Four premenopausal morbidly obese women were voluntarily enrolled in the clinical research study (University of Chicago Institutional Review Board 09-337-B) following approval and scheduling for laparoscopic sleeve gastrectomy surgery. A summary of subject characteristics is reported in Supplementary Table S1. Subjects did not exhibit irregular lifestyles or irregular menstrual cycles, and they did not have diabetes managed with medication (HbA1c: 5.6 ± 0.6). No malignant diseases were identified by complete blood count, nor was pregnancy detected via urine. In addition, patients were monitored by a registered polysomnographic technologist to ensure the absence of sleep-related disorders. The 1 subject with obstructive sleep apnea met inclusion criteria with documented compliance using a continuous positive airway pressure machine.
Laboratory Sessions
In-laboratory sessions were conducted 1 to 2 weeks prior to the scheduled surgery date and 12 to 13 weeks after the surgery date. Each session lasted 2 evenings and 1 day, during which light exposure and meal timing were tightly controlled. To limit evening light exposure, ambient room light was reduced 3 h before scheduled bedtimes. Four mini meals were administered per day at 1000 h, 1300 h, 1600 h, and 1900 h. In the morning of the second day, an aspiratory subcutaneous periumbilical fat biopsy was performed, conducted as previously described (Broussard et al., 2012) The postsurgery session was identical to the presurgery session. The in-surgery biopsy yielded mesenteric adipose tissue collected via scalpel-assisted excision, which occurred after the patient had been placed under general anesthesia but prior to the start of the laparoscopic vertical sleeve gastrectomy procedure.
Biopsy Processing
The processing of the tissue was a modification of the Fried protocol (Carswell et al., 2012). A laminar flow hood was used to wash tissue with sterile M199 media (Gibco Cat. No. 12350-039, +1% low endotoxin bovine serum albumin [BSA], +200 nM N6-R-phenylisopropyladenosine) and mince it into approximately 5-mg segments. These steps removed blood clots and balanced cellular hypoxia while maintaining tissue architecture that facilitated conventional paracrine signaling. Following initial processing, the tissue was washed once in BSA-free media and rested for 4 h in a cell incubator (37 °C, 5% CO2) in 10 volumes of sterile culture media (Gibco Cat. No. 12350-059, +1 nM insulin, +40 nM dexamethasone). Then, 100 µL of packed tissue (±5%) was aliquoted and measured volumetrically from a 40-µm cell strainer (CellTreat Cat. No. 229481) into 1 mL of culture media (1:10 by volume) per well into a 24-well tissue culture plate (Falcon Cat. No. 353047). The first collection was approximately 12 h following the biopsy in an effort to allow for the majority of cytokine secretion and acute inflammation to abate. Subsequently, a well of tissue was collected periodically (2000, 2400, 0800, 1200, 1600, 2000, 2400, 0800 h), weighed, and snap frozen in liquid nitrogen before storage at −80 °C. Similar protocols have shown that human adipose tissue circadian clock gene and clock-controlled gene rhythms can be maintained without direct SCN signal (Fain et al., 2003; Phillips et al., 2008; Rogers et al., 2008; Gómez-Santos et al., 2009; Garaulet et al., 2011; Gómez-Abellán et al., 2012; Aubin et al., 2015; Wang et al., 2015). Yet, to preserve the SCN-mediated imprint of endogenous entrainment of the peripheral circadian clock, the tissue was not serum shocked.
Sample Preparation
Tissue was homogenized by two 10-sec pulses using a dispersion-based homogenizer (VWR VDI 12). RNA was isolated from the tissue homogenate using a cold phenol-chloroform-isoamyl-alcohol liquid-liquid separation followed by acid guanidinium-ethanol mini-column isolation and final elution with 1 µM sodium citrate (Omega Cat. No. R68300). RNA purity was verified and concentration determined by Nanodrop ultraviolet spectroscopy. For the reverse transcription step of cDNA synthesis, a 500-ng sample of RNA per 20 µL was converted using Quanta Qscript Master Mix (Cat. No. 95048) chemistry in a standard thermocycler (Applied Biosystems GeneAmp PCR System 9700). RNA integrity was conducted using a 5′-3′ primer assay on the reference gene, YWHAZ; all samples were assessed to have high integrity (1.00 ± 0.72).
Primer Validation
Efficiency and dynamic range were collected via the gold standard method of a dilution curve. Maximal cDNA template concentration was a 10-fold dilution from the completed cDNA synthesis thermocycler reaction volume; successive serial dilutions were 8-fold. The slope of the line (m) was calculated by a trendline from 3 or more consecutive dilutions. Efficiency was calculated using Equation 1 below with m as the slope and d as the dilution:

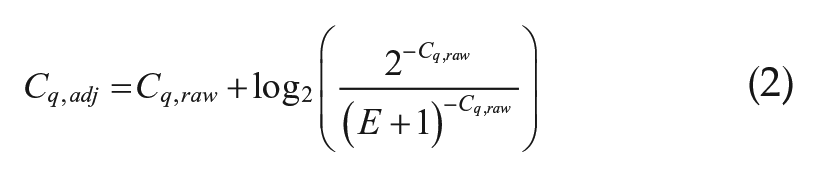
Perfect efficiency was 100%. According to MIQE guidelines, primer efficiency estimated at greater than 0.9 can presumed to be perfect efficiency for ΔΔCq relative quantification. Primer sets with lesser efficiency are suggested to use the Pfaffl correction to adjust raw Cq values to be as if the primer set had optimal efficiency. RPII was the only gene that required a Pfaffl correction (E = 0.89), the formula for which is listed below (equation 2):
Dynamic range was experimentally defined by the template concentrations used to calculate efficiency. Within this concentration range, no extrapolation is needed to confirm high-efficiency amplification. No raw Cq values obtained fell outside the dynamic ranges calculated from the dilution curves.
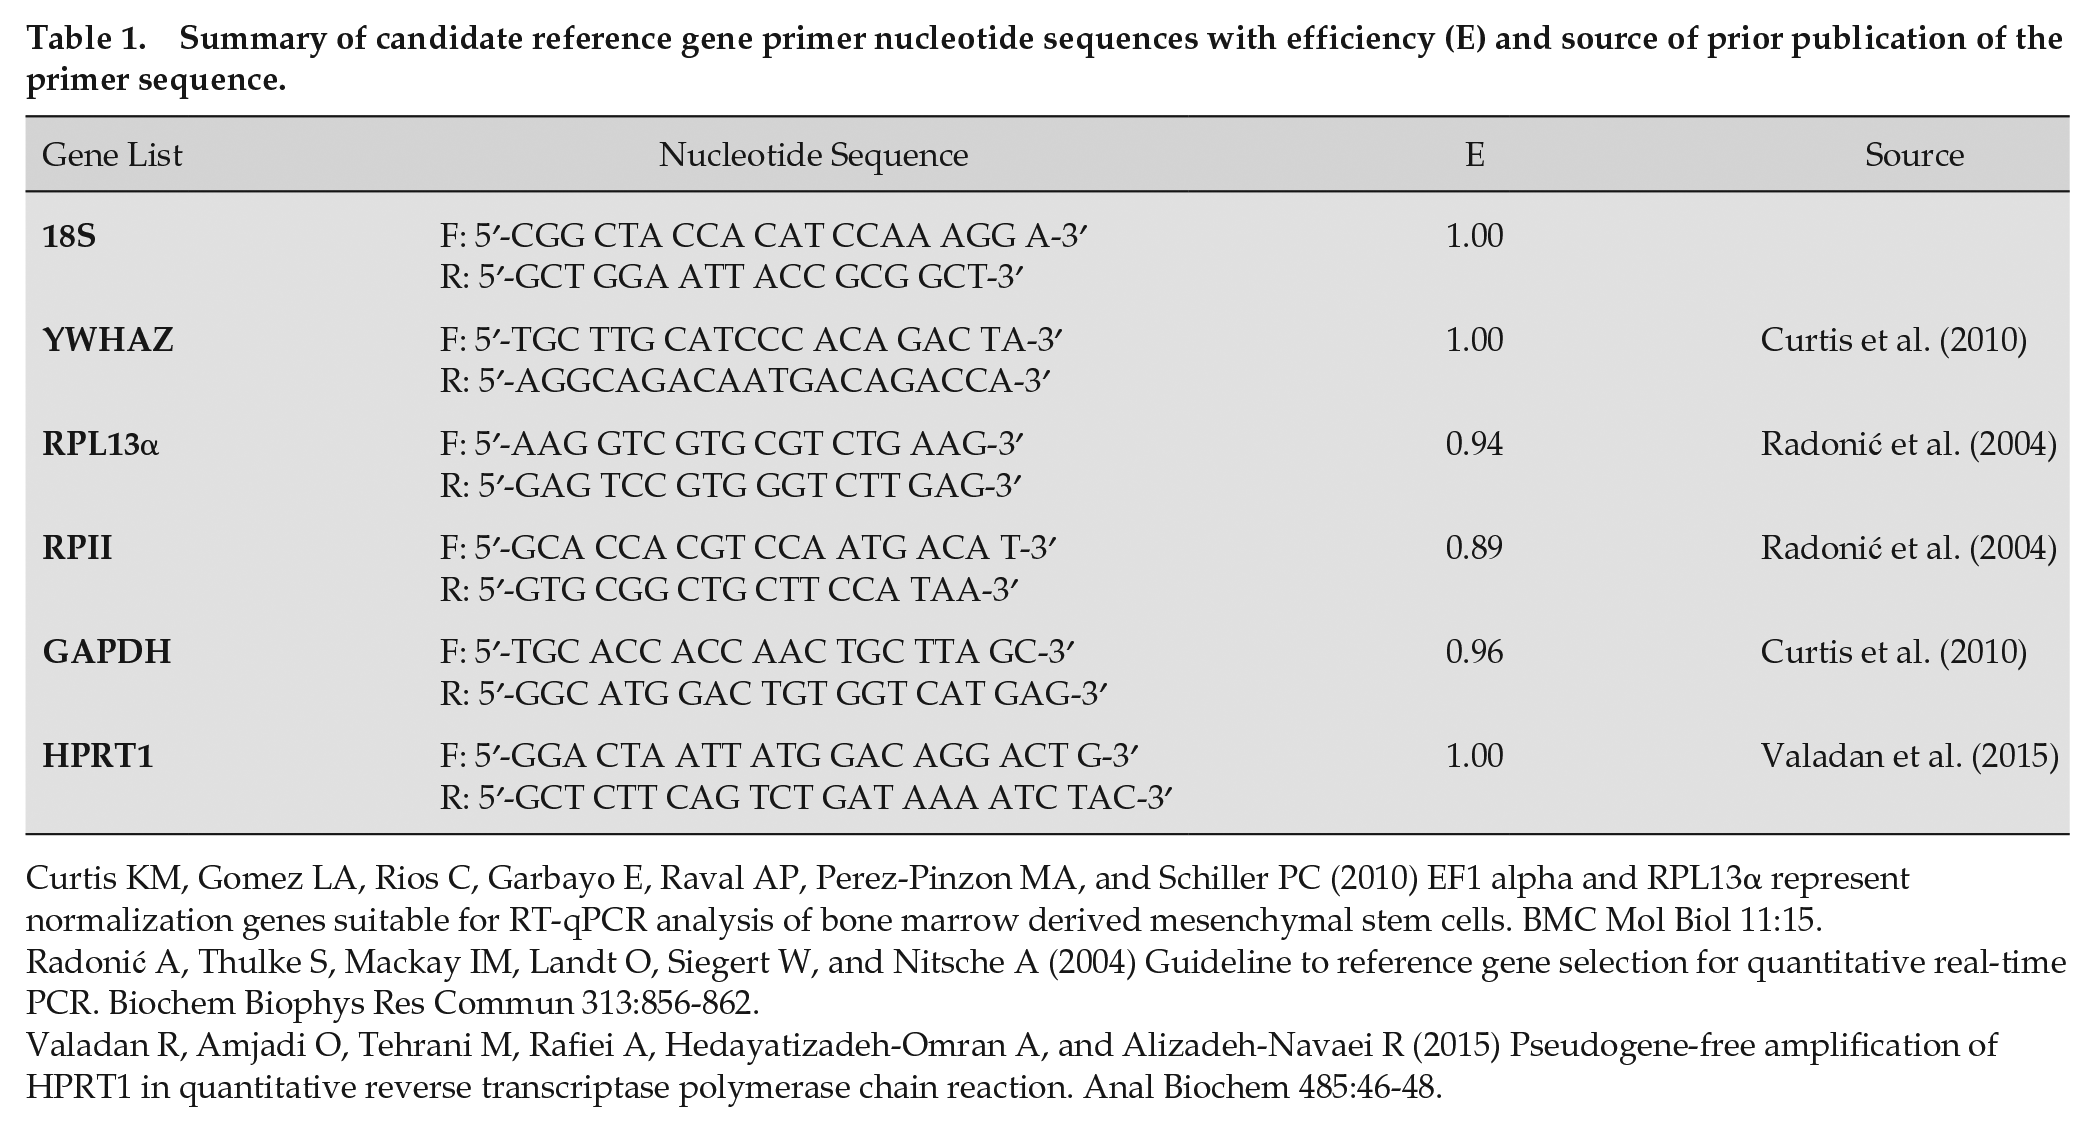
RT-qPCR
The selected screen for effective reference genes was limited to the bolded genes in Figure 1, which illustrated reference gene suitability from previously published experimental manipulations (Fink et al., 2008; Foldager et al., 2009; Curtis et al., 2010; del Pozo et al., 2010; Mehta et al., 2010; Amable et al., 2013; Jacob et al., 2013). The primer sequences are listed in Table 1 (Radonić et al., 2004; Curtis et al., 2010; Valadan et al., 2015). Dbp and Bmal1 primers (Qiagen Cat. No. PPH19697A and PPH06229F) were purchased with a documented guarantee for high efficiency and broad dynamic range but without a precise sequence. To prepare the qRT-PCR experiment, all equipment was thoroughly cleaned with 70% ethanol. Only autoclaved tubes and unopened pipette tip boxes were used. Per well, the total reaction volume was 10 µL, which consisted of 4 µL cDNA template, 5 µL SYBR green master mix (Quantabio Cat. No. 95071), and 0.5 µL of each forward and reverse primers. The template concentration of cDNA was 1:100 relative to the reverse-transcription–reaction-derived cDNA. One plate was used per gene per subject with 3 technical replicates, 3 positive controls to serve as interplate calibration, and 3 no-template negative controls. Loading was completed over ice before plates were sealed (BioRad Cat. No. MSB1001) and centrifuged (1000g, 1 min) to eliminate any bubbles. Running conditions on the CFX Connect Real-time PCR Detection system were 40 cycles, 55 °C annealing temperature. A melt curve was collected for each plate; no contamination or primer dimers were found.
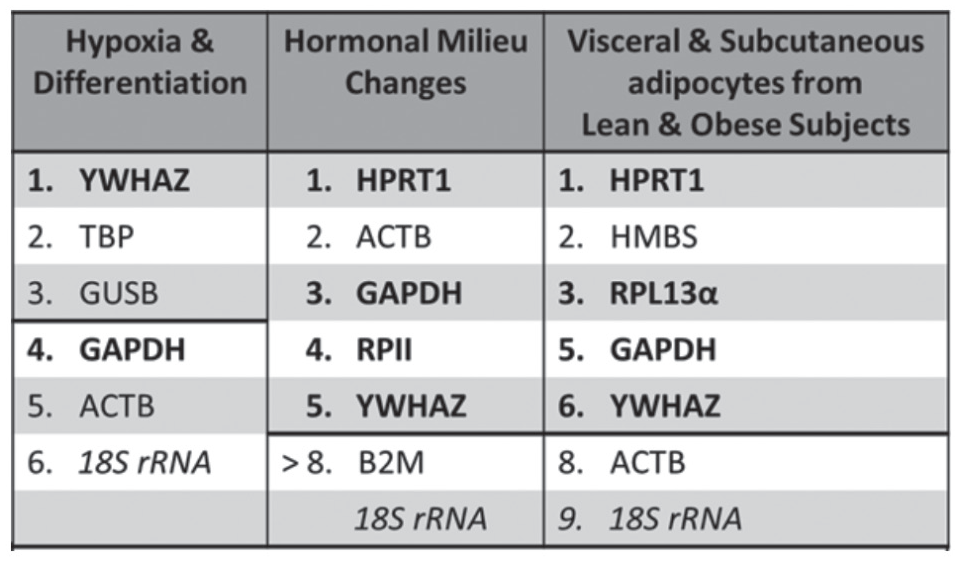
Experimental conditions that informed selection of candidate reference genes. Columns represent the ranked stability of reference genes under each different experimental manipulation from previous studies. The thick black dividing line indicates genes that were considered unsuitable for use as reference genes. Bolded genes indicate the reference genes chosen as candidate reference genes.
Summary of candidate reference gene primer nucleotide sequences with efficiency (E) and source of prior publication of the primer sequence.
Curtis KM, Gomez LA, Rios C, Garbayo E, Raval AP, Perez-Pinzon MA, and Schiller PC (2010) EF1 alpha and RPL13α represent normalization genes suitable for RT-qPCR analysis of bone marrow derived mesenchymal stem cells. BMC Mol Biol 11:15.
Radonić A, Thulke S, Mackay IM, Landt O, Siegert W, and Nitsche A (2004) Guideline to reference gene selection for quantitative real-time PCR. Biochem Biophys Res Commun 313:856-862.
Valadan R, Amjadi O, Tehrani M, Rafiei A, Hedayatizadeh-Omran A, and Alizadeh-Navaei R (2015) Pseudogene-free amplification of HPRT1 in quantitative reverse transcriptase polymerase chain reaction. Anal Biochem 485:46-48.
Results
Clinical Study and Analysis Overview
The novel role of this study was a direct assessment of the circa 24-h stability of candidate reference genes in cultured primary subcutaneous adipose samples collected before, in surgery, and after metabolic surgery from women. These conditions were used to allow for a complex example of adipose tissue health and endocrine regulation on circadian rhythmicity.
This study tested expression stability across 2 biological conditions: time of day and time relation to weight-loss surgery. A biopsy was collected in the morning from each subject up to 2 weeks prior to surgery, at surgery, and 12 weeks after laparoscopic sleeve gastrectomy. Tissue explants were cultured ex vivo under sterile conditions in a time-series experiment. Fewer total subjects were used than in prior experiments by others; however, because of the multiple collections within the time-series protocol, the total samples generated and analyzed were at minimum comparable with prior published experiments (Fink et al., 2008; Foldager et al., 2009; Curtis et al., 2010; del Pozo et al., 2010; Mehta et al., 2010; Amable et al., 2013; Jacob et al., 2013).
The suitability of each reference gene was evaluated using the raw quantification cycle (Cq) for each sample. Under this paradigm, the goal was to identify genes (1) that maintained the most consistent expression relative to total cDNA concentration and (2) whose variation captured target gene variation tangential to the experimental manipulation. Three tools were used to evaluate these study goals. First, the statistical tool called BestKeeper provided thorough simple summary statistics in Microsoft Excel (Pfaffl et al., 2004). Further analysis was also conducted through multiple tools including Normfinder and geNorm. For each, a stability value was returned for each gene that was, under optimal stability, minimized to zero. Normfinder is a plug-in for Microsoft Excel. geNorm is a statistical software module within the qRT-PCR experiment management software, qBase+. For each tool, an analysis was conducted to determine optimal stability of the individual genes and the optimal reference gene set. The data that support the findings of this study are available from the corresponding author upon reasonable request.
Candidate Reference Gene Panel Selection
Candidate reference genes were chosen by a review of relevant previous literature regarding the axes of variation mentioned above. As recommended, all genes studied had standard verification of primer efficiency, specificity, and dynamic range (Bustin et al., 2009). Time relation to weight-loss surgery was simulated by 2 factors: (1) modification of the endocrine hormone milieu and (2) ultrastructural tissue variation during substantial weight loss. These 2 properties were partially addressed by interrogation of mesenchymal stem cells, the precursor cells of preadipocytes and adipocytes. The experimental manipulations tested were differentiation, hypoxia, and overt hormone administration. Genetic heterogeneity and ultrastructural tissue differences were further examined by incorporation of literature that used primary adipose tissue. In these articles, the comparisons were between obese and lean subjects and between visceral and subcutaneous fat (Fink et al., 2008; Foldager et al., 2009; Curtis et al., 2010; del Pozo et al., 2010; Mehta et al., 2010; Amable et al., 2013; Jacob et al., 2013). The genes that showed the greatest consistency under these conditions were YWHAZ, RPL13α, GAPDH, HPRT1, and RPII (Fig. 1). Each of these genes were evaluated in this study. Genes that were excluded by the screen were ACTB, B2M, GUSB, HMBS, and TBP. Despite poor performance in the cited literature, the widespread usage of 18S warrants its inclusion as a candidate reference gene.
BestKeeper
A test of normality was first needed to justify further statistical analysis of collected data. In the current data set, there were approximately 100 data points, which is enough to visualize the sample distribution. To prepare the data, raw Cq values were converted to the relative quantities. Second, the mean and standard error were calculated using the relative quantities. Next, estimated data points were produced from a normal distribution with a mean and standard deviation equivalent to the calculated sample mean and sample standard error. The values of the estimated data points were calculated from the normal distribution at z-scores that reflected the percentile of the rank-ordered data set. The rank-ordered experimental data set was then plotted against the estimated data set in a quantile-quantile plot (Suppl. Fig. S1). If the experimental data set was perfectly normal, this plot would reflect a line with slope of 1. The plots were approximately linear for each of the candidate reference genes, with each gene suggesting a slightly higher dispersion (slope >1) than standard for a normal distribution.
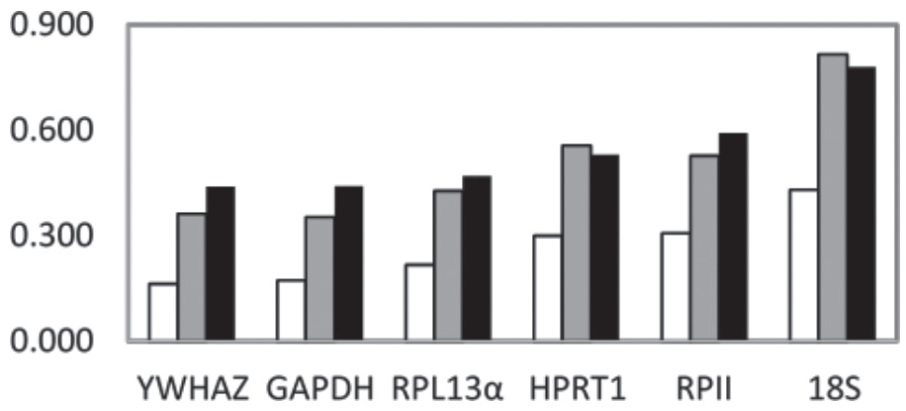
Given acceptable data distributions, general measures of each distribution were calculated using the Microsoft Excel Add-in BestKeeper. Statistics that provided a general idea of the suitability of the candidate reference genes were mean Cq and standard error. Mean raw Cq is probative, or qualitative, evidence of stability. Extremely high or low mean Cq (above/below the range of 20-30) suggested potential for instability in future experiments. Two explanations inform this general property: (1) the technical limitations of a qRT-PCR assay and (2) the dynamic range of each primer set. High Cq, which reflected low transcript copy number, did warrant greater concern for failed wells and randomness-induced Cq variability. Mean Cq values for each gene were calculated arithmetically, geometrically, or logarithmically by relative quantities (Fig. 2). The mean Cq value for 18S was higher than the optimal range (geo µ = 16.77). In addition, RPII and HPRT1 had mean Cq values near the upper boundary (respective geo µ = 29.41; 29.65). The 3 that were in the middle of the range were YWHAZ, RPL13α, and GAPDH. The respective geometric mean Cq for these genes was 25.19, 22.5, and 24.35, respectively. These results suggested that using 3 of the 6 genes (RPII, HPRT1, or 18S) may add experimental difficulty to potential future experiments.
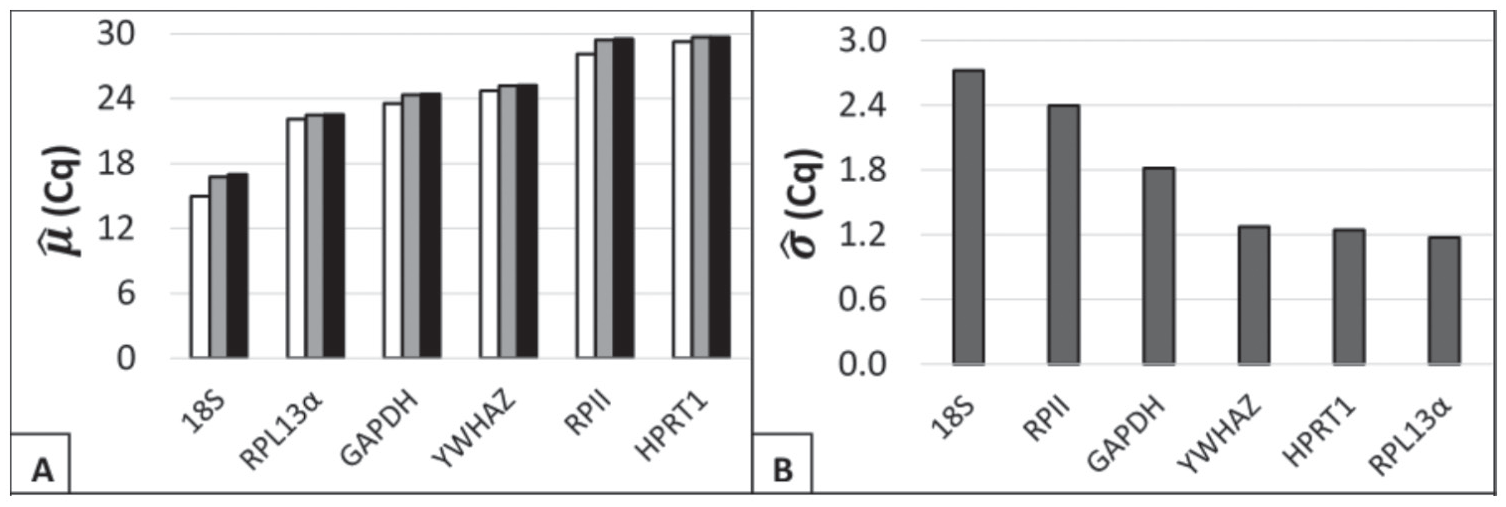
General characteristics of candidate reference gene sample quantification cycle (Cq) distributions. (A) Respective estimates of mean Cq (µ) were calculated for sample Cq values using (white) relative transcript quantities, (gray) geometric averaging, and (black) arithmetic averaging. (B) Respective estimates of standard deviation (σ) were calculated from sample Cq values.
The second statistic used within the software was the standard error of the raw Cq values (Fig. 2). Given the normality of the sample distributions, a minimized standard error strongly suggested superior reference gene stability. The suggested cutoff points for individual reference gene suitability (±Cq) have been recommended to be 0.5 for genetically homogenous data sets and 1.0 for heterogeneous data sets. For 3 genes (18S, RPII, and GAPDH), the respective standard error was markedly elevated (2.37, 1.94, and 1.46) from the recommended standard. F-test comparison of variances indicated that 18S rRNA and RPII had comparable variances (0.22), while GAPDH had different variance from either (1.3e-4 and 8.3e-3, respectively; Suppl. Fig. S2). For the remaining 3 genes tested (YWHAZ, HPRT1, and RPL13α), comparable standard error was found (1.08, 0.96, 1.01). Yet, it is notable that none of the reference genes exhibited a standard error that was clearly below the heterogeneous data set standard.
GeNorm
The module geNorm within the subscription software qBase+ was next used to assess stability by a proprietarily determined variable (M). Under optimal suitability, M is minimized to zero. Similar to the prior analysis, the cutoff for suitable genes was 0.5 for genetically homogenous data sets and 1.0 for heterogeneous data sets. Because the software adjusts for input sample size, this software was used to look at the overall stability of the genes and also the stability of the genes when segregated by biopsy collection. Given that there were 3 biopsies collected with identical collection times, the size of the data sets for the individual biopsy experiments is one-third the size of the cumulative data set.
For each gene, it was clear that 1 to 2 weeks prior to surgery exhibited the highest M and therefore the worst stability (Suppl. Fig. S3). However, 12 to 13 weeks following surgery was more stable for 3 genes (GAPDH, YWHAZ, and RPL13α) and less stable for 3 genes (18S, RPII, and HPRT1) as compared with immediately prior to surgery. As a result of these findings, the cumulative data set closely paralleled the stability value of the biopsy obtained 1 to 2 weeks prior to surgery.
As an overall ranking, 3 genes exhibited comparable stability values (GAPDH, YWHAZ, and RPL13α) at respective M: 1.09, 1.051, and 1.03 (Fig. 3). HPRT1, despite indicating higher stability in the previous analysis, was indicated to have notably lower stability (1.307). RPII and 18S rRNA exhibited M values of 1.60 and 2.11, respectively. As individual reference genes, none of the genes exhibited overall stability values less than 1. Yet, the 3 highest rated genes were, again, only slightly offset from the soft cutoff point.
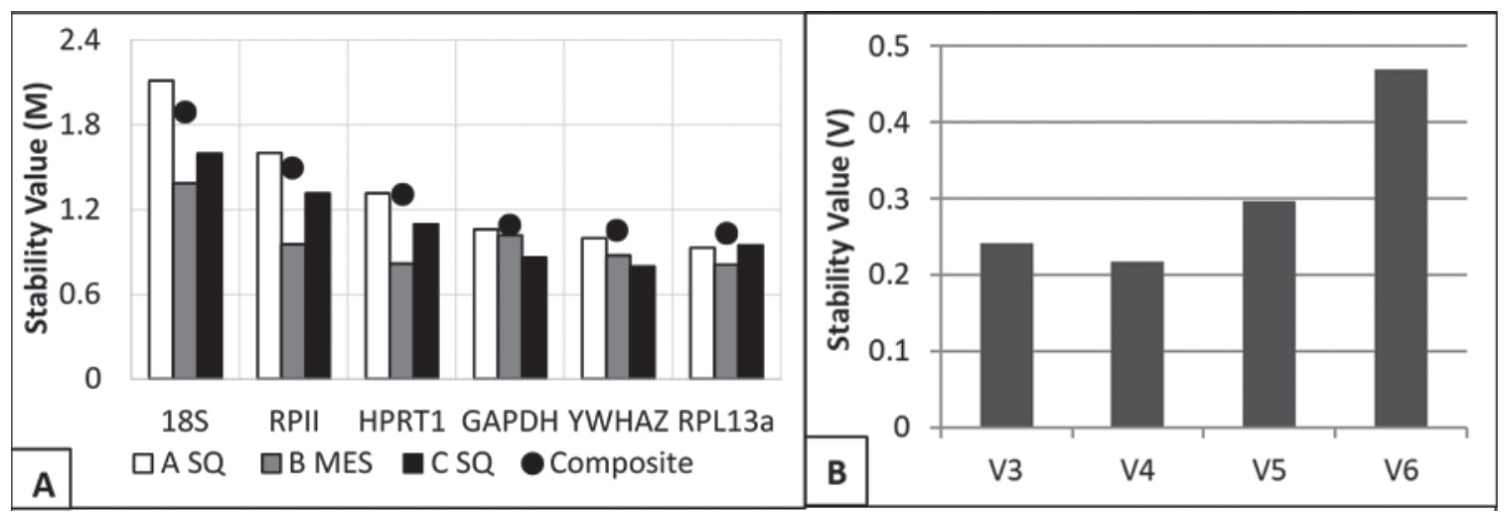
(A) Stability values for each candidate reference gene as obtained by qBase+ software. Smaller values indicated better suitability (suitable for homogenous data <0.5; suitable for heterogeneous data <1.0). The data set was partitioned and analyzed separately by biopsy: (white) subcutaneous adipose tissue, 1 to 2 weeks prior to bariatric surgery (A SQ) (gray) mesenteric adipose tissue, immediately prior to surgery (B MES); (black) subcutaneous adipose tissue, 12 to 13 weeks following surgery (C SQ). The plotted points represent the data analyzed as 1 set. (B) Output from geNorm V panel in qBase+ software. The panel suggests the optimal number of genes to include in the reference gene set. Columns represent the stability value associated with the geometrically averaged top 3 gene Cq values (V3 = YWHAZ, RPL13α, GAPDH) and then the successive stability values that included HPRT1, then RPII, and lastly 18S.
Normfinder
In the Normfinder algorithm, stability values were not independently determined for each candidate gene. Rather, each candidate reference gene was given a stability value estimating the instability that it provided to the ordered set of geometrically averaged relative quantities (2-Cq). As designed, the dependency was to facilitate construction of candidate reference gene sets, which will be discussed later. As a result of the program design, suitability in this program was qualitative and was relative to the other genes in the set. For clarity, reported stability values were calculated including each of the 6 candidate genes (Fig. 4). As the last parameter, the program allowed explicit grouping of samples to explain a portion of the variation. In Figure 4, 3 different sample groupings were used: (1) collection time, (2) biopsy, or (3) both collection time and biopsy.
Stability values as calculated by the Normfinder Excel add-in with explanatory variable grouping. The increased suitability of the respective reference genes was qualitatively indicated by lower stability values. Measurements were grouped to define an explanatory variable for relative quantity variation. Group was defined as (white) collection times, (gray) biopsies, or (black) both biopsies and collection times.
For each of the methods of grouping samples, the genes determined to be the most stable were YWHAZ, GAPDH, and RPL13α. 18S, again, was assessed to be the least stable candidate reference gene irrespective of sample grouping. HPRT1 was ranked to be more stable than RPII under 2 groupings but worse when grouping samples by biopsy. Grouping by collection time did result in lower stability values compared with the other groupings, which suggested that more variation could be explained by collection time.
BestKeeper, Composite
Since no individual reference gene was definitively sufficient to serve as the internal reference, the analysis shifted to identifying the suitable composite reference gene set (Vandesompele et al., 2002). The procedural definition was that, upon geometric averaging of multiple reference gene Cq values, the composite Cq for the derived standard will exhibit minimal standard error across samples. Improved stability has been accomplished through deconstructed stochastic variation resulting from opposing biological regulation, which should be tangential to the experimental manipulation. However, this effect was balanced by retention of more individually unsuitable genes in the reference gene set.
Three statistics were used to conduct the analysis: (1) individual gene standard error, (2) correlation between the genes, and (3) the composite standard error. The process of finding the optimal set was, until the composite standard error increased, to iteratively remove (1) the gene with the highest remaining standard error or (2) given similar standard errors, the gene with the highest correlation to the remaining genes. This iterative progression enabled the most stable genes to be retained and to maximize the deconstructive variation. The 2 worst genes were removed from the model, leading to a marked decrease in the overall variance. The complete model had a total standard error across samples of 1.480. By removing 18S, the standard error decreased to 1.256; the subsequent removal of RPII decreased the standard error to 1.074. Following the 3 individual analyses, it was not clear whether HPRT1 or GAPDH was less suitable.
To gauge the potential consequences of including GAPDH or HPRT1 in the reference gene set, estimates of the Pearson correlation were used to estimate the covariation between the candidate reference genes. Contextually, low covariation suggested that geometric averaging would have an effect of lowering experimental variance in future experiments. In this data set, all remaining genes had a significant positive correlation with the other genes, except for GAPDH and HPRT1 (ρ = 0.166, p = 0.111; Table 2). For HPRT1, while significantly related to both YWHAZ (ρ = 0.266, p = 0.009) and RPL13α (ρ = 0.275, p = 0.007), the correlation is notably less than GAPDH for the same. Therefore, it was expected that inclusion of HPRT1 would improve the future stability of a composite reference set that included YWHAZ, RPL13α, and/or GAPDH.
Experimental estimation of Pearson correlation between candidate reference genes calculated from the respective quantification cycle values from the complete set of samples.
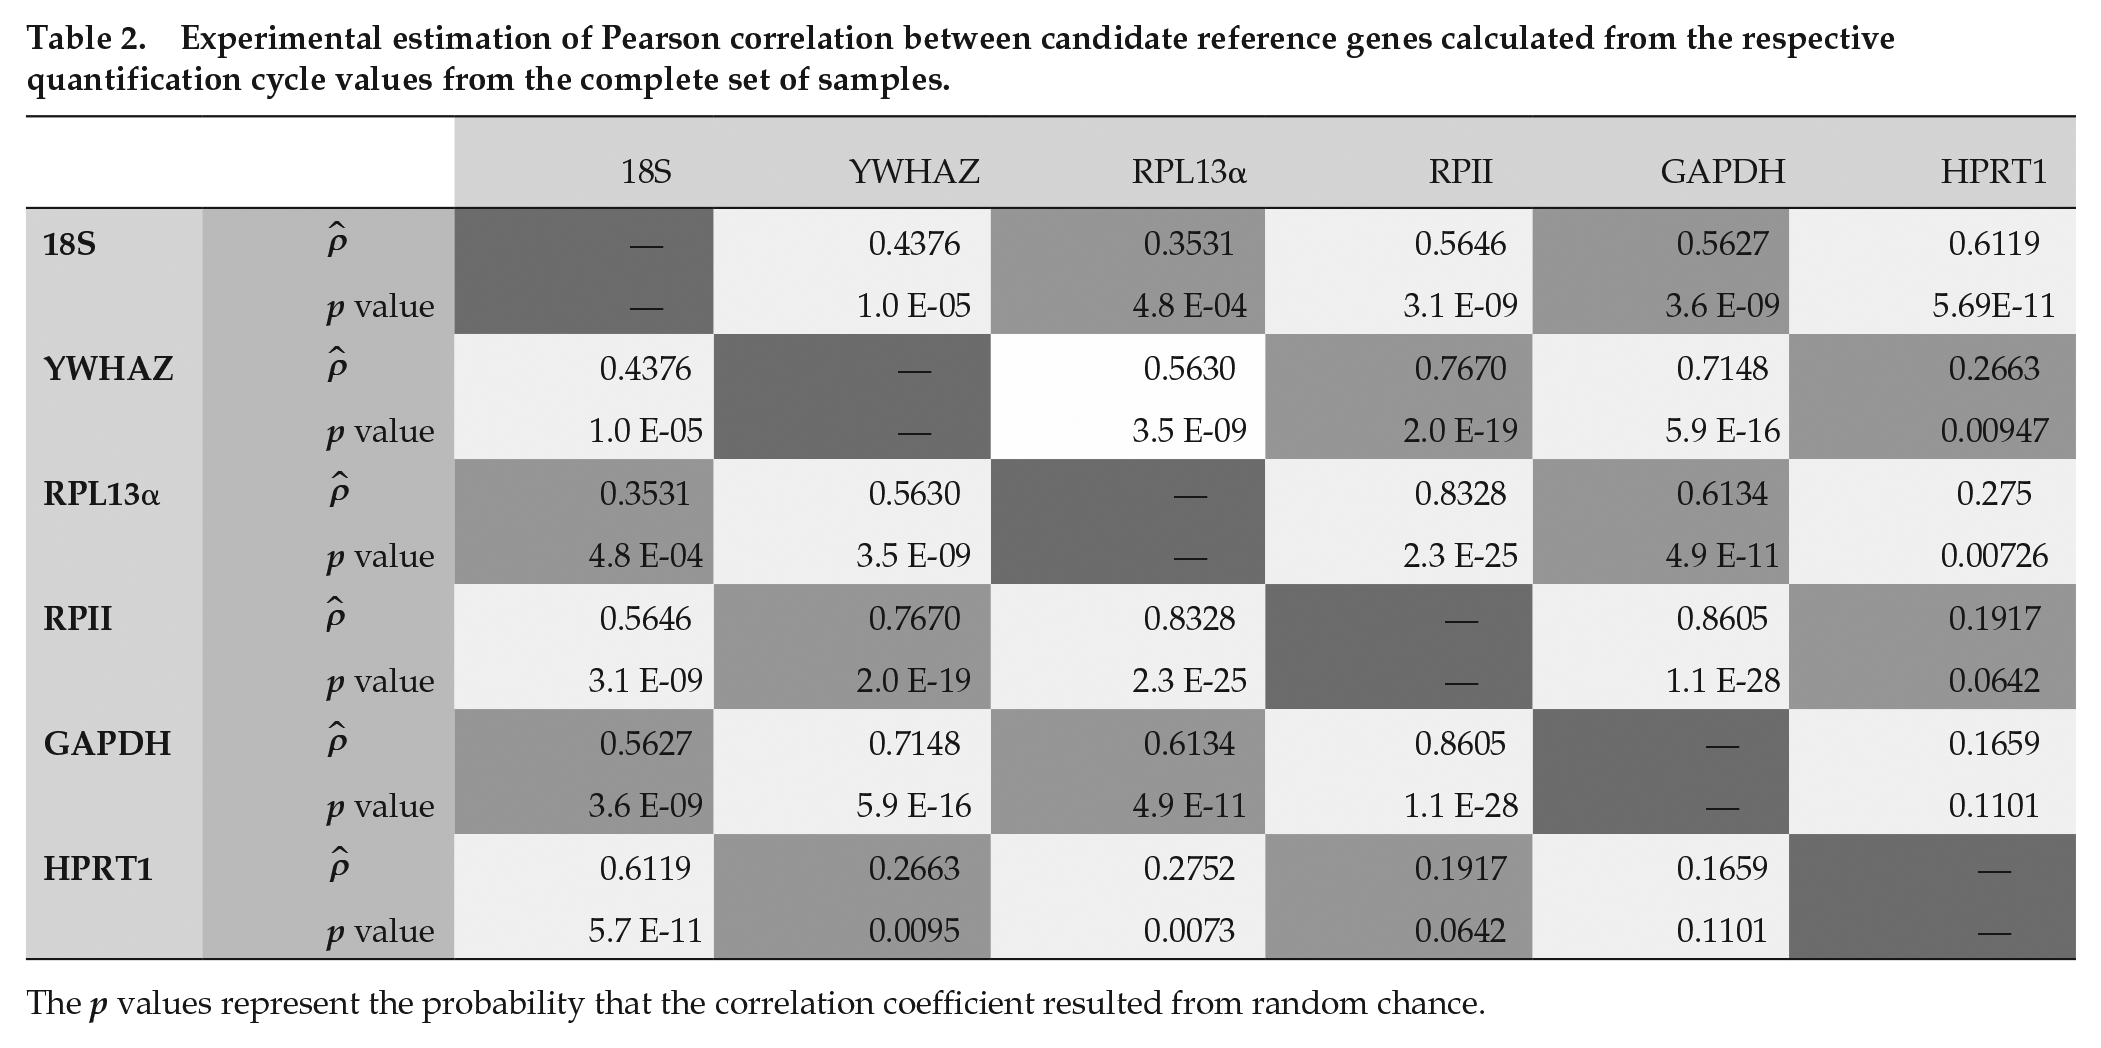
The p values represent the probability that the correlation coefficient resulted from random chance.
To test the prescription, a table was constructed with all permutations of the 4 most suitable genes (Suppl. Fig. S4). When looking at the standard error of the gene sets (2 or 3 total) including these genes, the only sets of genes that were overall more stable included HPRT1. YWHAZ and RPL13α had almost no difference on the effect on overall stability. In addition, because of the higher estimate of the standard deviation and high covariation with YWHAZ and RPL13α, the overall effect of GAPDH was to increase the reference gene set estimates of the standard deviation. The suggestion from this analysis was that HPRT1 inclusion would improve future composite stability.
Normfinder, Composite
RPII and 18S were excluded from this analysis because of 2 variables: (1) previously established poor performance of each in all 3 analyses and (2) dependent calculation of each reference gene stability in the analysis module. Similar to the prior test, a selective exclusion was conducted (Table 3). Yet, since 3 genes are needed for the macro to function, the analysis included only the differential effect of a single gene exclusion. Similar to the preliminary analysis, YWHAZ and RPL13α did not notably change the overall data set. However, the effect of GAPDH and HPRT1 on the stability of the reference gene set was reversed in effect compared with the preliminary analysis. Exclusion of GAPDH led to a reduction in average stability of 10% to 15%, which was commensurate with the effect of excluding YWHAZ and RPL13α. In addition, exclusion of HPRT1 led to a 30% improvement in reference gene stability. These results suggested that the HPRT1 was the least-suited remaining gene for the model. It is notable that this is the opposite recommendation from the BestKeeper analysis.
Single exclusion analysis conducted through the Normfinder add-in.
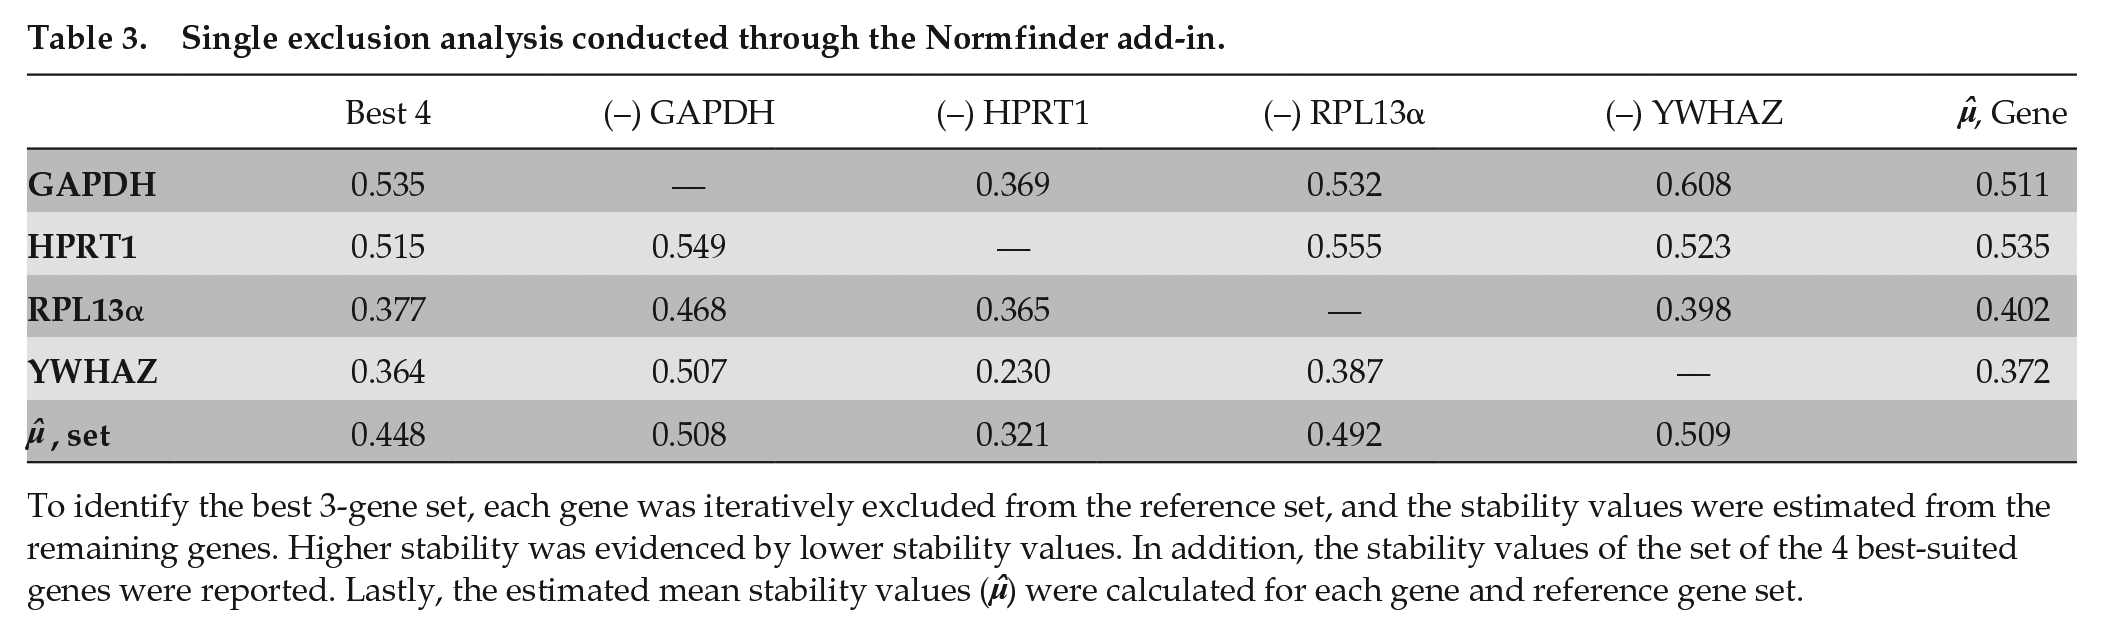
To identify the best 3-gene set, each gene was iteratively excluded from the reference set, and the stability values were estimated from the remaining genes. Higher stability was evidenced by lower stability values. In addition, the stability values of the set of the 4 best-suited genes were reported. Lastly, the estimated mean stability values (
GeNorm V
In addition to stability value estimates, qBase+ contains a panel, geNorm V, that conducted a selective inclusion analysis. Genes with higher calculated M were iteratively included into the reference gene set. Similar to the earlier stability value, the lower the resulting output, the more stable the reference gene set. The goal output for homogeneous data sets is 0.10, and for heterogeneous data sets the output is optimally 0.15. The result of the analysis was to indicate that at least 3 genes ought to be included in the optimal reference set and that there was evidence to support the inclusion of 4 genes (Fig. 3B). The relative improvement from 3 genes to 4 genes was a decrease from 0.24 to 0.21. The addition of RPII and 18S into the gene set decreased the relative stability, which agrees with the other analyses that were conducted.
Circadian Gene Normalization
At the completion of the above analysis, it was concluded that YWHAZ and RPL13α were optimally included in the reference gene set with GAPDH. There is an argument for HPRT1 to be included instead of GAPDH. Yet, this presents increased technical challenges because of the high raw Cq that could overshadow the benefit of greater coverage of stochastic variation due to lower correlation with the other genes in the panel. The disputed suggestion was addressed thusly: (1) illustrating the geometrically averaged relative quantities with 4 different combinations of reference gene sets (Fig. 5), and (2) 1 subject had mRNA expression measured for Dbp, a circadian clock gene, from samples derived from the biopsies prior to and following surgery normalized by the same 4 reference gene sets (Fig. 6). For the latter, reported fold changes are relative to the biopsy from which the samples were derived. Lastly, the relative quantities for each candidate reference gene were plotted across time after calibration with the experimental average Cq for the data collected from the biopsies: (1) 1 to 2 weeks prior to surgery and (2) 12 to 13 weeks after surgery (Suppl. Fig. S5).
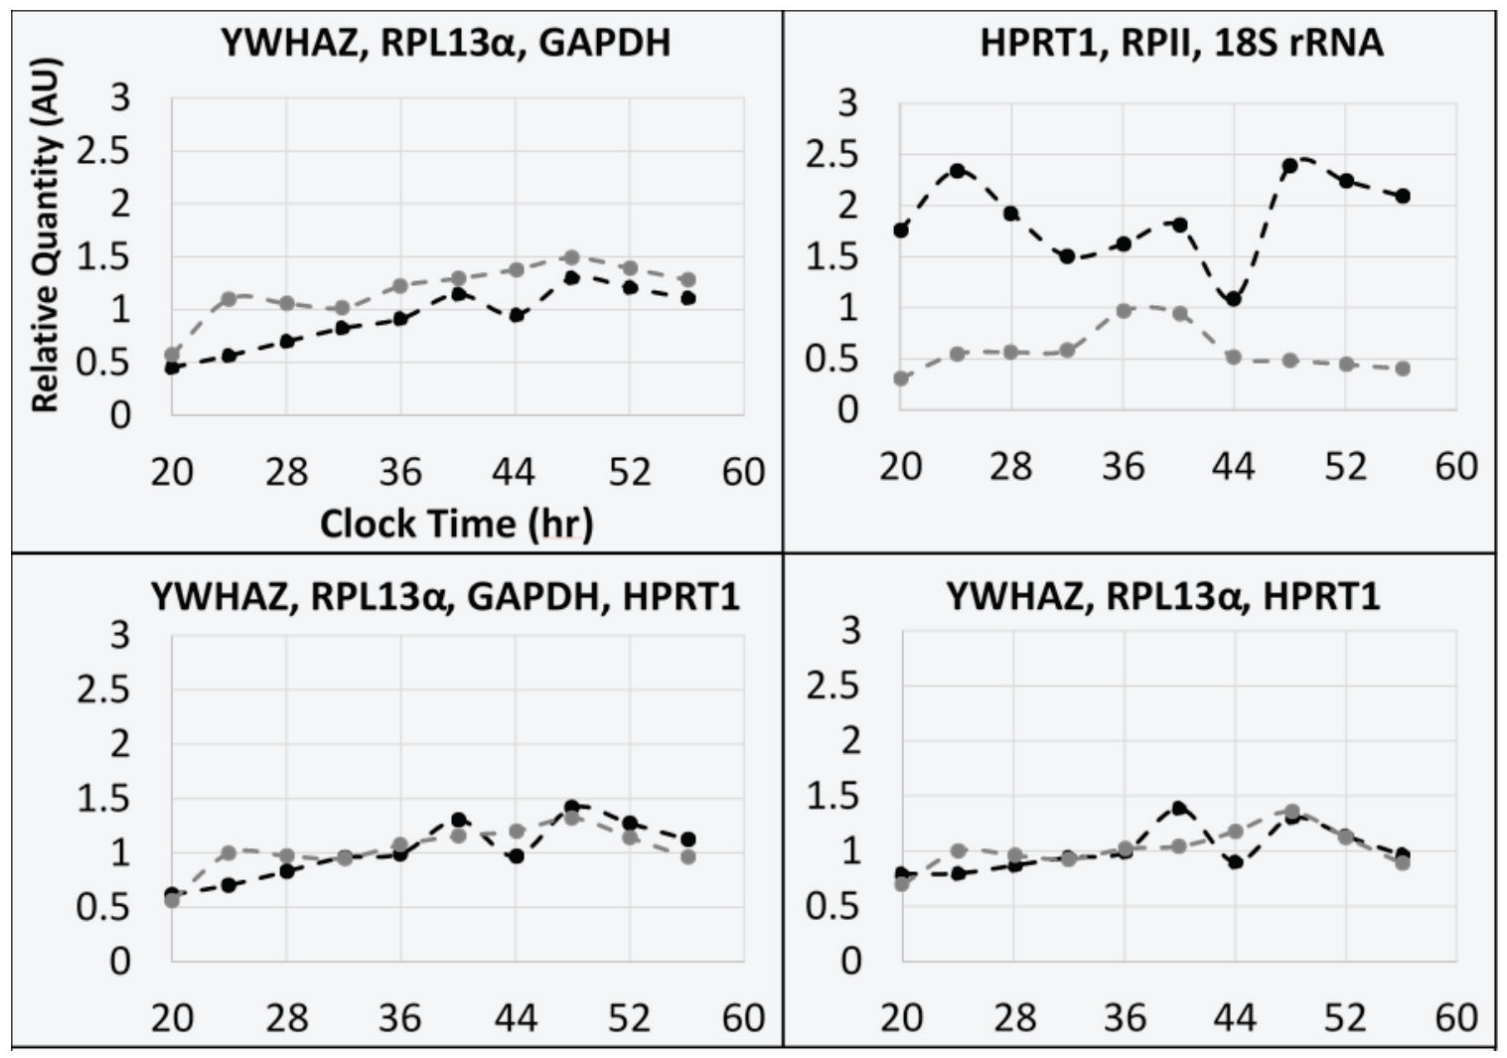
Profiles of relative quantities for geometrically averaged reference gene sets. Sample quantification cycle (Cq) values for each included gene were geometrically averaged together and then calibrated to the mean Cq values of both included biopsy data sets, which were (black) 1 to 2 weeks prior to surgery and (gray) 12 to 13 weeks after surgery. Clock time is counting up from day 0, which included the initial biopsy collection in the morning (20 CT = day 0, 2000 h).
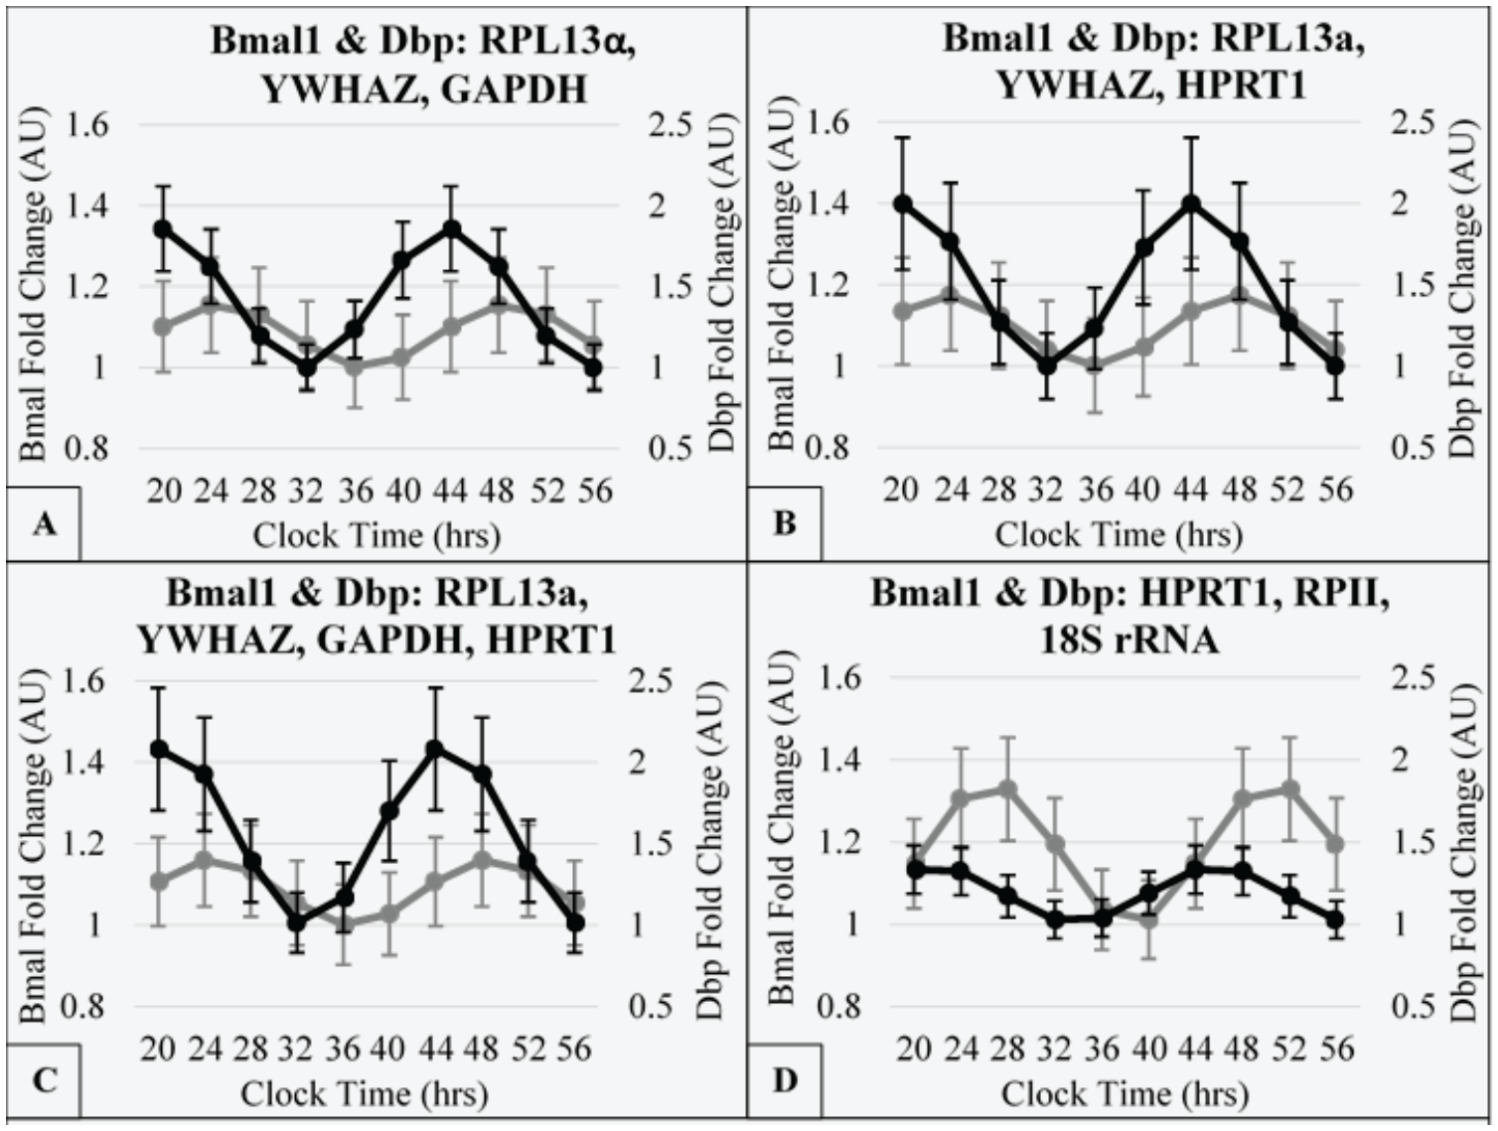
Rhythmic gene expression of clock genes, Dbp and Bmal1, as output from least squares cosinor analysis following normalization by 4 different reference gene sets. Each gene was measured (n = 3) across the time-series experiment for Bmal1 (gray) and Dbp (black) at 12 to 13 weeks following surgery. Gene expression was normalized to 1 of 4 geometrically averaged reference gene sets. Fold change was calibrated to the maximal ΔCq of each gene’s normalized data set. The time is clock time relative to day 0, on which the biopsy was performed during the morning (20 CT = day 0, 2000 h). Cosinor analysis was conducted using R project package: cosinor2.
For Figure 5, the 4 reference gene sets were (1) YWHAZ, RPL13α, and GAPDH; (2) YWHAZ, RPL13α, and HPRT1; (3) YWHAZ, RPL13α, GAPDH, and HPRT1; and (4) HPRT1, RPII, and 18S rRNA. The first 3 reference gene sets corresponded to the suggested options remaining after the conclusion of the rhythm-blind analysis. The fourth reference gene set corresponded to the geometric average of the 3 worst individually suitable genes (Fig. 5B). For 3 potential reference gene sets (Fig. 5A, C, and D), there was fluctuation across the time series (between 0.5 and 1.5 relative quantity). For the postsurgery biopsy, there were minor peaks that occurred at midnight (24 and 48 clock time). For the presurgery biopsy, there were minor peaks at 1600 h of day 1 and 0000 h of day 2. In Figure 5B, the presurgery biopsy additionally had a peak at midnight of day 1, and the postsurgery biopsy only had a peak between 1200 h and 1600 h of day 1. Lastly, the difference in relative quantity was of a greater magnitude than other panels (Fig. 5A, C, D) and in a reverse direction. The individual reference gene relative quantity plots are represented in Supplementary Figure S5.
The circadian clock genes, Bmal1 and Dbp, were measured for the postsurgery biopsy of 3 subjects. The normalizations were to each reference gene set previously shown in Figure 5. These data sets were used to conduct a least-squares cosinor analysis using the method cosinor.lm from R-project package cosinor2. For each gene, cycle length was set to 24 h, and time was the only explanatory variable used for the output variable (fold change). The object output from cosinor.lm had a defined acrophase and amplitude, which were used to calculate the modeled data set for each normalization condition (Fig. 6). The curves were calibrated such that the minimal data point was set to 1. The calculated amplitudes for Dbp were, respectively, 0.43, 0.50, 0.55, and 0.18. The calculated amplitudes for Bmal1 were, respectively, 0.08, 0.09, 0.08, and 0.17. In each panel, the acrophase of Dbp was calculated to be prior to Bmal1, in agreement with previous work in mice (Takahashi, 2017). The range for acrophase differences was between 3:47 and 5:19 h (Fig. 6A, B; Suppl. Fig. S6). For Bmal1, the calculated acrophases were, respectively, 0:54, 23:46, 0:43, and 2:39. In contrast, prior reports of Bmal1 acrophase preceded our report (Gómez-Santos et al., 2009; Gómez-Abellán et al., 2012). However, in our current study, we (1) used no fetal bovine serum shock, which allowed us to maintain the endogenous rhythmicity from each subject; (2) used base media of M199 instead of DMEM; and (3) used, in media, low insulin (1 nM) and very low dexamethasone treatment (40 nM) to support cell viability. For Dbp, the calculated acrophases were, respectively, 19:36, 19:58, 20:46, and 21:42 (Suppl. Fig. S6). Thus, the optimization of reference genes used to normalize the data affect both the amplitude of gene rhythms of circadian genes as well as the phase relationship between the 2 clock genes.
Discussion
Circadian rhythms are indispensable for understanding of normal physiology and for research addressing the transition into pathophysiology. This is made clear in studies that have examined the disruption of circadian rhythms by sleep curtailment or shift work and the resulting positive association with obesity, insulin resistance, and diabetes. Improving the precision of the assays that observe circadian rhythms is still ongoing. This work is meant to add to this knowledge, particularly, in this context, qRT-PCR assays for measuring target gene expression.
To accomplish this goal, primary subcutaneous human adipose tissue was ex vivo cultured and periodically harvested. Previous literature documented that these culture conditions allowed for the preservation of circadian patterns of gene expression in primary adipose tissue, and the results shown in Figure 6 support this conclusion. Four morbidly obese female subjects were included in the data set, and for each subject, biopsies were collected at 3 times around bariatric surgery. These conditions were used to allow for a complex example of adipose tissue health and endocrine regulation on circadian rhythmicity. With these data, we were able to analyze the proof-of-concept differences in circadian rhythmicity and assess how suitable previously verified reference genes were under the tested experimental conditions.
The aim of this study was to assess whether any of the candidate genes were sufficient to function individually as reference genes, a practice widely employed in research. Despite vetting by other articles assessing that the genes used were stable under hormonal treatment, variation in body mass index, and in adipose tissue, in our hands under the experimental conditions and human subjects used, none of the genes resulted in sufficient stability to function across these conditions. Yet, even under these extremely heterogeneous conditions, it was possible to create a reference gene set (YWHAZ, RPL13α, and GAPDH) that was most advantageous to interpret experimental results. At the least, these results strongly suggest that more attention is owed to verifying that the reference standard is sufficiently stable for any given experiment. It is possible to create a system with an unwieldy oversight burden for disseminating qRT-PCR results. Yet, the process is not sufficiently transparent regarding the effect of normalization on experimental results. This critique either overtly or implicitly undermines the confidence in a technique that is still widely relied upon.
Each method to determine the stability of the reference genes relied on different assumptions of what was required for an acceptable reference gene standard. Use of more than one method is encouraged to verify the provisional stability assessment offered by a single method. The overlap for genes that performed well or poorly did agree between the methods used in this study. However, the suitability became more muddled between the approaches if under the experimental conditions there was no gene that clearly performed well. In this case, using the multiple analytic tools offers 2 options: (1) finer distinctions between suitability of the individual genes or (2) incorporation of multiple genes into a reference gene set. Since the genes that are being considered are likely to be nearer to the border of acceptability, the use of more than a single method fosters a more balanced understanding of the ability of each gene to serve within the reference gene set.
There are 2 genes that deserve to be discussed in particular. Despite still being widely used, 18S rRNA performed the worst of the 6 genes tested in the study. This provides increasing evidence that for 18S rRNA, certain experimental conditions lead to notably high variation. Since this is the case, this study shows evidence corroborating that 18S rRNA should be rigorously tested before acceptance as a reference gene, particularly with regard to circadian clock genes assayed over a period of time. The other gene of note was HPRT1. As would be expected with the previously noted high average Cq, there was a high rate of failed qRT-PCR runs. Yet, also supporting the findings of previous literature, rerunning the failed wells did result in an average Cq across conditions that was near to the stability of the best-performing genes. It remains uncertain whether the stability is due to actual gene expression or manipulation of stability by the rejection of any results that fall out of the narrow acceptable range.
This current study does rely on the fundamental assumption that random enrollment yields representative subject selection. More subjects are always advantageous for achieving suitable representation of subject populations, and there was a comparatively small number of subjects included in this analysis. However, the paired aspect of the study design enabled a more thorough interrogation of the stability of the genes in these individuals. It is true that individual time-course measurements were not entirely independent of the other measurements, but there is no consensus about how dependency should be effectively controlled, given that biological rhythm research already involves one layer of linear modeling. Instead, this study performed more measurements to account for the stated dependency.
In the tool BestKeeper, there is explicit regard for the concern of co-regulation of reference genes and target genes. The conceptual risk is that since neither reference genes nor target genes operate outside the cellular regulatory mechanisms, there exists the possibility that the experimental manipulation will be reflected in both the reference gene and target gene expression. The downside of this result is that the ΔCq normalization step will eliminate, or dampen, the actual change in target gene expression. This is an example of a false-negative error. Therefore, care should be taken in the selection of candidate reference genes. Yet, there is no firm guideline as to what constitutes unacceptable co-regulation. Thus, instead, it is suggested that this error is conceptually and experimentally addressed by considering and measuring the covariance of a number of potential reference genes for each set of experimental protocols used to obtain the greatest fidelity in these critical tools for data normalization.
Supplemental Material
JBR-19-072_Revision_Supplemental_Figure_1_2 – Supplemental material for Reference Gene Optimization for Circadian Gene Expression Analysis in Human Adipose Tissue
Supplemental material, JBR-19-072_Revision_Supplemental_Figure_1_2 for Reference Gene Optimization for Circadian Gene Expression Analysis in Human Adipose Tissue by Jeremy M. White, Matthew J. Piron, Vittobai R. Rangaraj, Erin C. Hanlon, Ronald N. Cohen and Matthew J. Brady in Journal of Biological Rhythms
Supplemental Material
JBR-19-072_Revision_Supplemental_Figure_2 – Supplemental material for Reference Gene Optimization for Circadian Gene Expression Analysis in Human Adipose Tissue
Supplemental material, JBR-19-072_Revision_Supplemental_Figure_2 for Reference Gene Optimization for Circadian Gene Expression Analysis in Human Adipose Tissue by Jeremy M. White, Matthew J. Piron, Vittobai R. Rangaraj, Erin C. Hanlon, Ronald N. Cohen and Matthew J. Brady in Journal of Biological Rhythms
Supplemental Material
JBR-19-072_Revision_Supplemental_Figure_3 – Supplemental material for Reference Gene Optimization for Circadian Gene Expression Analysis in Human Adipose Tissue
Supplemental material, JBR-19-072_Revision_Supplemental_Figure_3 for Reference Gene Optimization for Circadian Gene Expression Analysis in Human Adipose Tissue by Jeremy M. White, Matthew J. Piron, Vittobai R. Rangaraj, Erin C. Hanlon, Ronald N. Cohen and Matthew J. Brady in Journal of Biological Rhythms
Supplemental Material
JBR-19-072_Revision_Supplemental_Figure_4 – Supplemental material for Reference Gene Optimization for Circadian Gene Expression Analysis in Human Adipose Tissue
Supplemental material, JBR-19-072_Revision_Supplemental_Figure_4 for Reference Gene Optimization for Circadian Gene Expression Analysis in Human Adipose Tissue by Jeremy M. White, Matthew J. Piron, Vittobai R. Rangaraj, Erin C. Hanlon, Ronald N. Cohen and Matthew J. Brady in Journal of Biological Rhythms
Supplemental Material
JBR-19-072_Revision_Supplemental_Figure_5 – Supplemental material for Reference Gene Optimization for Circadian Gene Expression Analysis in Human Adipose Tissue
Supplemental material, JBR-19-072_Revision_Supplemental_Figure_5 for Reference Gene Optimization for Circadian Gene Expression Analysis in Human Adipose Tissue by Jeremy M. White, Matthew J. Piron, Vittobai R. Rangaraj, Erin C. Hanlon, Ronald N. Cohen and Matthew J. Brady in Journal of Biological Rhythms
Supplemental Material
JBR-19-072_Revision_Supplemental_Figure_6 – Supplemental material for Reference Gene Optimization for Circadian Gene Expression Analysis in Human Adipose Tissue
Supplemental material, JBR-19-072_Revision_Supplemental_Figure_6 for Reference Gene Optimization for Circadian Gene Expression Analysis in Human Adipose Tissue by Jeremy M. White, Matthew J. Piron, Vittobai R. Rangaraj, Erin C. Hanlon, Ronald N. Cohen and Matthew J. Brady in Journal of Biological Rhythms
Supplemental Material
JBR-19-072_Revision_Supplemental_Table_1_1 – Supplemental material for Reference Gene Optimization for Circadian Gene Expression Analysis in Human Adipose Tissue
Supplemental material, JBR-19-072_Revision_Supplemental_Table_1_1 for Reference Gene Optimization for Circadian Gene Expression Analysis in Human Adipose Tissue by Jeremy M. White, Matthew J. Piron, Vittobai R. Rangaraj, Erin C. Hanlon, Ronald N. Cohen and Matthew J. Brady in Journal of Biological Rhythms
Footnotes
Acknowledgements
This work was supported by R01 DK103014 (to M.J.B.) and the University of Chicago DRTC P30DK020595, while J.M.W. was supported by a fellowship from T32HL007909. Each author was involved in the design of the experiments, was involved in the writing, and approved the final version for submission. We thank Dr. Eve Van Cauter for guidance and productive conversations. We thank the bariatric surgeons at the University of Chicago for performing the biopsies. We also thank Kyle Kunze for assistance in carrying out the experiments.
Conflict of Interest Statement
The authors have no potential conflicts of interest with respect to the research, authorship, and/or publication of this article.
Notes
References
Supplementary Material
Please find the following supplemental material available below.
For Open Access articles published under a Creative Commons License, all supplemental material carries the same license as the article it is associated with.
For non-Open Access articles published, all supplemental material carries a non-exclusive license, and permission requests for re-use of supplemental material or any part of supplemental material shall be sent directly to the copyright owner as specified in the copyright notice associated with the article.