
Abstract
Locomotor activity patterns of laboratory mice are widely used to analyze circadian mechanisms, but most investigations have been performed under standardized laboratory conditions. Outdoors, animals are exposed to daily changes in photoperiod and other abiotic cues that might influence their circadian system. To investigate how the locomotor activity patterns under outdoor conditions compare to controlled laboratory conditions, we placed 2 laboratory mouse strains (melatonin-deficient C57Bl and melatonin-proficient C3H) in the garden of the Dr. Senckenbergische Anatomie in Frankfurt am Main. The mice were kept singly in cages equipped with an infrared locomotion detector, a hiding box, nesting material, and with food and water ad libitum. The locomotor activity of each mouse was recorded for 1 year, together with data on ambient temperature, light, and humidity. Chronotype, chronotype stability, total daily activity, duration of the activity period, and daily diurnality indices were determined from the actograms. C3H mice showed clear seasonal differences in the chronotype, its stability, the total daily activity, and the duration of the activity period. These pronounced seasonal differences were not observed in the C57Bl. In both strains, the onset of the main activity period was mainly determined by the evening dusk, whereas the offset was influenced by the ambient temperature. The actograms did not reveal infra-, ultradian, or lunar rhythms or a weekday/weekend pattern. Under outdoor conditions, the 2 strains retained their nocturnal locomotor identity as observed in the laboratory. Our results indicate that the chronotype displays a seasonal plasticity that may depend on the melatoninergic system. Photoperiod and ambient temperature are the most potent abiotic entraining cues. The timing of the evening dusk mainly affects the onset of the activity period; the ambient temperature during this period influences the latter’s duration. Humidity, overall light intensities, and human activities do not affect the locomotor behavior.
Circadian rhythms such as sleep/wake cycles, body temperature, and hormone secretion are endogenous physiological oscillations that occur within a period of approximately 24 h and persist even in the absence of rhythmic environmental cues. In mammals, these rhythms are driven by the circadian clock located in the suprachiasmatic nucleus (SCN) of the hypothalamus (Korf and von Gall, 2012). Many aspects of the environment vary with time of day or season, and the circadian system is influenced by environmental stimuli (so-called “zeitgebers”; Aschoff, 1954) that are able to phase shift (“entrain”) the endogenous clock, pushing it forward or backward, in order to adapt to changes in the outside world (Korf and von Gall, 2012). A common readout of the phasing of the circadian system is the locomotor activity that can be shifted back and forth in time by the different entraining clues (Mrosovsky, 1996; Pfeffer et al., 2012; van Oosterhout et al., 2012; von Gall et al., 1998; Wicht et al., 2014). Furthermore, the locomotor activity can be considered an excellent marker for the state and the entrainability of the circadian system (Pfeffer et al., 2012; van Oosterhout et al., 2012; Wicht et al., 2014).
Much of our knowledge of the circadian system and its entrainment (i.e., the responses to abiotic cues such as light or temperature, as well as masking effects, entrainment, chronotype, and rhythm stability) have been studied almost exclusively in the laboratory under standardized conditions (Homola et al., 2015; Mrosovsky, 1996; Pfeffer et al., 2012; Refinetti, 2002; Refinetti, 2004; von Gall et al., 1998; Wicht et al., 2014).
Our study was performed under seminatural outdoor conditions and focused on the impact of seasonal changes in the photoperiod and other abiotic physical stimuli. All of these parameters differ greatly from the standard situation in the laboratory. In the laboratory, the temperature is typically set to about 20 °C, and the photoperiod is set to 12 h light/12 h darkness. This particular condition never occurs outdoors, not even around the time of the equinoxes, because, at least in central Europe, an average daily temperature of 20 °C would not be reached on these days. Instead, there are relatively unpredictable daily combinations of rising and falling temperatures, humidity, and illumination conditions. In the laboratory, light is turned “on” or “off” abruptly, whereas outdoors, twilight, which is defined by the angles of the sun below the horizon, accompanies the dawn-dusk transitions. In addition, under natural conditions, environmental variables do not follow stable cycles (i.e., the temperature might drop during the day with clouds or humidity changes with rainfall). Furthermore, in the laboratory, photic and nonphotic cues are kept constant or are altered independently, whereas under natural conditions, they are not independent; for example, in the laboratory, the temperature is kept constant, whereas outside, the temperature is usually higher during the light phase. Therefore, we expanded beyond the standard 12 h light/12 h dark regimes at room temperature in the laboratory to assess how the circadian system operates under more natural conditions, where a lot of potential time cues are-often simultaneously-acting on it.
Toward this end, we put laboratory mice (melatonin-proficient C3H and melatonin-deficient C57Bl) outdoors, into the back garden of the Dr. Senckenbergische Anatomie in Frankfurt am Main (at approximately 50°, 5′ N; 8°, 39′ E) and monitored their locomotor activity individually for a period of 1 year (365 days). The mice were housed in single cages and were thus protected from predatory pressure, competitive and reproductive stresses, and bodily interactions with other mice, and they were given food and water ad libitum. Owing to the particular setting in the back garden, the mice were also exposed to a variety of other cues, such as natural and human noises and different natural odors, which might stem from predators or wild mice; they had potential contact with insects, germs, and parasites; and they were exposed to a number of parameters that we, of course, could not control. We studied how natural abiotic factors act on the activity patterns of these 2 standard laboratory mouse strains (C3H and C57Bl) compared with the locomotor patterns observed in the lab.
Materials and Methods
Animals
All experiments with animals reported in this article were conducted in accordance with the policy on the use of animals in neuroscience research and the policy on ethics as approved by the Society for Neuroscience and by the European Communities Council Directive (89/609 EEC) and by the Regierungspräsidium Darmstadt (Gen. Nr. FU/1138).
We used 6 adult (10-14 weeks old) male mice of either C57Black/6J (C57Bl; body weight range 27.3-28.9 g) or C3H/HeN-Pde6brd1 (C3H; body weight range 31.1-34.8 g). Animals were obtained from Charles River Europe (Sulzfeld, Germany).
Animal Housing and Husbandry/Seminatural Abiotic Entrainment
Before the mice were placed outdoors in the garden, they were adapted to the natural photoperiod in an unheated room for at least 3 weeks (average temperature 10 °C, minimum 8 °C, maximum 12 °C). The mice were kept singly in cages equipped with an infrared camera, a hiding box, and nesting material and with food and water ad libitum. The experimental setup in the back garden of the Dr. Senckenbergische Anatomie in Frankfurt am Main, Germany (50°, 5′ N; 8°, 39′ E) is shown in Figure 1. The cages, equipped as described above, were placed in a big wire mesh box to protect the mice from predators; an acrylic glass roof provided protection from rain. Once a week, the cages were taken out of the wire mesh box and cleaned. The cleaning was carried out on different workdays in order not to induce a 7-day rhythm caused by the cleaning procedure. On that occasion, the mice were weighed once a month to control for possible health problems.
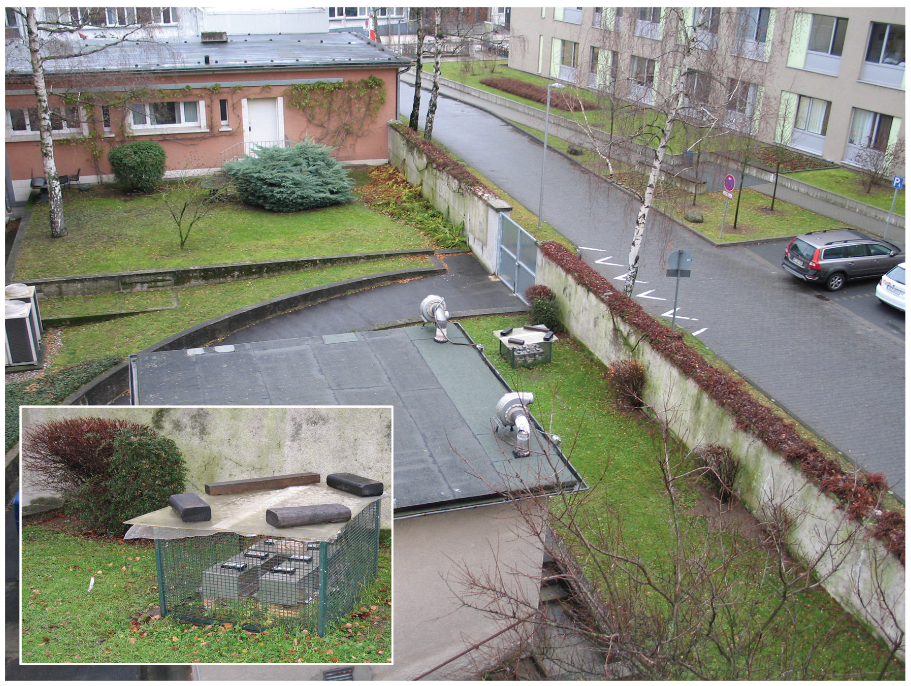
The experimental setup in the backyard of the Dr. Senckenbergische Anatomie, as seen from a balcony of an office in the third floor. The driveway to the right is a moderately frequented cul-de-sac, and the metal-plated gate and the driveway to the left lead to the cellar of the institute. The building in the center is a storage and maceration facility. The insert shows the wire mesh box, its plastic roof, and the individual cages.
Data Acquisition
Data were continuously recorded in 10-min intervals over a period of 365 days in the year of 2017 using an automated recording system (Mouse-E-Motion, Hamburg, Germany) as described (Pfeffer et al., 2012; Pfeffer et al., 2015; Wicht et al., 2014). The detectors recorded simultaneously the following (in 10-min intervals):
locomotor activity [counts],
temperature [°C],
humidity [%], and
ambient light [uncalibrated readout 0-500].
The uncalibrated readouts from the sensors were counterchecked by measurements with a calibrated luxmeter. At daytime, the light intensity within the cages ranged between 4.100 and 68.800 lux; in the night, the intensity was between 0.5 and 0.6 lux. To obtain more data on the light conditions, we also collected meteorological data on clouds from meteorological archives (https://www.meteoblue.com/de/wetter/historyclimate/weatherarchive/frankfurt-am-main_deutschland_2925533) and converted them in a “scoring system” (1 = sunny to 4 = overcast).
The raw data obtained from the sensors were tabulated in Microsoft’s Excel; self-written programs in Visual Basic were used for data analysis and visualization.
Data Visualization
Double-plotted actograms were generated using Clocklab software (Actimetrics, Wilmette, IL) as described (Pfeffer et al., 2012). Cloud maps, double-plotted temperature and humidity maps, as well as double-plotted actograms for analysis (in 10-min resolution) were generated using Excel’s graphic functions (Fig. 2), using algorithms that were programmed in Visual Basic. For purely graphical reasons (better visualization of percentiles, see below), the background of these actograms was set to black, and activity was represented by a gray scale, where white denotes the highest activity (Fig. 3).
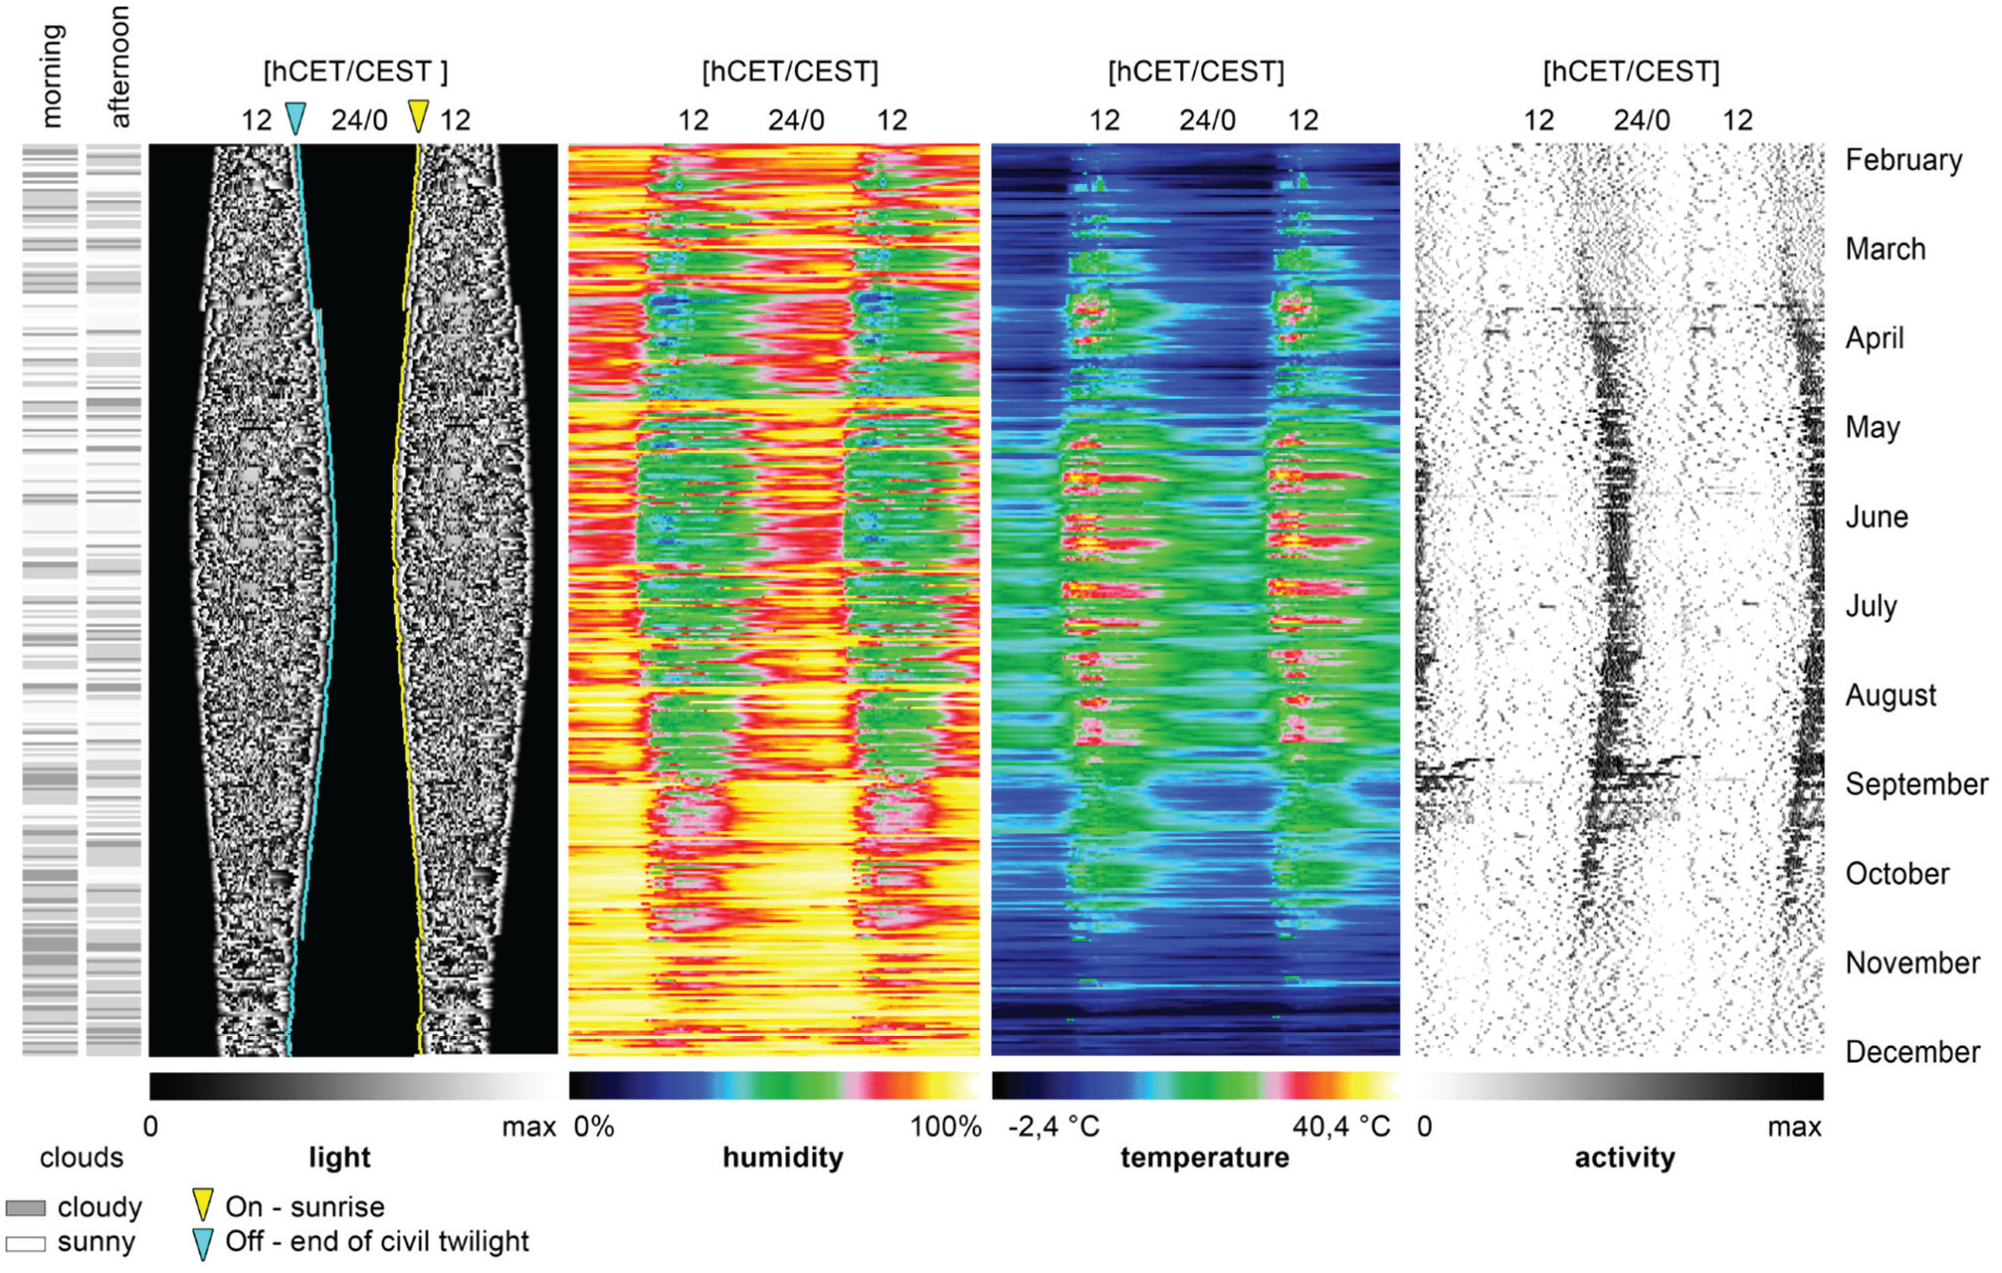
A visualization of the raw data as obtained from the sensors in 10-min intervals, all shown as double plots, with the exception of the cloud maps on the left, which show the morning/afternoon conditions.
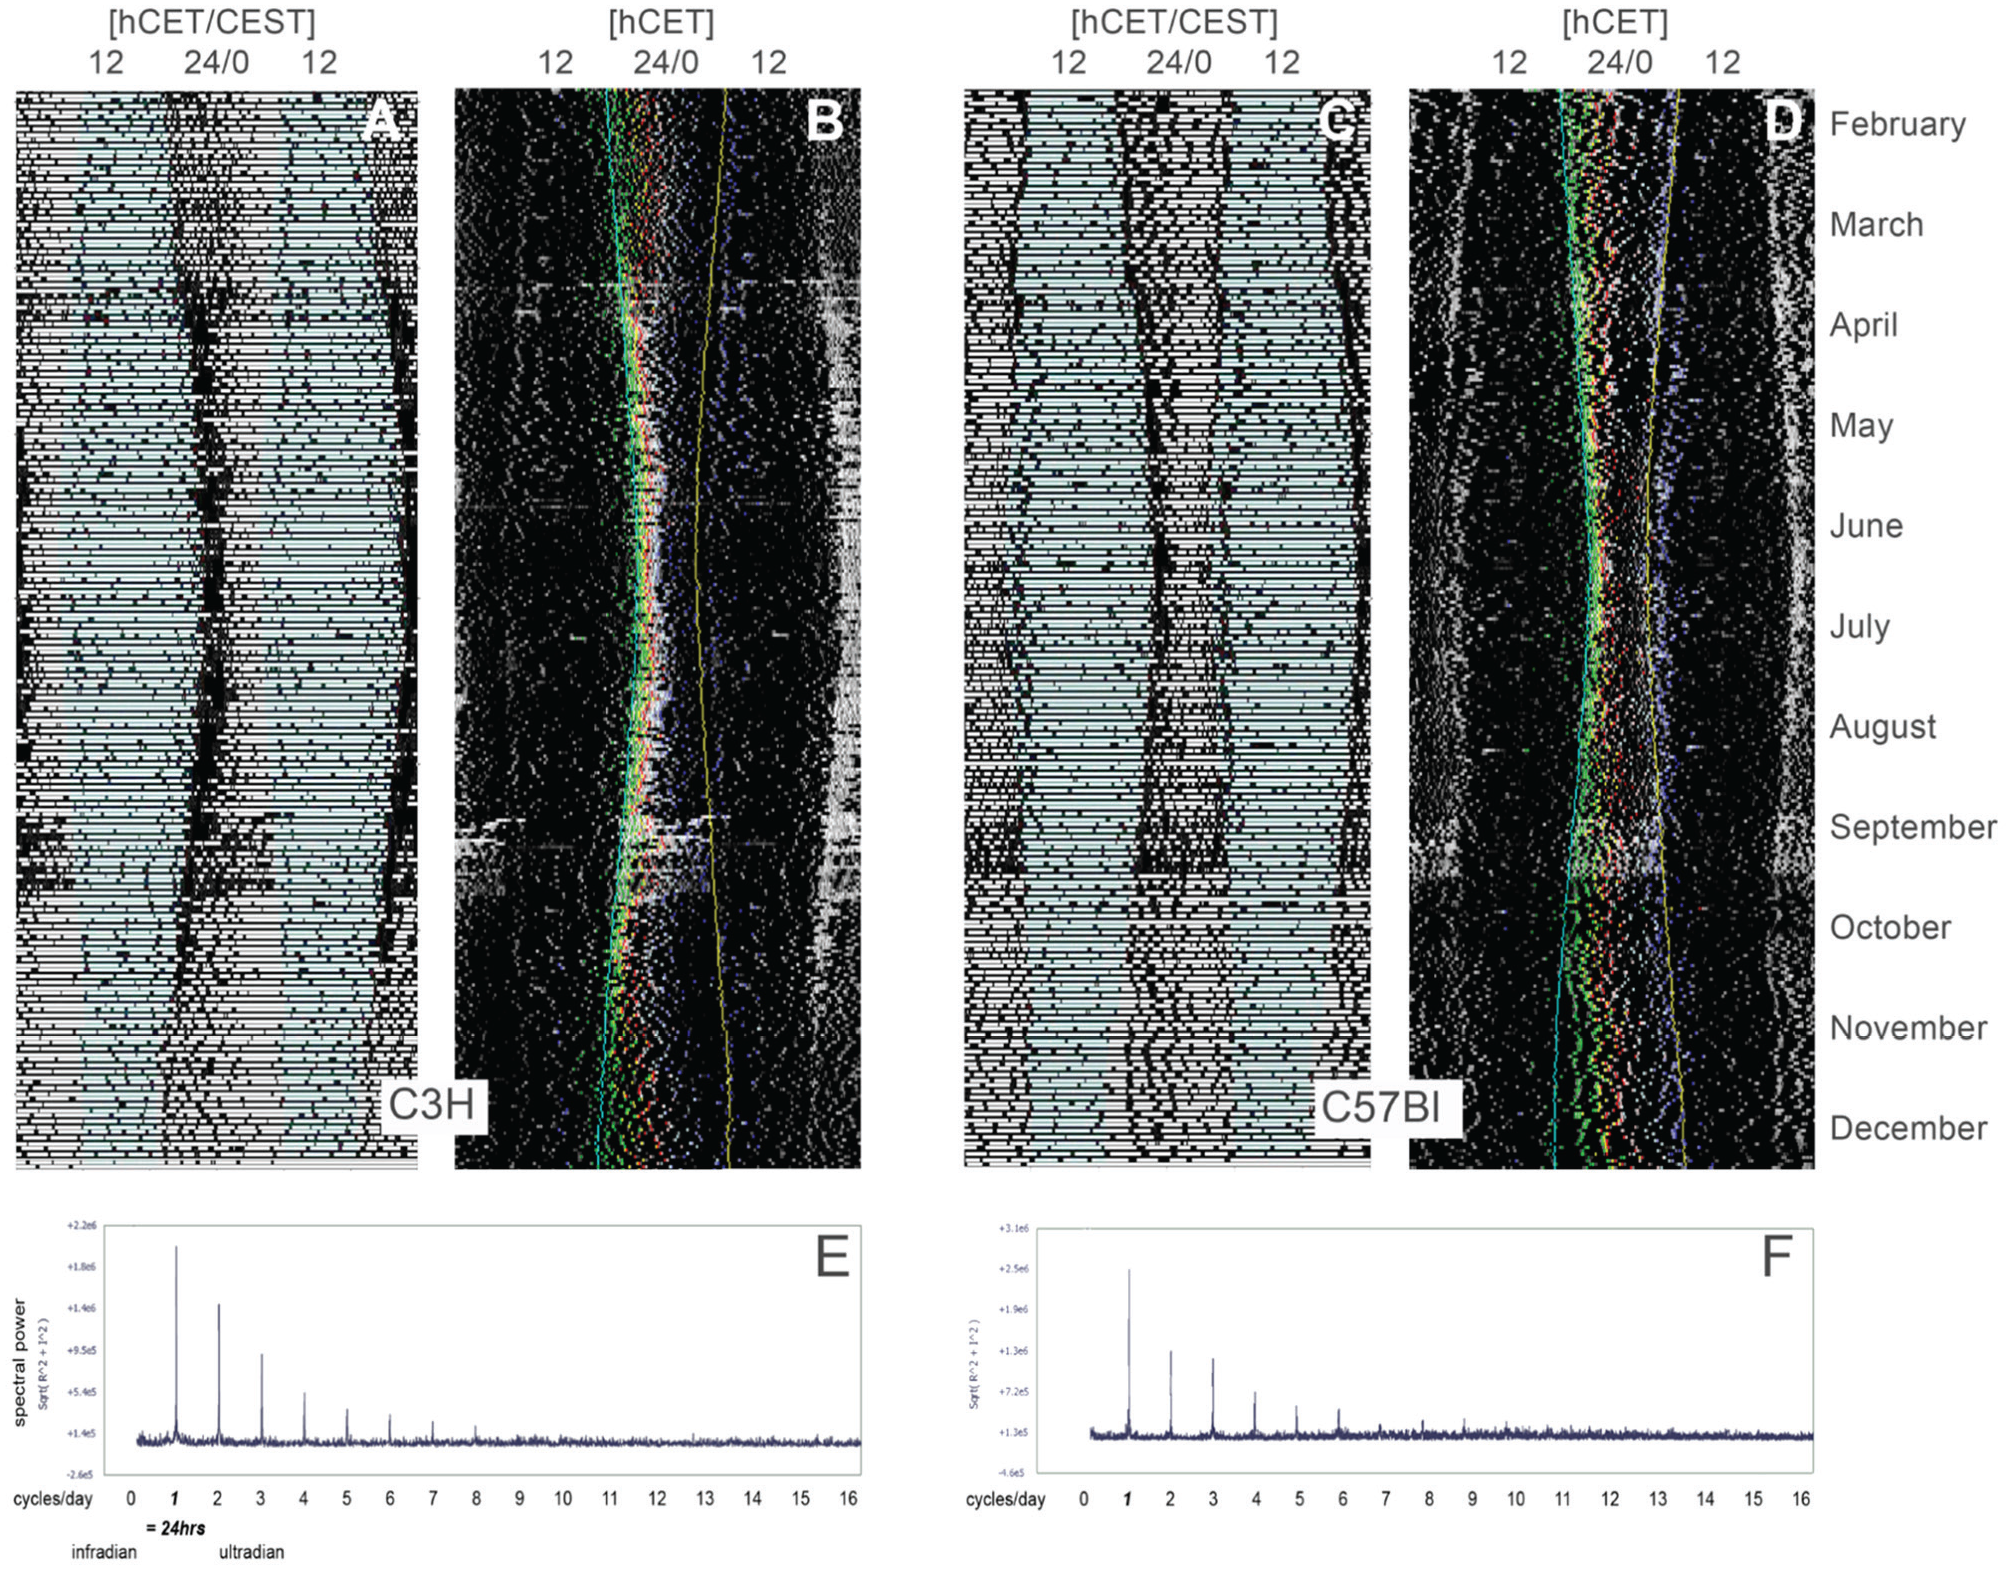
Classical (A, C) and inverted (B, D) double-plotted actograms of a C3H and a C57Bl mouse at a resolution of 10 min. In the inverted actograms, the correction Central European Summer Time → Central European Time has been performed (note the offset in the classical actograms). The time points of lights-off (blue) and lights-on (yellow) have been imported into the inverted actograms. They also show the (color-coded) position of the daily percentiles in time. The bottom part of the figure (E, F) shows the results of a fast Fourier transformation of the time series of the locomotor data. Note that there is spectral power only in the 1 cycle/day frequency (and, of course, in the harmonics thereof); there are no other infra- or ultradian rhythms.
Data Analysis
The time bases for the raw data was Central European Time (CET) and Central European Summer Time (CEST), respectively. The CEST times were reset to CET for all analyses and calculations. Throughout the article, these clock readings in CET [h] and the durations in [h] will be given in the format of [hours:decimal fractions of hours].
The following parameters were extracted from the raw data for each day.
The time points of lights-off/-on [hCET] were determined from the readouts of the sensors. They corresponded—within a range of error of 10 min—to the end of the civil twilight and sunrise (ca. 2-3 lux), respectively, as read off from astronomical tables for Frankfurt am Main. With respect to these time points, the duration of the dark phase [h]; the average temperature during the light phase, TempLight [°C]; during the dark phase, TempNight [°C]; and for the entire 24-h period, TempDay [°C] were calculated. The same procedure was applied to the data on humidity.
The raw data on the animals’ activity [counts/10 min] were treated in the following way (see Fig. 4). For each mouse and for each 24-h period, starting in the middle of the animals’ rest phase (i.e., at 13:67 [hCET]), the total daily activity (counts) for the subsequent 24 h was calculated. With respect to the time points determined for lights-on/-off (see above), we calculated the (dimensionless) daily diurnality index (activity in the light phase – activity in the dark phase/total activity; Hoogenboom et al., 1984).
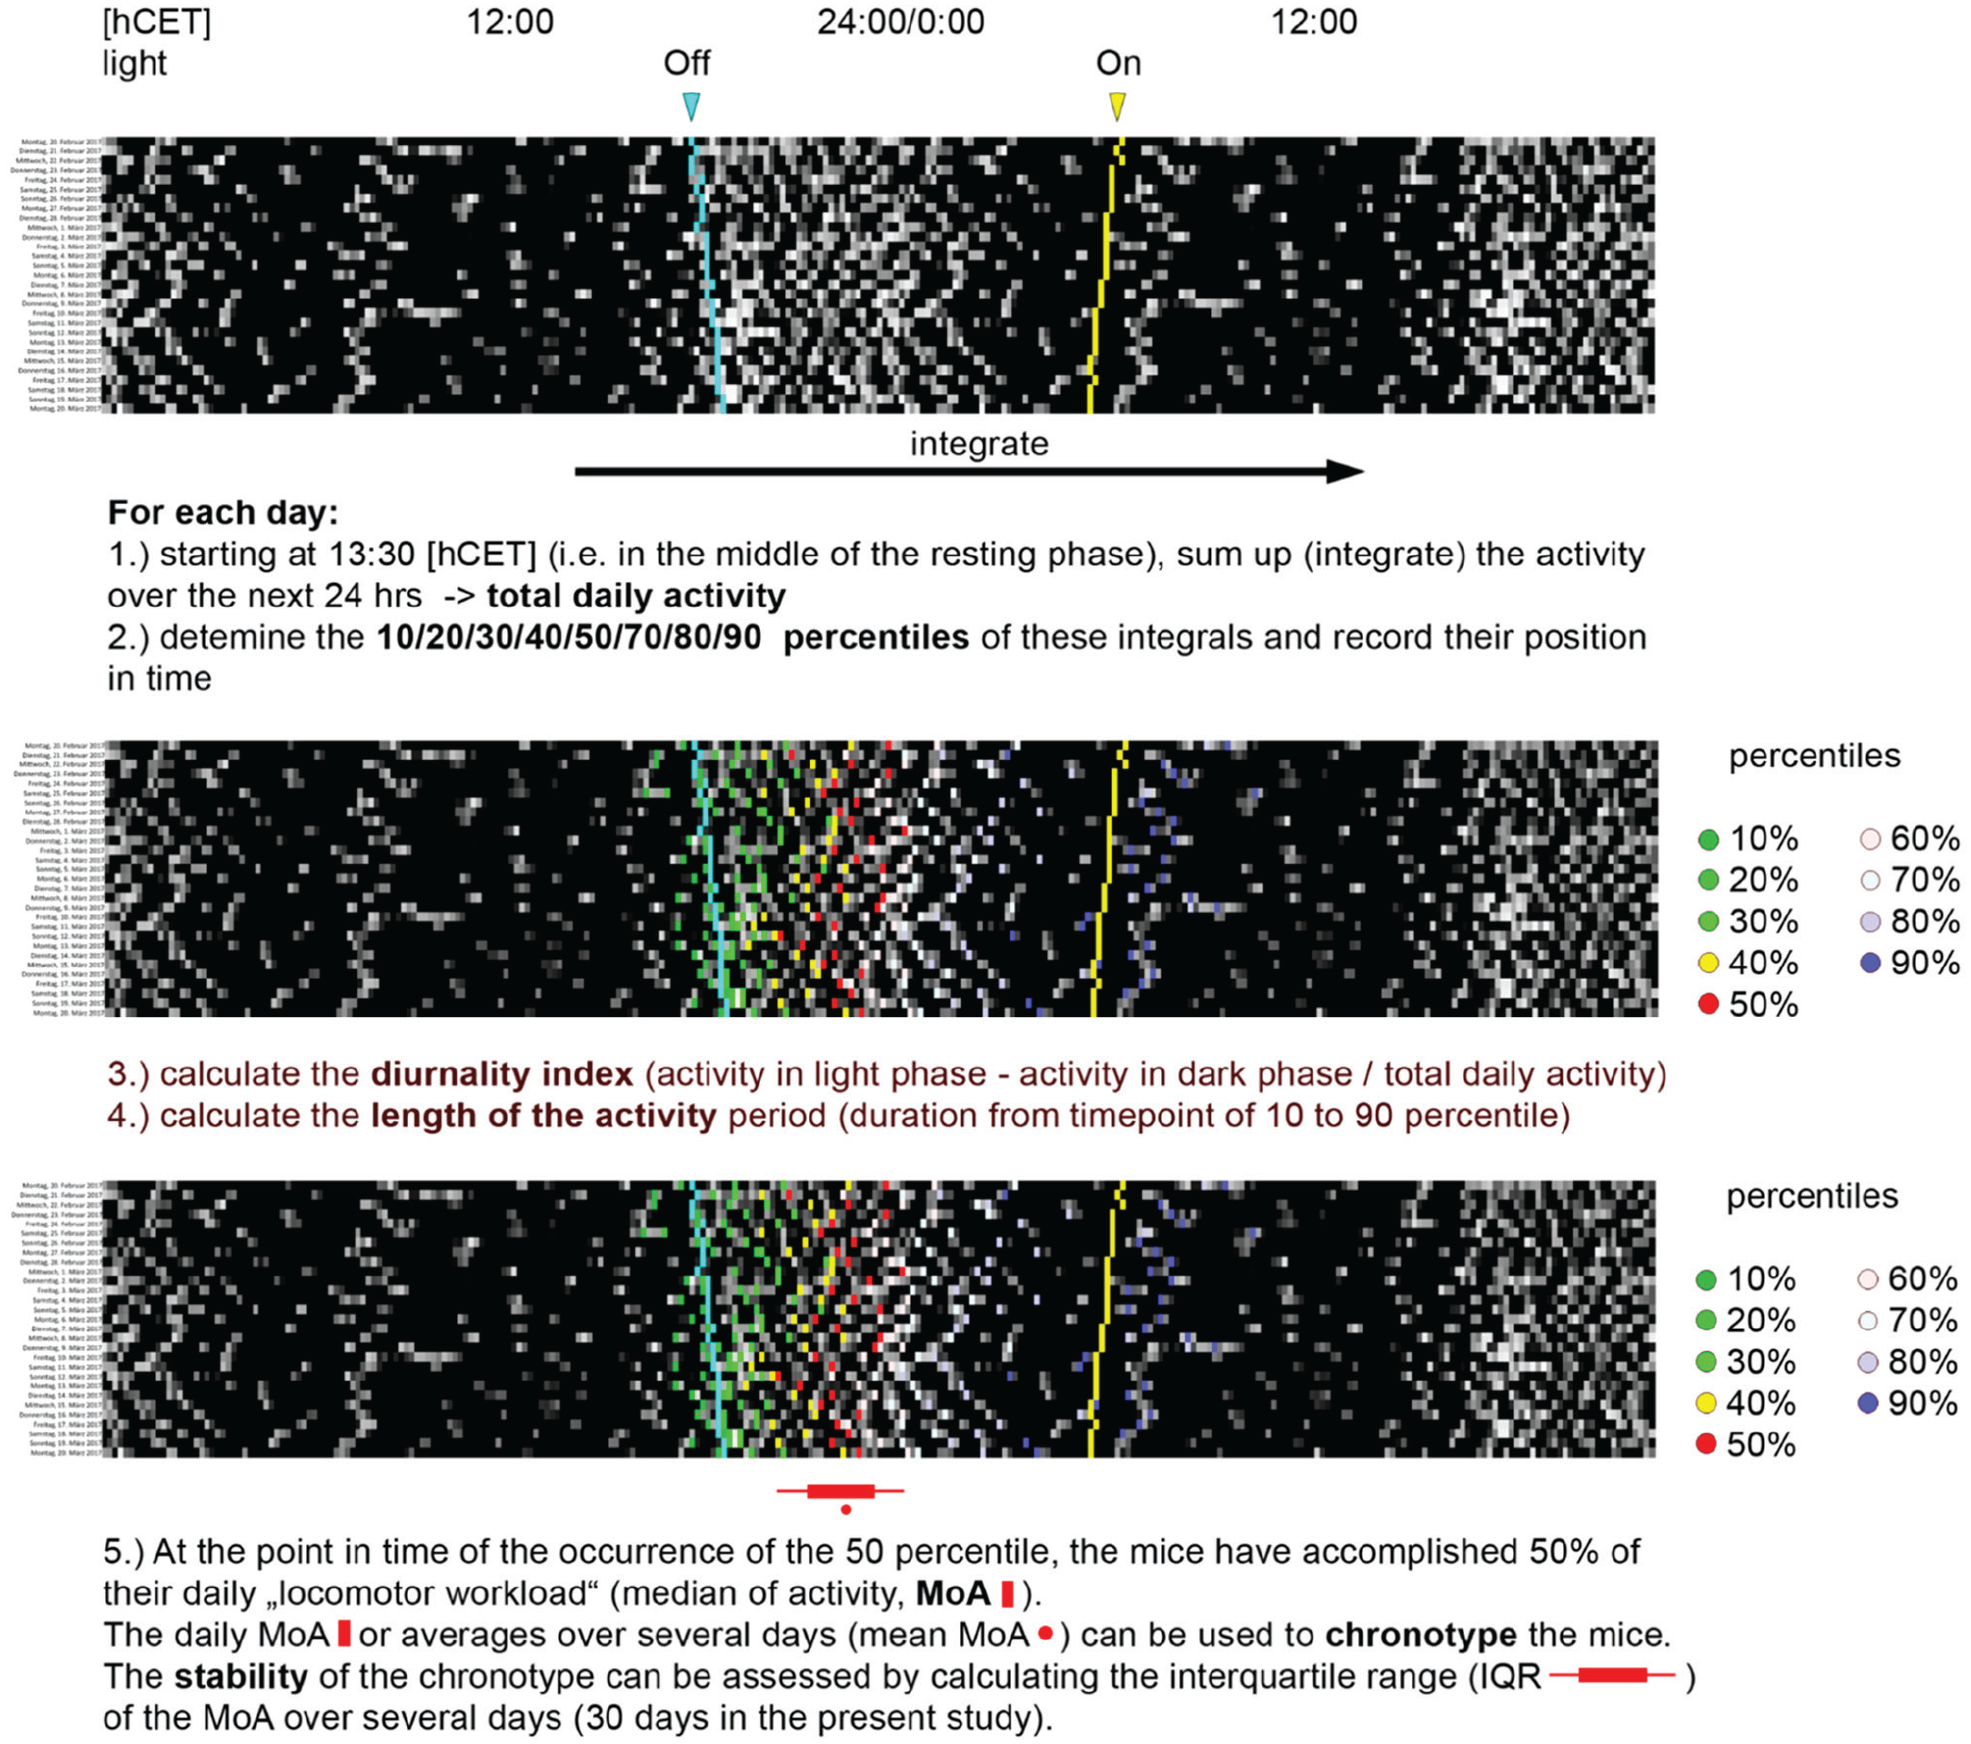
The figure shows different stages (A-C) of the analytical “processing” of a 30-day segment of an inverted actogram (from a C57Bl mouse). The time points of lights-off and -on have been imported as blue and yellow lines, respectively. The figure is meant to explain the analytical methods used to parametrize the locomotor data in graphics and keywords (see the Materials and Methods section for a more detailed description).
To estimate the phasing and the duration of the locomotor activity in relation to external time and lights-on/-off and temperature, we used the following strategy (Wicht et al., 2014; Fig. 4): the total daily activity was calculated as described above. We then calculated, again for each mouse and day, those points in time [hCET] at which the mouse had “accomplished” 10%, 20%, 30%, 40%, 50%, 60%, 70%, 80%, and 90% of its locomotor workload of the respective day. We call those time points the positions of the percentiles; their dimension is [hCET]. The positions of the 10% and the 90% percentiles were used to calculate the duration of the (main) activity period [h].
The position of the 50th percentile, the median of activity (MoA; [hCET]), can be used to chronotype the mouse, either on a daily basis or by averaging the MoA over longer periods of time (Wicht et al., 2014; also see below). In this article, we generally used averages (mean MoA) over 30 days. In addition, the scatter of the MoA within the averaging periods can be used to estimate the stability of the chronotype, which, in turn, is a good measure of general rhythm stability (Wicht et al., 2014). As a measure of this scatter, we report the interquartile range (IQR; [h]) of the MoA; a low IQR thus indicates a relatively stable chronotype.
Averaging Procedures and Correlational Analyses
One-Year Averages/Grand Means
For the daily measurements of the total daily activity [counts], the duration of the activity period [h], the chronotype [MoA, hCET], and its stability [h], as well as for the diurnality indices we calculated the mean values of these parameters over the entire observation period (1 year) for each mouse and report them in box plots (Fig. 5).
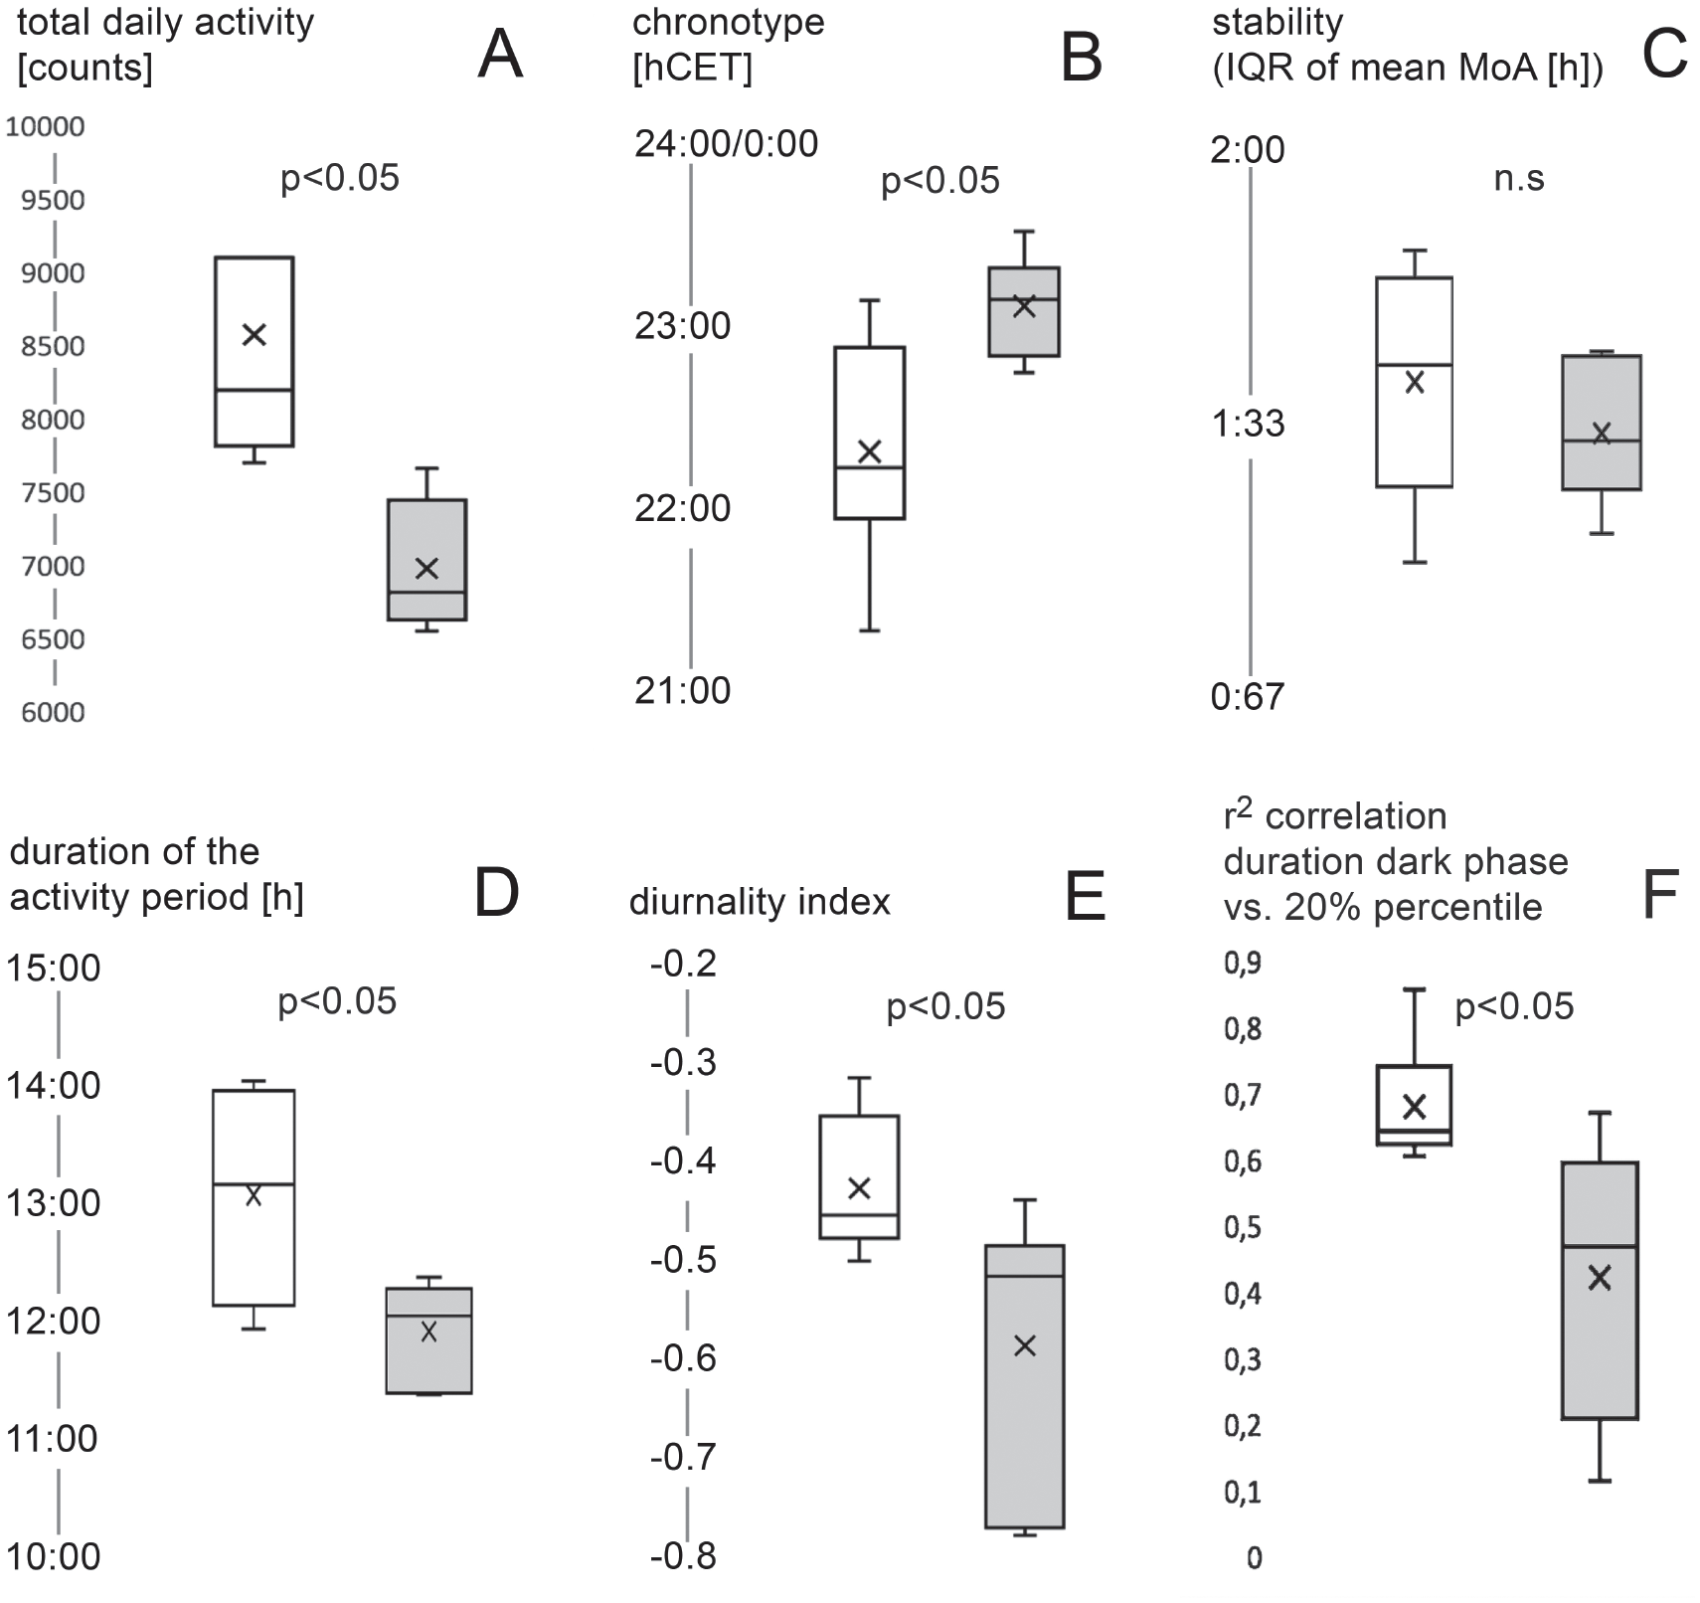
Box plots (A-F) comparing the grand means (over the full year) of different parameters (see labeling) of the 6 C3H mice (white) to those of the 6 C57Bl (gray shading). The p values stem from nonparametric (Mann-Whitney U test) testing.
Analysis of Seasonal Changes
A somewhat more sophisticated technique was used for the (strain-specific) analyses of the seasonal fluctuations (see Fig. 6) of the total daily activity [counts], the duration of the activity period [h], the diurnality index, the daily chronotype (MoA, [hZT]), and the stability of the chronotype (IQR of mean MoA [h]). Toward this end, we pooled the data from the mice of the 2 different strains.
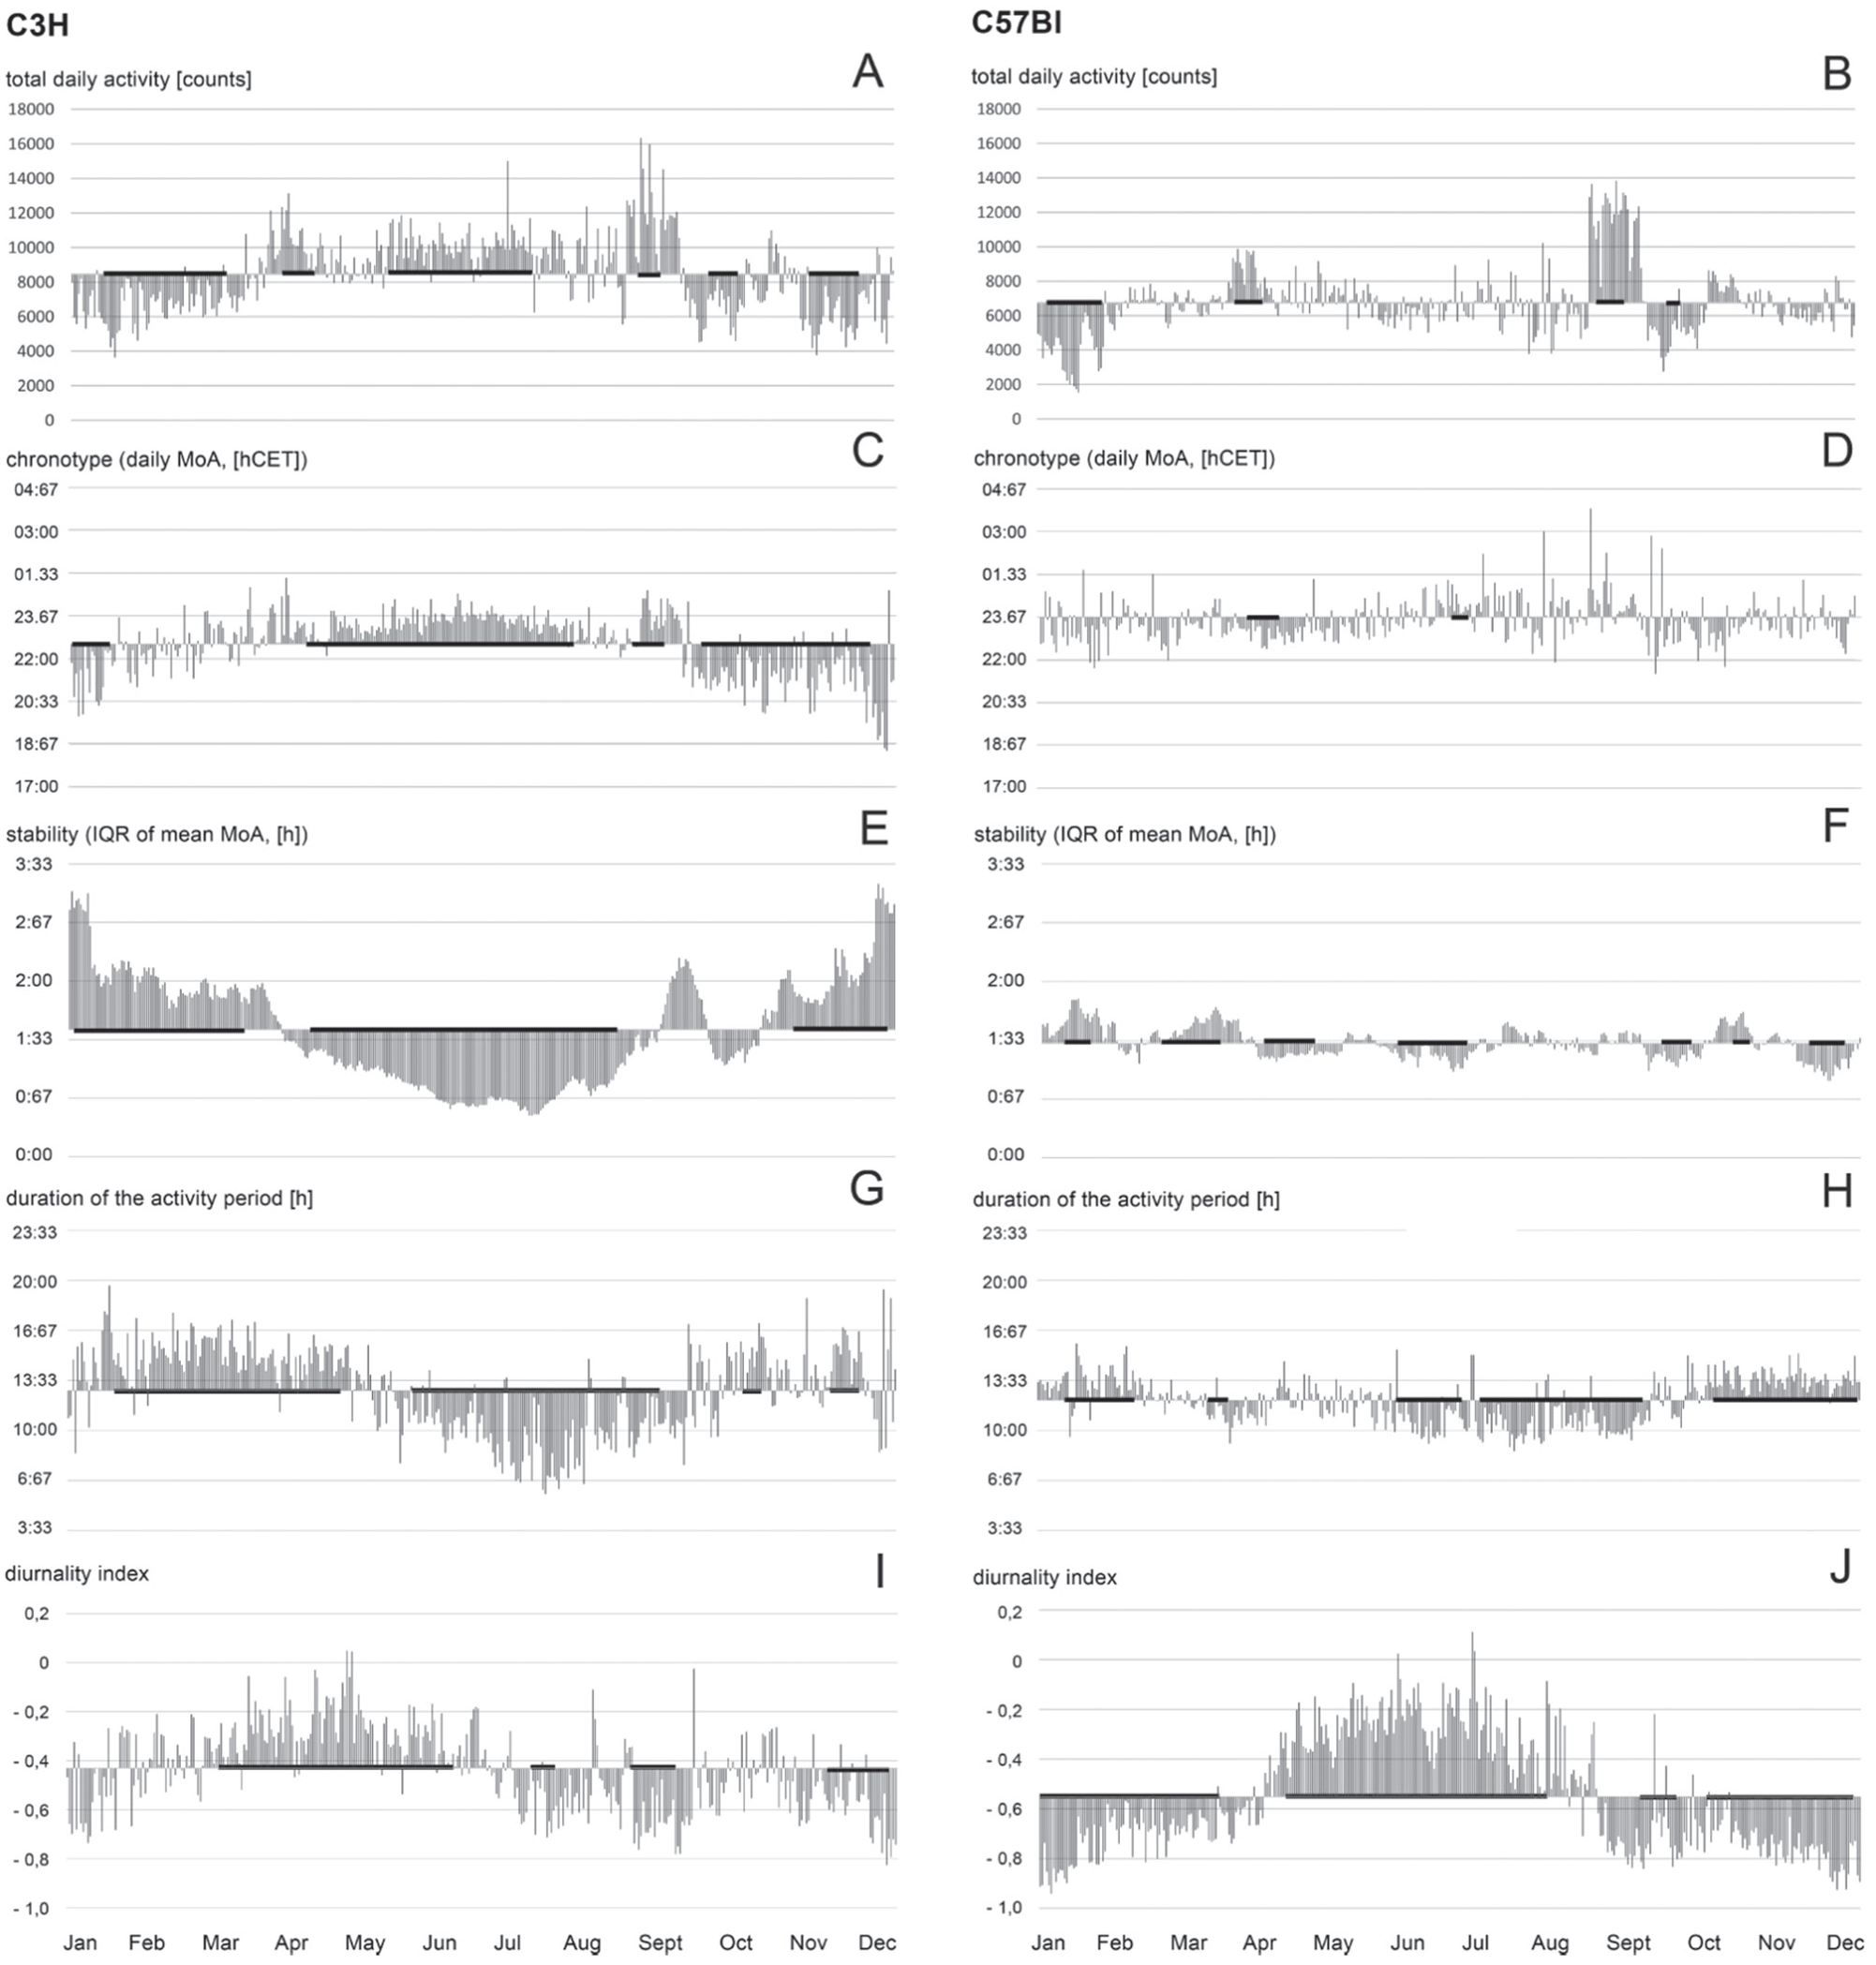
Bar graphs showing the seasonal alterations with respect to different parameters (see labeling). The data for the C3H group are shown on the left and those for the C57Bl group on the right. Each bar in the bar graphs corresponds to the average value of the respective parameter of 6 mice on one particular day. The data are plotted against the yearly mean value of the respective group. The thick black lines along the abscissa indicate periods of time during which the respective measurement values of the group were significantly higher or lower than the yearly average (p < 0.00001, Student’s t-test, Bonferroni corrected; see the Materials and Methods section for details).
First, we calculated the daily means of the above-mentioned parameters for the 6 C75Bl and the 6 C3H mice, respectively (“pooling”). We then entered these pooled daily data from the 2 strains in separate tables (which again covered the whole year) and generated floating 30-day averages of the measurement parameters. The 30 values of each of those floating averages were then statistically compared (Student’s t-test, see below) to all 365 values in the table to identify significant (monthly) deviations from the grand (yearly) mean.
Correlational Analyses
For the pooled (see above) behavioral data of the 2 strains and for each day, we performed correlations of all the abiotic parameters (duration of the dark phase, temperature and humidity data, data on clouds) with all of the behavioral parameters (total activity, duration of the activity period, positions of percentiles, diurnality indices). Some, but not all, of these correlations are shown in Figures 7 and 8. We also correlated the abiotic parameters with each other. All correlations were straightforward linear Pearson correlations. Note that we do report the r2 of the correlations (i.e., the coefficient of determination). Correlations with an r2 of less than 0.3 were regarded as insignificant.
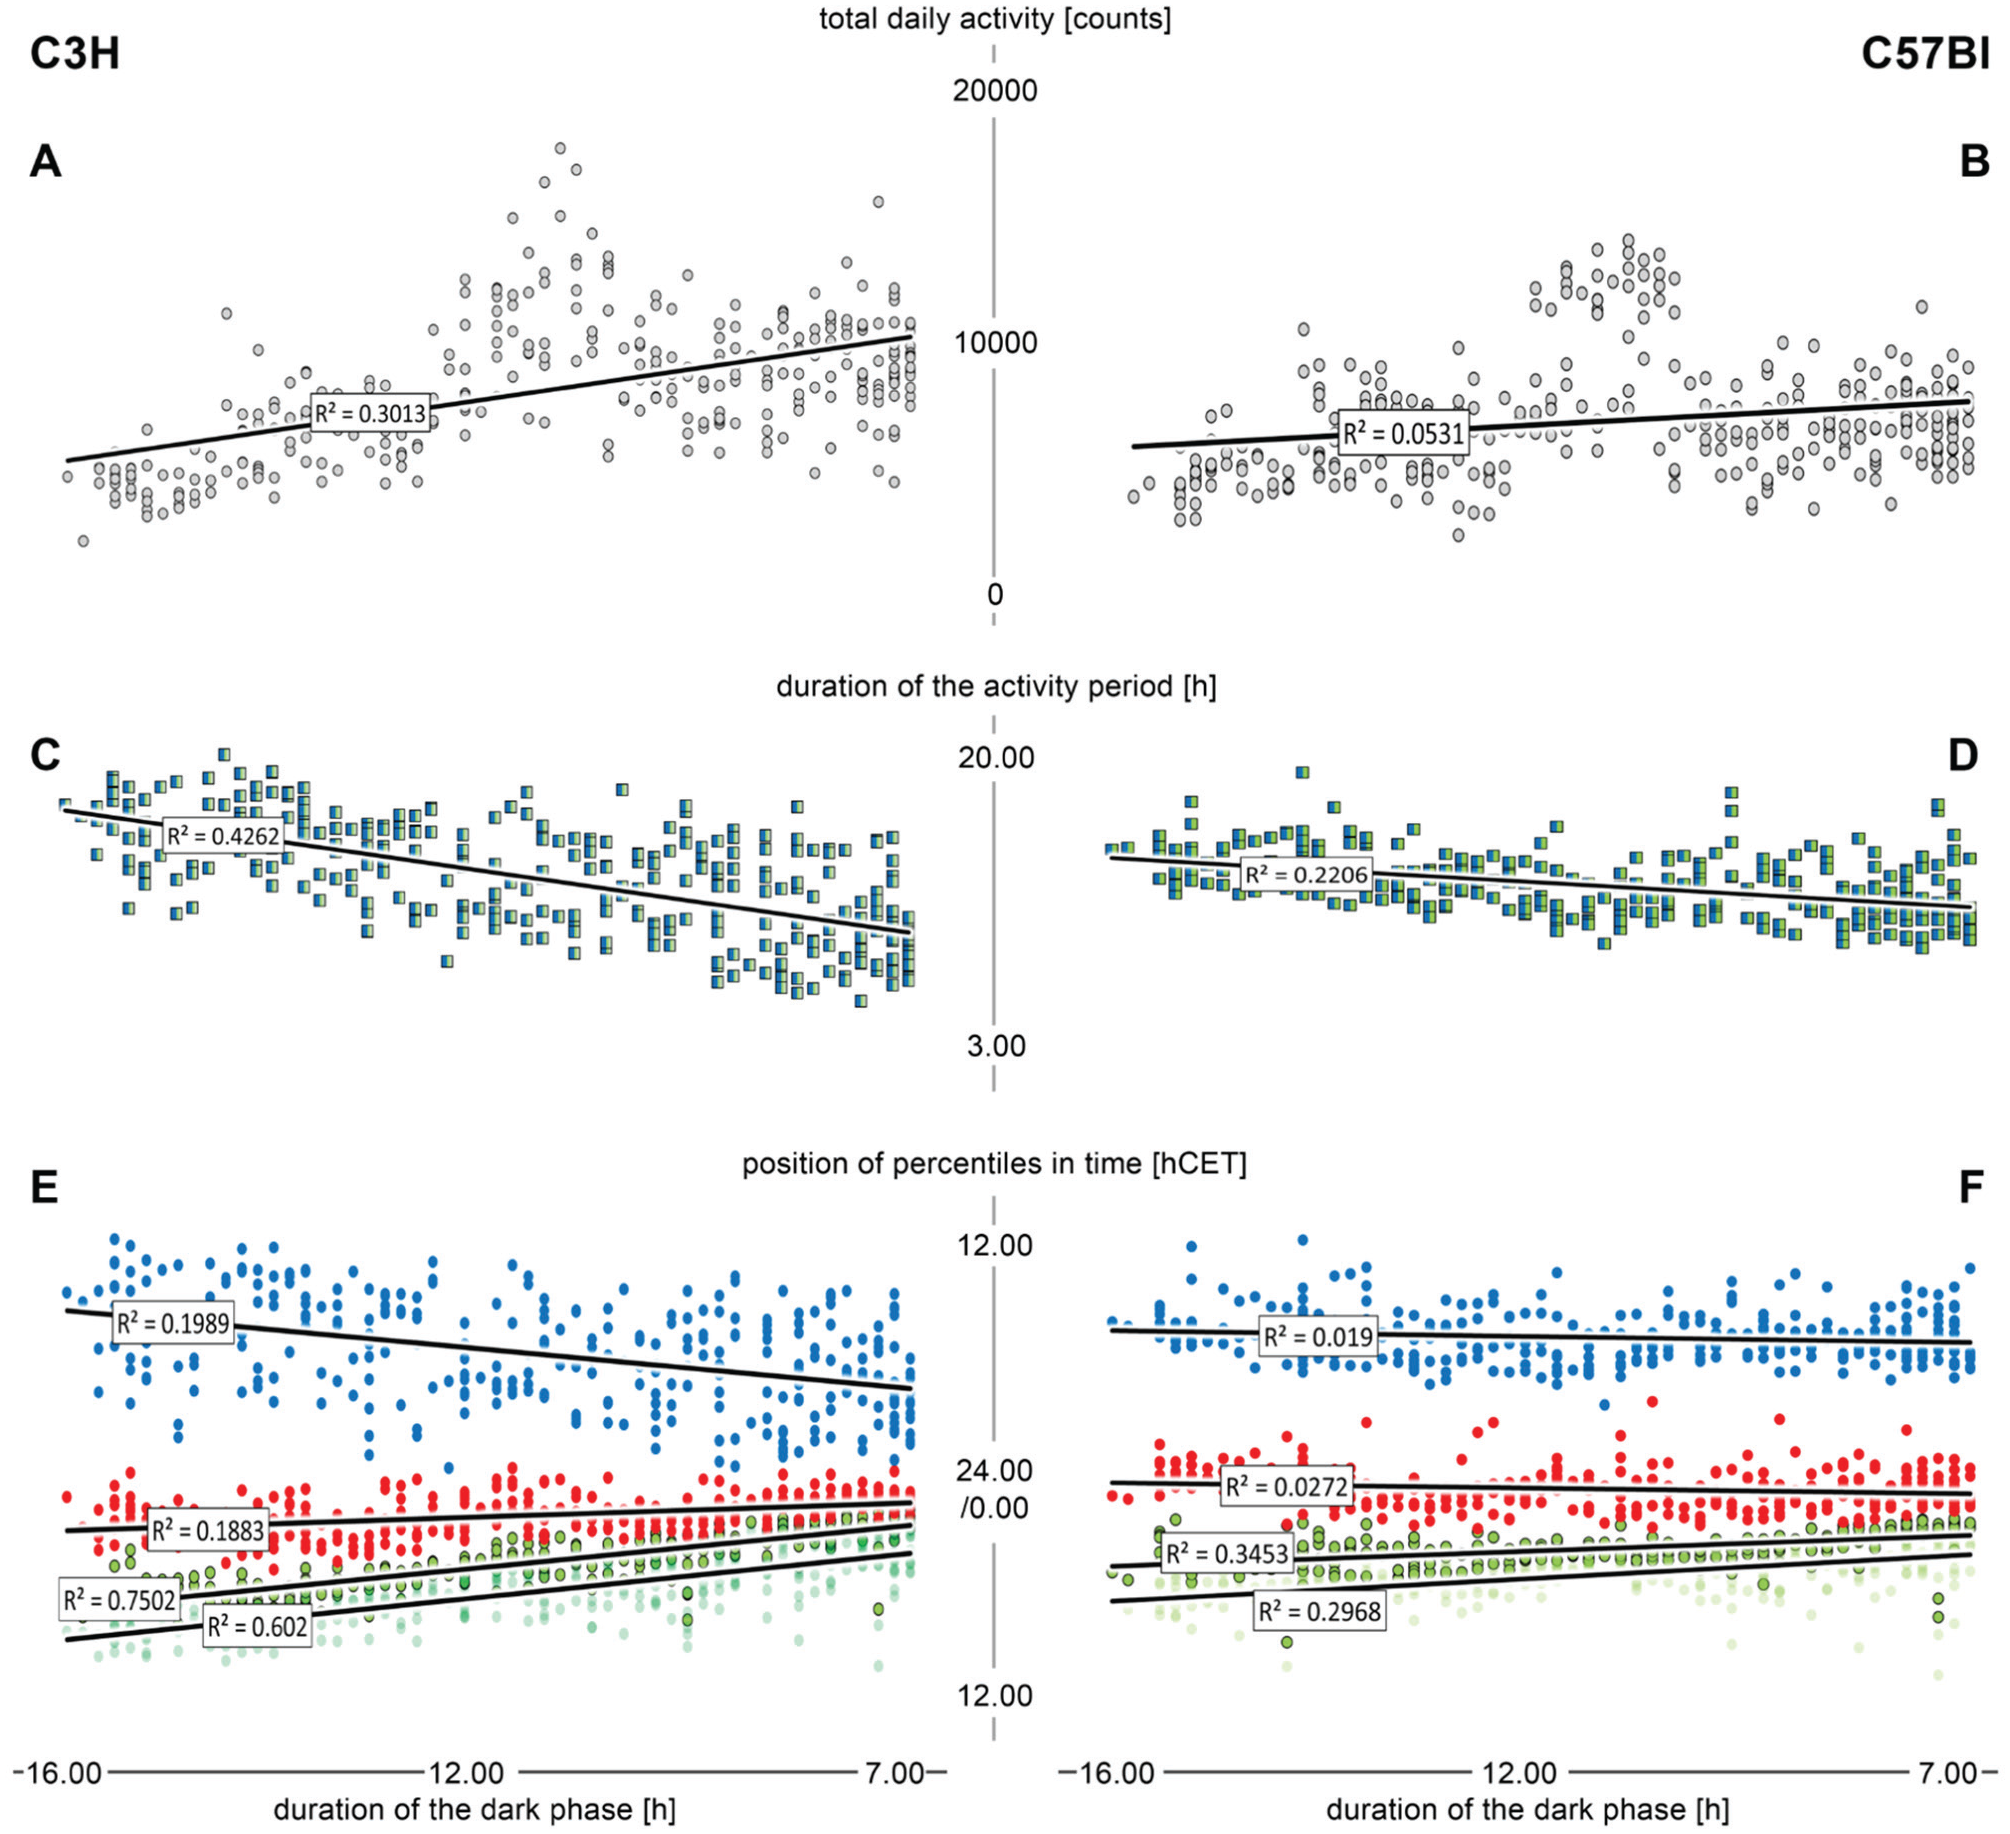
A correlational analysis (based on the daily measurements of the individual mice) of the duration of the dark phase versus total daily activity (A, B), duration of the activity period (C, D), and the timing of the 10% (light green), 20% (dark green), 50% (red), and 90% (blue) percentiles (E, F) in C3H mice (left) and C57Bl mice (right). The regression lines and the corresponding r2 values stem from linear Pearson correlations.
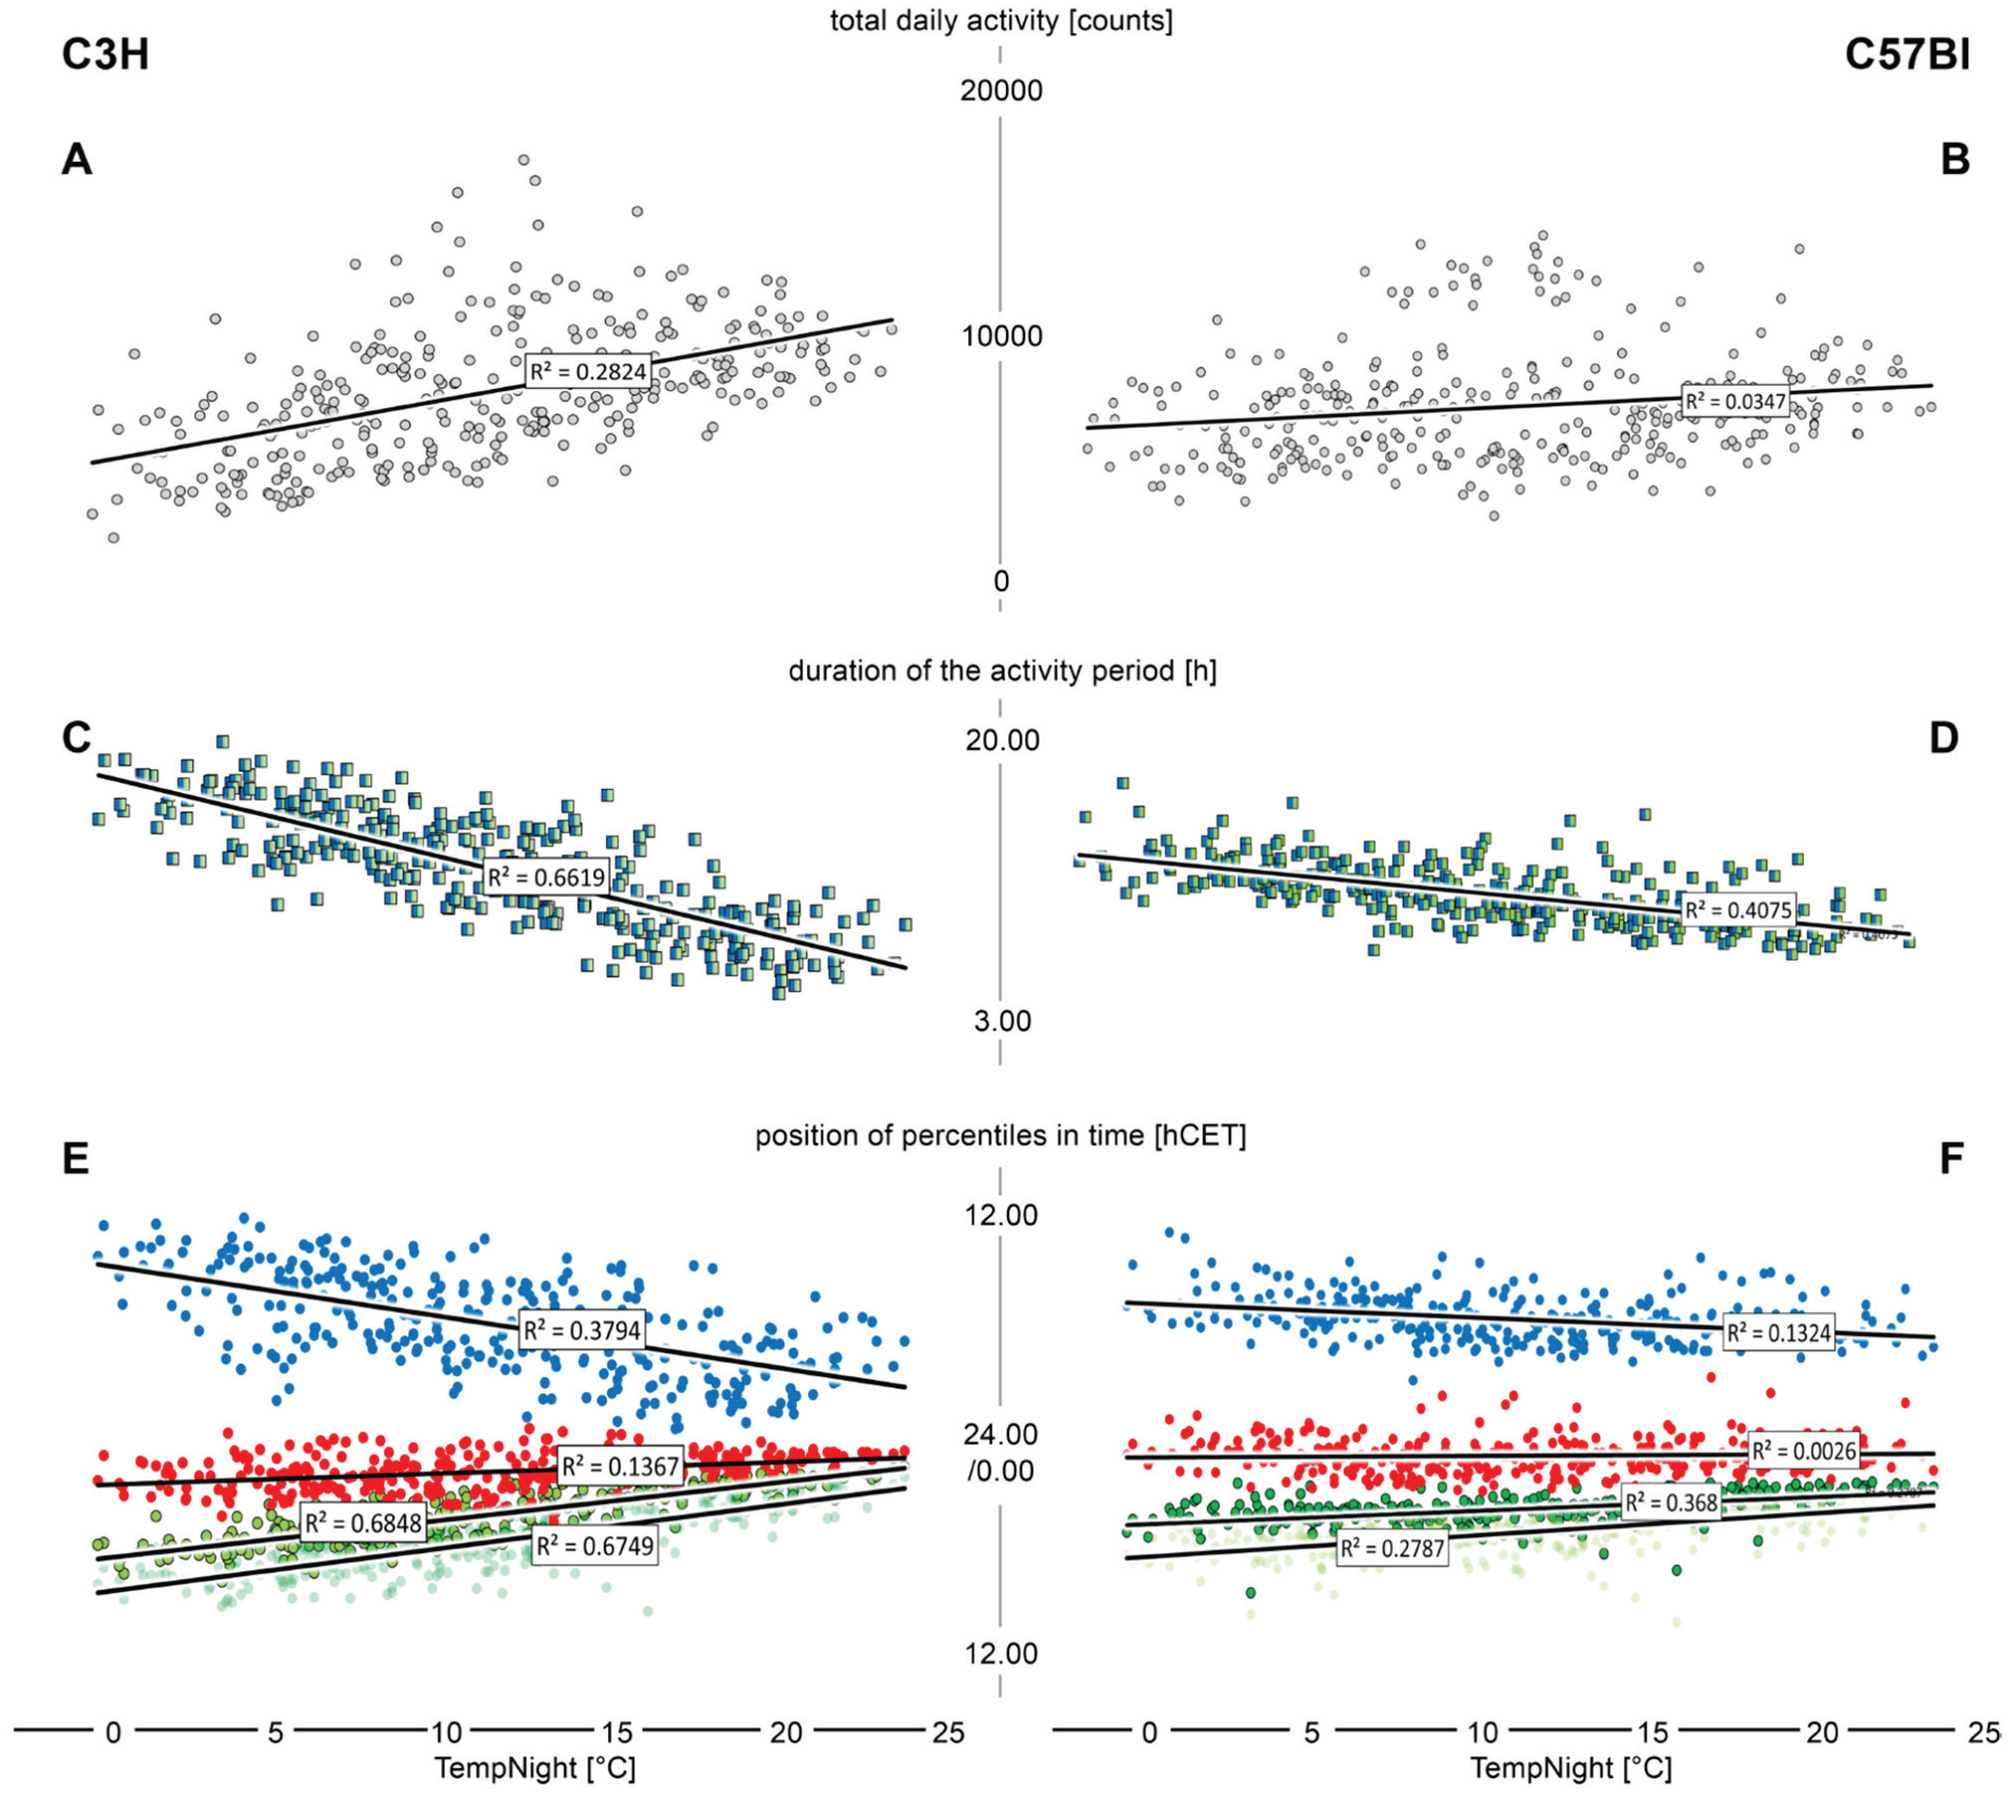
Correlational analysis (based on the daily measurements of the individual mice) of the nightly average temperature versus total daily activity (A, B), duration of the activity period (C, D), and the timing of the 10% (light green), 20% (dark green), 50% (red), and 90% (blue) percentiles (E, F) in C3H mice (left) and C57Bl mice (right). The regression lines and the corresponding r2 values stem from linear Pearson correlations.
Statistical Comparisons
The large data sets from the seasonal averaging procedures showing normal, Gaussian distributions were compared using Student’s t-test (2 sided). Since these tests included multiple (i.e., 365) comparisons of 30-day samples with the full-year sample (see above), we performed a Bonferroni correction and reset the significance level for these tests to p < 0.00001. The Mann-Whithey U-test was used to compare the smaller (non-Gaussian) data sets from the yearly averages and the correlational analyses.
Fourier Analysis
To reveal the possible presence of infra- or ultradian rhythms, we entered the raw data on locomotor activity [counts/10 min] for each mouse in an Internet-based tool for Fourier analyses (https://sooeet.com/math/online-fft-calculator.php).
Results
Animal Health
All animals survived the outdoor stay over 365 days without noticeable health problems. During the experiment, there were no significant changes in body weight; the average weight of the C57Bl/C3H was 25.3/31.4 g in the beginning of the experiment and 25.7/33.0 g at the end. We did not observe any parasites (ticks or alike) on the mice or in the cages.
Spectral Analysis
Within the first 2 weeks after the release into outdoor conditions, all mice were entrained to the sidereal cycle, as seen in the fast Fourier analysis of the frequency spectrum of the locomotor data (Fig. 3). There was only power in the 1-cycle/day frequency in both strains. We could not detect any infra- or ultradian rhythms; in particular, we did not find any signs of spectral power within the 7-day (weekday/weekend) range. We could also not detect any rhythmicity within a 30 -day (lunar) period.
Overall Analysis/Grand (Yearly) Means
By and large, the 2 strains retained their locomotory pattern as known from the laboratory, with a double-peak activity pattern and relatively late chronotype in the C57Bl mice and a single-peak pattern and a relative early chronotype in the C3H animals (Fig. 5B). The stability of the chronotype—in the grand mean—did not differ (Fig. 5C). On average, the C3H mice were more active (Fig. 5A) and had a longer main activity period (Fig. 5D). Both strains remained chiefly nocturnal, but overall, the C3H mice showed significantly more daytime activity than the C57Bl mice (Fig. 5E).
Correlational Analyses
We did, of course, find a very strong correlations between the abiotic parameters. The timing of lights-off [hCET] predicts that of lights-on [hCET] with almost 100% certainty (r2 = 0.99; data not shown); therefore, the duration of the dark phase [h] can be used to substitute these 2 measures in the correlations. The duration of the dark phase [h] is also a good predictor of all parameters related to temperature and humidity (in the range of r2 = 0.60; data not shown). Yet, we could not find any noteworthy correlations between the behavioral data and the humidity or the cloud data (data not shown), but light and temperature do correlate with the timing of behavioral features (see below).
In Figure 7, we plotted the duration of the dark phase versus the total daily activity, the duration of the activity period, and the temporal positions of some of the percentiles. The 20% percentiles are most tightly coupled to the duration of the dark phase in both strains; notably, the coupling is much stronger in the C3H (Fig. 7E) than in the C57Bl (Fig. 7F). This difference in the coefficients of determination is significant (Fig. 5F). In the later percentiles (50%, 90%), the coupling becomes increasingly weaker in the C3H (Fig. 7E) and even vanishes completely in the C57Bl (Fig. 7F), where the slope of the regression lines is close to zero. Correspondingly, the duration of the dark phase has very little predictive power on the duration of the main activity period in C57Bl (Fig. 7D) and only moderate such power in C3H (Fig. 7C). The predictive power of the duration of the dark phase on the total daily activity is practically absent in C57Bl and very moderate in C3H (Fig. 7A, B).
Ambient temperature influences the timing as well. We found that the average temperature during the dark phase (TempNight [°C]), when the mice are active, had the most predictive power. The correlations versus the total daily activity, the duration of the activity period, and the temporal positions of the percentiles are plotted in Figure 8. Notably, the total daily activity did not correlate or only barely correlated with the ambient temperature at night in both strains (Fig. 8A, B). The timing of activity, however, did. The temperature at night is a good predictor for the timing of the early percentiles (Fig. 8E, F), but its predictive power is less than that of the duration of the dark phase (compare Figs. 7E, F and Fig. 8E, F). There was, however, a good correlation between the duration of the activity period and the temperature at night in the C3H strain (Fig. 8C) and a moderate correlation in C57Bl animals (Fig. 8D), which, in both cases, are stronger correlations than those supplied by the duration of the dark phase (see above and compare with Fig. 7C, D). The same holds true for the relations of the nightly temperature to the 90% percentiles. Again, if one compares the slopes, the C57Bl are less influenced by this parameter than the C3H.
Seasonal Variations
The C3H mice showed clear seasonal differences in the chronotype (Fig. 6C) and the stability of the chronotype (Fig. 6E). The animals shift to a later and much more stable chronotype in summer. Moreover, they show more total daily activity in summer than in winter (Fig. 6A), and the duration of the activity period is shorter in summer than in winter (Fig. 6G). These seasonal differences were not observed in the C57Bl mice (Fig. 6B-H). The C57Bl animals do not regulate their chronotype in a seasonal manner (Fig. 6D) and have stable and unstable periods that alternate in a nonpredictable manner (Fig. 6F). In the C57Bl animals, the seasonal regulation of the duration of the activity period is not as pronounced as in C3H mice (Fig. 6H). The C57Bl display much more daytime activity in summer than in winter (Fig. 6J). This activity occurs particularly right after dawn (Fig. 3C, D). The C3H mice showed a different pattern (Fig. 6I). They had a relatively diffuse daytime activity in spring and summer that vanished after the summer solstice (see also Fig. 3A, B).
With regard to the total daily activity, we observed 2 periods of increased activity (“arousal”) in both strains, around the time of the equinoxes: one in spring and one in autumn (Fig. 3; Fig. 6A, B). The arousal was stronger in autumn than in spring, and it could not be correlated with any of the abiotic parameters or any unusual observations. Both arousal periods occurred at times when the temperature at night was between 10 and 15 °C (Fig. 8A, B).
At the end of the experiment, some C57Bl mice did lose their biphasic activity pattern and switched to a more diffuse but still nocturnal activity pattern (Fig. 3). The C3H animals, on the other hand, did not show any sign of such a pattern change within the duration of the experiment (Fig. 3).
Discussion
Indoors-Outdoors
Under the conditions we have chosen, several results obtained under the entraining conditions in the anatomical backyard resemble those obtained in the laboratory flanking that yard (Banks et al., 2015; Pfeffer et al., 2012; Pfeffer et al., 2017; Shimomura et al., 2001; von Gall et al., 1998; Wicht et al., 2014). The C3H animals did retain their earlier chronotype and their monophasic activity pattern; the C57Bl animals showed a biphasic activity pattern and a later chronotype, as they do in the lab. Both mouse strains maintained their predominantly nocturnal phenotype.
This is in contrast to the findings of 2 recent studies, which showed that the activity of mice changed to a diurnal pattern during the summer months under seminatural conditions (Daan et al., 2011; Spoelstra et al., 2016). These studies, however, were carried out in large enclosures with hundreds of freely moving mice of both sexes; they were reproducing and had to avoid (airborne) predators. Furthermore, these studies did not record entire daily activity profiles but only counted approaches to the food source that was supplied within the enclosures, at which the mice again had to compete for food (Daan et al., 2011; Spoelstra et al., 2016).
The diurnal pattern observed in these mice during the summer months may thus rather reflect the feeding rhythm in a competitive environment. It is known that a negative energy balance can induce a change in the circadian phenotype, probably as part of an energy-saving strategy (Hut et al., 2011; Schubert et al., 2010; van der Vinne et al., 2014). Indeed, the circadian organization in nocturnal mammals shows considerable phenotypic plasticity in response to energetic challenges (Mistlberger, 2009). However, under the energy-balanced condition, which we provided in our outdoor study (and also in all previous laboratory studies), food intake will primarily occur during the night (for a laboratory study, see Fischer et al., 2017).
Behavioral differences between indoor and outdoor conditions are also known from other rodents (reviewed by Calisi and Bentley, 2009); often, individual animals of a species that shows a diurnal behavior in the field will (individually) switch to either nocturnal, crepuscular, or fragmented activities in the laboratory. Notably, these observations are based not on inbred but on natural heterozygous populations of animals, which may account for the differences between these individuals and our inbred mice.
Photoperiod, Temperature, and Entrainment
The photoperiod was the most potent abiotic entraining factor under the outdoor conditions we have chosen, quite irrespective of the light intensity, since the timing of the behavior did not differ between cloudy and sunny days. Moonlight and moon phase have been shown to suppress activity in nocturnal rodents (Prugh and Golden, 2014). However, we could not detect any influence of moonlight on the activity level of both mouse strains. This might be due to the location of the city in our experiment. The street lights probably extinguished the possible effects of moonlight. Furthermore, no ultradian rhythms or any signs of spectral power within the 7-day range, which would unravel a weekday/weekend pattern, were observed. This shows that the mice did not entrain to the human activities in their surroundings, which differ between weekdays and weekends.
The sidereal shift of the photoperiod combined with the percentile method used here permitted a numerical, quantitative analysis of the entraining effect of the photoperiod. The behavior of both mouse strains is chiefly entrained at the beginning of their main activity period; the timing of the “early percentiles” (10%/20%) is under a much greater influence of the photoperiod than that of the late percentiles. As evident from the magnitude of the coefficients of determination, this effect is much more pronounced in the C3H than in the C57Bl mice.
Since the early percentiles occur around dusk, it seems quite likely that the disappearance of light (lights-off) is the main entraining signal. In this context, it should be noted that lights-off elicits electrical activity in subsets of SCN neurons in rodents (Aggelopoulos and Meissl, 2000; van der Leest et al., 2007) and may thus indeed trigger immediate behavioral responses.
Whereas lights-off clearly entrains the onset of the main activity period, the later percentiles are barely affected by light. This raises the question as to which factor(s) determine(s) the end and, thus, the duration of the activity period. In the C3H mice, the photoperiod has a moderate influence, since the duration of the dark phase predicts approximately 40% of the duration of the activity period. However, the remaining 60% of the variations appear to be affected by stimuli not yet identified. In C57Bl animals, the duration of the activity period is not at all affected by the photoperiod, and thus, other stimuli are definitely needed to determine this parameter.
In fact, temperature may have a major influence. Among all parameters we determined, the temperature (in particular, the temperature at night in the respective cycle) was the best predictor of the duration of the activity period in that cycle. The predictive power of this parameter with regard to the duration of the activity period is higher than that of the duration of the dark phase and amounts to 65% in C3H and 40% in C57Bl. Indeed, ambient temperature has been shown to trigger substantial changes in rhythmicity in mice and voles (Ishii et al., 1996; Refinetti, 2010), and with regard to entrainment strength, temperature can be a modulator as strong as light (Refinetti, 2015).
The total daily activity of both strains varied in a manner that was nearly unpredictable from the daily abiotic cues. In the C3H group, there was higher activity on short, warm nights, while the C57Bl group did not show any trend at all. Notably, the C3H mice were more active under the outdoor conditions as compared with the C57Bl animals, whereas, under laboratory conditions, the total activity levels of the 2 strains did not differ (Homola et al., 2015; Wicht et al., 2014).
Strain-Specific Differences and Entrainment
Also in the laboratory, differences in the entrainability of the 2 strains are evident: the strains differ in terms of the light-induced phase shift in locomotor activity (Pfeffer et al., 2012; von Gall et al., 1998). Jet lag experiments in the laboratory have shown that the C3H reentrains almost twice as fast as the C57Bl (Pfeffer et al., 2012; Pfeffer et al., 2018).
The differences in the entrainability between the 2 strains may be attributed to differences in the melatoninergic system (Pfeffer et al., 2012; Pfeffer et al., 2018; von Gall et al., 1998). The C57Bl mice are melatonin deficient due to a truncation in the gene encoding the AANAT (Roseboom et al., 1998), whereas the C3H mice are melatonin proficient (Goto et al., 1989). Melatonin, the hormone of the pineal gland, is secreted at night, and the duration of melatonin production reflects the duration of the dark period. Thus, daily melatonin secretion is prolonged in winter (when nights are longer) as compared with the summer (Illnerova and Vanecek, 1985; Pévet, 2003). Therefore, melatonin is believed to be a major endocrine output signal of the timekeeping system (Korf et al., 2018; Pévet, 2002) that synchronizes the remainder of the body with the clock. Melatonin deficiency or the deletion of both melatonin receptors (MT1 and MT2) have been shown to decrease the stability of activity rhythms in mice also under stable laboratory conditions (Pfeffer et al., 2017).
Therefore, it is tempting to speculate that some differences between both strains may be related to their melatonin proficiency or deficiency, respectively. However, it should be borne in mind that the 2 strains also differ in many other respects. One example is the visual and circadian function of the retina. C3H mice are visually blind due to retinal degeneration, but they retain the melanopsin-containing ganglion cells that are important for the entrainment of the circadian system (reviewed by Peirson et al., 2018). Strangely enough, the visually blind C3H do couple their behavior much more tightly to the photoperiod than the C57Bl, and there currently is no explanation for this effect.
Seasonality
An important finding of our study concerns seasonality. The C3H animals “do follow the seasons,” while the C57Bl do not. In particular, the C3H have a relatively short activity period, relatively high levels of activity, and a relatively late and stable chronotype in summer; the situation is reversed in winter. A seasonal plasticity of the chronotype in man has been reported in previous studies (Allebrandt et al., 2014; Murray et al., 2003; Shawa et al., 2018); our study indicates that this plasticity may, in fact, have a genetic background.
Such pronounced seasonal changes did not occur in the C57Bl mice. The nonalignment with the photoperiod is reflected in their diurnality index: their low entrainability leads to a (pseudo-)regulation of their diurnality, as seen in Figure 6J. Simply because they will not follow the photoperiod, the late stretches of their main activity period in summer will occur after dawn. If such a nonentrainment occurred in wild mice out in the field, it would actually open a (potentially dangerous or advantageous) temporal ecological niche that could not be occupied by animals that are more strictly entrained to the photoperiod.
At the end of the experiment, some C57Bl mice lost their biphasic pattern, switching to a more diffuse activity pattern, but they stayed nocturnal. It is tempting to attribute this phenomenon to the aging of the animals during the experiment, since it is known that the circadian output loses its strength with age (Banks et al., 2015; Farajnia et al., 2012; Nakamura et al., 2011). Under laboratory conditions, desynchronized activity rhythms become apparent at the age of 18 months or 500 days, respectively (Banks et al., 2015; Farajnia et al., 2012), but middle-aged mice already show fragmented activity patterns (Nakamura et al., 2011). Our mice were well under 18 months of age, but under seminatural conditions, there are more changing variables in contrast to the laboratory, which might put additional stress on the entrainability of these mice. Again, the stabilizing factor may be melatonin, since the melatonin-proficient C3H animals did not show altered activity rhythms within the time span of the experiment. In addition, also under stable laboratory conditions, melatonin deficiency or the deletion of both melatonin receptors has been shown to decrease the stability of activity rhythms in mice (Pfeffer et al., 2017).
Both mouse strains did show significantly increased levels of total daily activity around the time of the spring and autumn equinoxes, and one is inclined to speak about “arousal.” These periods of arousal could not be correlated with any of our measured parameters (i.e., temperature, humidity, or any unusual observation). From an astronomical point of view, the weeks around the equinoxes are characterized by the most rapid changes in the duration of the light and dark phase. The endogenous oscillator in the SCN does, of course, entrain to the seasons (van der Leest et al., 2007) and is thus subjected to the most rapid shifts in the entraining stimuli around the equinoxes. This might arouse a mouse.
It might arouse a mouse researcher that—under these conditions—it might not be the best idea to keep mice in the lab under 12:12 light/dark cycles. For C3H mice in particular, this cycle length corresponds to the time point at which they “switch” forth and back from their early and relatively unstable winter chronotype to the later and much more stable summer type.
Footnotes
Acknowledgements
This work was supported by the Dr. Senckenbergische Stiftung (H.-W. Korf). We thank Claudia Fischer for assistance with the mice.
Conflict Of Interest Statement
The authors have no potential conflicts of interest with respect to the research, authorship, and/or publication of this article.