
Abstract
Circadian misalignment between sleep and behavioral/feeding rhythms is thought to lead to various health impairments in shift workers. Therefore, we investigated how shift work leads to genome-wide circadian dysregulation in hospital nurses. Female nurses from the University of Alabama at Birmingham (UAB) Hospital working night shift (n = 9; 29.6 ± 11.4 y) and day shift (n = 8; 34.9 ± 9.4 y) participated in a 9-day study measuring locomotor activity and core body temperature (CBT) continuously. Additionally, cortisol and melatonin were assayed and peripheral blood mononuclear cells (PBMCs) were harvested for RNA extraction every 3 h on a day off from work. We saw phase desynchrony of core body temperature, peak cortisol, and dim light melatonin onset in individual night-shift subjects compared with day-shift subjects. This variability was evident even though day- and night-shift nurses had similar sleep timing and scheduled meal times on days off. Surprisingly, the phase and rhythmicity of the expression of the clock gene, PER1, in PBMCs were similar for day-shift and night-shift subjects. Genome-wide microarray analysis of PBMCs from a subset of nurses revealed distinct gene expression patterns between night-shift and day-shift subjects. Enrichment analysis showed that day-shift subjects expressed pathways involved in generic transcription and regulation of signal transduction, whereas night-shift subjects expressed pathways such as RNA polymerase I promoter opening, the matrisome, and endocytosis. In addition, there was large variability in the number of rhythmic transcripts among subjects, regardless of shift type. Interestingly, the amplitude of the CBT rhythm appeared to be more consistent with the number of cycling transcripts for each of the 6 subjects than was melatonin rhythm. In summary, we show that shift-work patterns affect circadian alignment and gene expression in PBMCs.
The circadian clock anticipates regularly occurring changes in the environment and synchronizes organisms accordingly. Circadian timing is achieved by core negative and positive feedback loops that drive 24-h rhythms in the transcriptome (Partch et al., 2014). In humans undergoing forced desynchrony, e.g. when sleep during normal bedtime hours is prevented, sleep occurs out of phase with melatonin rhythm (Wyatt et al., 1999). In these misaligned conditions, the percentage of rhythmic transcripts in the whole blood of healthy non-shift workers decreases dramatically (Archer et al., 2014). This type of circadian misalignment likely occurs during shift work; although, molecular evidence for this is lacking.
Circadian misalignment provides a probable explanation for the various health impairments seen in shift workers, now approximately 1 in 6 Americans (Archer et al., 2014; Boivin and Boudreau, 2014; Faraut et al., 2013; Gamble et al., 2013; Haus and Smolensky, 2013; Knutsson and Kempe, 2014; Petrov et al., 2014; Reutrakul and Knutson, 2015; Vetter et al., 2015; Wright, Bogan, et al., 2013). In shift work, the degree of circadian misalignment depends on an individual workers’ intrinsic circadian behavior (Roenneberg, 2015; Vetter et al., 2015). For example, Vetter et al., recently examined the effects of an individualized shift schedule intervention based on workers chronotype. Workers with these individualized shift schedules reported improved sleep duration and quality, as well as an enhanced sense of wellbeing. Importantly, the individualized work schedule diminished social jetlag—the shift in sleep timing between work days and free days (Foster et al., 2013; Haraszti et al., 2014; Wittmann et al., 2006)—suggesting that misalignment on free days is an important factor to consider when assessing the impact of shift work.
Here, we sought to determine the degree of circadian misalignment between hormonal and transcriptional rhythms and the timing of sleep-wake behavior in day-shift and night-shift hospital nurses. After continuous measurement of actigraphy and core body temperature rhythms over an 8-day period, we assessed 24-h rhythms in plasma cortisol and melatonin in both shift regimens on a day off. Secondly, we conducted a genome-wide microarray analysis on mRNA isolated from PBMCs to examine the individual variability of hormonal and transcriptional rhythms. Despite greater misalignment in night-shift nurses (compared with day-shift nurses), we discovered that peripheral clock gene expression rhythms were not dramatically altered. Moreover, individual variability in the abundance of rhythmic transcripts in PBMCs was consistent with CBT rhythmicity but not melatonin rhythmicity. Collectively, these results highlight the importance of the environment (recent sleep-wake behavior or feeding-fasting cycle) for rhythmic gene expression in the periphery under periods of internal desynchrony.
Materials and Methods
Subjects
Nine female night-shift nurses (aged 29.6 [11.4] y; mean [SD]) and 8 female day-shift nurses (aged 34.9 [9.4] y) were recruited from the UAB Hospital Nursing Staff from flyers and presentations. Interested subjects called the Office of Psychiatric Clinical Research (OPCR) and were phone screened for inclusion/exclusion criteria. Participants met inclusion criteria if they worked full time (> 26 h/week) as a hospital shift-work nurse, were at least 19 y or older, could schedule 3 consecutive work shifts (beginning or ending at 0700 h or 0800 h) followed by at least 3 days off, had a current schedule that was consistent for the previous 3 weeks, and had at least 1 y of night-shift experience (night-shift nurses only). Study days were scheduled for a period of time during which the participants were not traveling across time zones, avoiding major holidays. Participants completed the protocol at least 3 weeks from the change in daylight savings time (with the exception of one participant whose 24-h study day was 9 days after daylight savings time began).
Exclusion criteria included women who were pregnant or nursing; currently working multiple jobs; diagnosed with a psychiatric illness or substance abuse (determined by Mini International Neuropsychiatry Interview or MINI); diagnosed with a primary sleep disorder other than shift work sleep disorder; a habitual smoker; or who used sedating medications, including tranquilizers. Some participants were taking oral contraceptives (2 day-shift nurses and 2 night-shift nurses). We additionally excluded men (15% of workforce) to reduce sex-related variability (Cain et al., 2010) and increase statistical power. Because the most common sleep strategy of hospital nurses is to sleep at night on days off (97% of hospital nurses) (Gamble et al., 2011; Petrov et al., 2014), we excluded nurses who primarily slept during the day on free days.
After providing informed consent, subjects participated in a 9-day study (approved by the UAB Institutional Review Board) during which sleep-wake actigraphy and core body temperature were continually measured via VitalSense and Actiwatch-Spectrum monitors (Respironics, Inc., Murrysville, PA) in conjunction with a sleep diary (Figure 1A). All participants were asked to refrain from alcohol during the entire 10-day assessment.
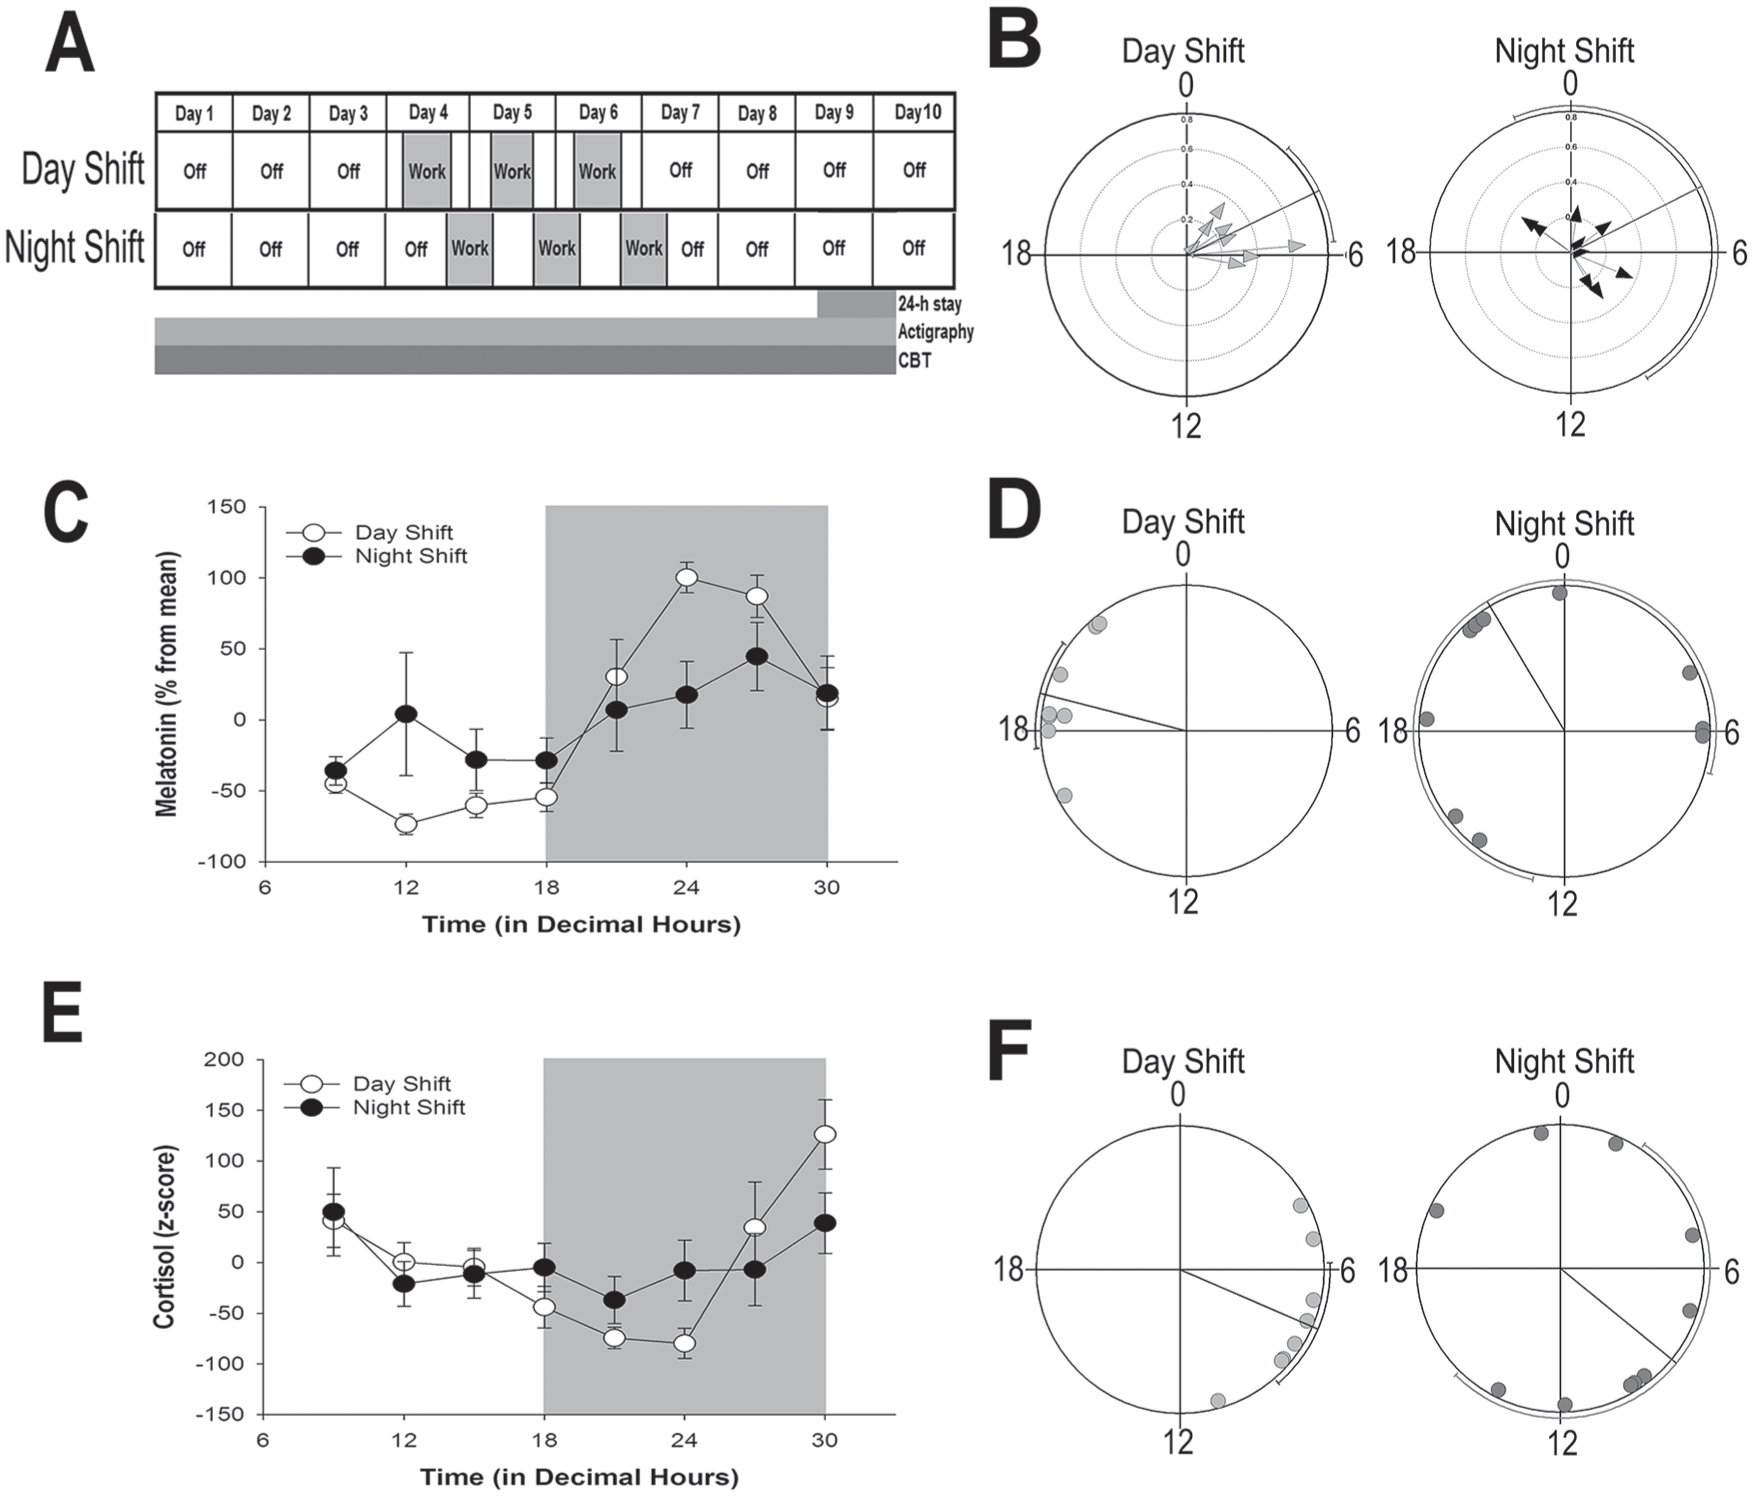
Shift-work schedule and rhythmic indicators of the central circadian clock. (A) Shift-work schedule of UAB nurses enrolled in the study. Ambulatory activity and sleep from actigraphy and CBT were monitored continuously for 10 days. The shift cycle (indicated in gray) consisted of 3 consecutive 12-h shifts. On study day 9, participants spent 24-h in the UAB Clinical Research Unit (CRU) for continuous blood draws. (B) Phase clustering of CBT minimum on day 9 for individual day-shift (left) and night-shift (right) nurses plotted against time (in decimal hours). Hourly averages of CBT for individual nurses are shown in Supplementary Figure S2. (C, E) Average (± SEM) normalized melatonin (C) and cortisol (E) rhythms on study day 9 in day-shift (open circles) and night-shift (closed circles) nurses across time of day (in decimal hours). (D, F) Phase clustering of dim-light melatonin onset (DLMO; panel D) and peak cortisol (F) for day-shift (light gray circles) and night-shift (dark gray circles) nurses. Rayleigh test confidence intervals are indicated by lines paralleling circle circumference, where clustering of both DLMO and cortisol peak for day-shift nurses indicated statistical significance (p < 0.001). Confidence intervals for night-shift nurses were not significant (p > 0.05) for either cortisol or DLMO.
On day 8, participants were also instructed to refrain from eating after 2100 h and to report to UAB Hospital Admitting at 0830 h on the morning of day 9 for admission to the UAB Hospital Clinical Research Unit (CRU). During the next 24-h, whole blood was sampled in a series of 8 time-points (3 h apart) beginning at 0900 h. For both shift types, 3 meals and one snack consisting of 25% fat, 50% carbohydrate, and 25% protein (as in Scheer et al., 2009) were served immediately after the first blood draw (0900 h), and after subsequent blood draws at 1200 h (lunch), 1500 h (snack), and 1800 h (dinner). To minimize the influence of the LD cycle, room lighting conditions were maintained at less than 5-lux to allow accurate melatonin assessment. In addition, the hallway light was blocked by an interior room curtain, and participants wore blue-light blocking glasses and utilized blue-light blocking screen covers for television and electronic devices (from https://www.lowbluelights.com). All lights remained off, and during sleep sessions, CRU staff used a dim red flashlight for all procedures required during the dark. On the morning of day 10, participants were de-briefed and monitoring devices returned.
Blood Sampling and Hormonal Assays
On day 9, 6 ml whole blood was sampled at each of the 8 time points (3 h apart) through an 18-gauge in-dwelling catheter into 2 tubes: 1 ml for plasma isolation, and 5 ml for PBMC isolation. Catheters were kept clear in between sampling by infusion of 0.45% saline at a rate of 20 ml/h. Plasma and PBMCs were isolated and rapidly frozen from blood samples obtained every 3 h from 0900 h to 1800 h. Blood components were immediately separated from anti-coagulated whole blood (5 ml) with density gradient centrifugation (A7054 Histopaque-1077; Sigma-Aldrich, St. Louis, MO). Isolated plasma and mononuclear cells (suspended in Trizol, Invitrogen; Carlsbad, CA) were immediately flash-frozen in liquid nitrogen and stored at −80°C until assayed. Plasma cortisol and melatonin were assayed using Milliplex HNPMAG-35K (Sigma-Aldrich; intra-assay CV <10% and inter-assay CV <20%) and Genway GWB-7A8704 (GenWay Biotech, San Diego, CA; intra-assay CV 3.0% to 11.4% and inter-assay CV 6.4% to 19.3%) kits, respectively.
RNA isolation and Quantitative RT-PCR
Isolated PBMCs samples, flash-frozen in Trizol (Invitrogen), were thawed on ice and transferred to Polystyrene tubes. RNA was extracted and treated with DNase I (Invitrogen) according to the manufacturer’s protocol. cDNA was synthesized with SuperScript VILO MasterMix (Invitrogen) according to the manufacturer’s protocol. Candidate gene expression analysis was performed by quantitative RT-PCR, using methods described previously (Gibson et al., 1996; Heid et al., 1996; Versteegh et al., 2012). For quantitative RT-PCR, specific human TaqMan assays were designed for genes BMAL1, PER1, PER2, 18s RNA available in GenBank. Commercially available assays were used for PER3 (TaqMan Gene Expression Assay; Invitrogen, Cat: 4351370) and Reverbα (NR1D1; Invitrogen, Cat: 4351370). All quantitative RT-PCR data were normalized to ng/µl and converted to z-scores. The housekeeping gene 18S ribosomal RNA did not show a significant circadian rhythm for either shift group (cosinor analysis, Day: R2 = 0.001, p = 0.98, Night: R2 = 0.008, p = 0.80)
Microarray Processing and Analysis
Sample processing for microarray was done by the UAB Heflin Center for Genomic Science. Six subjects were selected for microarray analysis (blood samples obtained every 3 h from 0900 h to 1800 h, except one missing sample for each of 4 subjects), with 3 subjects in each group. For each subject, RNA samples isolated from PBMCs over a 24-h period were assayed with over 47,000 probes using an Illumina HT-12v4 GX microarray to determine the 24-h time course of the peripheral transcriptome. Raw expression profiles were extracted with GenomeStudio (https://www.illumina.com/techniques/microarrays/array-data-analysis-experimental-design/genomestudio.html) from the IDAT files. The lumi package (Du et al., 2008) was used to perform log2 transformation and quantile normalization suggested in the evaluation work from Schmid et al. (2010). Rhythmic 24-h patterns of transcription were detected in day-shift and night-shift nurses using JTK_CYCLE (Hughes et al., 2010), by applying meta3d function in MetaCycle (Wu et al., 2016). A fixed 24-h period length was used, given that only a single cycle of data was collected. To identify time-dependent biological processes with 24-h variation, transcripts without annotation and/or with low expression (log2(meta3d_Base) < 7.3) were filtered out. If multiple transcripts annotated to the same gene, one representative transcript with the lowest P value and the largest rAMP was selected. Rhythmic genes were selected based on meta3d p < 0.1 and rAMP > 0.1. Phase Set Enrichment Analysis (PSEA) was used to detect enriched biological processes based on the phase distribution of their genes (Zhang et al., 2016). For the detailed analysis and computation pipeline, see Supplementary Experimental Procedures (Supplementary Figure S1). The data reported in this paper have been deposited in the Gene Expression Omnibus (GEO) database with accession no. GSE122541.
Statistical Analysis
All analyses were conducted with IBM SPSS Statistics 22.0, R 3.3.0 and Oriana 4.02 (Kovach Computing Services; Pentraeth, UK). Significant circadian rhythms were detected with either MetaCycle (see above) or nonlinear cosinor regression analysis (as in Uddin et al., 2015). Rayleigh tests were used to determine significant clustering and circular means and variances. Differences between the 2 groups in the outcome variables were analyzed using independent samples t tests. For all analyses, statistical significance was ascribed to <0.05 unless specified. For analysis of qRT-PCR experiments, data points which were >3.0 SDs from the mean were excluded as outliers.
Results
Table 1 shows the sleep duration and sleep efficiency (measured via actigraphy) during the first eight days of the 9-day protocol. These parameters did not significantly differ between day and night-shift nurses on free days (t(15) = 1.06, p = 0.31). However, sleep duration of night-shift nurses on work days was significantly lower than day-shift nurses by nearly two hours (t(15) = 2.85, p = 0.01, Table 1).
Sleep characteristics of day-shift and night-shift nurses (measured via actigraphy).
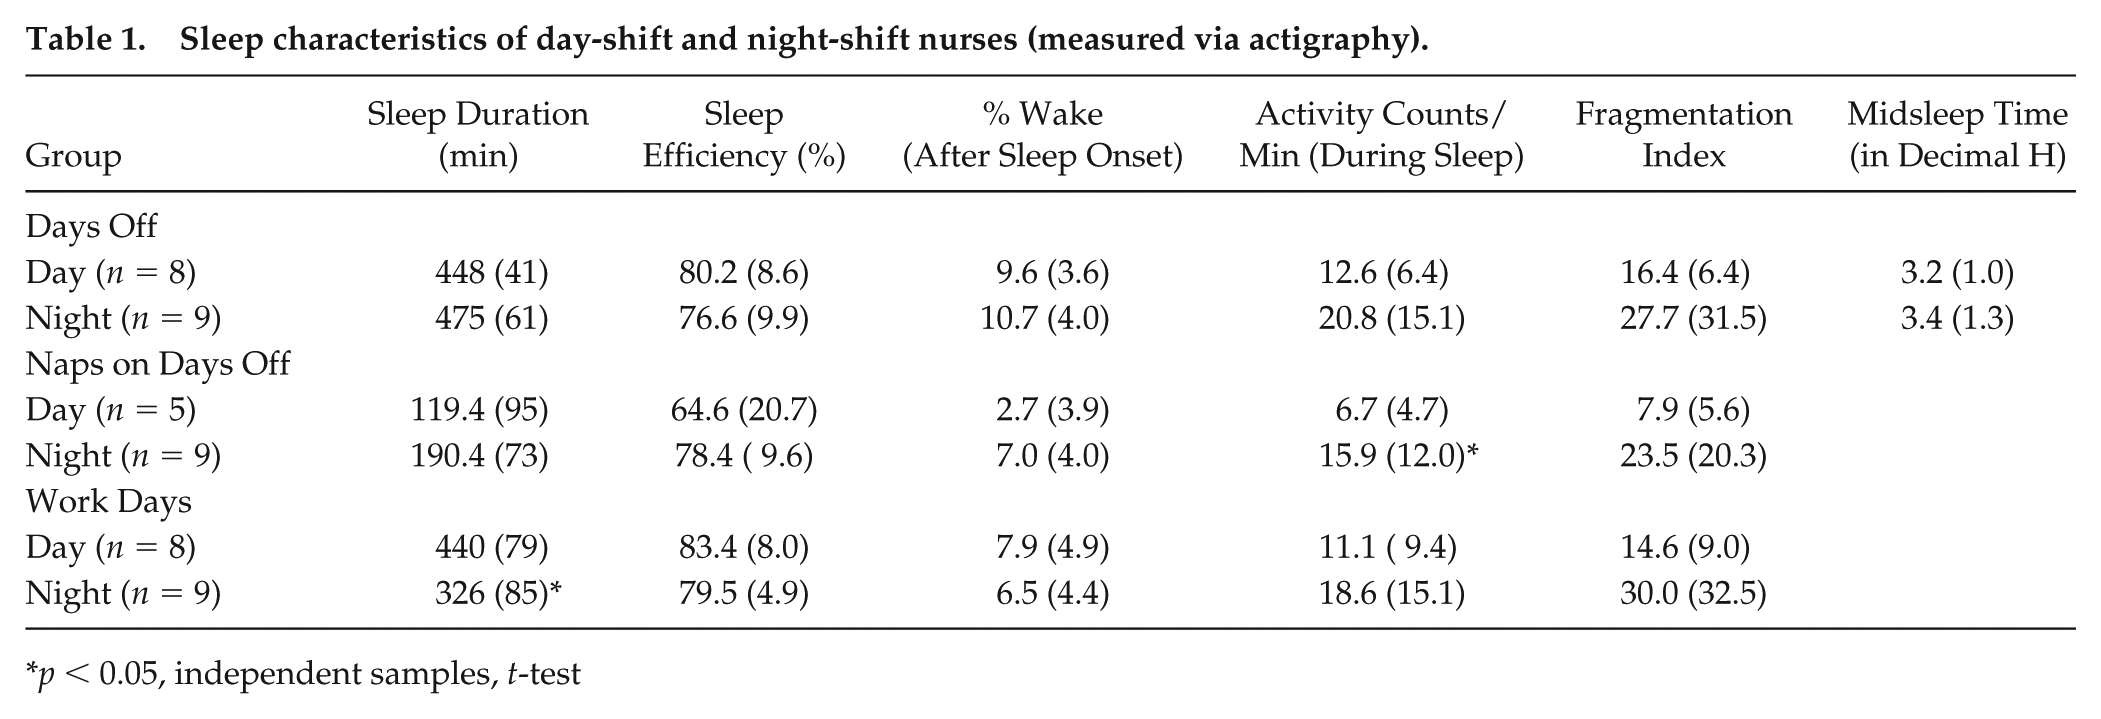
p < 0.05, independent samples, t-test
Variable Circadian Misalignment of Hospital Shift Workers on Free Days
Significant rhythms of CBT were detected via cosinor analysis for all subjects, regardless of shift type, and there was no significant difference in the average amplitude of individual CBT rhythms between day-shift (mean [SD], 0.35 [0.16]; n = 8) and night-shift workers (0.26 [0.09]; n = 9; t(15) = 1.28,p = 0.22). However, the phase of the CBT nadir was considerably more variable for night-shift nurses, with no evidence of clustering (Rayleigh test, Z = 1.23, p = 0.30) as compared with day-shift nurses (mean [circular SD in decimal hours], day-shift: 04.27 [1.6]; Rayleigh test, Z = 6.69, p < 0.001; Figure 1B; see Supplementary Figure S2 for CBT rhythms of individual participants). Likewise, day-shift nurses showed a significant nocturnal peak in melatonin (cosinor analysis, R2 = 0.69, p < 0.001) and an early morning rise in cortisol (cosinor analysis, R2 = 0.35,p < 0.001), and these rhythms were significantly dampened in night-shift nurses (melatonin, R2 = 0.06, p = 0.08; cortisol, R2 = 0.06, p = 0.20; Figure 1C, E). The dampening of these rhythms was primarily due to variability in circadian phase. Significant clustering of peak cortisol (Rayleigh test, Z = 6.02,p < 0.001) and dim-light melatonin onset (DLMO; Rayleigh test, Z = 6.64, p < 0.001) was evident in day-shift but not in the night-shift nurses (Rayleigh test, Z = 1.1 and 0.78, for cortisol and melatonin, respectively, p > 0.34; Figure 1D, F).
Shift Work and the Transcriptome
Differential Rhythmic Circadian Transcription
Given the profound misalignment of rhythmic indicators after a recent history of shift work, we next determined whether global transcription was also disrupted during a day off following night-shift work. We hypothesized that shift work may disrupt the transcriptome in a similar manner to a forced desynchrony protocol (Archer et al., 2014). The microarray analysis of 3 sets of 8 RNA samples isolated from day-shift and night-shift PBMCs over a 24-h period were assayed with over 47,000 probes, enabling us to determine the 24-h time course of the peripheral transcriptome. Rhythmic 24-h patterns of transcription were detected in day-shift nurses with meta3d function (see Materials and Methods). Using a meta3d p-value cutoff of < 0.05 and rAMP > 0.1, we found that 466 out of 47,323 transcripts were rhythmic among the day-shift nurses, and 361 out of 47,323 transcripts remained rhythmic among night-shift nurses (Figure 2A; Supplementary Data S1 and S2).
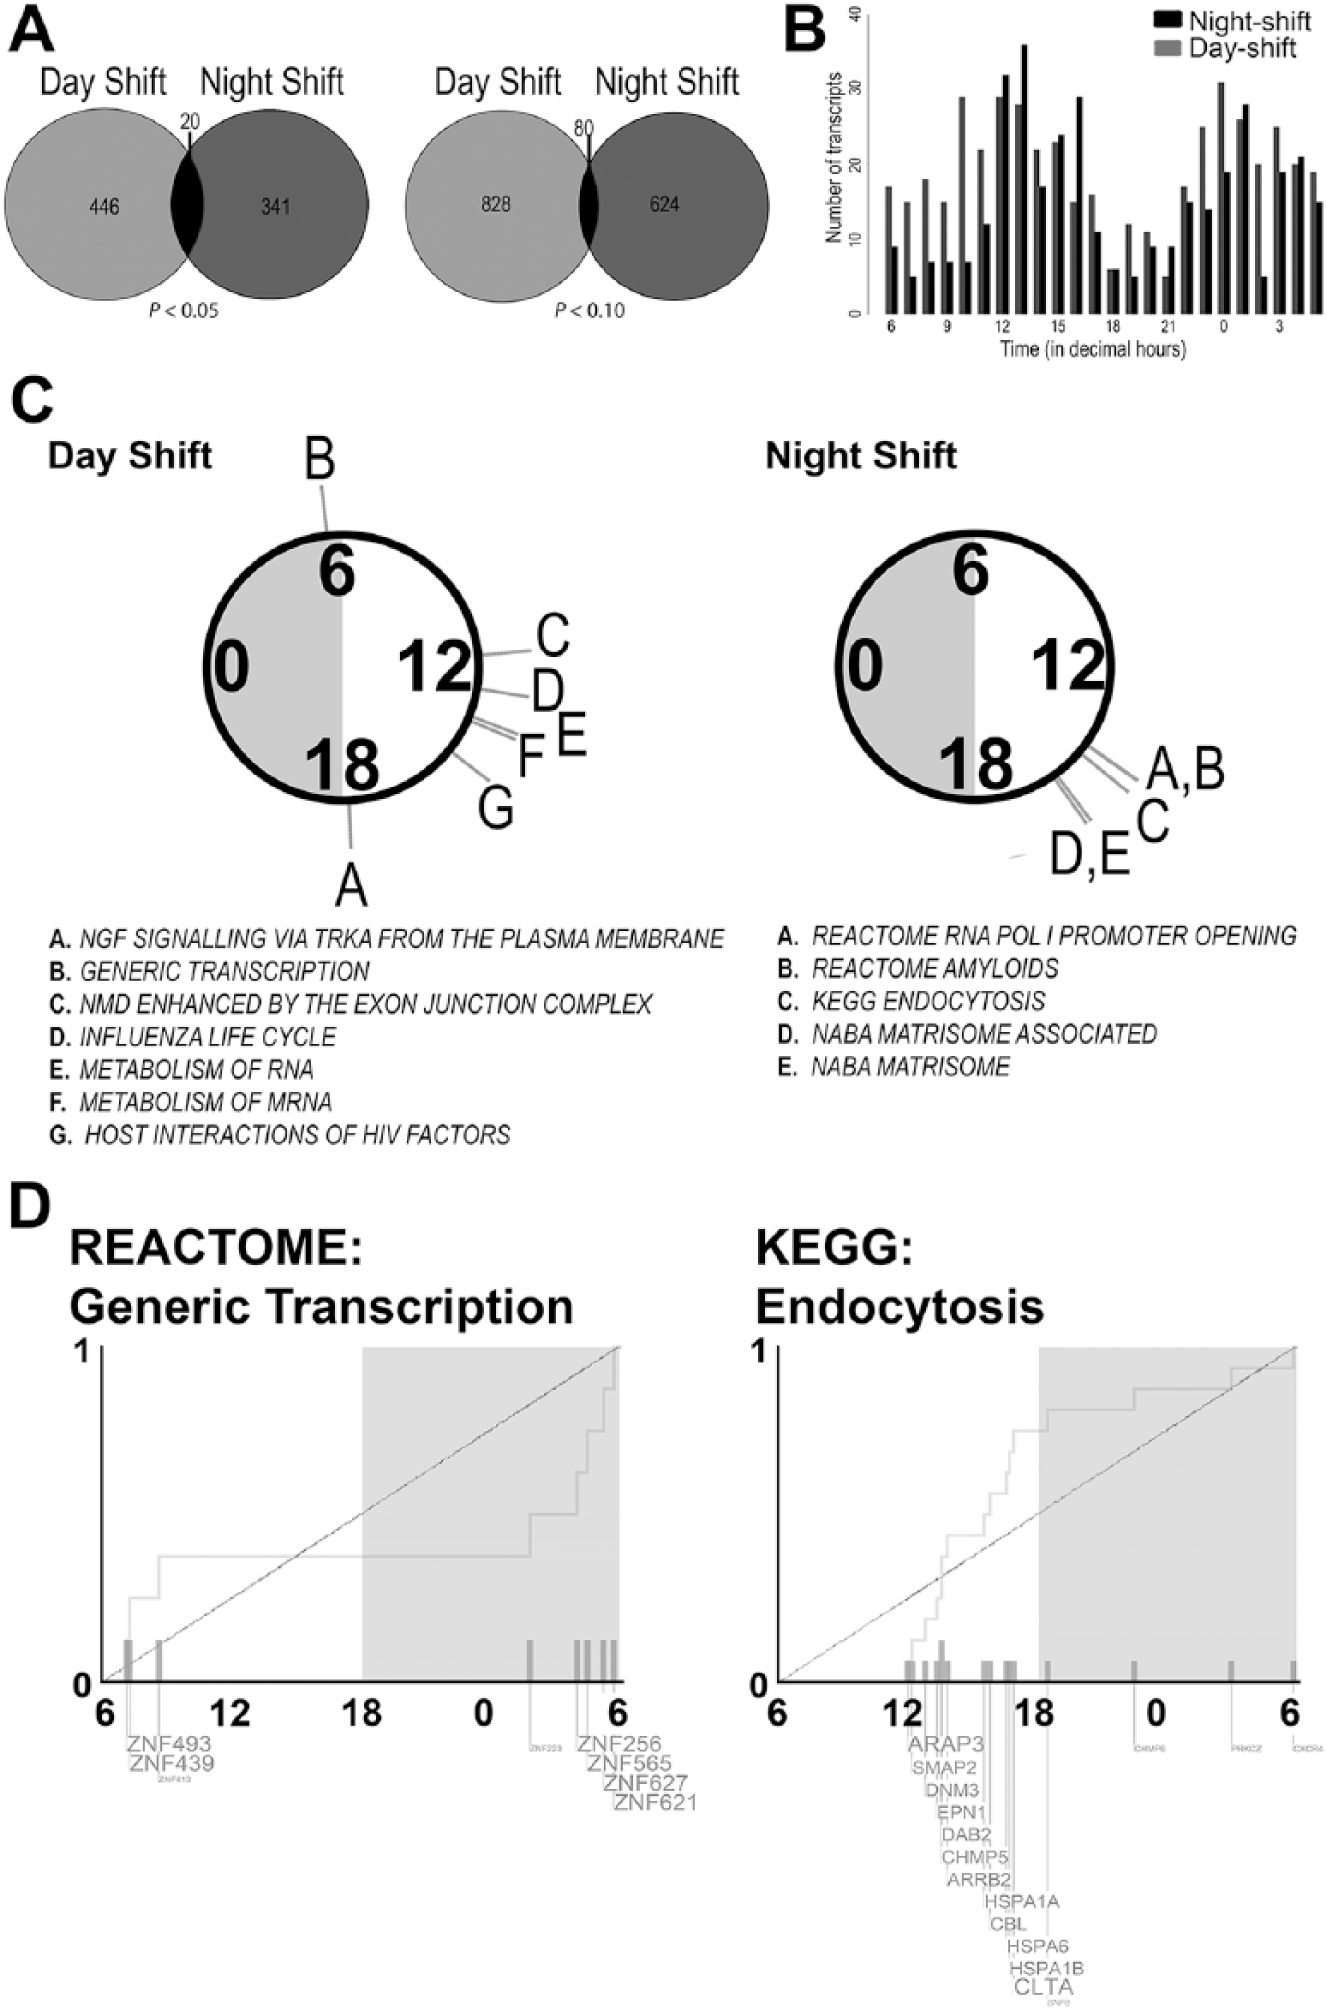
Circadian transcripts and enriched pathways in day- and night-shift groups. (A) Venn diagram shows MetaCycle’s meta3d reported rhythmic transcripts in day-shift (light gray) and night-shift (dark gray) groups with the cut-offs of rAMP > 0.1 and p < 0.05 (left) and p < 0.1 (right). (B) Phase distribution of circadian transcripts in day (gray; p < 0.05) and night (black; p < 0.05) shift groups. (C) Significantly enriched pathways (q < 0.05) from PSEA analysis of circadian genes in the day-shift and night-shift groups, coded by the letters indicated in the circular plot above each list. Note that 0, 6, 12, and 18 indicate decimal time and gray and white shading are general markers for day and night, respectively; data were collected at various times of the year. (D) The phase distribution of rhythmic genes is shown for 2 example pathways.
The phase distribution of all circadian transcripts showed a bimodal pattern with nearly antiphasic peaks, occurring between 12.0 and 16.0 decimal hours during the wake phase, and between 0.0 and 2.0 decimal hours in the sleep phase for both shift types (Figure 2B). Twenty transcripts were rhythmic across both day-shift and night-shift groups (Figure 2A; Table S1). Some of these overlapping transcripts were expressed at the same time of day in both shift types, including transcripts that peaked during the day (e.g., CLEC12A) or night (e.g., HECTD3). However, some of the overlapping transcripts were expressed in different phases or in near antiphase. For example, IRF8 (Interferon regulatory factor 8), STAT1 (Signal transducer and activator of transcription 1-alpha/beta), NDUFAB1 (NADH dehydrogenase, ubiquinone, 1 beta subcomplex), and DYRK1B (dual-specificity tyrosine-phosphorylation-regulated kinase 1B) peaked with 7 h or more in phase difference between shift types (Supplementary Table S1). Interestingly, DYRK1B is a priming kinase for GSK3B, the activation of which can regulate entrainment (Paul et al., 2017).
For day-shift nurses, RNA timing was represented in several of the functional groups of transcripts (PSEA; q < 0.05; Figure 2C, Supplementary Figure S3 and Supplementary Data S3) that peaked in the early morning (generic transcription) or afternoon (exon junction complex, RNA metabolism). Other functional groups rhythmic in day-shift nurses included regulation of signal transduction (NGF signaling via TRK receptors, including PRKAR1A; PSEA q < 0.05; meta3d p < 0.1 and rAMP > 0.1; Figure 2C, Supplementary Figure S3 and Supplementary Data S3). Each of the molecular pathway groups identified in day-shift nurses included a minimum of 5 genes; however, none of these pathways were identified by a similar analysis in night-shift nurses. Instead, transcripts from these subjects were involved in pathways such as RNA polymerase I promoter opening, the matrisome, and endocytosis (PSEA q < 0.05; meta3d p < 0.1 and rAMP > 0.1; Figure 2C and Supplementary Figure S4 and Supplementary Data S3). Interestingly, 5 transcripts in the amyloid fibril formation pathway (all belonging to the histone family) were represented.
We next used quantitative real-time RT-PCR to measure rhythmicity in the expression of the canonical circadian clock genes and found that significant rhythms of PER1 and PER3 expression were detected in night-shift nurses (p < 0.05 for both) but not day-shift nurses (p = 0.21 and 0.80, respectively). On the other hand, PER2 did not appear to cycle in either shift group (Figure 3). The positive clock gene regulator, BMAL1 significantly oscillated in antiphase to PER1 in day-shift nurses (p < 0.05) but was arrhythmic in night-shift workers (p > 0.05). Finally, REV-ERBα failed to show a significant rhythm in either day-shift or night-shift nurses (p > 0.05).
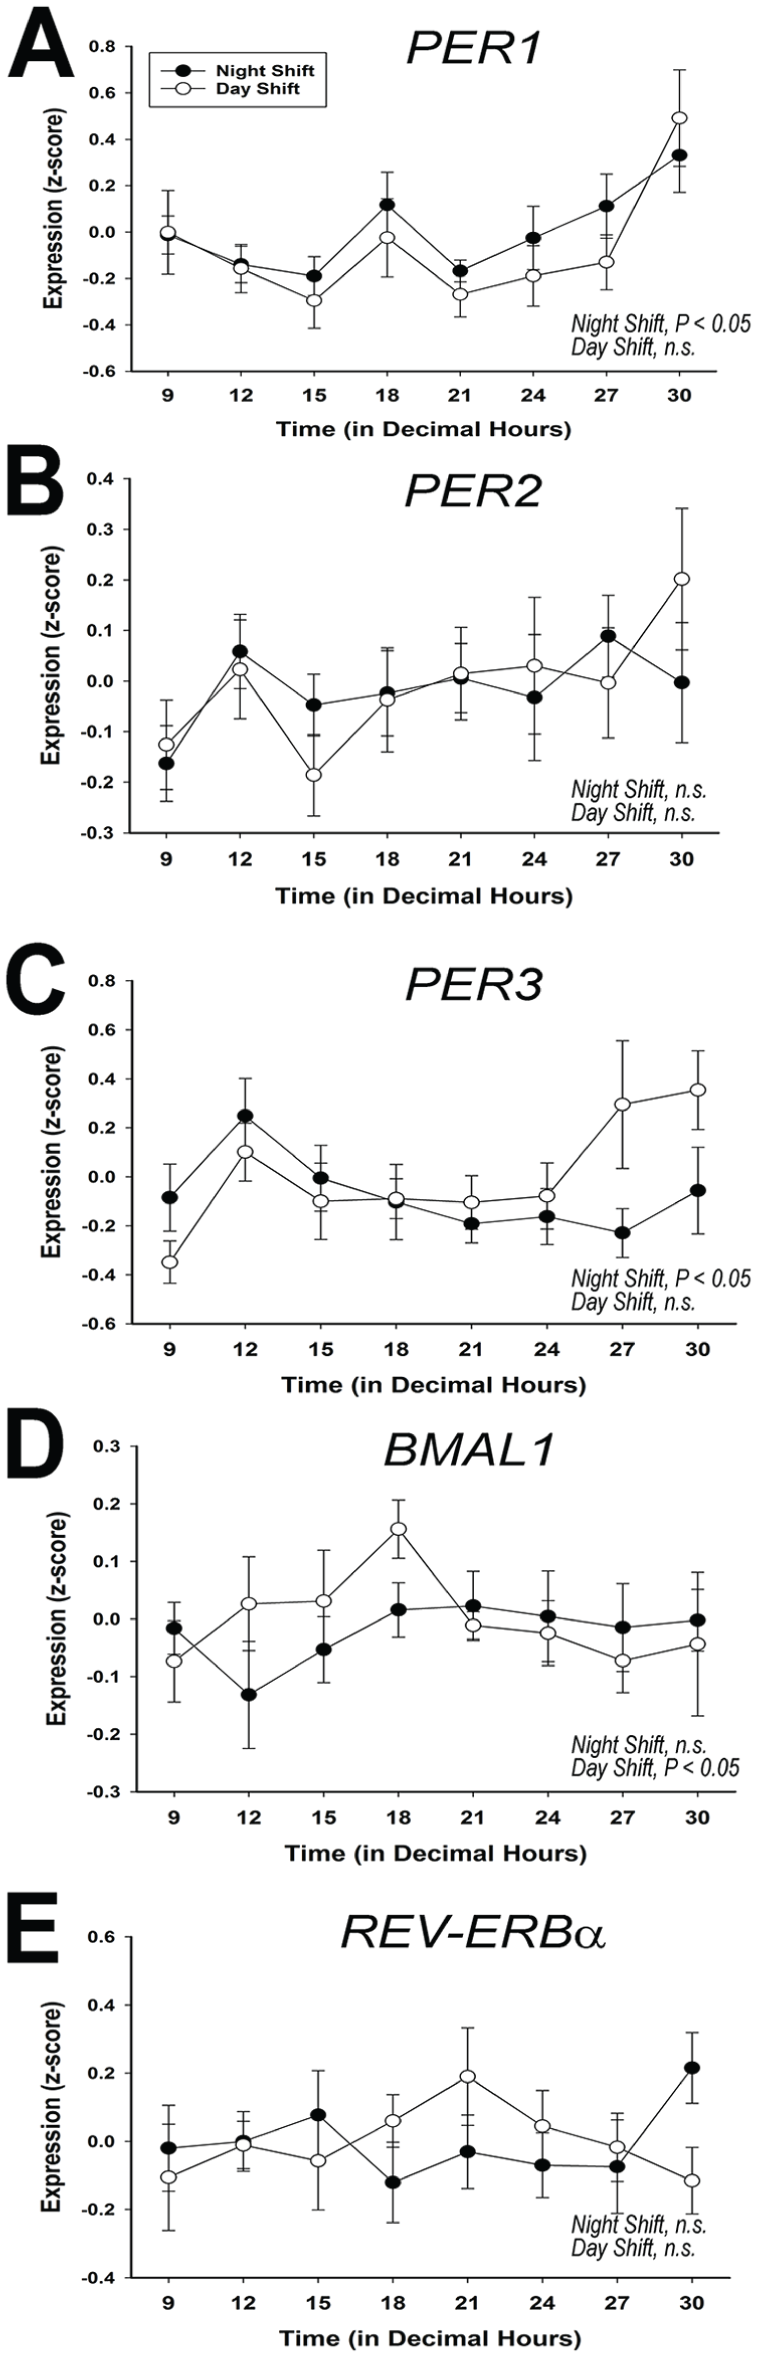
Canonical clock gene expression in peripheral blood mononuclear cells (PBMCs). Quantitative real-time RT-PCR analysis of the 24-h pattern of average transcription of PER1 (panel A), PER2 (panel B), PER3 (panel C), BMAL1 (panel D), and REV-ERBα (panel E) at each time point, analyzing the entire sample pool (n = 9 and 8 for night-shift and day-shift nurses, respectively). Error bars are SEM.
Individual Variability of Day and Night-shift Participants
The bimodal distribution of transcriptional rhythms (Figure 2B) could be due to variability in individual nurses such that rhythmic transcripts from individual subjects peak at different times of the day. To test this idea, we used JTK_CYCLE to quantify the number and phase of transcriptional rhythms for the 6 nurses individually. There was large variability among the 6 participants in the number of significantly rhythmic transcripts, regardless of prior shift-type (range, day-shift: 318 to 1,137; night-shift: 153 to 965; using JTK_CYCLE p < 0.05 and rAMP > 0.1; Figure 4). The distribution of transcriptional expression was also non-uniform for each of the 6 participants (Rao’s spacing test, U: 322.4 – 355.0, p < 0.01 for all), 4 of which showed a bimodal distribution, peaking during the wake and sleep phases. Although inter-individual differences in response to 38-h sleep deprivation are associated with the number of rhythmic gene transcripts in whole blood (Arnardottir et al., 2014), sleep deprivation did not seem to account for the differences observed in the present study, given that day-shift and night-shift subjects were not different in actigraphy-measured sleep parameters on days off (Table 1). Moreover, the subjects with the fewest number of cycling transcripts (Figure 4A and 4B, bottom panels) slept ~8 h on days off with >85% sleep efficiency. For night-shift nurses, the amplitude and phase of the melatonin rhythm also tracked with number and phase of the cycling transcripts: 1) subjects with large amplitude melatonin rhythms had more cycling transcripts, and 2) one of the peak phases for transcript expression clustered near the DLMO (Figure 4B). However, this melatonin phase relationship was inconsistent in the day-shift nurses (Figure 4A). For all 6 nurses, the amplitude of the CBT rhythm was significantly correlated with the number of cycling transcripts for each nurse, regardless of shift-work group (Spearman’s rho, r(5) = 0.89, p < 0.05), suggesting that CBT amplitude may be an important indicator of peripheral clock gene transcription (Supplementary Figure S5).
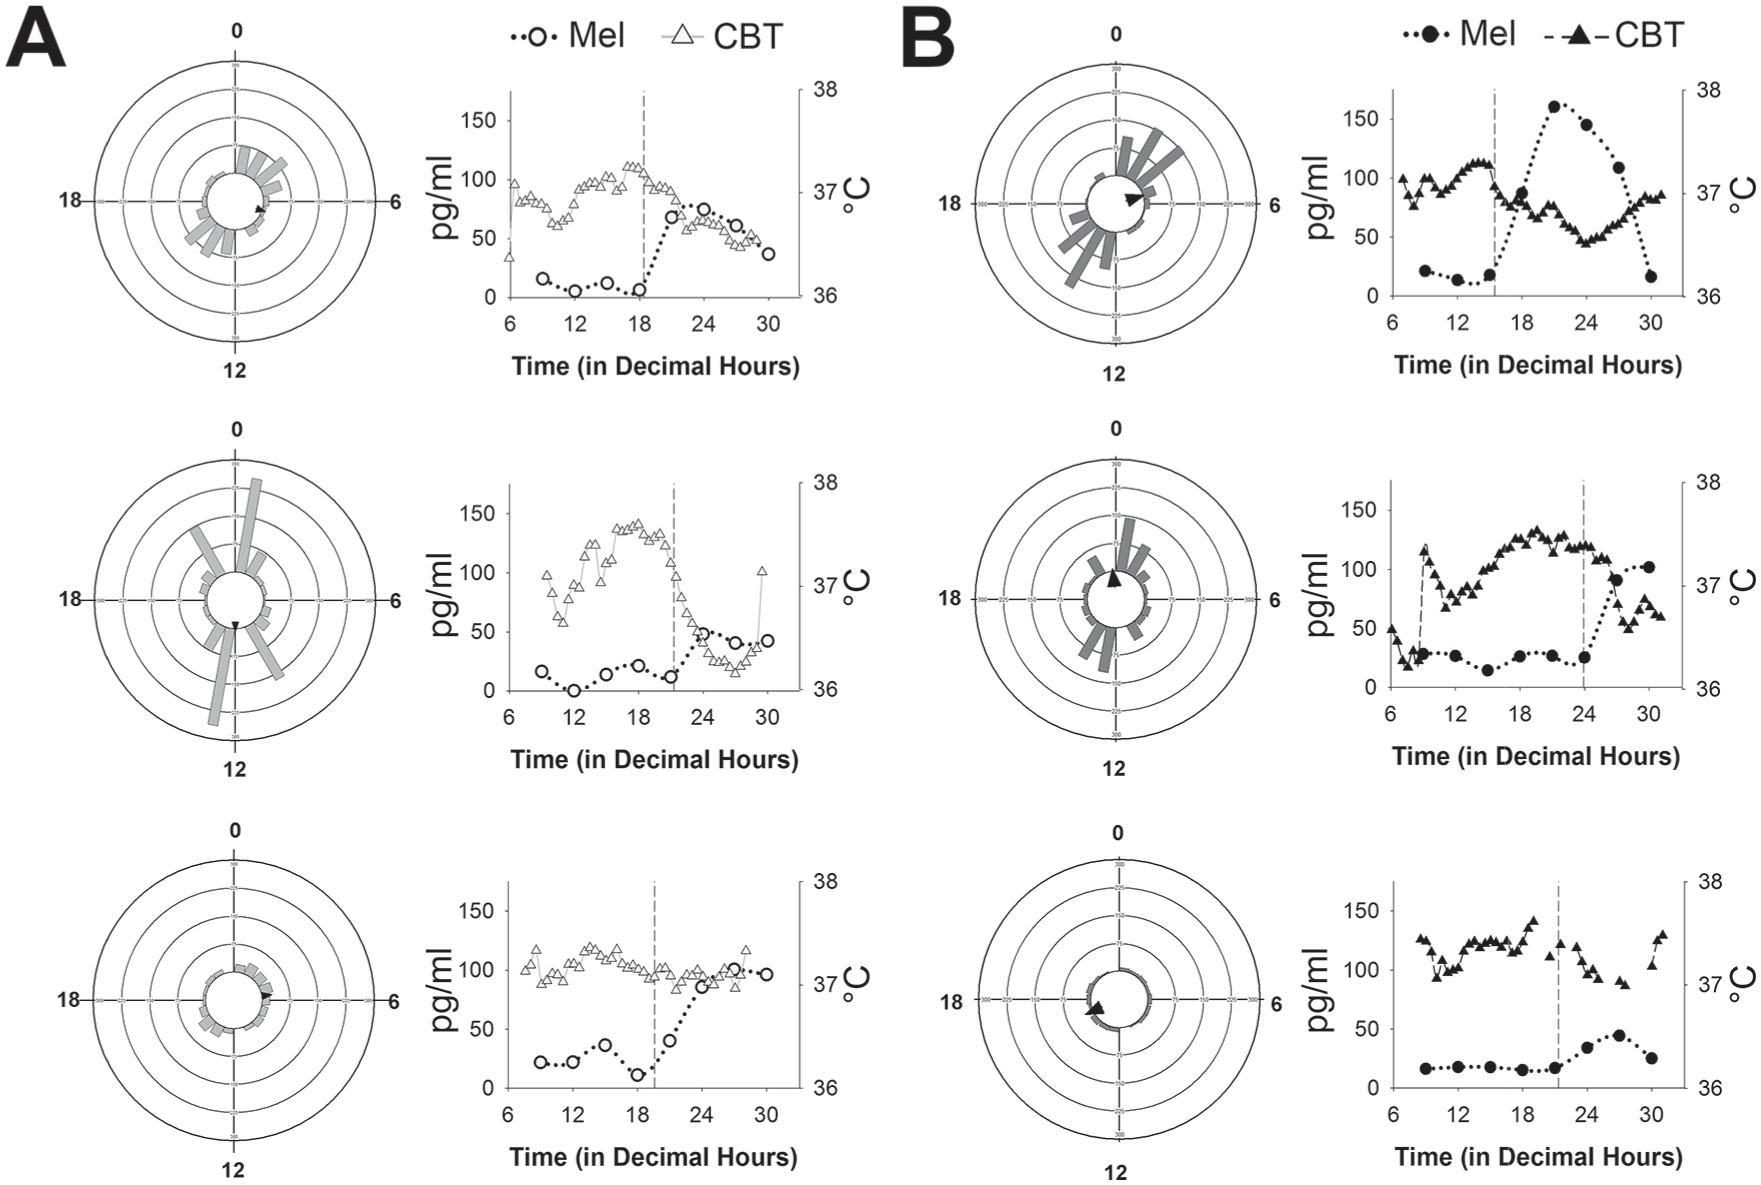
Phase distributions of circadian transcripts in each individual. Vector histograms of gene expression (left) and melatonin rhythms (right) in 3 individual day-shift (A) and 3 individual night-shift nurses (B). Each ring represents 75 transcripts, and arrows indicate the average peak time in rhythmic expression (as indicated by the direction). For the line graphs, melatonin is plotted with circles using the left Y-axis and core body temperature (CBT) is plotted as triangles using the right Y-axis. Dim-light melatonin onset (DLMO) is indicated by the vertical dashed line in each graph. Cosinor amplitude estimates for CBT are as follows (in °C, top to bottom): panel A (day-shift), 0.269, 0.673, and 0.107; panel B (night-shift), 0.272, 0.422, and 0.114.
Discussion
A putative explanation for the physiological and psychological effects of shift work is circadian misalignment resulting from a mismatch between the environment, sleep/wake cycle, and timing of an individual’s physiological rhythms (Archer et al., 2014; Gamble et al., 2013; Vetter et al., 2015; Wright, Bogan, et al., 2013; Wright, McHill, et al., 2013). A forced desynchrony protocol significantly reduces the percentage of rhythmic transcripts in the blood of healthy non-shift workers (Archer et al., 2014). In addition, simulated night-shift work reduces the amplitudes and misaligns rhythmic transcripts in PBMCs of healthy non-shift workers with the behavioral sleep/wake cycle (Kervezee et al., 2018). As previously stated, the degree of circadian misalignment depends on multiple factors, including an individual worker’s “chronotype,” and scheduling work shifts according to their chronotype reduces social jetlag (Roenneberg, 2015; Vetter et al., 2015). In the current study, we compared the 24-h transcriptome of PBMCs of day-shift workers to night-shift workers on a day off. Non-working days are important to consider given that most shift workers choose to return to nocturnal sleep on days off such that sleep is misaligned.
Our results indicate 3 major findings. First, we found that even after 2 days off, shift-work nurses experienced lasting circadian misalignment of physiological (melatonin, cortisol, and CBT) and molecular (PBMC gene expression) rhythms despite returning to a nocturnal sleep period. Circadian transcription in PBMCs showed a bimodal distribution linked to rest and activity phases in both shift types. However, the rhythmicity of specific gene pathways and individual transcripts was largely dependent upon the recent history of shift work, i.e., day-shift or night-shift. Although 20 rhythmic transcripts were identified as common to both shift groups, there was a disparity in the phase of their expression between shift groups in one-third of them (7 of 20 peaked with 7 h or more in phase difference between shift types; Supplementary Table S1). Altogether, these data show variability in the degree of misalignment among individual shift workers. Differential rhythmicity in critical gene networks such as generic transcription and RNA/mRNA metabolism in day-shift and night-shift nurses suggests that these pathways could be mediators of health risks associated with night-shift work.
The second major finding of the present study is the surprising result that rhythmicity of the canonical circadian clock genes did not substantially change their phase in the periphery (i.e., PBMCs). Several clock genes are impacted by mistimed sleep, as shown recently in healthy participants undergoing a forced desynchrony protocol (Archer et al., 2014). In addition, a simulated night-shift study in non-shift-workers found that 9 days of consecutive laboratory “night-shifts” were necessary for peak expression of the clock genes PER1 and PER2 in PBMCs to re-align to the early waking hours (James et al., 2007). These results suggest that the “3 days on, 3 to 4 days off” schedule of nurses is not sufficient to allow proper alignment of peripheral PBMC clock gene expression. Therefore, we measured the 24-h pattern of transcription of PER1, PER2, PER3, BMAL1, and REV-ERBα using quantitative real-time RT-PCR in a separate analysis of the entire sample pool. Given the previous work using a simulated night-shift, we were surprised to see that PER1 rhythms were similar for day-shift and night-shift participants, with a similar phase, peaking in the early morning hours. This result is similar to a recent study of simulated night work that found that PER1 had a similar rhythm in both conditions (Kervezee et al., 2018); although, the rhythm under night shift simulation failed to reach statistical significance. One contributing factor in our study is the meal paradigm, in which both shift groups consumed isocaloric meals at exactly the same time of day. It is plausible that the feeding-fasting regimen in this study (i.e., 12-h fast beginning at 2100 h followed by meals from 0900 h to 2100 h) was sufficient to act as a synchronizing agent for the molecular clock in PBMCs. A recent proteomics study found 2 clusters of proteins that are regulated by the behavioral sleep-wake/fasting-food intake cycle, with some of these proteins belonging to cellular catabolism (Depner et al., 2018). Thus, the feeding/fasting cycle may overcome internal desynchrony for at least one peripheral system. Future work should examine whether scheduled meal times could be used to reduce metabolic desynchrony and impairment associated with working night shifts.
Based on the circadian transcriptome study of PBMCs in the day- and night-shift groups, we found that there are several circadian transcripts in common between the 2 groups. However, the phase distribution of circadian transcripts from each group indicated bimodal patterns, as shown previously (Moller-Levet et al., 2013). We also found obvious individual differences in each group, such that even within the same group, one individual could have twice as many clock-regulated transcripts as another. The third major finding of the present study is that these individual differences tracked with the amplitude of core body temperature more than melatonin amplitude (or phase). This result suggests that core body temperature amplitude may be a good indicator of the robustness of peripheral circadian clock function or that it contributes to the regulation of circadian transcription in PMBCs.
Our study provides the first look at how circadian misalignment affects the rhythmic peripheral transcriptome in on-the-job shift workers. However, there are limitations to our study, including the relatively few number of shift-workers analyzed, the exclusion of males, and no restrictions on the use of other confounds such as oral contraceptives and caffeine. The sample size likely reduced the statistical power to detect differences between day- and night-shift subjects. There may also be gender-specific responses to circadian desynchrony. We note that, by sampling PBMCs rather than whole blood, our results are specific to leukocytes, T cells, B cells and NK cells, all of which are critically important for immunology.
In conclusion, our data show the disruptive effects that shift work has on molecular rhythmicity. Further, we show that variability in molecular rhythms between individuals is an indication of the severity of desynchrony. Recent work has shown that individuals who are resistant to total sleep deprivation also have fewer cycling transcripts in whole blood (Arnardottir et al., 2014). Although sleep deprivation does not appear to contribute to this study, sleep deprivation certainly occurs during shift work and should be taken into consideration. Further, night-shift workers show individual differences in the sleep strategies used for sleeping at night on days off (Petrov et al., 2014). These behavioral strategies, as well as chronotypes, may affect the extent and nature of circadian dysregulation (Juda et al., 2013; Vetter et al., 2015). In addition, variable exposure times to natural and electric lighting can have a profound effect on melatonin onset (Wright, McHill, et al., 2013). Adjusting shift schedules to individual workers’ inherent biological rhythm and/or chronotype to optimize work performance and worker satisfaction has been a useful strategy (Czeisler et al., 1982; Gamble and Young 2015; Vetter et al., 2015). It is unknown whether chronotype-matched shift schedules would work in hospitals and whether this approach would minimize the negative impact of night-shift work on human health. Further studies should focus on whether re-alignment of circadian rhythms with the behavioral sleep/wake and feeding/fasting cycles during shift work reinstate robust oscillations of the transcriptome and general well being.
Supplemental Material
ShiftworkTransscriptome_201808_JBR_SI_responses – Supplemental material for Shift Work Disrupts Circadian Regulation of the Transcriptome in Hospital Nurses
Supplemental material, ShiftworkTransscriptome_201808_JBR_SI_responses for Shift Work Disrupts Circadian Regulation of the Transcriptome in Hospital Nurses by David Resuehr, Gang Wu, Russell L. Johnson, Martin E. Young, John B. Hogenesch and Karen L. Gamble in Journal of Biological Rhythms
Supplemental Material
TABLE_S1_All_20_overlapping_genes_with_phase_differences_ – Supplemental material for Shift Work Disrupts Circadian Regulation of the Transcriptome in Hospital Nurses
Supplemental material, TABLE_S1_All_20_overlapping_genes_with_phase_differences_ for Shift Work Disrupts Circadian Regulation of the Transcriptome in Hospital Nurses by David Resuehr, Gang Wu, Russell L. Johnson, Martin E. Young, John B. Hogenesch and Karen L. Gamble in Journal of Biological Rhythms
Footnotes
Acknowledgements
This research was funded by the UAB Center for Clinical and Translational Science (CCTS) Grant NIH UL1TR000165, the Department of Vision Sciences, the UAB Comprehensive Diabetes Center, the UAB Department of Psychiatry Office of Clinical Research, the UAB Faculty Development Grant Program, the UAB General Endowment Fund Actigraphy Core, the National Institute of Neurological Disorders and Stroke (5R01NS054794-08 to JBH; 7R01NS054794-11 to JBH and Andrew Liu), the National Human Genome Research Institute (2R01HG005220-5 to Rafa Irizarry and JBH), and (1R21NS101983-01 to Tom Kilduff and JBH). We would also like to thank Dr. Jodi Paul for helpful comments and the UAB Psychiatric Medicine and Clinical Research Unit Staff including Dr. Rachel Fargason, Dr. Taylor Preston, Jolene Lewis, and Sufen Wang.
Conflict of Interest Statement
The author(s) have no potential conflicts of interest with respect to the research, authorship, and/or publication of this article.
Notes
References
Supplementary Material
Please find the following supplemental material available below.
For Open Access articles published under a Creative Commons License, all supplemental material carries the same license as the article it is associated with.
For non-Open Access articles published, all supplemental material carries a non-exclusive license, and permission requests for re-use of supplemental material or any part of supplemental material shall be sent directly to the copyright owner as specified in the copyright notice associated with the article.