
Abstract
Light is a potent synchronizer of the central circadian clock; however, the effect of light exposure on peripheral gene expression is largely unknown. The objective of this study was to explore the effect of bright light exposure on genome-wide peripheral gene expression levels during a 4-day simulated night shift protocol in which the habitual sleep period is delayed by 10 h. Eleven healthy participants (mean age, 24 years; range, 18-30; 10 men/1 woman) were studied under controlled laboratory conditions. Three participants were exposed to bright light (~6,500 lux) for 8 h during the nightly waking period, while the other 8 were maintained in dim-light conditions (~10 lux). At baseline and on the fourth day after the shift in the sleep period, blood samples were collected during two 24-h measurement periods. RNA was extracted from peripheral blood mononuclear cells (PBMCs) and used to obtain transcriptomic data. Using 2 independent approaches to determine phase shifts among rhythmically expressed genes after the shifted sleep schedule compared with baseline, we found that the average phase delay in the bright light group was approximately 8 to 9 h, whereas the average phase delay in the control group was approximately 1 to 2 h, both at the group level and at the individual level. In line with these findings, further analysis using partial least squares regression indicated that the peripheral circadian transcriptome of PBMCs was predictive of the phase of the central circadian pacemaker after only 3 days of bright light exposure. These results indicate that bright light exposure exerts a phase-shifting effect on the circadian transcriptome in PBMCs with a magnitude similar to its effect on the central circadian clock.
Night shift work and transmeridian travel are inevitably linked to large abrupt shifts in the sleep/wake and feeding cycles, as is altered light exposure, which produces a state of circadian misalignment between the daily variations in the external environment and internal circadian timing system. Acute circadian misalignment leads to changes in physiological processes, including altered insulin sensitivity (Buxton et al., 2012; Scheer et al., 2009), immune response (Cuesta et al., 2016), energy expenditure (McHill et al., 2014), and cardiovascular variables (Morris et al., 2016; Scheer et al., 2009). These changes, in turn, may contribute to the development of the adverse health effects that are more frequently observed in night shift workers over the long term (Kecklund and Axelsson, 2016).
The mammalian circadian timing system comprises a central clock in the SCN of the hypothalamus, and peripheral clocks in other tissues (Mohawk et al., 2012). Although peripheral clocks oscillate autonomously, they are entrained to the external environment by the central clock through a complex interplay of neuronal, behavioral, and endocrine pathways (Mohawk et al., 2012). At the molecular level, the circadian timing system consists of transcriptional and translational feedback loops that generate the rhythmic expression of clock genes (Takahashi, 2017). This molecular clock machinery is present in virtually all cell types and drives the expression of many clock-controlled genes. As a result, the transcriptomes of a wide range of tissues in mice are under pronounced circadian regulation (Zhang et al., 2014). Likewise, a considerable proportion (5% to 10%) of the human blood transcriptome is expressed in a circadian manner (Archer et al., 2014; Kervezee et al., 2018a; Moller-Levet et al., 2013).
To entrain physiological processes to altered behavioral cycles caused by night shift work or transmeridian travel, central and peripheral clocks need to be reset to the altered timing of sleep and feeding behavior and adopt their characteristic phase relationships (Roenneberg and Merrow, 2016). Depending on the timing, intensity, and spectral composition, light is a potent synchronizer of the central circadian clock in humans, and is capable of producing large phase shifts in markers of the central circadian clock, such as melatonin, cortisol, and core body temperature (Duffy and Czeisler, 2009).
Less is known about the entrainment of peripheral clocks to shifted behavioral cycles and the effect of bright light exposure on this process. During a 4-day simulated night shift protocol, in which sleep periods were delayed by 10 h in healthy human participants, clock gene rhythms in peripheral blood mononuclear cells (PBMCs) as well as central markers of the circadian clock were delayed by approximately 7 to 9 h when exposed to bright light, but not to dim light (Cuesta et al., 2017). However, whether rhythms in transcriptome-wide gene expression levels in peripheral tissues, i.e., the downstream targets of peripheral clocks, are affected by bright light exposure remains to be elucidated. Therefore, the objective of this study was to extend our previous findings by exploring the potential phase-shifting effect of bright light exposure on transcriptome-wide gene expression patterns in PBMCs after a 10-h delay of the sleep period in healthy human participants. This delay was to simulate night shift work and westward travel across 10 time zones under highly controlled laboratory conditions.
Materials and Methods
Study Protocol
Microarray data were available from 11 healthy human participants who participated in the 4-day simulated night shift protocol (Figure 1). The study was approved by the Douglas Institute Ethics Board and was conducted according to the Declaration of Helsinki. All participants provided written informed consent prior to the study. Details on the medical screening procedure and the experimental protocol were previously published (Cuesta et al., 2017). Briefly, participants maintained a regular, self-selected sleep/wake schedule with a nocturnal sleep period of 8 h for at least one week before admission to the laboratory, which was verified by daily sleep logs and actigraphy. Women were naturally ovulating and studied during the follicular phase. Upon admission to the laboratory, participants were involved in a 24-h baseline measurement period that consisted of an 8-h sleep period during their habitual sleep times and a 16-h constant posture procedure, involving a constant semi-recumbent position, minimal activity, and hourly isocaloric snacks. Immediately following this measurement period, the sleep period was delayed by 10 h and this night shift condition was maintained for four 24-h cycles until the end of the study. The participants belonged either to a control group, which was exposed to dim light (<10 lux) throughout the waking periods of the simulated night shift protocol, or to the bright light group, which was exposed bright light (~6,500 lux) for 8 h during the first 3 nightly waking periods of the simulated night shift protocol. These light intensities were chosen because exposure to the dim-light intensities was expected to have no effect on the phase of markers of the central circadian clock, whereas the duration and intensity of the bright light exposure was expected to produce a large phase shift (Gooley, 2017), and thereby facilitate adaptation of the central circadian clock to the simulated night shift protocol. During the 2 measurement periods, blood samples (10 mL) for microarray analysis were collected every 4 h via an indwelling catheter. PBMCs were isolated from these blood samples and RNA was extracted as previously described (Cuesta et al., 2017). In addition, hourly blood samples were collected for the measurement of plasma melatonin levels.
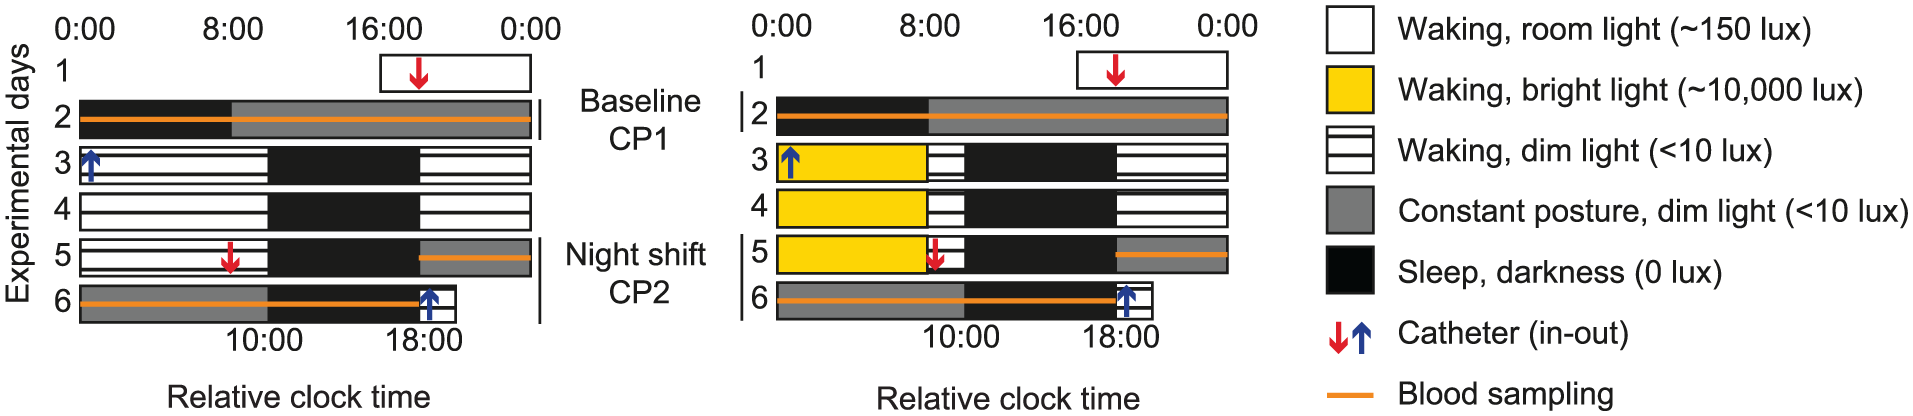
Experimental protocol. The participants entered the laboratory on Day 1. Following a 24-h baseline measurement period, the sleep-wake cycle of the participants was shifted by 10 h. On the fourth day under the shifted sleep-wake schedule, participants underwent a second 24-h measurement period. The bright light group (right) was exposed to bright light (~6,500 lux) during the first 3 nights on this schedule, whereas the control group (left) was kept in dim-light conditions during the nightly waking period. Relative clock time refers to the time of day relative to the start of each participant’s habitual sleep period.
The control group initially comprised 10 participants (1 woman) who were studied in 2012 to 2014. As described previously (Kervezee et al., 2018a), one male participant completed only the baseline measurement period and data for another male participant were excluded due to technical difficulties involving his samples; hence, data from 8 control participants were used for analysis. The bright light group consisted of 9 participants, 5 of whom were studied in 2005 (including 1 woman) and 4 of whom were studied in 2012 together with the participants in the control group. Data from one male participant (studied in 2012) were excluded because of difficulties with blood draws during the second measurement period, and data from another male participant (studied in 2005) were excluded due to low RNA integrity of all his baseline samples. In total, 103 samples from 8 control participants and 89 from the 7 bright light participants were hybridized to Affymetrix Human Clariom S HT microarrays using the HT Pico Amplification Kit (Thermo Fisher Scientific) by the Génome Québec Innovation Centre, Montréal, Canada.
Microarray Data Processing
All downstream analyses were performed in R v3.4.3 (R Core Team, 2017). Background correction, quantile normalization, and summarization were performed on all available raw microarray data (CEL files) simultaneously using the R package oligo v1.38.0 (Carvalho and Irizarry, 2010). To ensure the quality and consistency of the transcriptomic dataset, rigorous quality control criteria were applied. Principal component analysis on all data simultaneously revealed a coherent set of arrays from all samples from year 2012. Because a large subset of the arrays collected in 2005 had an abnormal overall intensity signal, we decided to limit our analysis to the data collected from participants studied in 2012. Therefore, raw microarray data from all 2012 participants were included in the analyses and comprise those of 3 bright light participants (38 samples) and 8 control participants (103 samples). These data were again quantile normalized using the RMA algorithm and used in downstream analysis. Microarray data were deposited in the Gene Expression Omnibus database (accession no. GSE122725).
Each microarray contained 21,448 annotated probe sets corresponding to 19,669 unique genes. To filter out genes with low signal intensity, an intensity threshold, defined as the mean + 2 SD of the negative control and background probe sets on the array, was determined for each array. Probe sets were included in the downstream analysis if they were expressed above this threshold in at least 25% of the samples (n = 11,492 probe sets corresponding to 10,827 unique genes). All subsequent analyses were performed on log2-transformed expression values. Principal component analysis revealed no evidence of an effect of study covariates (age, sex, or BMI) or technical covariates (RNA integrity number or batch) on the expression values. In addition, using the num.sv function in the R package SVA v3.22.0 (Leek et al., 2012), no significant surrogate variables were detected in our data, indicating the absence of any significant latent sources of variation in the data. Therefore, the data were not corrected for any known or unknown covariates.
Individual Analysis
Mixed-effect cosinor analysis was performed on the expression levels of each gene during the baseline condition in all participants (control and bright light group combined) to obtain a list of significantly rhythmic genes at baseline, as follows:
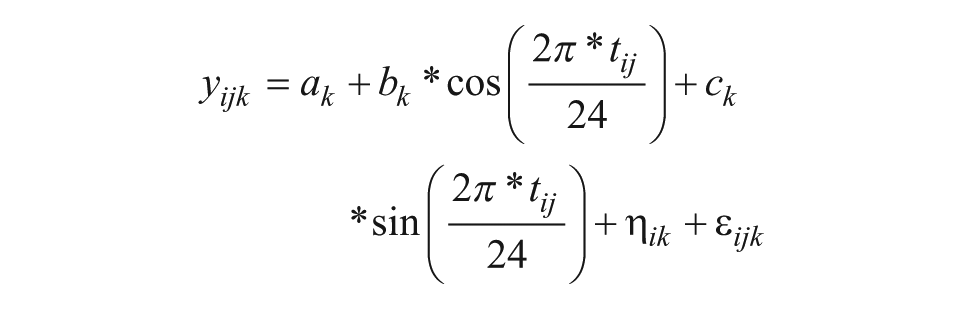
Model 1
Here, yijk is the log2 expression of gene k in individual i at time point j, ak is the intercept (mesor), bk and ck are cosinor coefficients, tij is relative clock time (in h) with t = 0 as the start of the habitual rest period, ηik represents the inter-individual variability and εijk is the residual variability. The likelihood ratio test was used to compare the fit of the model to the null model in which bk = ck = 0. The resulting P values were corrected for multiple testing using the Benjamini-Hochberg method.
Genes identified as significantly rhythmic using this method (FDR < 0.05) were subsequently analyzed for each participant separately at baseline and during the night shift condition using cosinor analysis. The cosinor coefficients were used to compute the phase and amplitude per gene per condition per participant (Cornelissen, 2014). From this, the phase shifts and the changes in amplitude were calculated per gene per participant. Circular mean and vector length of the phase shifts were calculated using the R package circular v0.4-93 (Agostinelli and Lund, 2017). The Rayleigh test of uniformity was used to assess the significance of the vector lengths. To determine the effect of the significance of the rhythmicity of the individual time series, P values were calculated for each time series using the zero-amplitude test and corrected for multiple testing using permutations of 1,000 randomly shuffled time series, as described previously (Kervezee et al., 2018a).
Group-level Analysis
To determine phase shifts and changes in amplitude in genes that were rhythmically expressed at baseline and during the night shift condition in the bright light and control groups, we applied Model 1 to the data from the bright light group and the control group separately. The probe sets for which P < 0.1 at both baseline and during the night shift condition were considered for further analysis (n = 492 in the bright light group and n = 751 in the control group). The reason for using this liberal P value cut-off was that it allowed us to obtain a list of genes for further analysis; it was not our objective at this step to identify genes that were significantly rhythmic in both conditions. A nested modeling approach (Anafi et al., 2017) was used 1) to assess whether each of these genes showed altered circadian expression during the night shift condition compared with baseline, and 2) to calculate the amplitude and phase from the model coefficients for the baseline and night shift conditions. To this end, the following model was fit to the expression levels of each gene at baseline and during the night shift condition simultaneously, similar to the method previously described by Anafi et al. (2017):
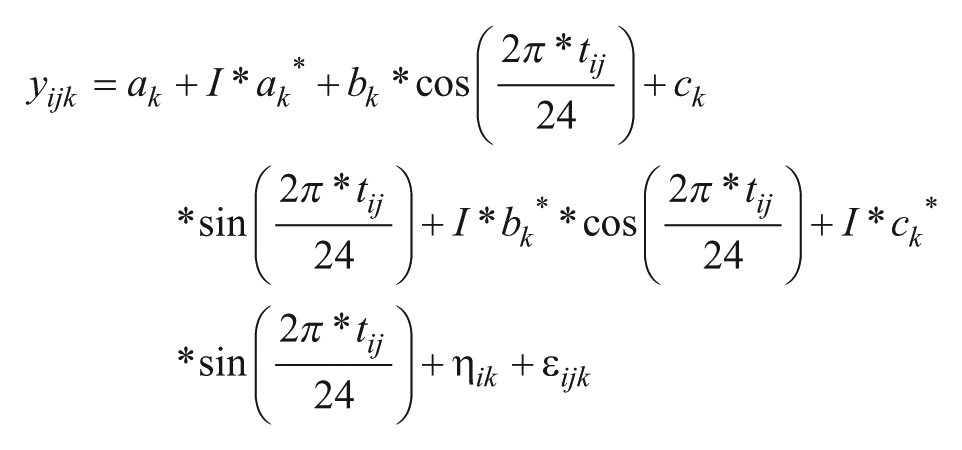
Model 2
In this model, I is an indicator variable that is 0 at baseline and 1 during the night shift condition and ak*, bk*, ck* represent the intercept and cosinor coefficients estimated for the night shift condition separately. The likelihood ratio test was used to compare the fit of this model to a model in which bk* = ck* = 0. The resulting P values were corrected for multiple testing using the Benjamini-Hochberg method. A gene was considered to show altered circadian expression if q < 0.05. The cosinor coefficients derived from Model 2 were used to calculate the phase shift and change in amplitude during the night shift condition compared to baseline.
The data available for the 8 control participants was leveraged to determine altered circadian expression (q < 0.05) in genes that were rhythmic (P < 0.1) at both baseline and in the night shift condition in all possible combinations of 3 control participants (56 subgroups) using the same steps as described above for the 3 bright light participants. The proportion of genes showing significantly altered circadian expression and the overall phase shift were computed for each of the 56 subgroups and compared to the values obtained for the bright light group.
Melatonin Midpoint
Hourly blood samples were drawn to determine plasma melatonin concentrations, as described previously (Cuesta et al., 2017). The melatonin midpoint, a marker for circadian phase, was calculated as the midpoint between the upward and downward crossing of the average melatonin concentration per condition per participant.
Relationship between Central Circadian Phase and the PBMC Transcriptome
The actual circadian phase of each transcriptomic sample was calculated as the difference between the sampling clock time and the melatonin midpoint, using a period of 24 h. Partial least squares regression (PLSR) was performed to predict the circadian phase from transcriptomic data derived from a single PBMC sample using the R package pls v2.6.0 (Mevik et al., 2016). PLSR was previously shown to allow an accurate prediction of central circadian phase from a single blood sample using transcriptomic data (Laing et al., 2017). PLSR is a multivariate technique that predicts a response variable (in this case: circadian phase in Cartesian coordinates) from multiple, colinear features (in this case: z-scored expression levels from all genes) by extracting latent factors that account for most of the variation in the response variable (Tobias, 1995). We used nested leave-one-participant-out cross-validation (Varma and Simon, 2006) consisting of an outer cross-validation loop to estimate the prediction error and an inner loop to determine the optimal number of latent factors and features. In the outer loop, the dataset was split into a “testing set,” consisting of all data from one participant, and a “calibration set”, consisting of all data from the rest of the participants. Within the inner loop, the calibration set was split into a “validation set,” consisting of data from one participant, and a “training set,” consisting of all data from the rest of the participants; different combinations of parameters were tested (number of features, nF: 50, 100, 150, 200, or 250; number of latent factors, nL: 5, 10, 15, or 20). PLSR was applied twice on the training set: once to obtain the top nF features for a specific combination of nF and nL and a second time to train the model on these nF features. The resulting PLSR model was then applied to the validation set to obtain the predicted circadian phase. This process was iterated over each participant in the calibration set. The differences between the actual circadian phase and the predicted circadian phase were used to calculate the root mean square error (RMSE). In the outer loop, the model with combination of nF and nL yielding the lowest RMSE was then applied to the entire calibration set. Again, the top nF features were extracted and used to train the calibration set. The resulting model was applied to the testing set to obtain the predicted circadian phase. These predictions were used to assess model performance (R2 based on circular data (Laing et al., 2017) and absolute error) to plot predicted over actual circadian phase and to compute the predicted melatonin midpoints per participant.
A final PLSR model, based on the nF (n = 200) and nL (n = 5), that yielded the lowest RMSE in the highest number of calibration sets, was applied to the entire dataset. In addition, the list of genes corresponding to the top 200 features was compared to the list of 80 unique genes identified by Laing et al (2017) as most predictive for circadian melatonin phase. To assess the statistical significance of the overlap between the 2 lists, a Fisher’s exact test was applied using a contingency table based on the number of overlapping predictive genes, the number of unique genes in each list, and the number of genes (n = 9,656) expressed above the intensity threshold in our study that were also present on the microarray platform used by Laing et al (2017).
In addition, to assess whether the ability to predict central circadian phase from peripheral transcriptomic data was affected by the acute phase shift caused by the exposure to bright light, we determined the effect of Group (Control vs Bright Light) and Condition (Baseline vs Night shift condition) on the absolute prediction error using rank-based two-way ANOVA with R package Rfit v0.23.0 (Kloke and McKean, 2012). Lastly, Model 1 was applied to the most predictive genes identified by the final PLSR model on each group and condition separately to calculate the phase shifts of these genes during the simulated night shift condition as compared with the baseline.
Gene Ontology Analysis
Gene ontology analysis was performed with the R package topGO v2.26.0 (Alexa and Fahnenfuhrer, 2016) using the algorithm elim, a minimum node size of 10, and the genes that were expressed above the intensity threshold as the background gene list. Following the guidelines provided by the authors of the topGO package, P values derived from the gene ontology analysis were not corrected for multiple testing (Alexa and Rahnenführer, 2018).
Results
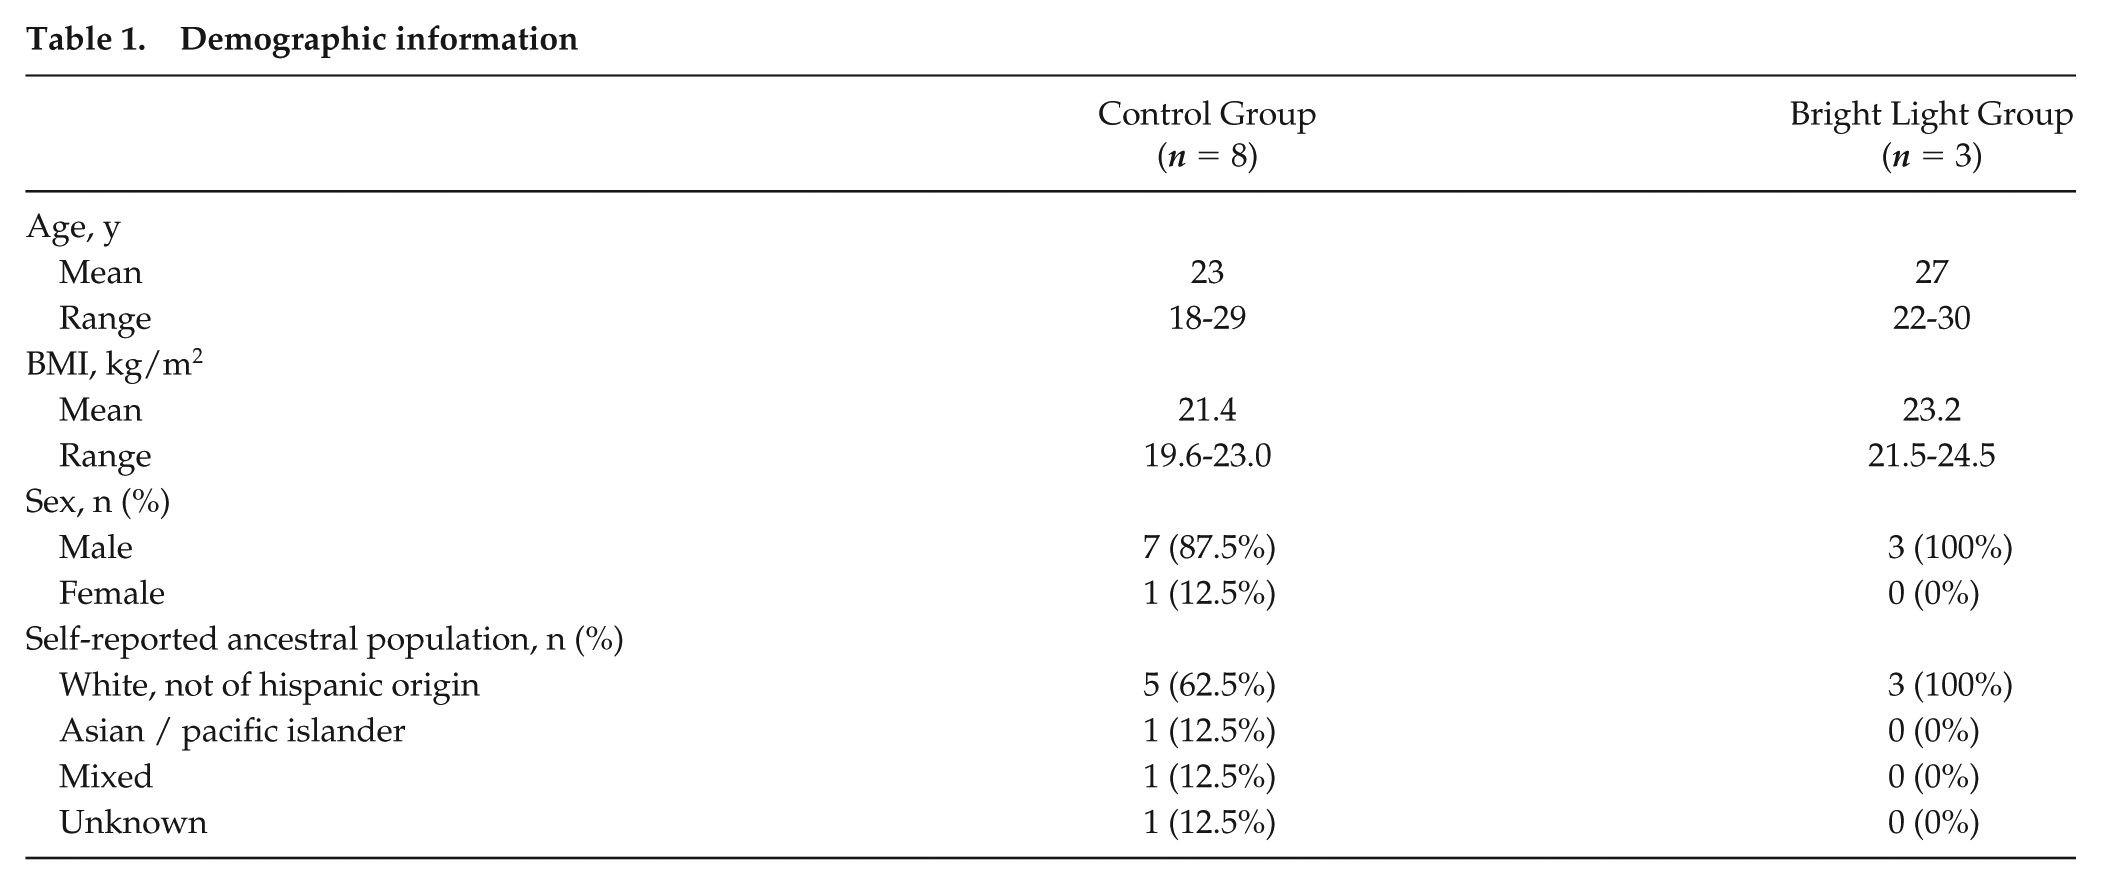
Demographic information is shown in Table 1. The age and body mass index (BMI) of the 3 participants in the bright light group did not differ significantly from the 8 participants in the control group (P = 0.11 and P = 0.08, respectively; t-tests). In addition, principal component analysis on the transcriptomic data collected at baseline revealed no significant differences in the first 3 principal components between the 2 groups (Supplemental Fig. S1), suggesting that the transcriptomic data from bright light participants and control participants did not differ at baseline.
Demographic information
Effect of Bright Light Exposure on Rhythmic Genes at the Individual Level
Using mixed-effects cosinor analysis on the combined baseline data of the 11 participants, we identified 448 probe sets (corresponding to 446 unique genes) that displayed a significant 24-h rhythm (FDR < 0.05). The set of rhythmic genes included circadian clock-related genes (e.g., NR1D1, NR1D2, PER1, PER3, NFIL3), genes coding for heat shock proteins (e.g., HSP90AA1, HSPA1A, HSPA1B, HSPA8, HSPH1), glucocorticoid-responsive genes (e.g., CRISPLD2, TSC22D3, KLF9, DDIT4), as well as immune response-related genes (e.g., KLRC2, SH2D1B, KIR2DS5, IRAK3, CD3D, NCR1, CD79A, HLA-DMB, IL18RAP, INPP5D, CD28, KLRF1, KLRD1). Of note, a heatmap confirmed that the expression of these genes was comparable between the 2 groups at baseline (Supplemental Fig. S2).
We next obtained estimates of the phases and amplitudes of the 448 probe sets per individual time series per participant at baseline and during the night shift condition using cosinor analysis, and calculated the phase shifts and changes in amplitude during the night shift condition as compared with the baseline. Rayleigh tests revealed that the phase shifts of these 448 probe sets were non-uniformly distributed around the 24-h range for each of the participants (P < 0.0001), and ranged from a 6.2- to 11.8-h delay in the bright light group (circular group mean: 9.3-h delay) and from a 1.1-h advance to a 3.5-h delay in the control group (circular group mean: 1.3-h delay) (Figure 2A). Indeed, a significant effect of group was found on phase shift (F[1,9]=29.4, P < 0.001; circular ANOVA). The difference in the phase shifts between the groups was observed independent of the p-value cut-off that was used to assess rhythmicity of the genes (Supplemental Fig. S3A). The effect of bright light exposure on the change in the amplitude of these genes during the night shift protocol compared with the baseline was not consistent among participants (Figure 2B) and no significant effect of group was found on the change in amplitude (t[9] = −0.52, P = 0.61, t-test). Together, these findings suggest that, among the genes identified as rhythmic during baseline conditions, bright light exposure in combination with a shift in sleep/wake and feeding cycles induced an overall phase shift in rhythmic gene expression levels that was significantly larger than the phase shift induced by shifted behavioral cycles alone. However, bright light exposure did not affect the overall amplitude of rhythmic genes on the fourth day of this protocol as compared with the control group.
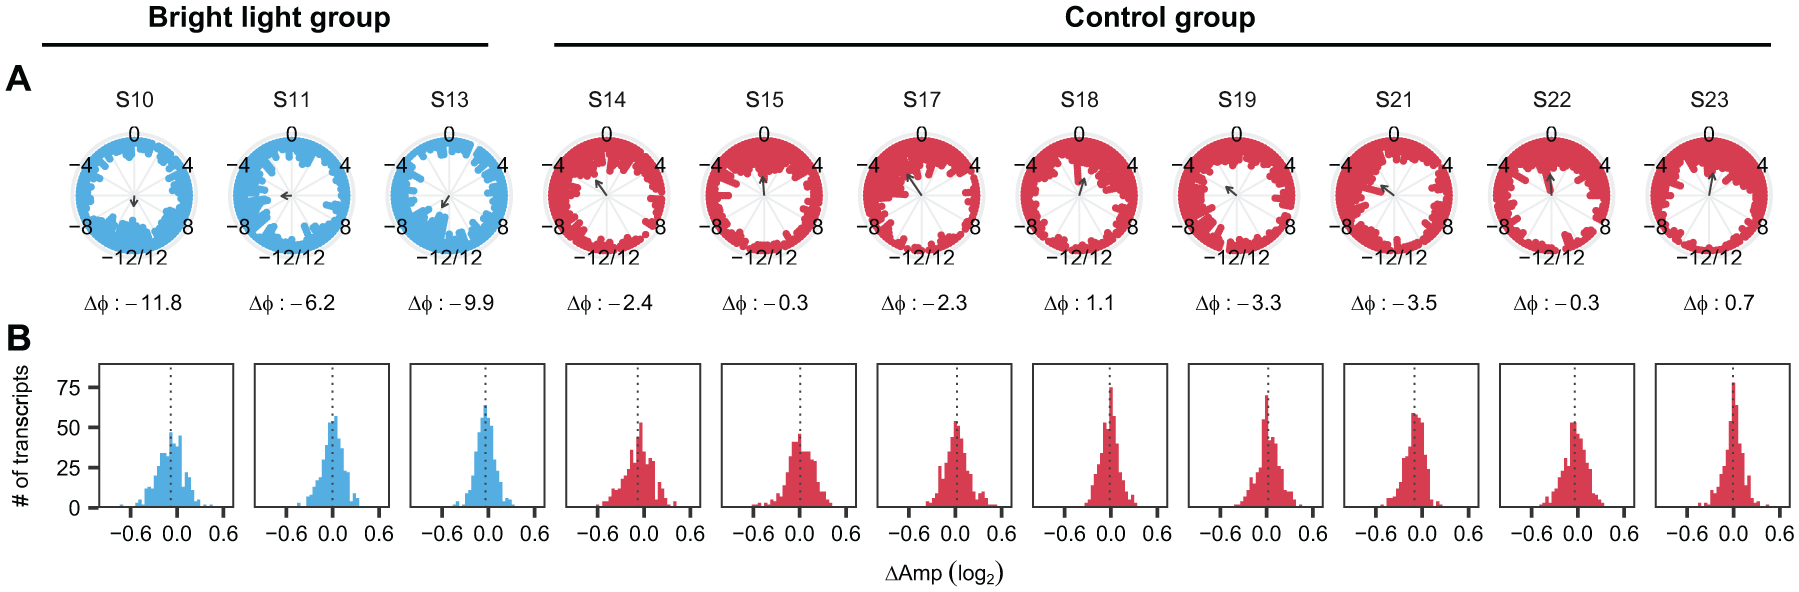
Effect of bright light exposure on the phases and amplitudes of rhythmic genes per participant. (A) Phase shifts (Δφ) and (B) changes in amplitude (ΔAmp) per participant during the night shift protocol of 448 genes identified as rhythmic at baseline using mixed-effects cosinor analysis among the 11 participants. The labels on the top of the panels represent the participant identifiers. The direction of the arrows and the numbers below the panels in (A) indicate the average phase shift per participant (circular mean). Arrow length represents the resultant vector length (all ρ > 0.187; all P < 0.0001; Rayleigh tests). The dotted lines in (B) show the mean change in amplitude for each participant.
Effect of Bright Light Exposure on Rhythmic Genes at the Group Level
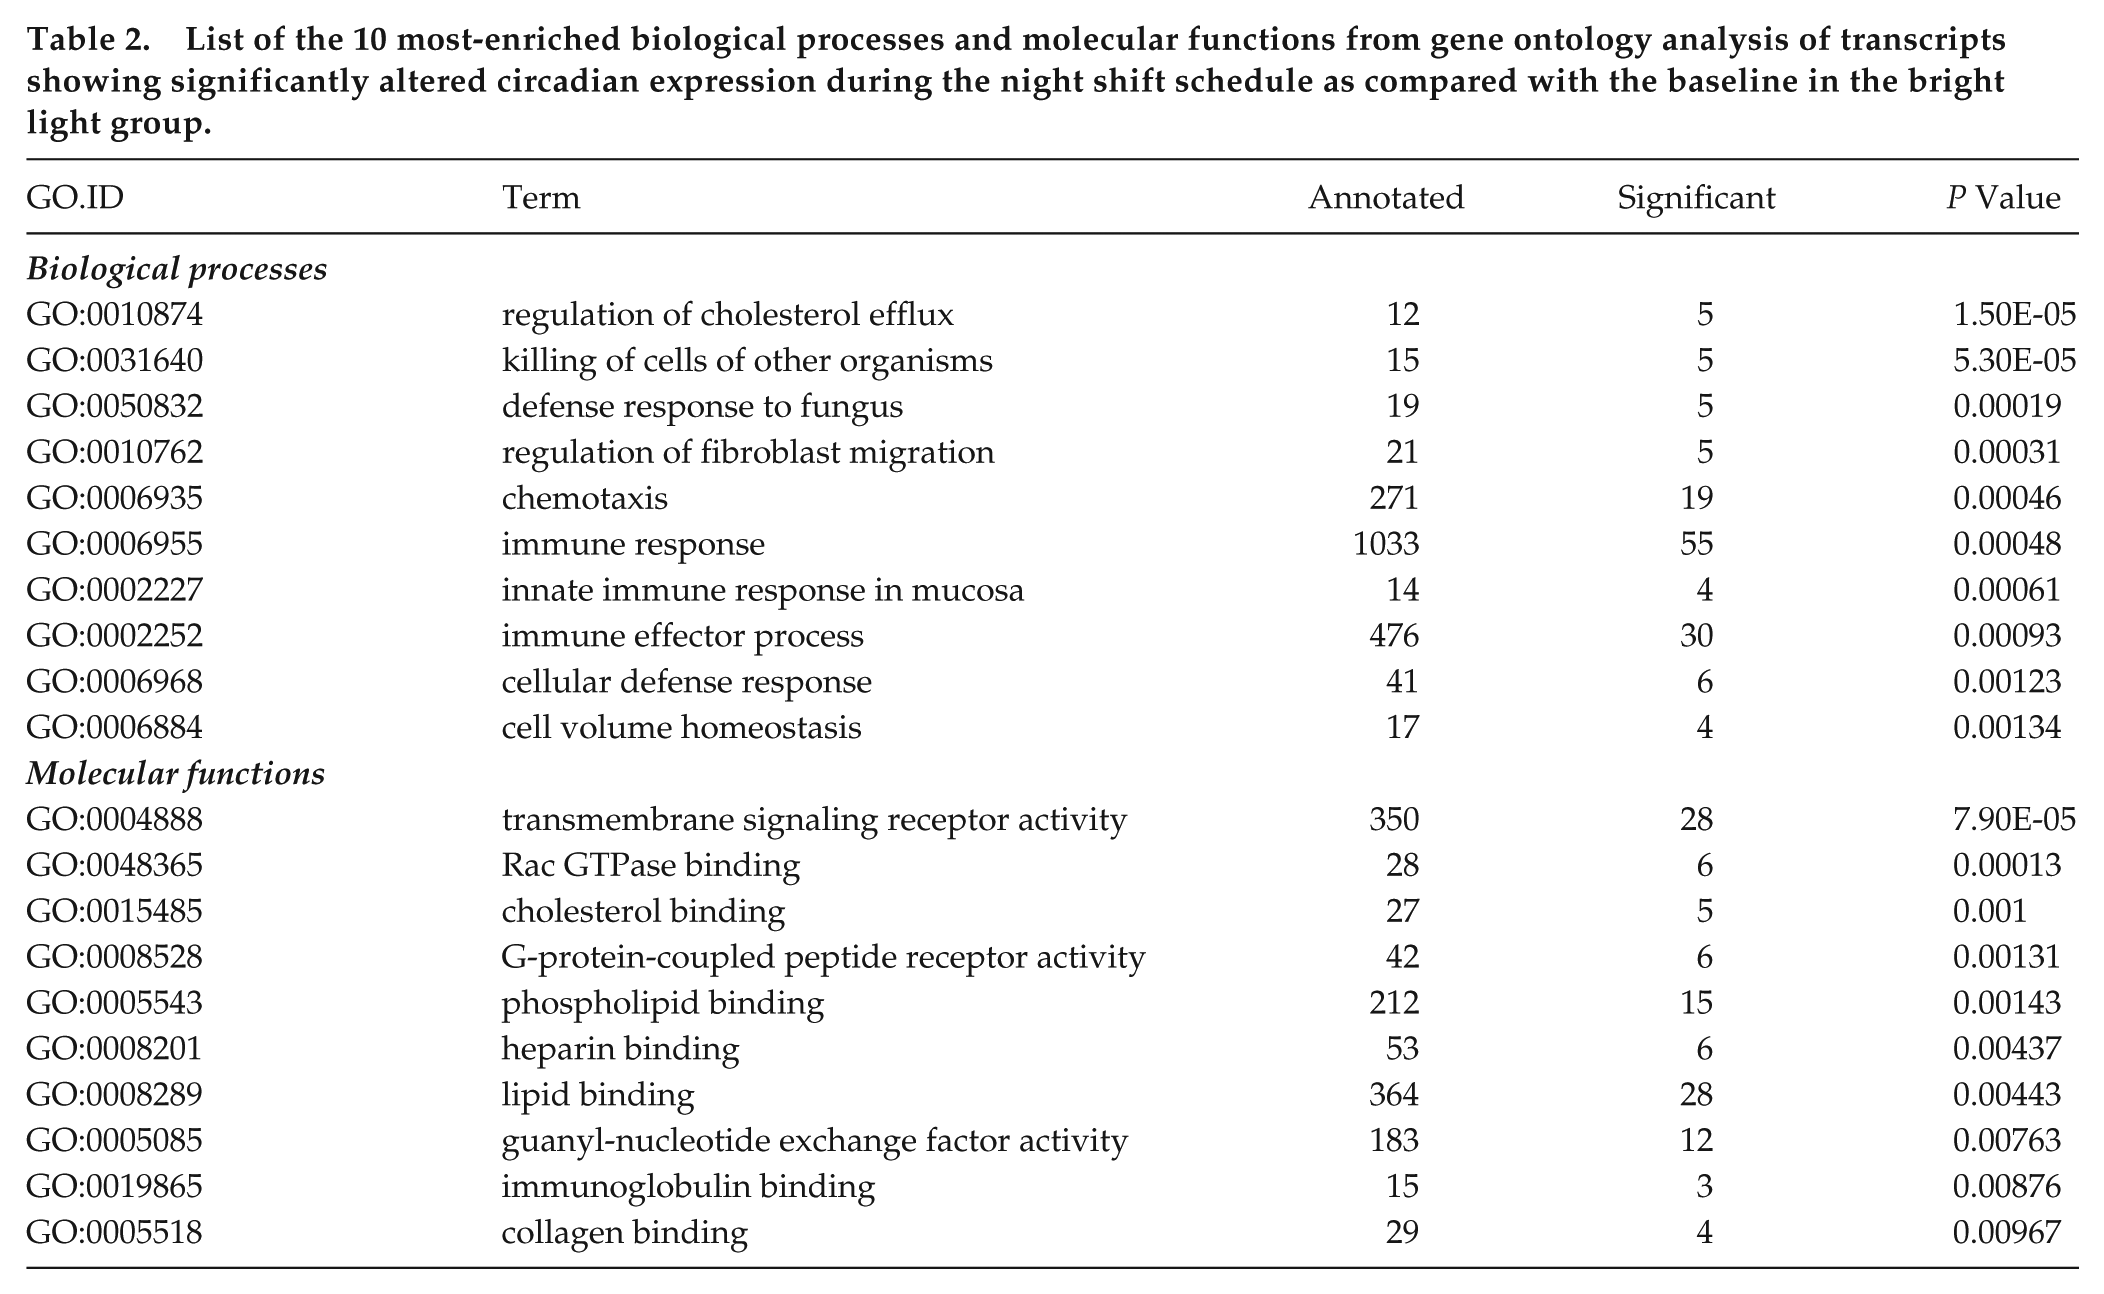
To verify our findings, we used a second, independent approach to assess the effect of bright light exposure on transcriptome-wide gene expression levels. Using a nested mixed-effects modeling approach on all data from the bright light group, we found that, among a list of 492 probe sets (484 unique genes) that showed a 24-h rhythm both at baseline and during the night shift condition (P < 0.1 in both conditions), 67% (n = 330 probe sets) had altered circadian expression (FDR < 0.05) during the night shift condition as compared with the baseline in the bright light group. On average, the phases of the gene expression rhythms were delayed by 7.8 (1.3) h (circular mean [SD]) during the night shift condition (Figure 3A). The phase-shifting effect of bright light is not affected by the P value thresholds used to assess rhythmicity (Supplemental Fig. S3B). There was no significant overall change in amplitude among these 492 genes (mean [SD]: −0.0055 [0.077], P = 0.063, one-sample Wilcoxon test; Figure 3B). Gene ontology analysis for genes with significantly altered circadian expression revealed enrichment of mainly immune-related processes. In addition, various biological processes and molecular functions related to lipid metabolism were enriched among these genes, including regulation of cholesterol efflux, cholesterol binding, and (phospho-)lipid binding (Table 2).
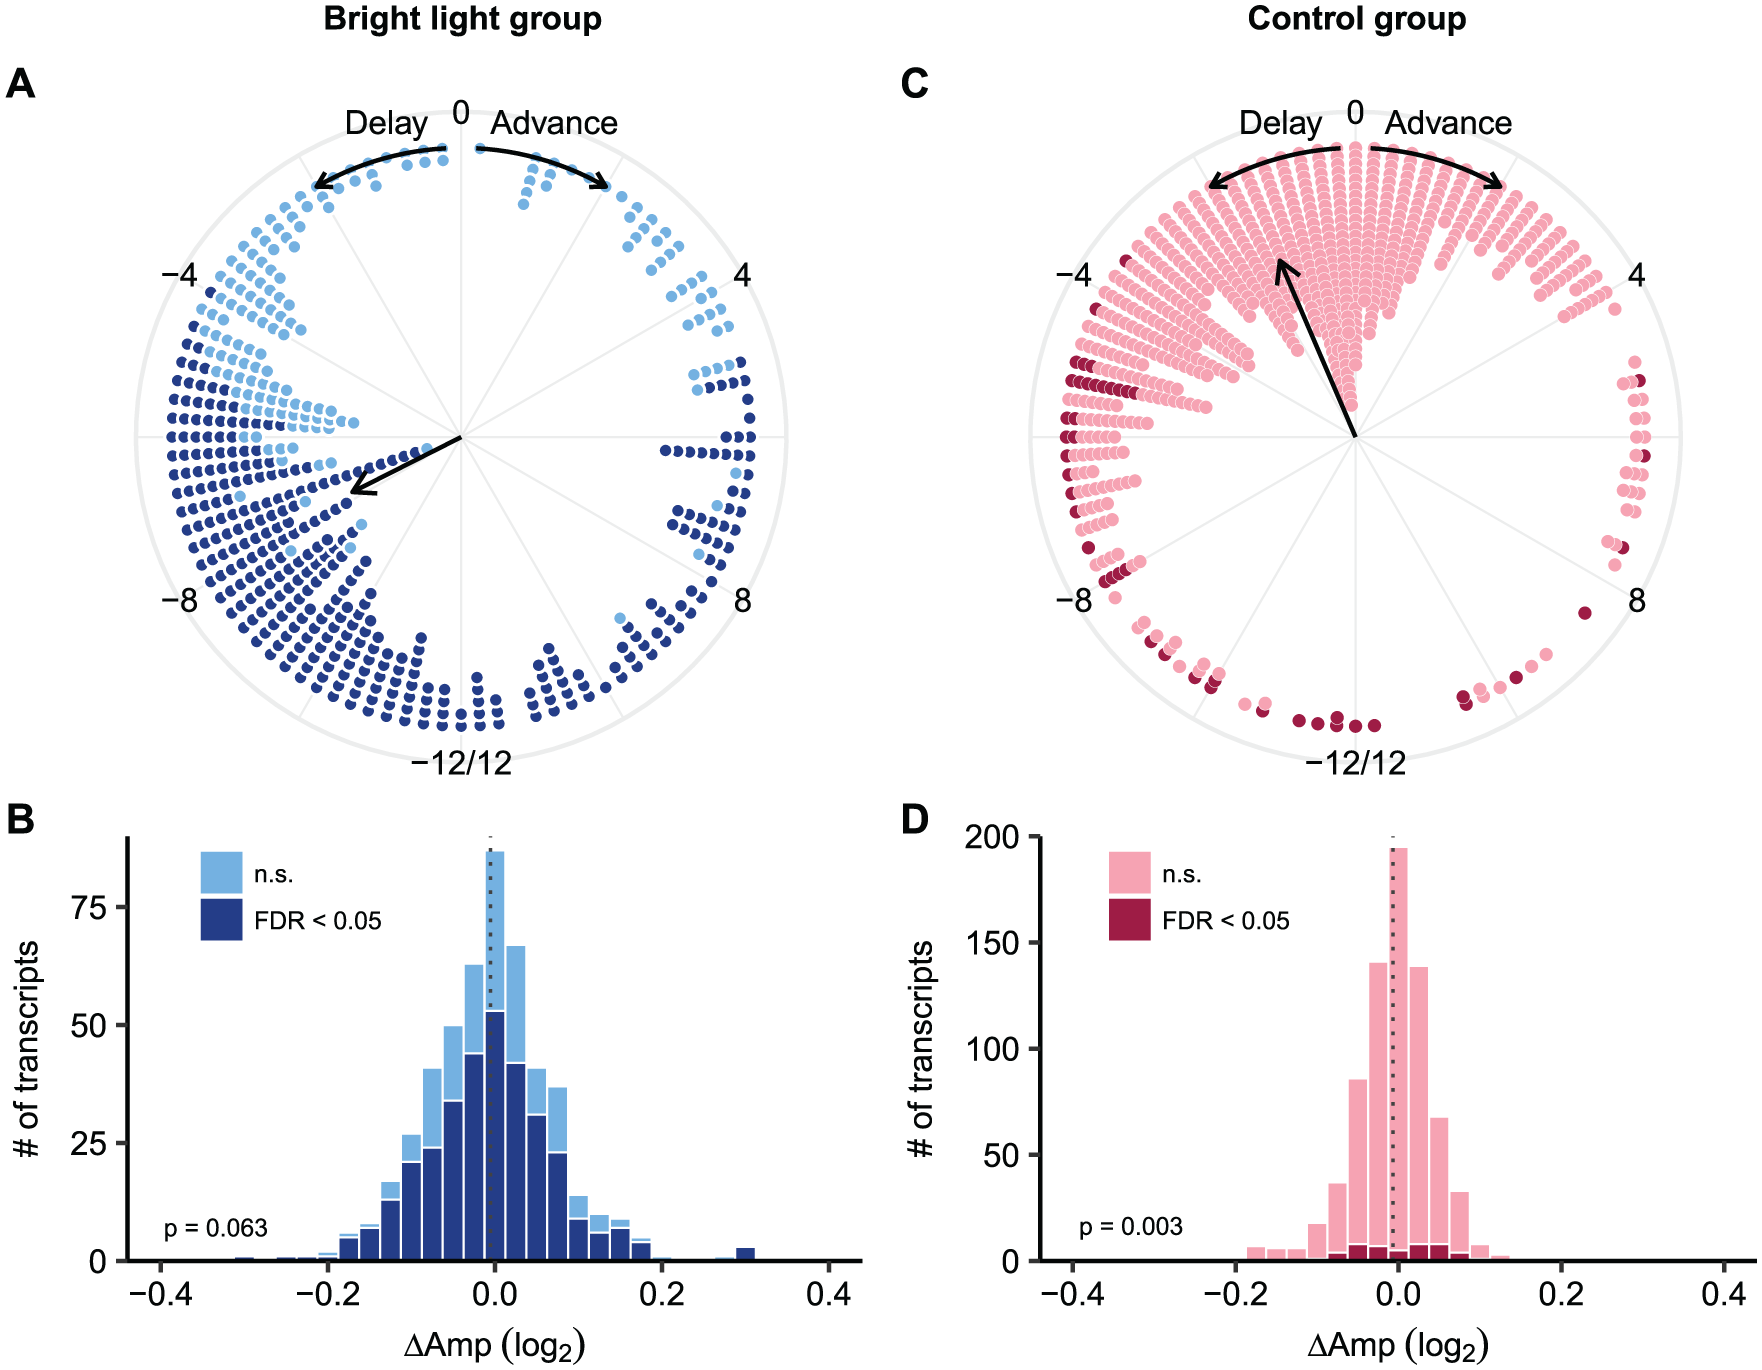
Phase shifts and changes in amplitude of rhythmic genes in the bright light group (left) and the control group (right) during the simulated night shift condition as compared with the baseline. (A) Phase shifts and (B) changes in amplitude of 492 genes that showed a 24-h rhythm at baseline and during the night shift condition in the 3 participants in the bright light group. (C) Phase shifts and (D) changes in amplitude of the 751 genes that showed a 24-h rhythm at baseline and during the night shift condition in the 8 participants in the control group. Dark colors: genes that showed significantly altered circadian expression; light colors: genes whose circadian expression was not altered. The direction of the arrows in (A) and (C) reflects the average phase shift (circular mean) of all genes; the dashed lines in (B) and (D) reflect the mean change in amplitude; P values in (B) and (D) reflect the result from a Wilcoxon test on the change in amplitude.
List of the 10 most-enriched biological processes and molecular functions from gene ontology analysis of transcripts showing significantly altered circadian expression during the night shift schedule as compared with the baseline in the bright light group.
In the control group, 751 probe sets (744 unique genes) were identified as rhythmic at baseline and during the night shift condition (P < 0.1 in both conditions). Among these, 6.3% (n = 47 probe sets) showed altered circadian expression in the night shift condition as compared with the baseline. The average phase delay was 1.6 (0.9) h (circular mean [SD]) (Figure 3C). Amplitude was significantly reduced among these 751 probe sets (P = 0.003, one-sample Wilcoxon test; Figure 3D); although the magnitude of the reduction was limited and comparable with that of the bright light group (mean [SD], −0.0067 [0.049]). The lists of genes used for these analyses as well as whether they showed altered circadian expression in the bright light or control group are provided in Supplemental Data 1. Of the probe sets used in these analyses, 88 probe sets overlapped between the bright light and control groups (Supplemental Data 1).
Next, to verify whether our findings can be specifically attributed to the effect of bright light exposure, we determined the proportion of rhythmic genes that showed altered circadian expression in the night shift condition compared with baseline in all possible combinations for the 3 participants in the control group (n = 56 combinations) using the same criteria as that used for the 3 bright light participants. We found that, on average, 19% (range, 0% to 54%) of rhythmic genes in those combinations of any 3 control participants showed altered circadian expression (Supplemental Fig. S4A), suggesting that the higher proportion of probe sets showing altered circadian expression in the bright light group (67%) is due to the exposure to bright light rather than the result of the small number of participants per se. In addition, the phases of the rhythmic genes in these 56 combinations were delayed on average by 1.8 (1.9) h (range, 6.4 h delay to 2.7 h advance), similar to the 1.6-h delay observed in the group of 8 control participants (Supplemental Fig. S4B). Relative to the phase shifts observed in the control subgroups, the overall phase delay of 7.8 h observed in the bright light participants is considered an outlier (i.e., more than 1.5 interquartile ranges below the first quartile or above the third quartile).
Relationship between Central Circadian Phase and the PBMC Transcriptome after a Light-induced Phase Shift
The melatonin midpoint (Figure 4A), which can be used as a phase marker of the central circadian clock, was significantly more delayed in the bright light group than in the control group (7.6 [0.1] h vs. 0.4 [0.3] h, P = 0.014, Kruskal-Wallis rank sum test). As our results indicate that circadian rhythms in the PBMC transcriptome were also, on average, more delayed in the bright light group compared with the control group, we used PLSR to confirm the alignment of the PBMC circadian transcriptome with the phase of the central clock (Laing et al., 2017).
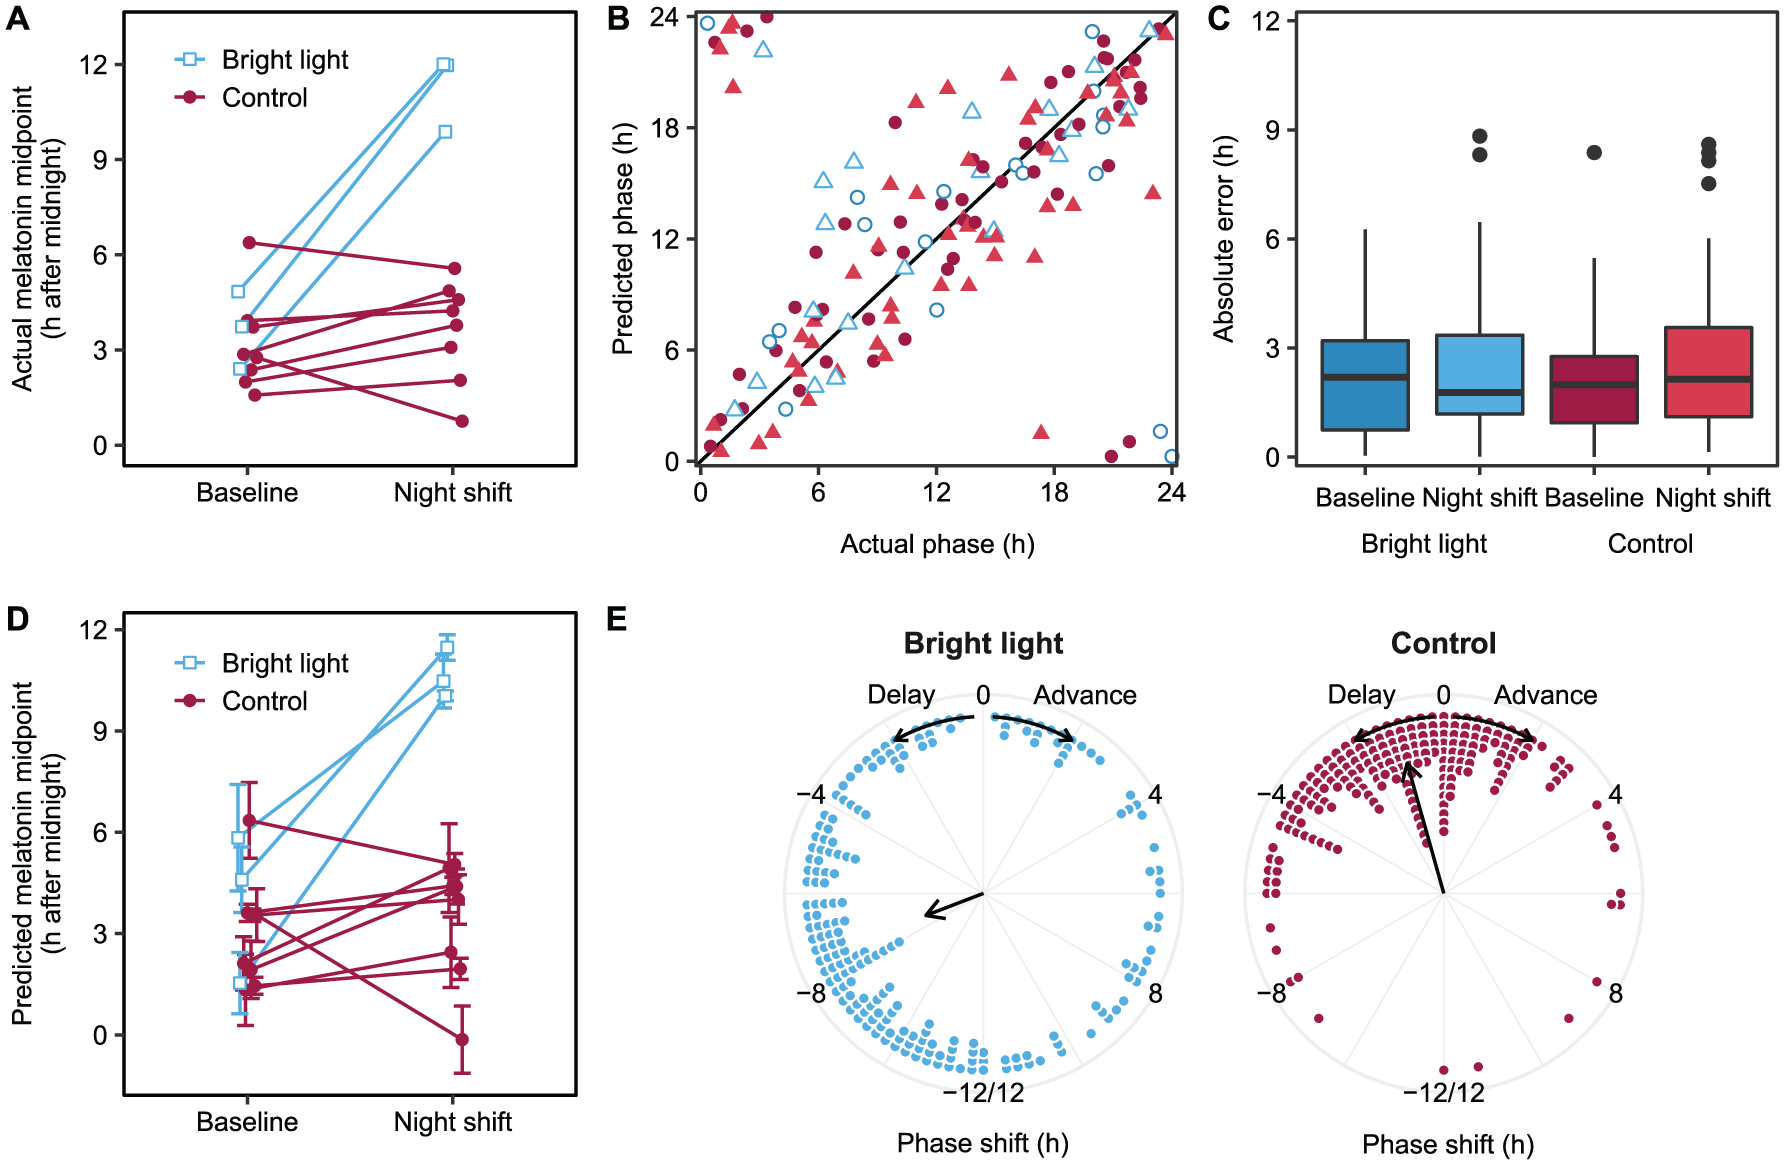
Relationship between central circadian phase and the PBMC transcriptome after a light-induced phase shift as identified by PLSR. (A) Actual melatonin midpoint at baseline and in the night shift condition per participant. (B) Predicted phase vs. actual phase for each transcriptomic sample relative to the melatonin midpoint. The solid line represents the line of unity. Filled symbols, control group; open symbols, bright light group; circles, baseline; triangles, night shift condition. (C) Absolute prediction error per group and condition obtained through leave-one-participant-out cross-validation. (D) Predicted melatonin midpoint returned by PLSR. Data are presented as the mean predicted midpoint ± SEM of all transcriptomic samples for each participant at baseline and during the night shift condition. (E) Phase shift of the 200 genes that were most predictive of circadian phase as identified by PLSR during the night shift condition compared with the baseline in the bright light (left) and control (right) groups.
Using nested leave-one-participant-out cross-validation, the PLSR model predicted the actual circadian phase of each sample with a median absolute error of 2.1 h and an r2 of 0.83 (Figure 4B). Importantly, there was no significant effect of group (F[1,137] = 0.014, P = 0.905), condition (F[1,137] = 0.47, P = 0.493), or their interaction (F[1,137] = 0.21, P = 0.94) on the absolute prediction error (Figure 4C). This finding suggests that an acute shift of the central clock can be predicted based on transcriptomic data from one blood sample using PLSR. Indeed, the phase shift of the melatonin midpoint observed in the bright light participants during the night shift condition (Figure 4A) is reflected in the predicted melatonin midpoints derived from PLSR based on single transcriptomic samples, with a significantly larger phase shift in the bright light participants compared with the control group (P = 0.014, Kruskal-Wallis rank sum test; Figure 4D).
The 200 probe sets (199 unique genes) that were most predictive of central circadian phase as identified by the final PLSR model are shown in Supplemental Data 2. The phases of these genes were delayed on average by 7.40 (1.45) h (circular mean [SD]) in the bright light group compared with 1.05 (0.73) h in the control group (Figure 4E), further corroborating the phase-shifting effect of bright light exposure on the circadian transcriptome during the simulated night shift protocol. Gene ontology analysis revealed that these genes were enriched for biological processes such as response to fatty acids, negative regulation of intracellular steroid hormone receptor signaling pathway, and regulation of circadian rhythms (Table 3). Molecular functions enriched among these 200 genes included E-box binding, oxidoreductase activity, and cytokine binding (Table 3). Of note, a significant overlap was found with the 80 genes that were previously identified by Laing et al. (2017) as most predictive of circadian phase using a single blood sample (P < 0.0001, Fisher’s exact test), with 13 genes shared between the 2 lists (FKBP5, SMAP2, DDIT4, NR1D2, ZBTB16, HSPH1, CCND3, AVIL, PIK3IP1, PER1, LDLR, CLIC3, and IL13RA1).
List of the 10 most-enriched biological processes and molecular functions from gene ontology analysis of the 200 transcripts most predictive of central circadian phase as identified by PLSR.
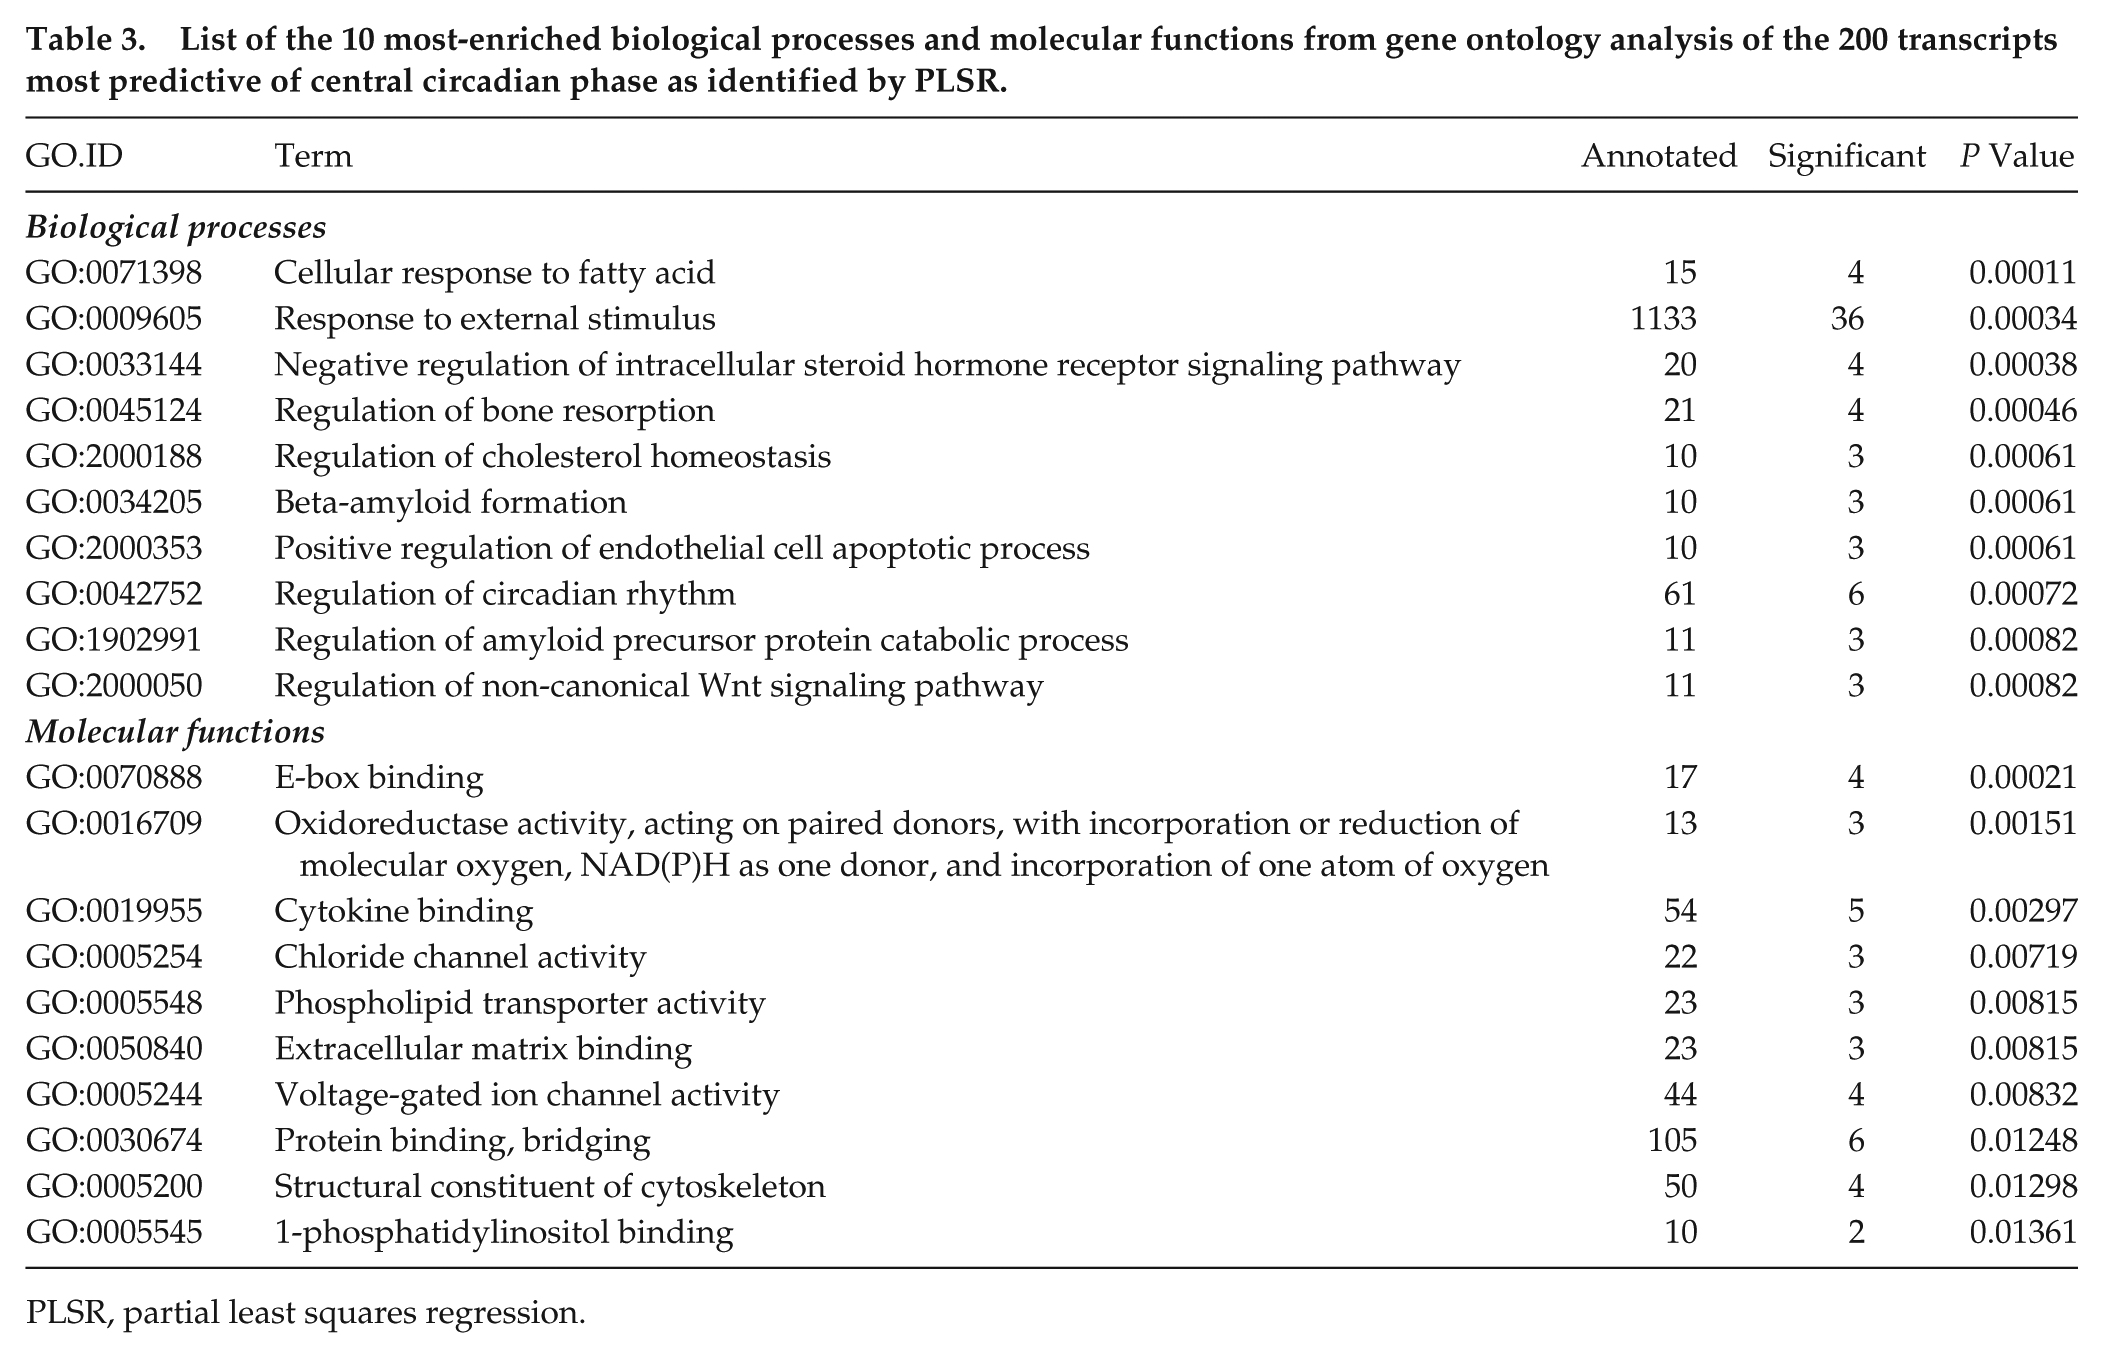
PLSR, partial least squares regression.
Discussion
In this study, we investigated the phase-shifting effect of bright light on 24-h rhythms in gene expression levels in PBMCs during a 4-day simulated night shift protocol. In addition to the anticipated (and previously published in Cuesta et al., 2017) phase shift of the central clock, as measured by melatonin levels, we found that bright light exposure induces an overall phase shift in rhythmic gene expression levels in the peripheral transcriptome. Furthermore, using PLSR, we found that the phase-shifting effect of bright light on the transcriptome in PBMCs was predictive of the phase of the central clock, which confirms a similar magnitude of the phase-shifting effect of bright light on peripheral rhythms as on the central clock. Together, these results show a potent effect of bright light on peripheral circadian gene expression.
The question of whether, and to what extent, circadian rhythms in the peripheral transcriptome entrain to shifted behavioral cycles in the presence and absence of bright light exposure is largely unexplored. We used 2 independent approaches to evaluate phase shifts in rhythmic gene expression levels across the PBMC transcriptome. Firstly, we assessed phase shifts at the individual level in a list of genes with significantly rhythmic expression at baseline. On average, the expression of genes in the participants who were exposed to bright light during the simulated night shift protocol displayed significantly larger phase delays compared with participants in the control group (9.3 h vs 1.3 h). Similarly, at the group level, the average phase delay of genes that were consistently rhythmic at baseline and during the night shift condition in the bright light group was 7.8 h, compared with 1.6 h in the control group. The analysis at the individual level allowed us to determine the overall phase shifts per participant, which is an advantage because it demonstrates that the phase shift in each of the bright light participants is consistently larger than the overall phase shifts observed in each of the control participants. As for the analysis at the group level, it allowed us to statistically determine whether genes had altered circadian expression and to perform gene ontology analysis on those genes affected by bright light exposure. Therefore, these 2 approaches are complementary and reveal coherent results at both the individual- and group-level regarding the magnitude of the phase shift induced by bright light exposure.
Whereas we and others have previously found a phase-shifting effect of light exposure on peripheral clock gene expression in humans (Ackermann et al., 2009; Cuesta et al., 2017), we used the entire transcriptome rather than specific genes in the present study to assess the effect of bright light exposure. This is highly relevant as it provides a more comprehensive overview of the molecular regulation of the circadian timing system and its downstream effects. For example, gene ontology analysis implicates various biological processes and molecular functions among the genes whose expression was most predictive of the phase of the central clock, such as regulation of circadian rhythm, response to external stimulus, and E-box binding. However, less-obvious biological processes and molecular functions were also enriched among these genes, including the regulation of cholesterol homeostasis, the response to fatty acids, and phospholipid transporter activity. Likewise, genes with significantly altered light-induced circadian expression during the simulated night shift condition were enriched for immune-related processes—as expected because of the use of PBMCs—but also for biological processes and molecular functions related to lipid metabolism. These findings may indicate that rhythmicity in lipid-related processes and immune function may be influenced by the phase-shifting effect of bright light. Because the expression of a few genes shifted as a result of the simulated night shift condition per se (i.e., in the control group), this suggests that these processes might be controlled by the endogenous circadian system, which is a hypothesis that warrants further investigation. In general, our findings provide a basis for future research into the physiological mechanisms underlying disturbances of the circadian system.
In this study, we investigated 24-h gene expression profiles in PBMCs, a subset of white blood cells that can be readily obtained from blood samples and that have been extensively used to evaluate transcriptomic responses to a range of interventions, including exercise, diet, and pharmacological treatments (Bouwens et al., 2007; Burczynski and Dorner, 2006; Carlson et al., 2011; de Mello et al., 2012). Research in animals has shown that peripheral clocks adjust at different rates after a shift in the LD cycle depending on the type of tissue (Yamazaki et al., 2000). The tissue-specific response to light exposure may be related to the different pathways (e.g., humoral and/or neuronal) involved in the entrainment of various tissues through either SCN or non-SCN pathways (Cailotto et al., 2009; Husse et al., 2014; Husse et al., 2015; Kiessling et al., 2014). Therefore, how bright light exposure affects gene expression profiles in other peripheral tissues as well as the underlying mechanisms remain to be elucidated.
We used PLSR as a tool to investigate the hypothesis that bright light induces a phase shift in the peripheral transcriptome at a similar magnitude as the phase shift of the central clock marker melatonin. PLSR has been previously shown to outperform other algorithms for circadian phase prediction (Hughey, 2017; Hughey et al., 2016; Kasukawa et al., 2012; Laing et al., 2017; Minami et al., 2009; Ueda et al., 2004) across most performance metrics (Laing et al., 2017), which prompted us to apply this method to the data collected in this study as an independent way to investigate the phase-shifting effect of bright light exposure on the PBMC transcriptome. Indeed, we found evidence for a transcriptomic signature of the bright-light induced phase shifts of the central clock in single PBMC samples that were collected on the fourth day of the simulated night shift protocol. Importantly, the absolute error of the predictions was not affected by bright light exposure or the circadian misalignment induced by the simulated night shift protocol. In addition, the phases of the genes identified by PLSR as being the most predictive of the central circadian phase were delayed by similar magnitudes during the night shift condition, as was observed in the individual- and group-level analyses. These results suggest that the phase of the central clock can be detected in the peripheral transcriptome even after a recent shift in the central clock and thereby complements previous research into the prediction of central phase from gene expression data. However, because our sample size was small and the study participants were homogeneous in terms of demographic variables, the list of predictive genes identified here may be of limited use for future clinical applications of circadian phase prediction. Therefore, future research is required to study the validity and generalizability of PLSR as a method to predict circadian phase in more diverse study populations, such as among women, older persons, ancestral populations, and non-healthy persons. In addition, it remains to be investigated to what extent a smaller phase shift of the central clock can be detected using this method and whether this technique can be used to track the circadian system on a daily basis. Nevertheless, our results show that the predictive performance of the PLSR model is not affected by any of the experimental conditions, and thereby confirm that, after only 3 days of bright light exposure, the peripheral circadian transcriptome of PBMCs has shifted to an extent comparable with the central circadian pacemaker.
The main limitation of the current study is the small number of participants in the bright light group (n = 3). Because of this, we used various approaches to verify our findings at the individual and group levels. These approaches consistently demonstrated that, in addition to a light-induced phase delay of the central circadian clock, photic resetting of gene expression rhythms occurs in the transcriptome of PBMCs. In addition, we used a sensitivity analysis to confirm our findings at the group level by assessing phase shifts in gene expression levels in all possible combinations of 3 participants in the control group (n = 56 combinations). This analysis indicated that the large overall phase shift observed in the bright light group during the night shift condition is a unique observation that stands out from the other subgroups of 3 participants that were kept in dim light conditions. Another limitation is the limited age range of our participants, who were between 18 and 30 years old, especially because older individuals may respond differently to the bright light intervention. For example, it was previously shown that older subjects have significantly reduced melatonin suppression following exposure to short wavelength light (Herljevic et al., 2005). Similarly, we were unable to study any sex differences in the response to bright light due to the inclusion of only one female participant. Marked differences exist in the regulation of the circadian timing system in men and women, including a shorter circadian period and a longer phase angle of entrainment in women (Kervezee et al., 2018b). Therefore, more research is required regarding the effect of age and sex on the phase-shifting effect of bright light exposure on both central and peripheral clocks.
In conclusion, our results indicate that bright light exposure exerts an overall phase-shifting effect on the circadian transcriptome in human PBMCs. This supports the use of bright light as an effective strategy to facilitate adaptation of not only the central clock, but also of peripheral circadian gene expression, to a shifted sleep/wake cycle, as occurs in shift work and jet lag.
Supplemental Material
DataS1_rev1 – Supplemental material for The Phase-Shifting Effect of Bright Light Exposure on Circadian Rhythmicity in the Human Transcriptome
Supplemental material, DataS1_rev1 for The Phase-Shifting Effect of Bright Light Exposure on Circadian Rhythmicity in the Human Transcriptome by Laura Kervezee, Marc Cuesta, Nicolas Cermakian and Diane B. Boivin in Journal of Biological Rhythms
Supplemental Material
DataS2_rev1 – Supplemental material for The Phase-Shifting Effect of Bright Light Exposure on Circadian Rhythmicity in the Human Transcriptome
Supplemental material, DataS2_rev1 for The Phase-Shifting Effect of Bright Light Exposure on Circadian Rhythmicity in the Human Transcriptome by Laura Kervezee, Marc Cuesta, Nicolas Cermakian and Diane B. Boivin in Journal of Biological Rhythms
Supplemental Material
SuppMat_rev2 – Supplemental material for The Phase-Shifting Effect of Bright Light Exposure on Circadian Rhythmicity in the Human Transcriptome
Supplemental material, SuppMat_rev2 for The Phase-Shifting Effect of Bright Light Exposure on Circadian Rhythmicity in the Human Transcriptome by Laura Kervezee, Marc Cuesta, Nicolas Cermakian and Diane B. Boivin in Journal of Biological Rhythms
Footnotes
Acknowledgements
We thank S. Rhéaume, MD, as well as A. Azzoug, RN, and M.R. Guertin, RN, for clinical supervision; C. Walker, PhD, for the melatonin assay; M. Gagnon and J. Gauthier for administrative support; all staff and students for data collection; and the research participants for their time commitment. The authors wish to acknowledge the contribution of the McGill University and Génome Québec Innovation Centre, Montréal, Canada for performing the microarray hybridization and related services. This work was supported by the Canadian Institutes of Health Research (grant numbers MOP-102724 and MOP-137052 to D.B.B. and N.C.). L.K. and M.C. received postdoctoral fellowships from the Fonds de Recherche du Québec–Santé.
Conflict of Interest Statement
D.B.B. provides conferences and legal expert advice on various shift work-related cases. The other authors declare that there is no conflict of interest.
Notes
References
Supplementary Material
Please find the following supplemental material available below.
For Open Access articles published under a Creative Commons License, all supplemental material carries the same license as the article it is associated with.
For non-Open Access articles published, all supplemental material carries a non-exclusive license, and permission requests for re-use of supplemental material or any part of supplemental material shall be sent directly to the copyright owner as specified in the copyright notice associated with the article.